Acc Risk: 0.9%
Long: 2x 138.00
Stop: 137.40 (60 pips)
Target 1: 139.96 (4h200, 196 pips, 3.2 RR)
Target 2: 140.47 (d50, 247 pips, 4.1 RR)
Update – Revising my targets – 29 Mar
Update – 4h200 Hit – 31 Mar
I’m really hot for the GBPJPY right now. Price is inside a bullish daily wedge (we’re at the narrow end) and we’ve got a quadruple divergence in play! I’ve traded this from the 4h timeframe but I’m really looking for a breakout of the daily wedge pattern and higher targets as we’ve been chopping around the 4h50 and 4h100 for a while.
Here’s the set up.
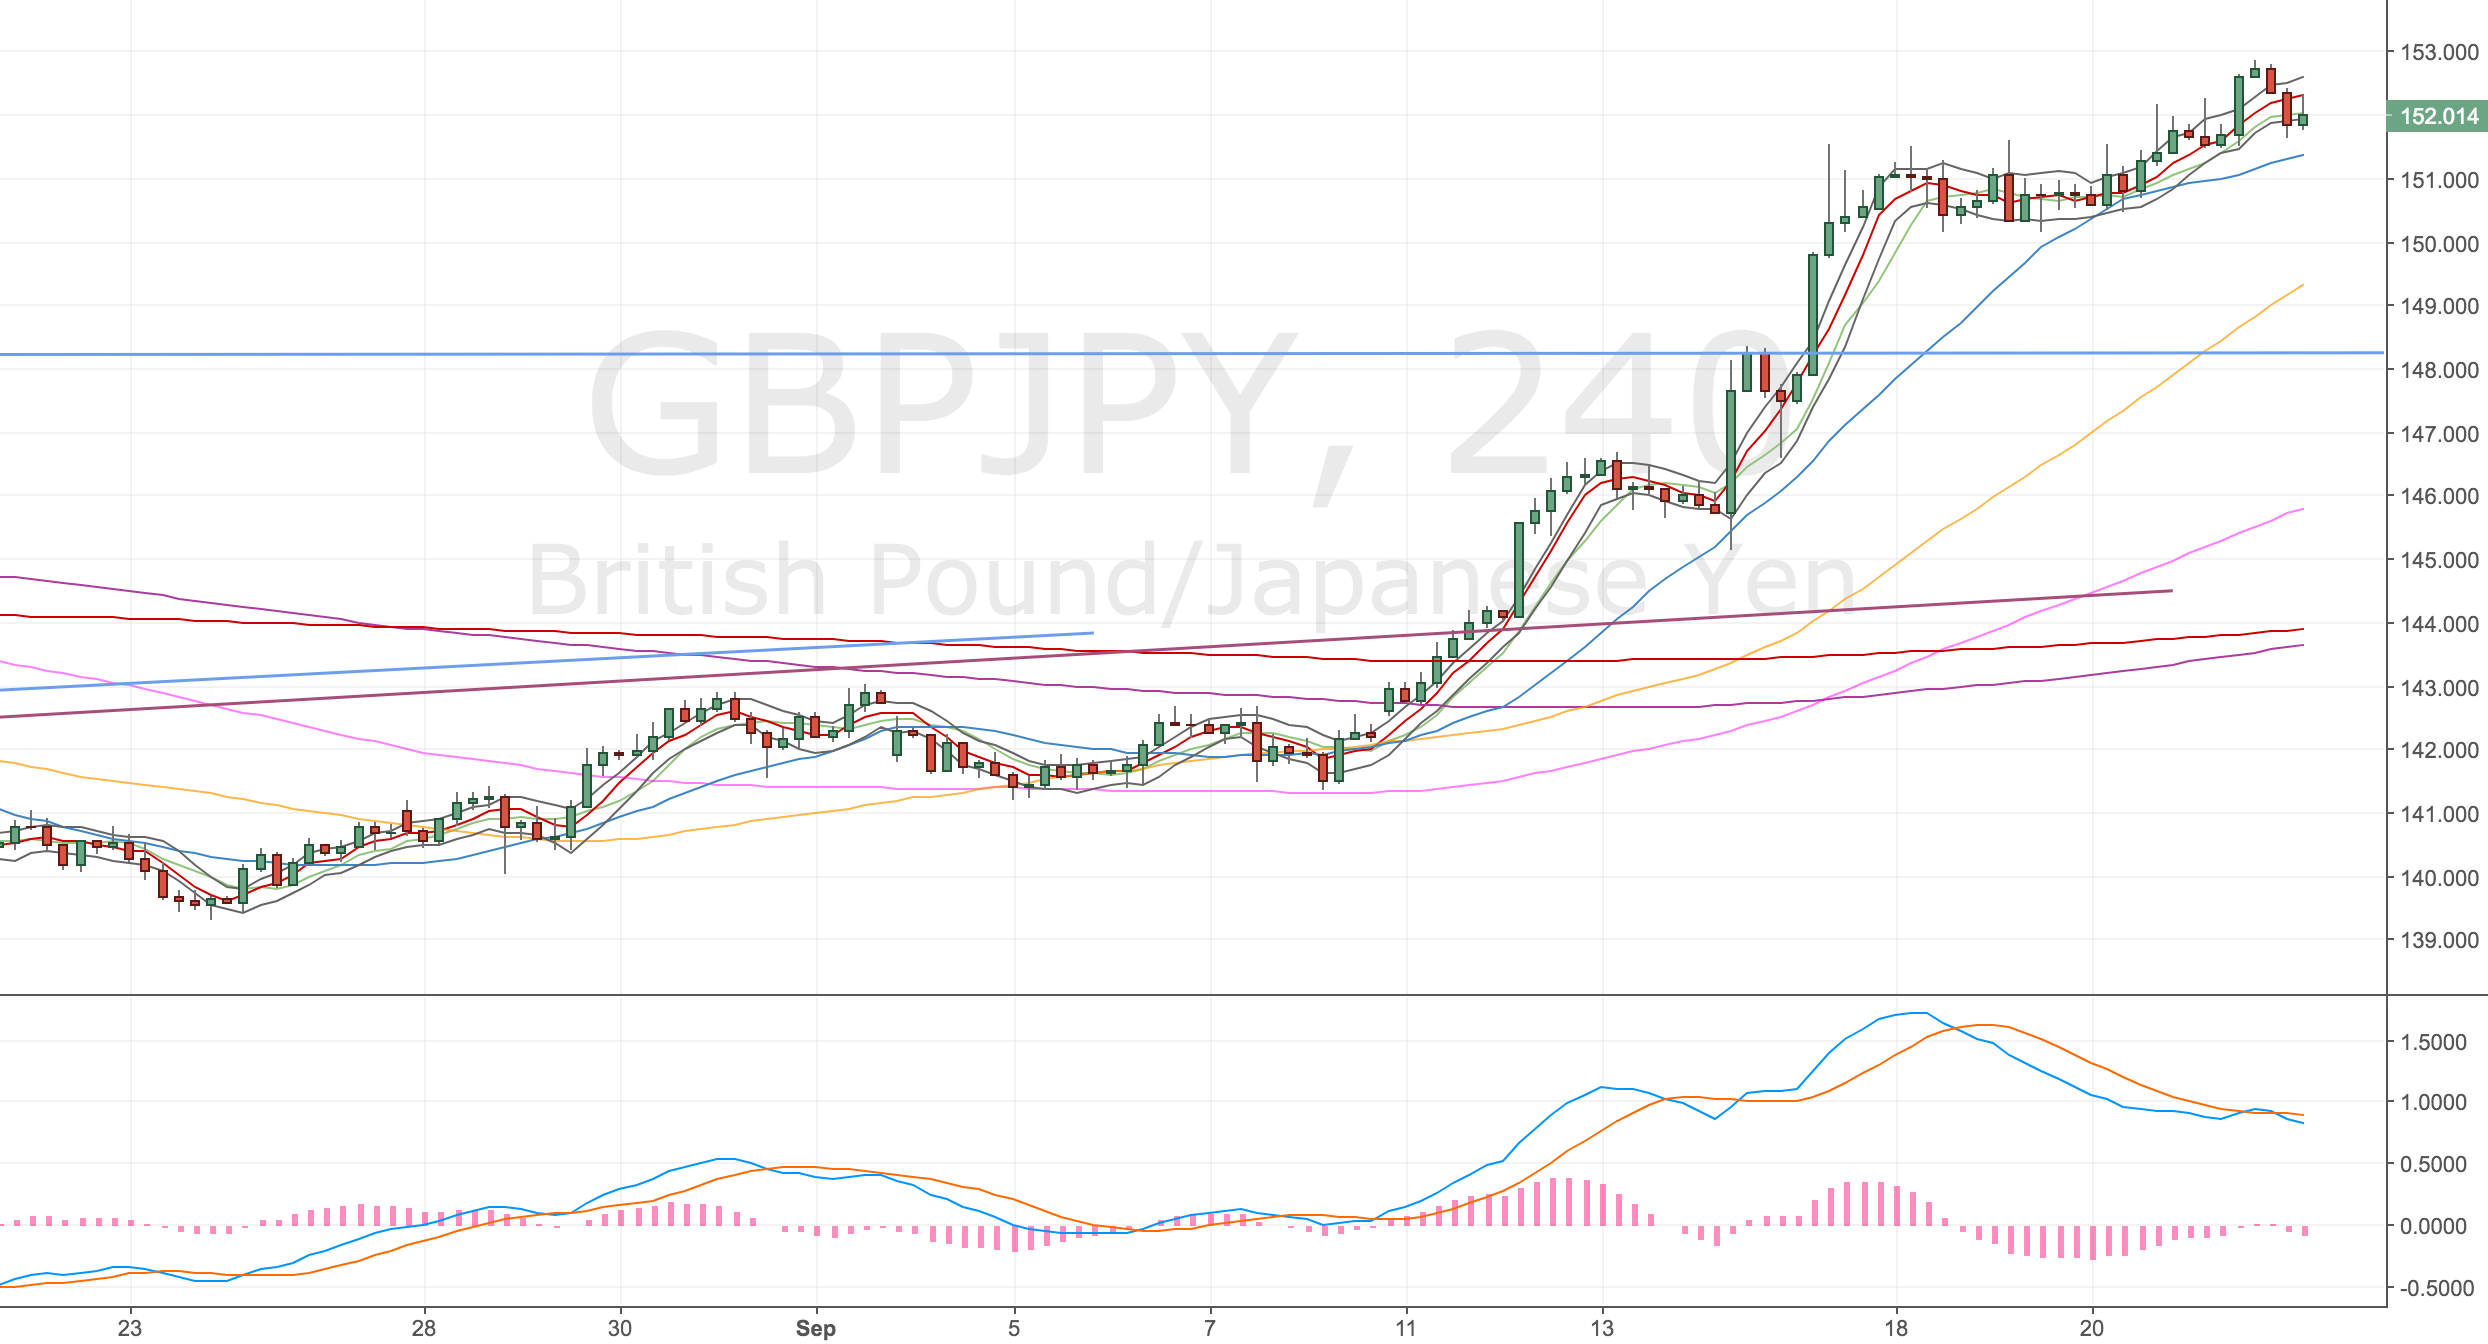
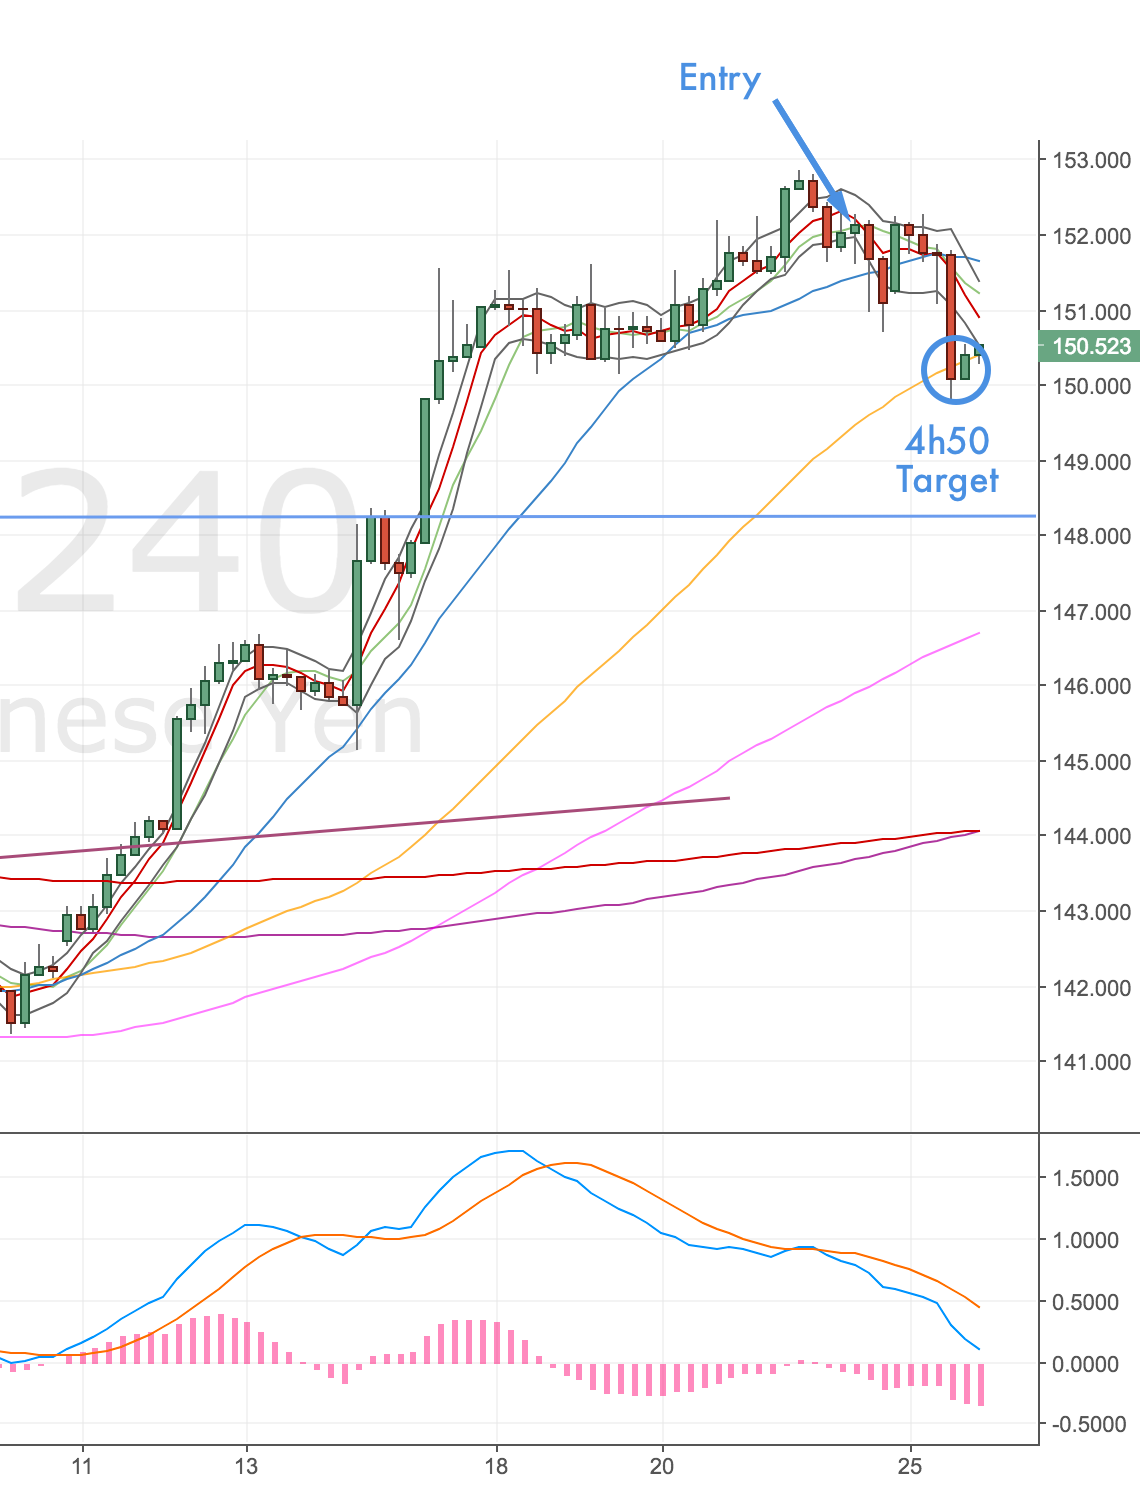
4H Chart Set up
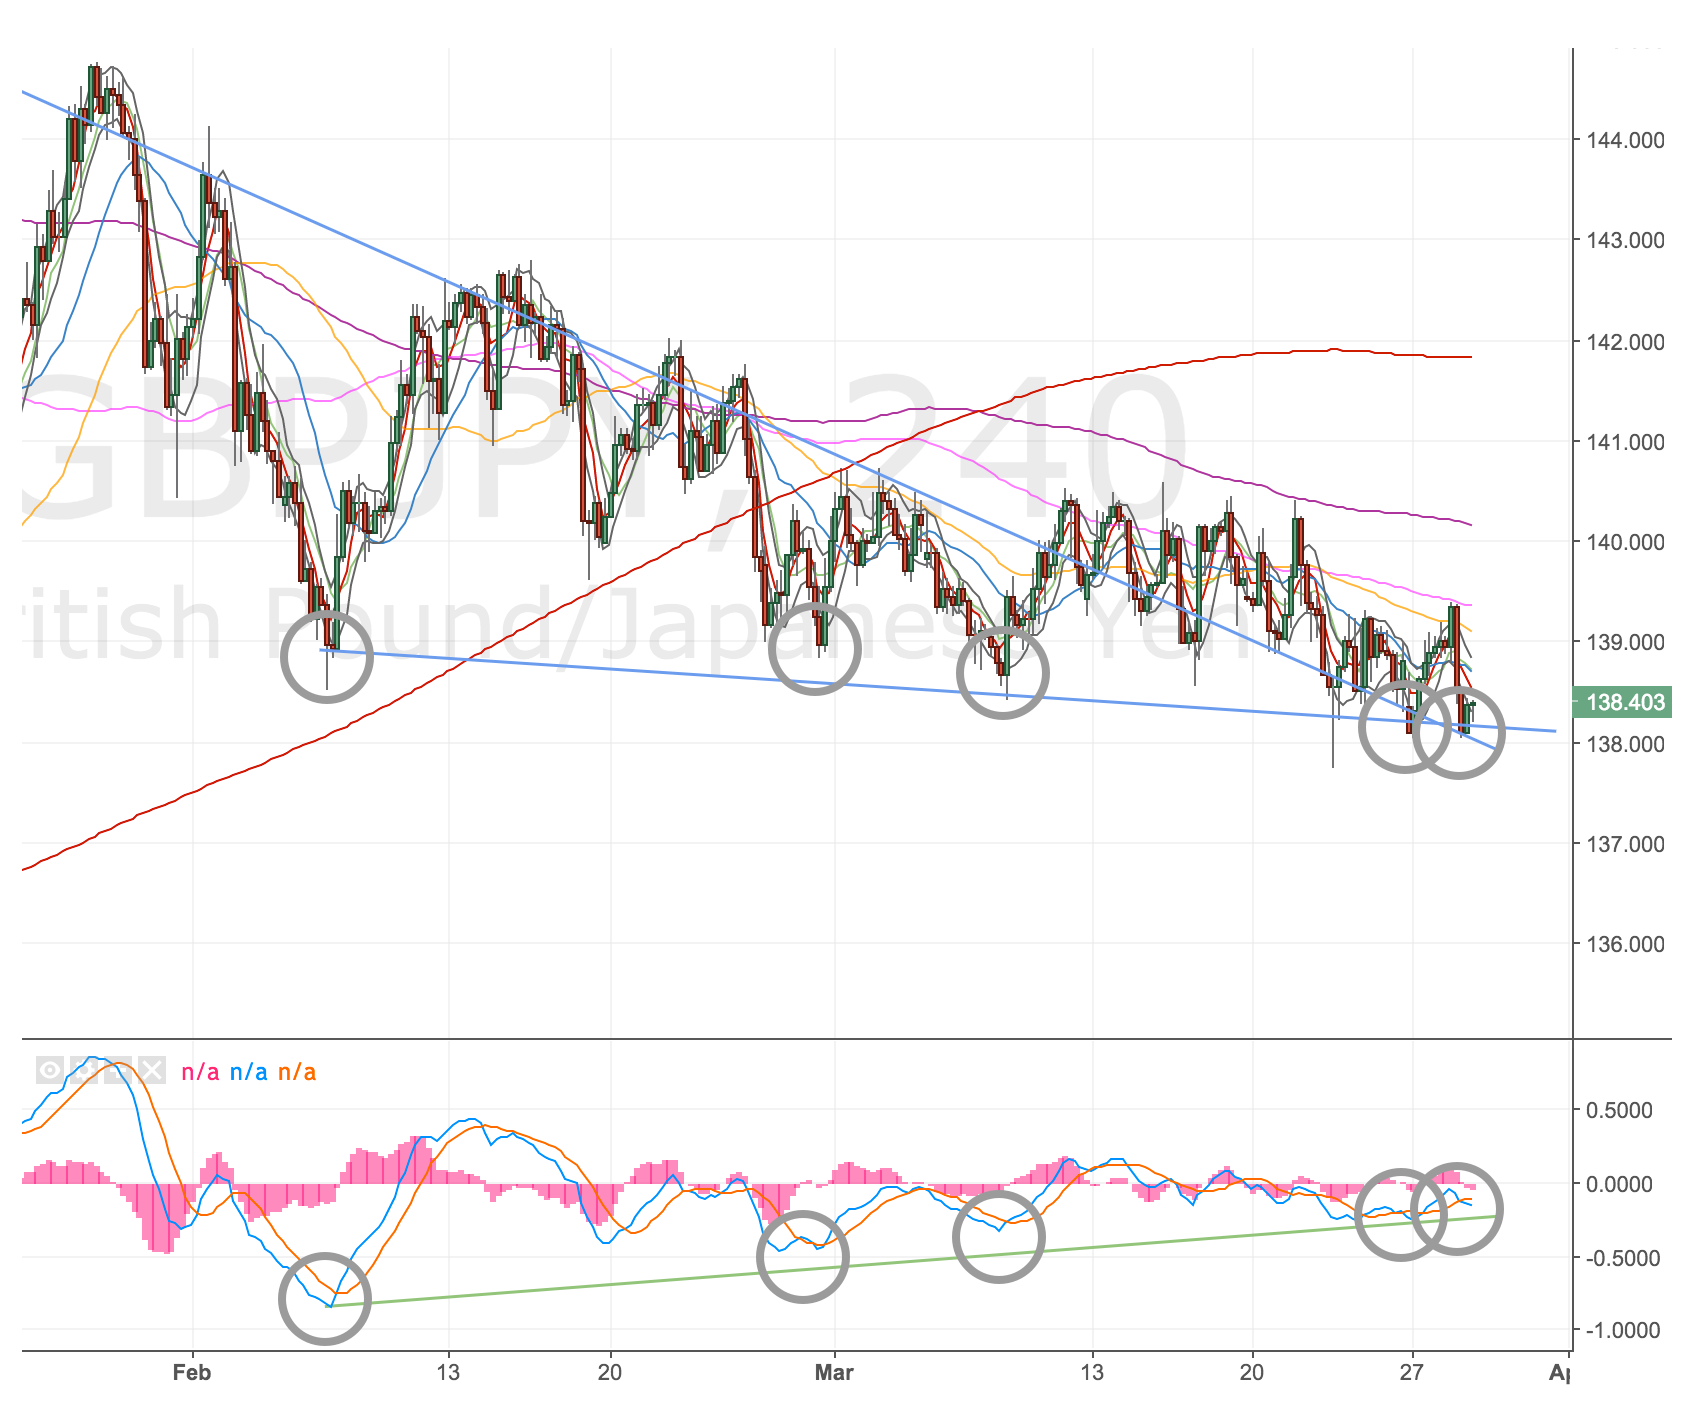
GBPJPY 4H Chart – 30 Mar
Quadruple divergence in play!
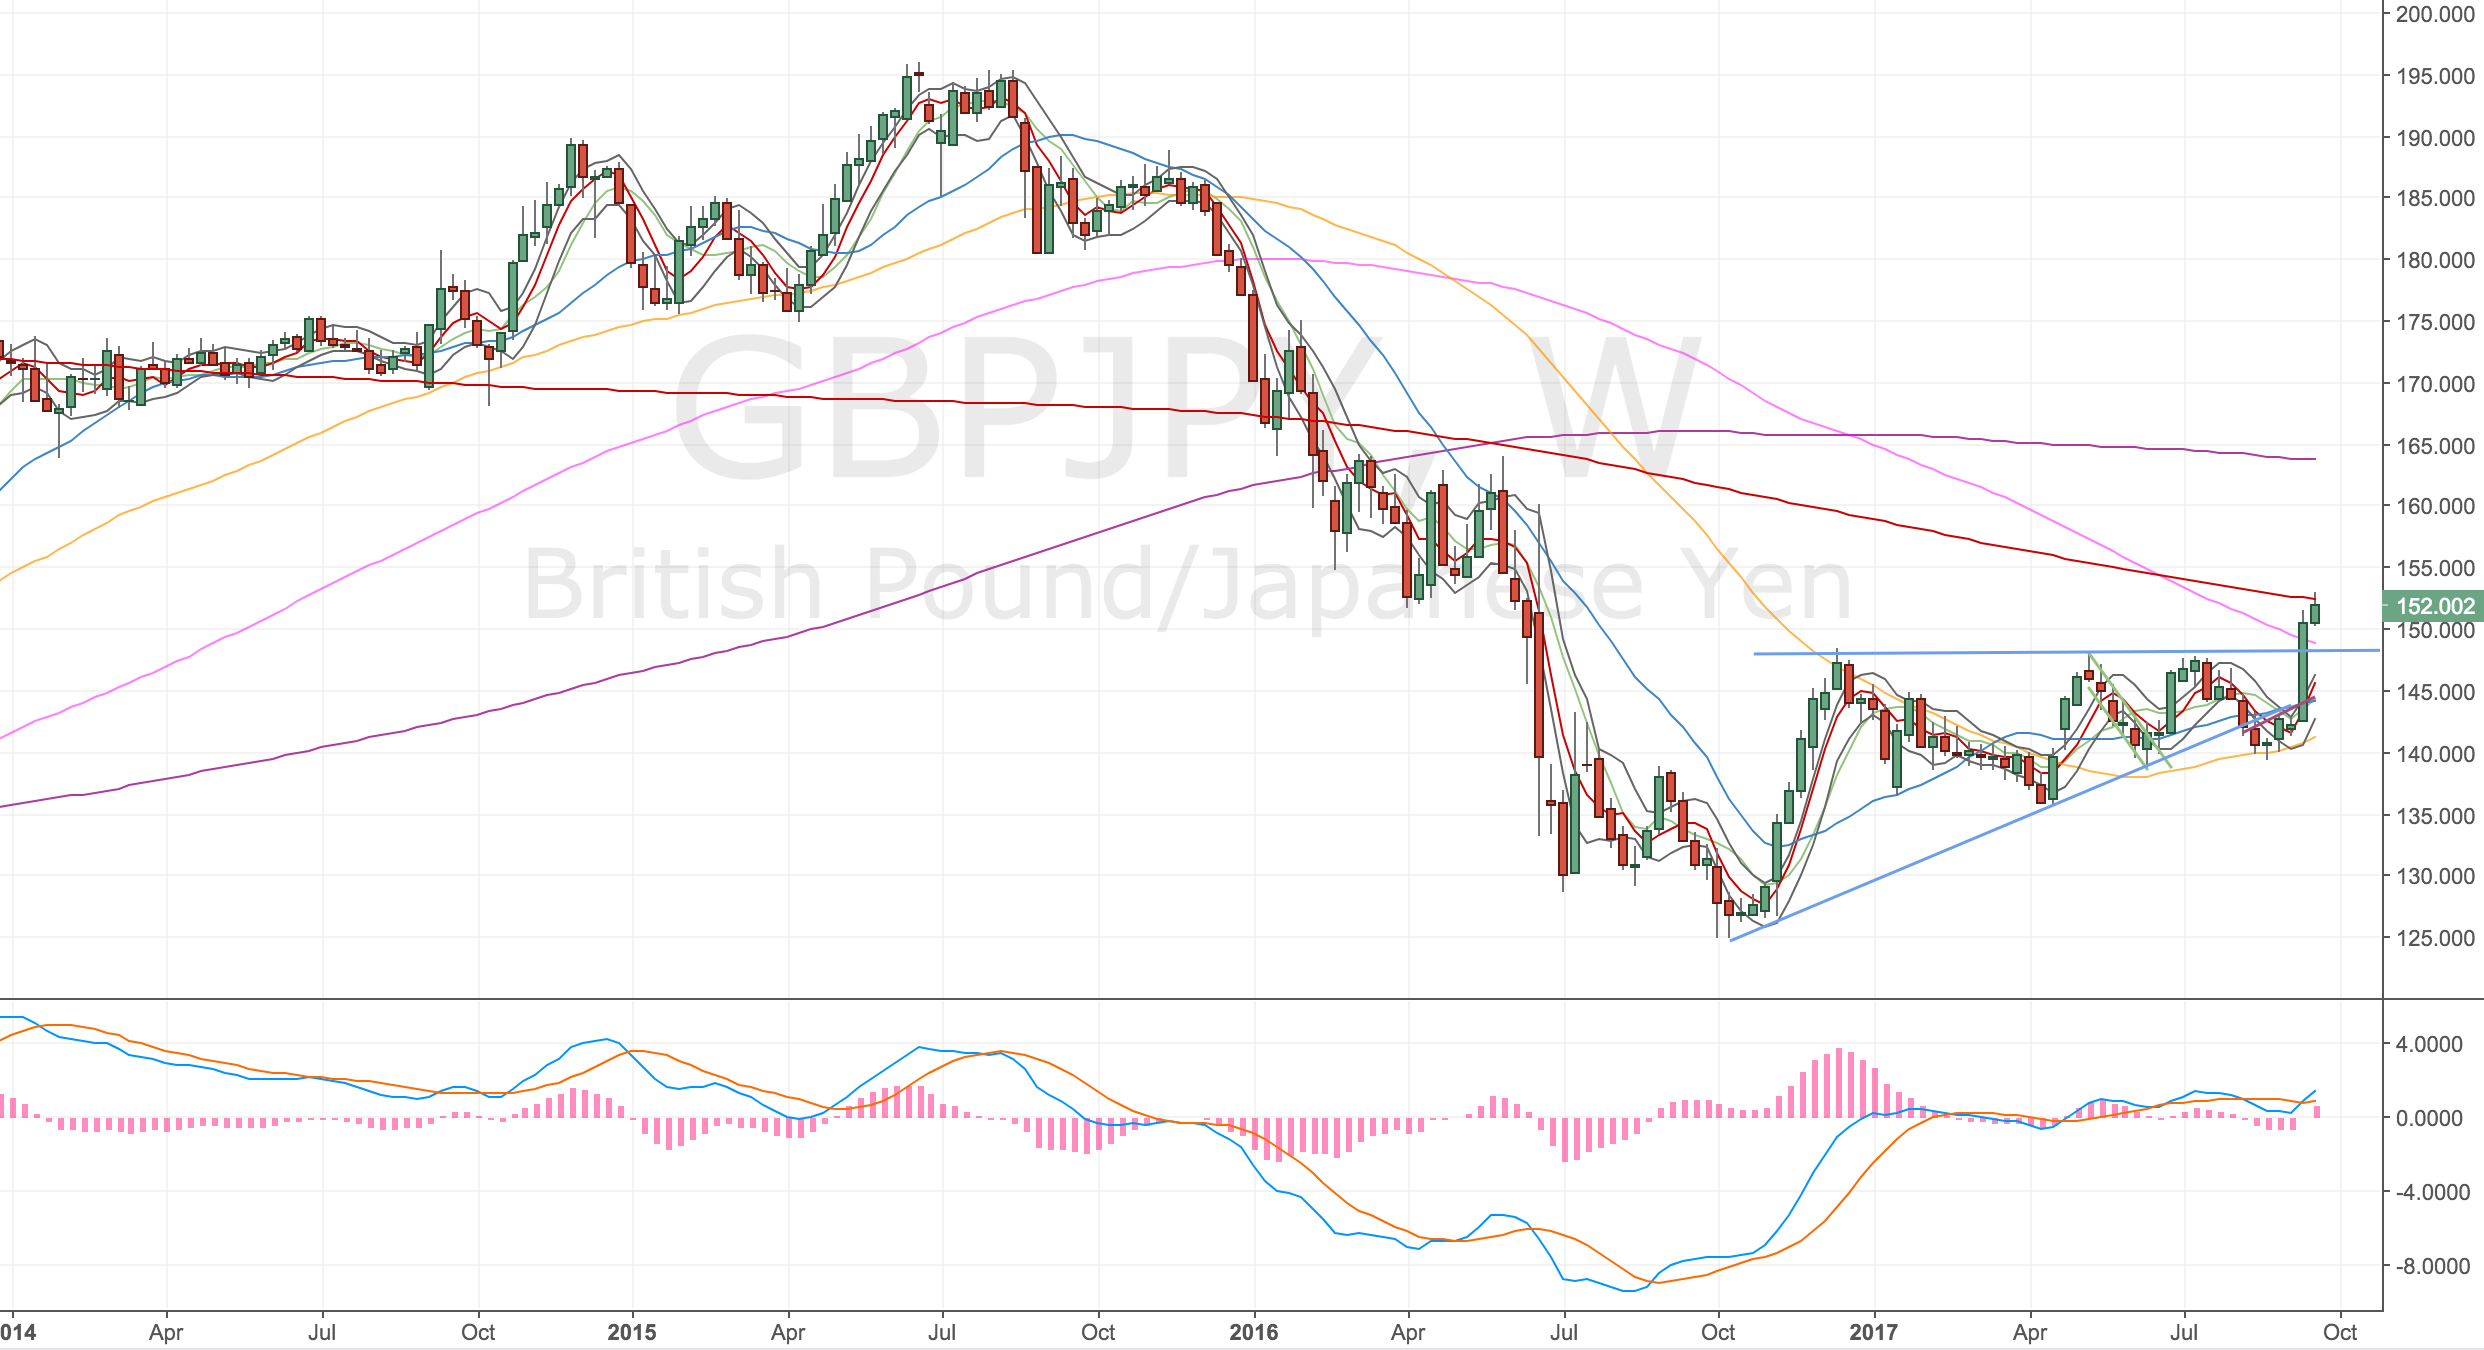
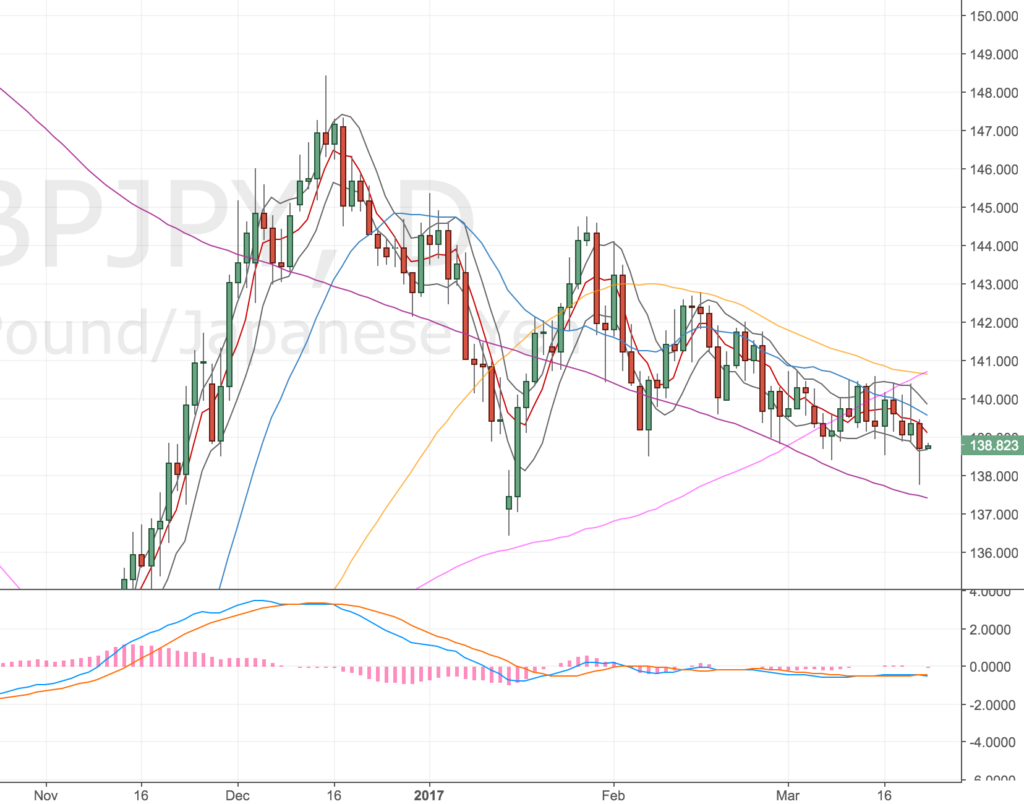
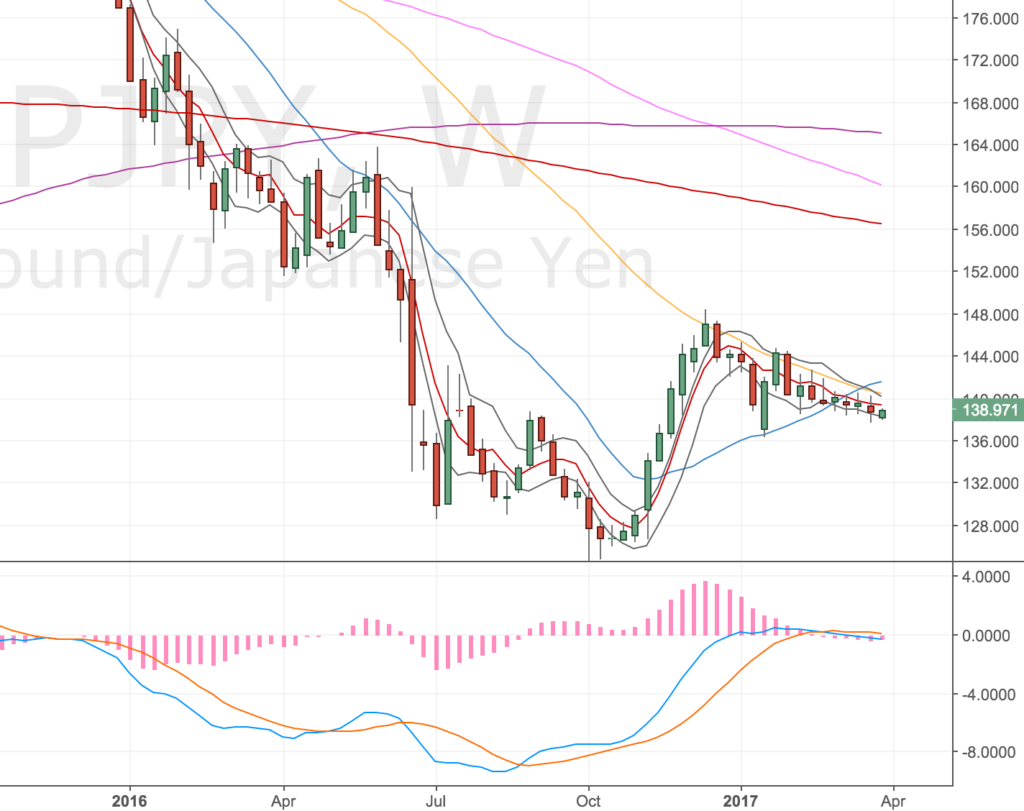
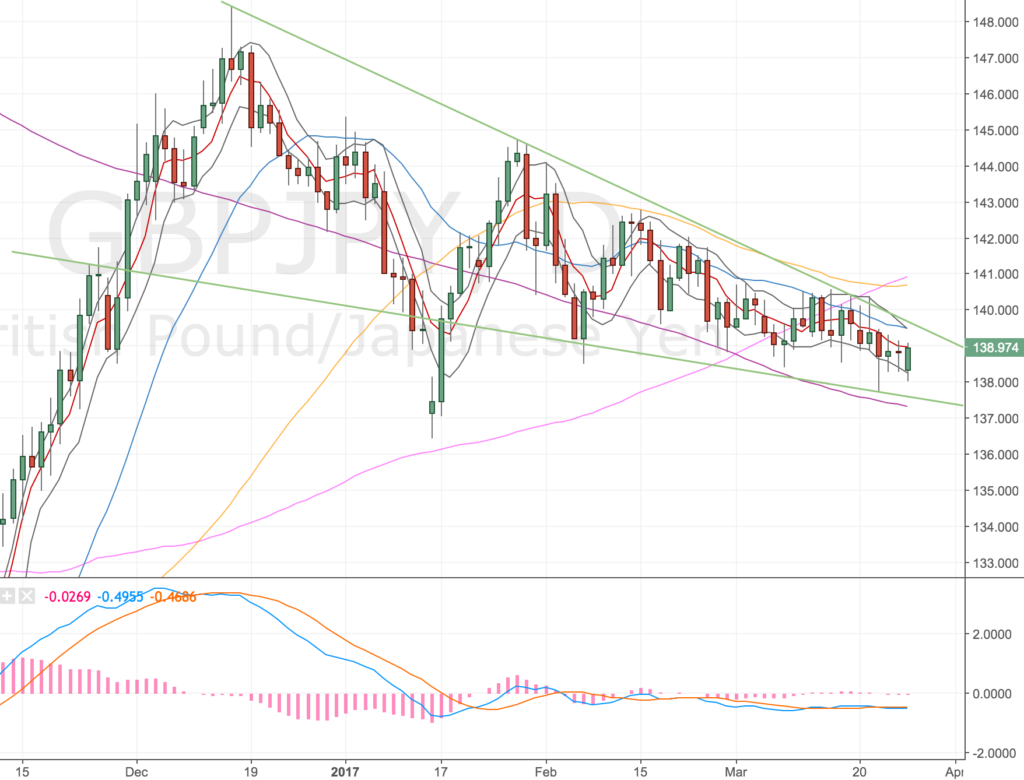
Daily Chart
The daily chart really shows the long bullish wedge. Where could price go if we broke out from here?
GBPJPY Daily Chart – 29 Mar
The trade is on and I’ll wait a see where we end up.
Update – Revising my targets – 29 Mar
I’ve been thinking about this trade quite a bit and I’ve decided I’d be cutting myself short to not aim for a higher daily target. My plan has changed a bit, here’s what I’m thinking.
- Close half my position on the 4h200, in case we just roll-over again. This would cover the remainder of my position and half of any future add in.
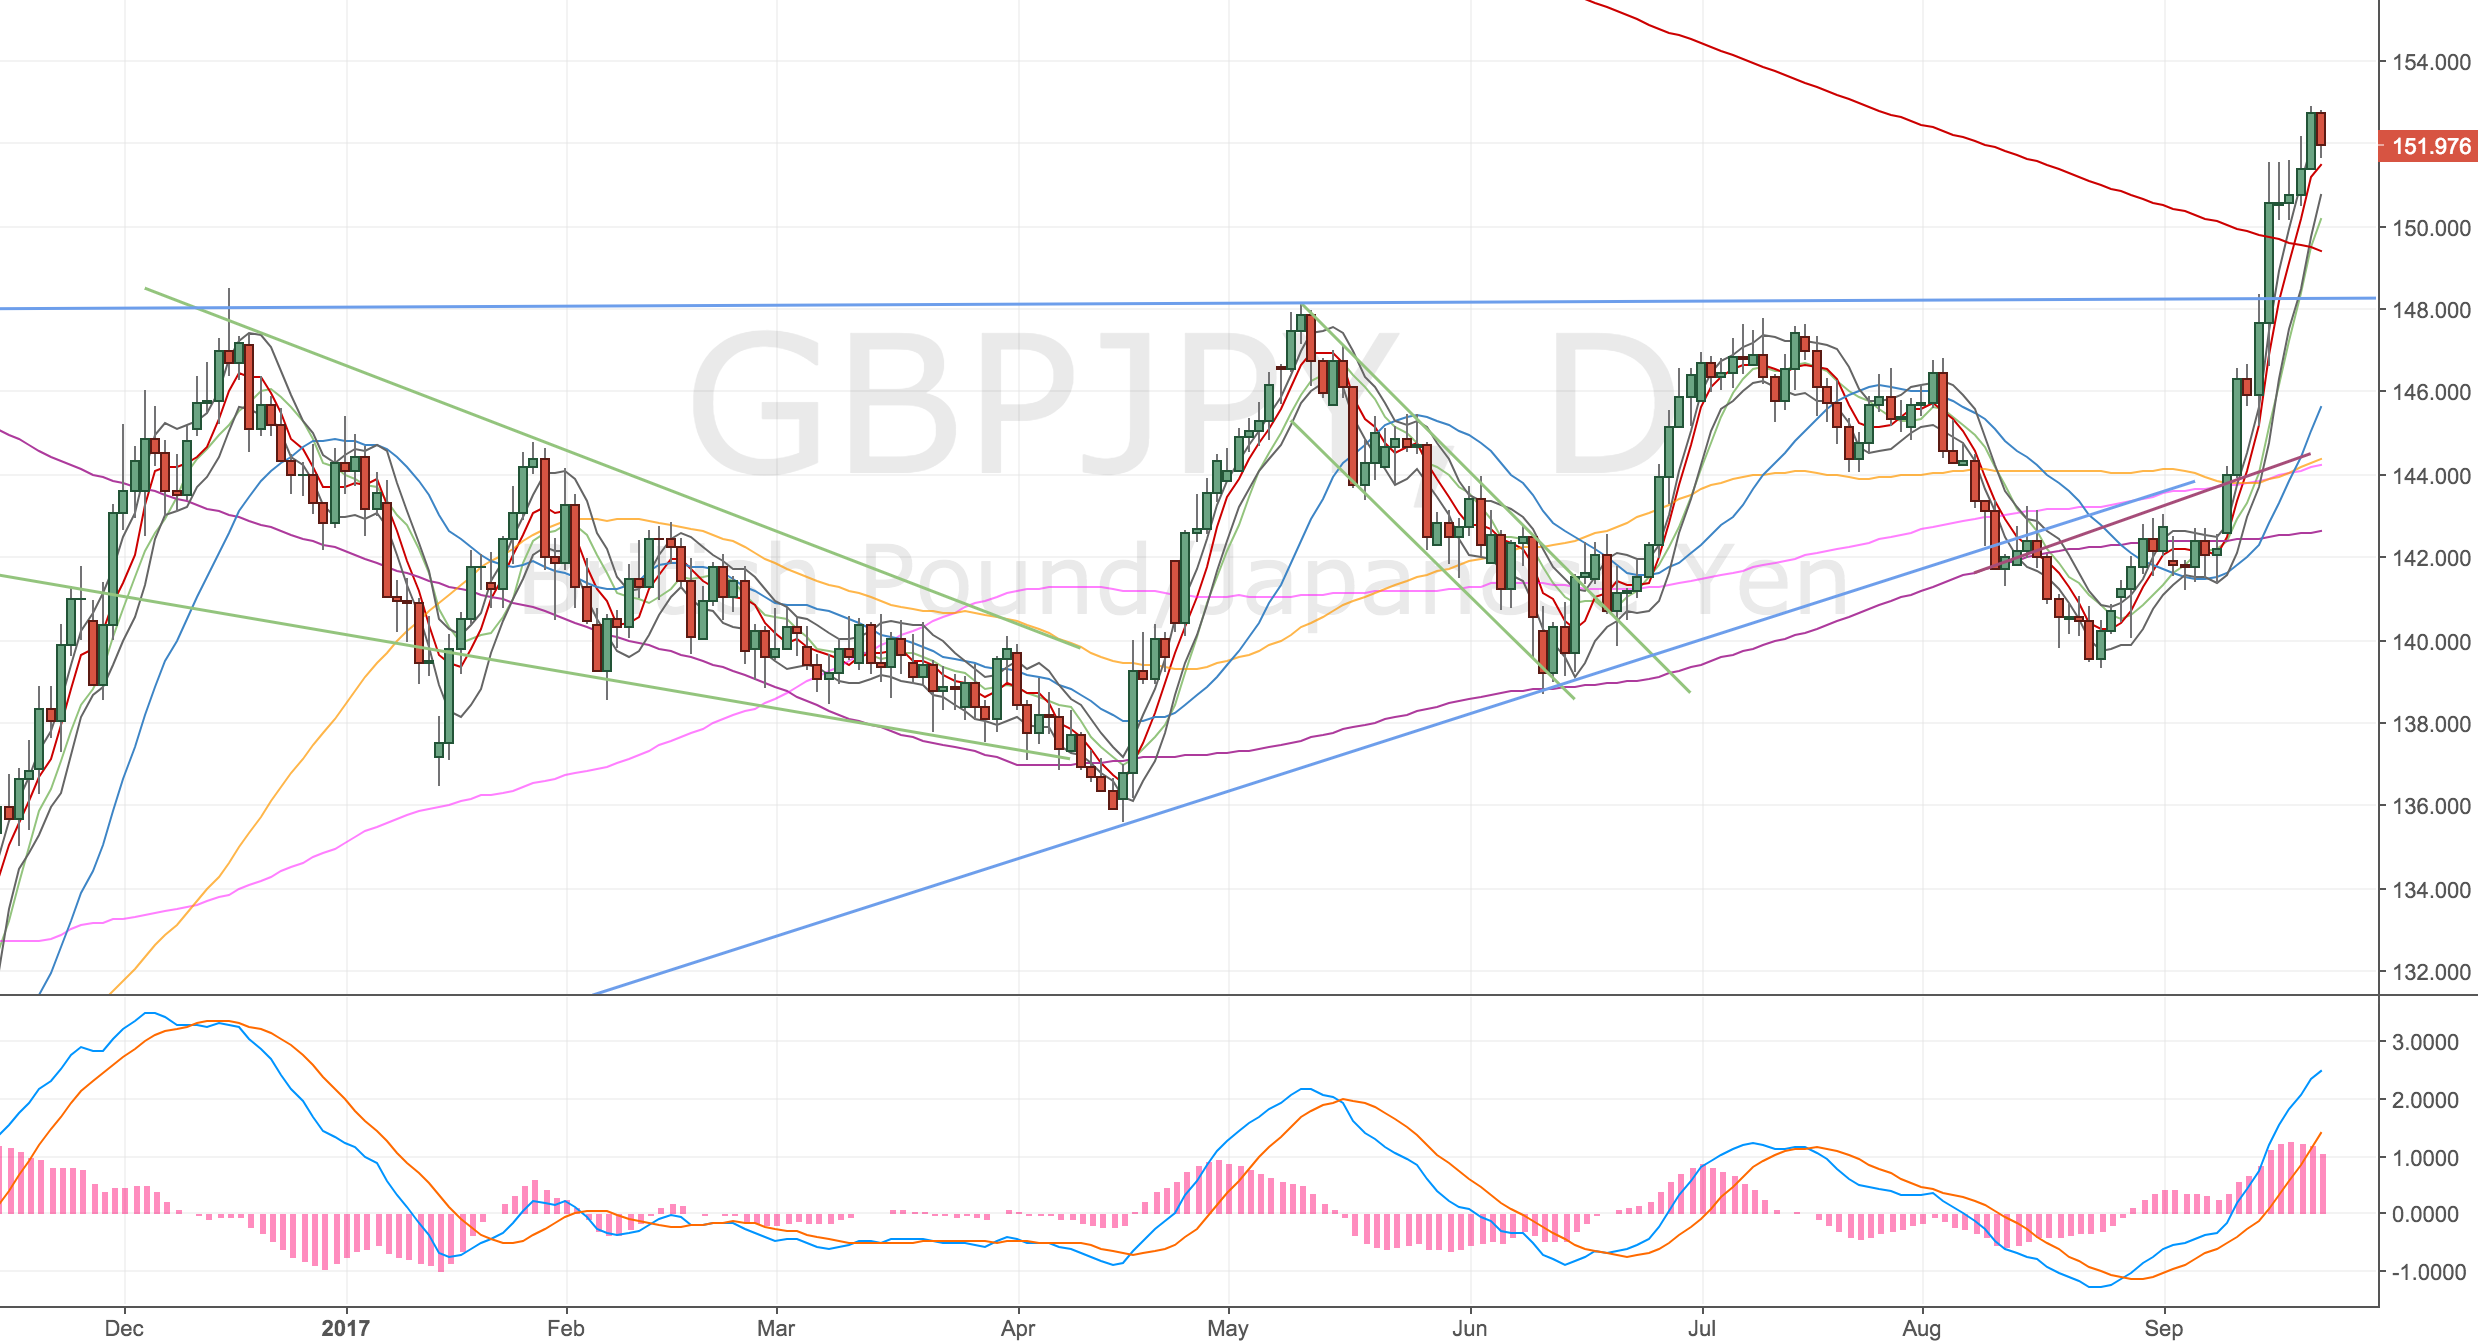
- Look for a daily wedge breakout to get to prior highs @ 148
- Any breakout pullbacks add one more position, wide stop below the prior low (currently 137.50)
- Stop manage the remainder to the 127% fib level @ 155 which might coincide with the d500 & w500. (The other MAs are too near price action).
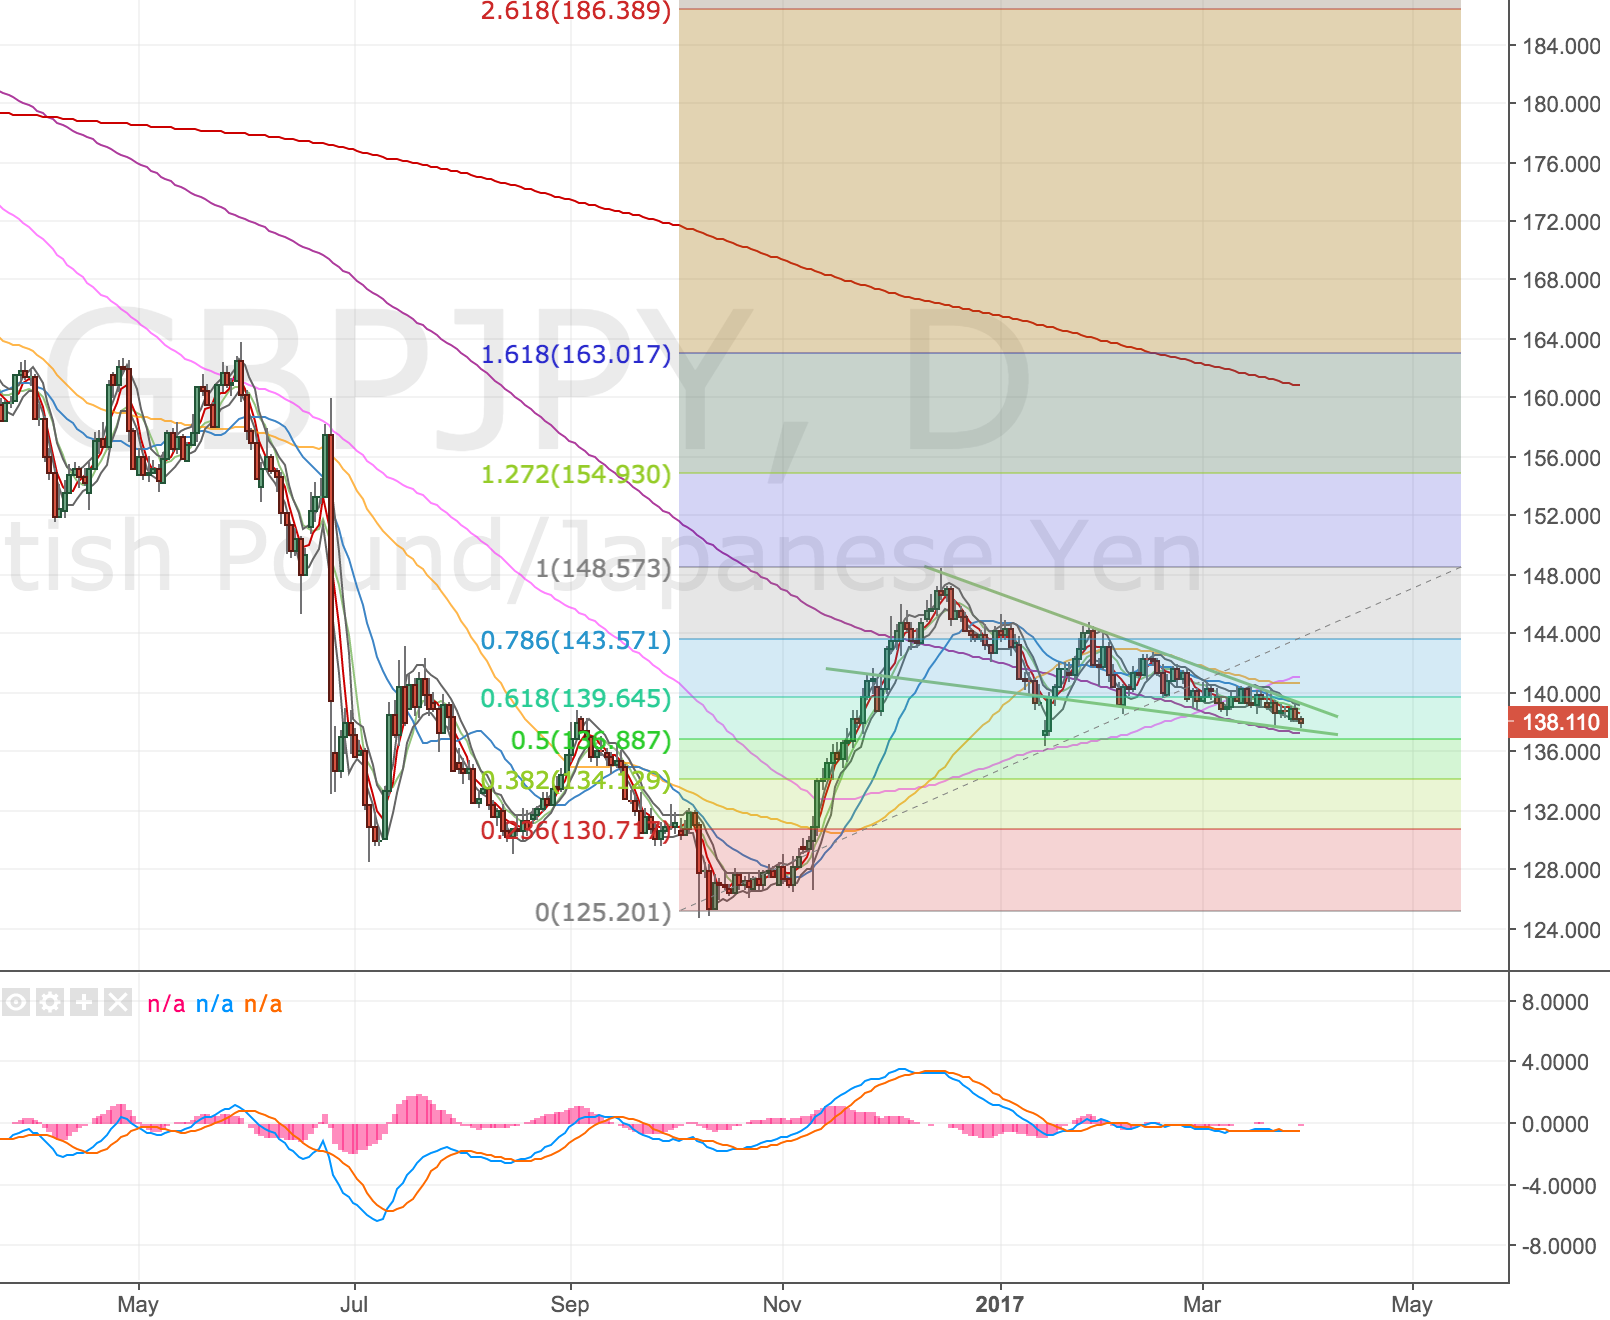
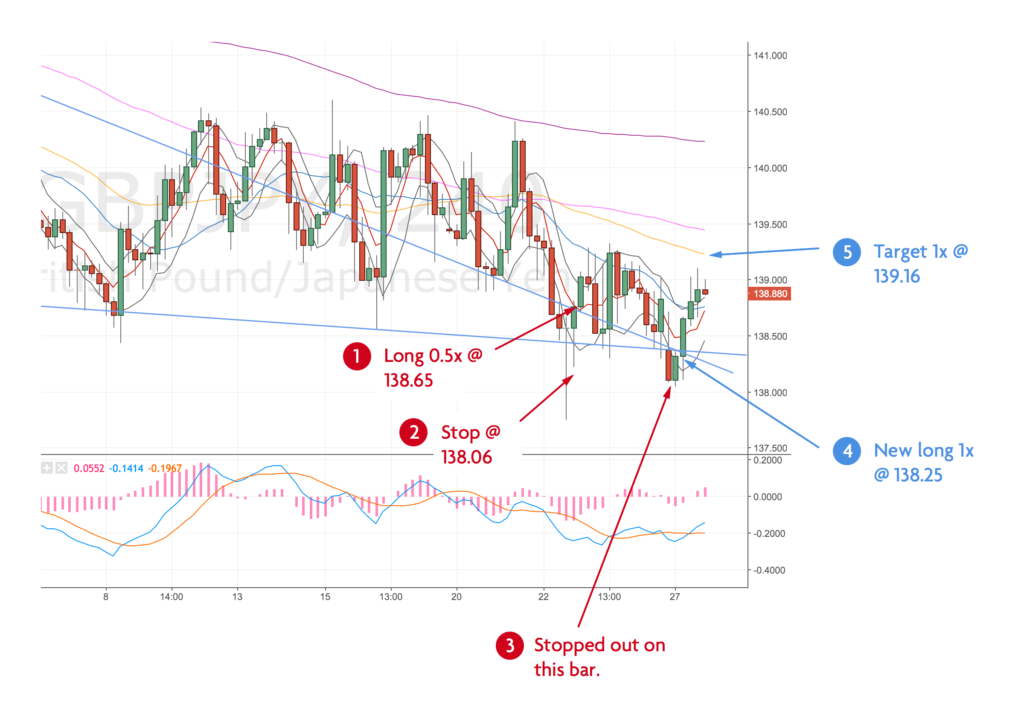
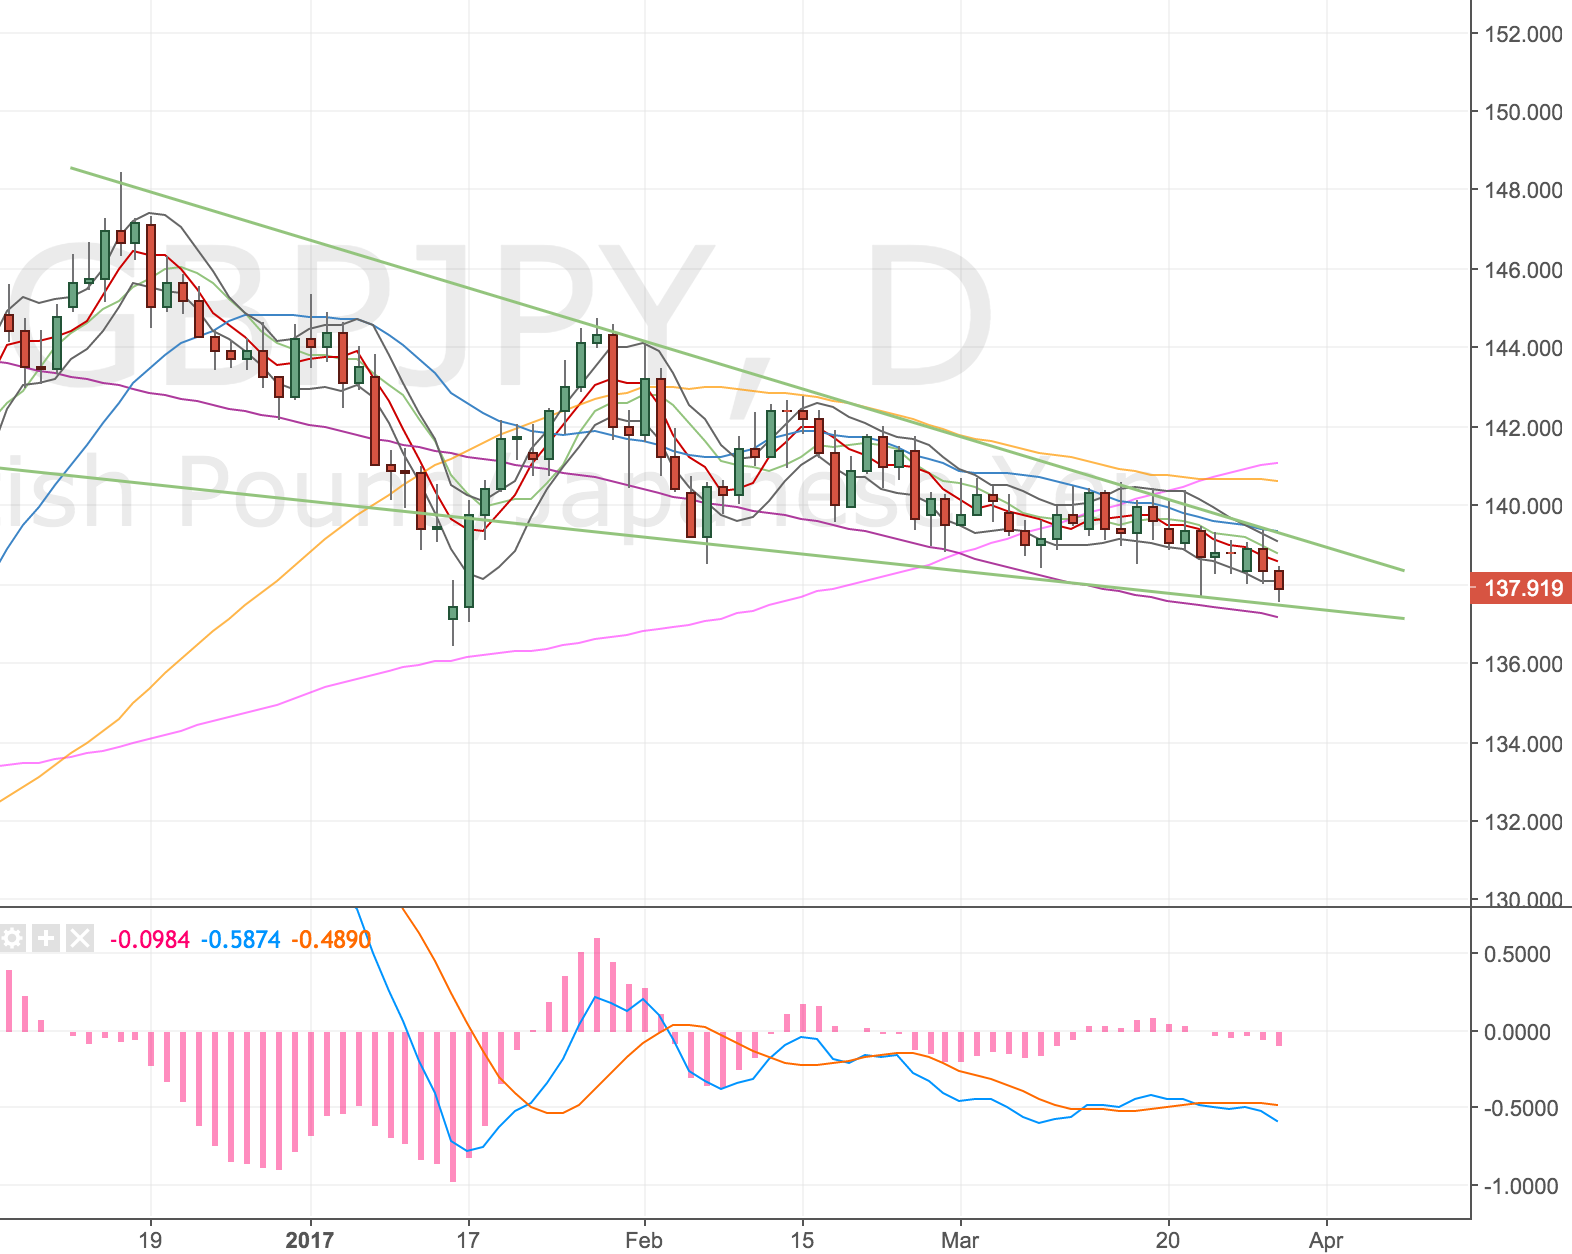
GBPJPY Daily Chart – 30 Mar
It might be foolhardy, I know it is very ambitious, but I can see huge upside potential and fundamentally I think the GBP is now the best place for a move higher. Trump seems to be struggling with his reforms (travel ban and healthcare both hitting the skids), the Euro is losing one of it’s top 5 (top 3?) countries, the Yen is still in QE and Japan’s inflation isn’t exactly bombing it! Another set of good GDP/inflation figures might force the UK to up interest rates soon too (we’re still yet to do so – the fed has done so twice). Markets move on expectancy not really actual data over the long-term.
I might be totally wrong though, Brexit is a big unknown and news leaks will probably send prices all over the place, hence taking some profit on the 4h200 target to cover the rest of the position and pay for half of any add in; but you’ve got to be in it to win it, so I’m hoping to be able to hold a position to higher targets. Hopefully I can stop manage this too with some decent swing lows for me to place my stops at on the way up and reduce my risk.
So here’s the set up now. The risk to reward ratios (RRs) look ridiculous:
Acc Risk: 0.9%
Long: 2x 138.00 (1x ~140 – depending on price action)
Stop: 137.40 (60 pips)
Target 1: 139.96 (4h200, 196 pips, 3.2 RR)
Target 2: 148.57 (Prior high & m100, 1057 pips, 17.6 RR)
Target 3: 154.93 (127% daily fib, d500 & w500, 1693 pips, 28.2 RR)
Separately, one thing I’ve noticed about GBPJPY price action is how spiky it is. Almost all candles have long wicks. Not something I’m used to trading in, so setting stops a fixed margin off the lows seems to make for some pretty wide stops. I can forget about those ultra tidy EURUSD 10 & 20 pip stops!
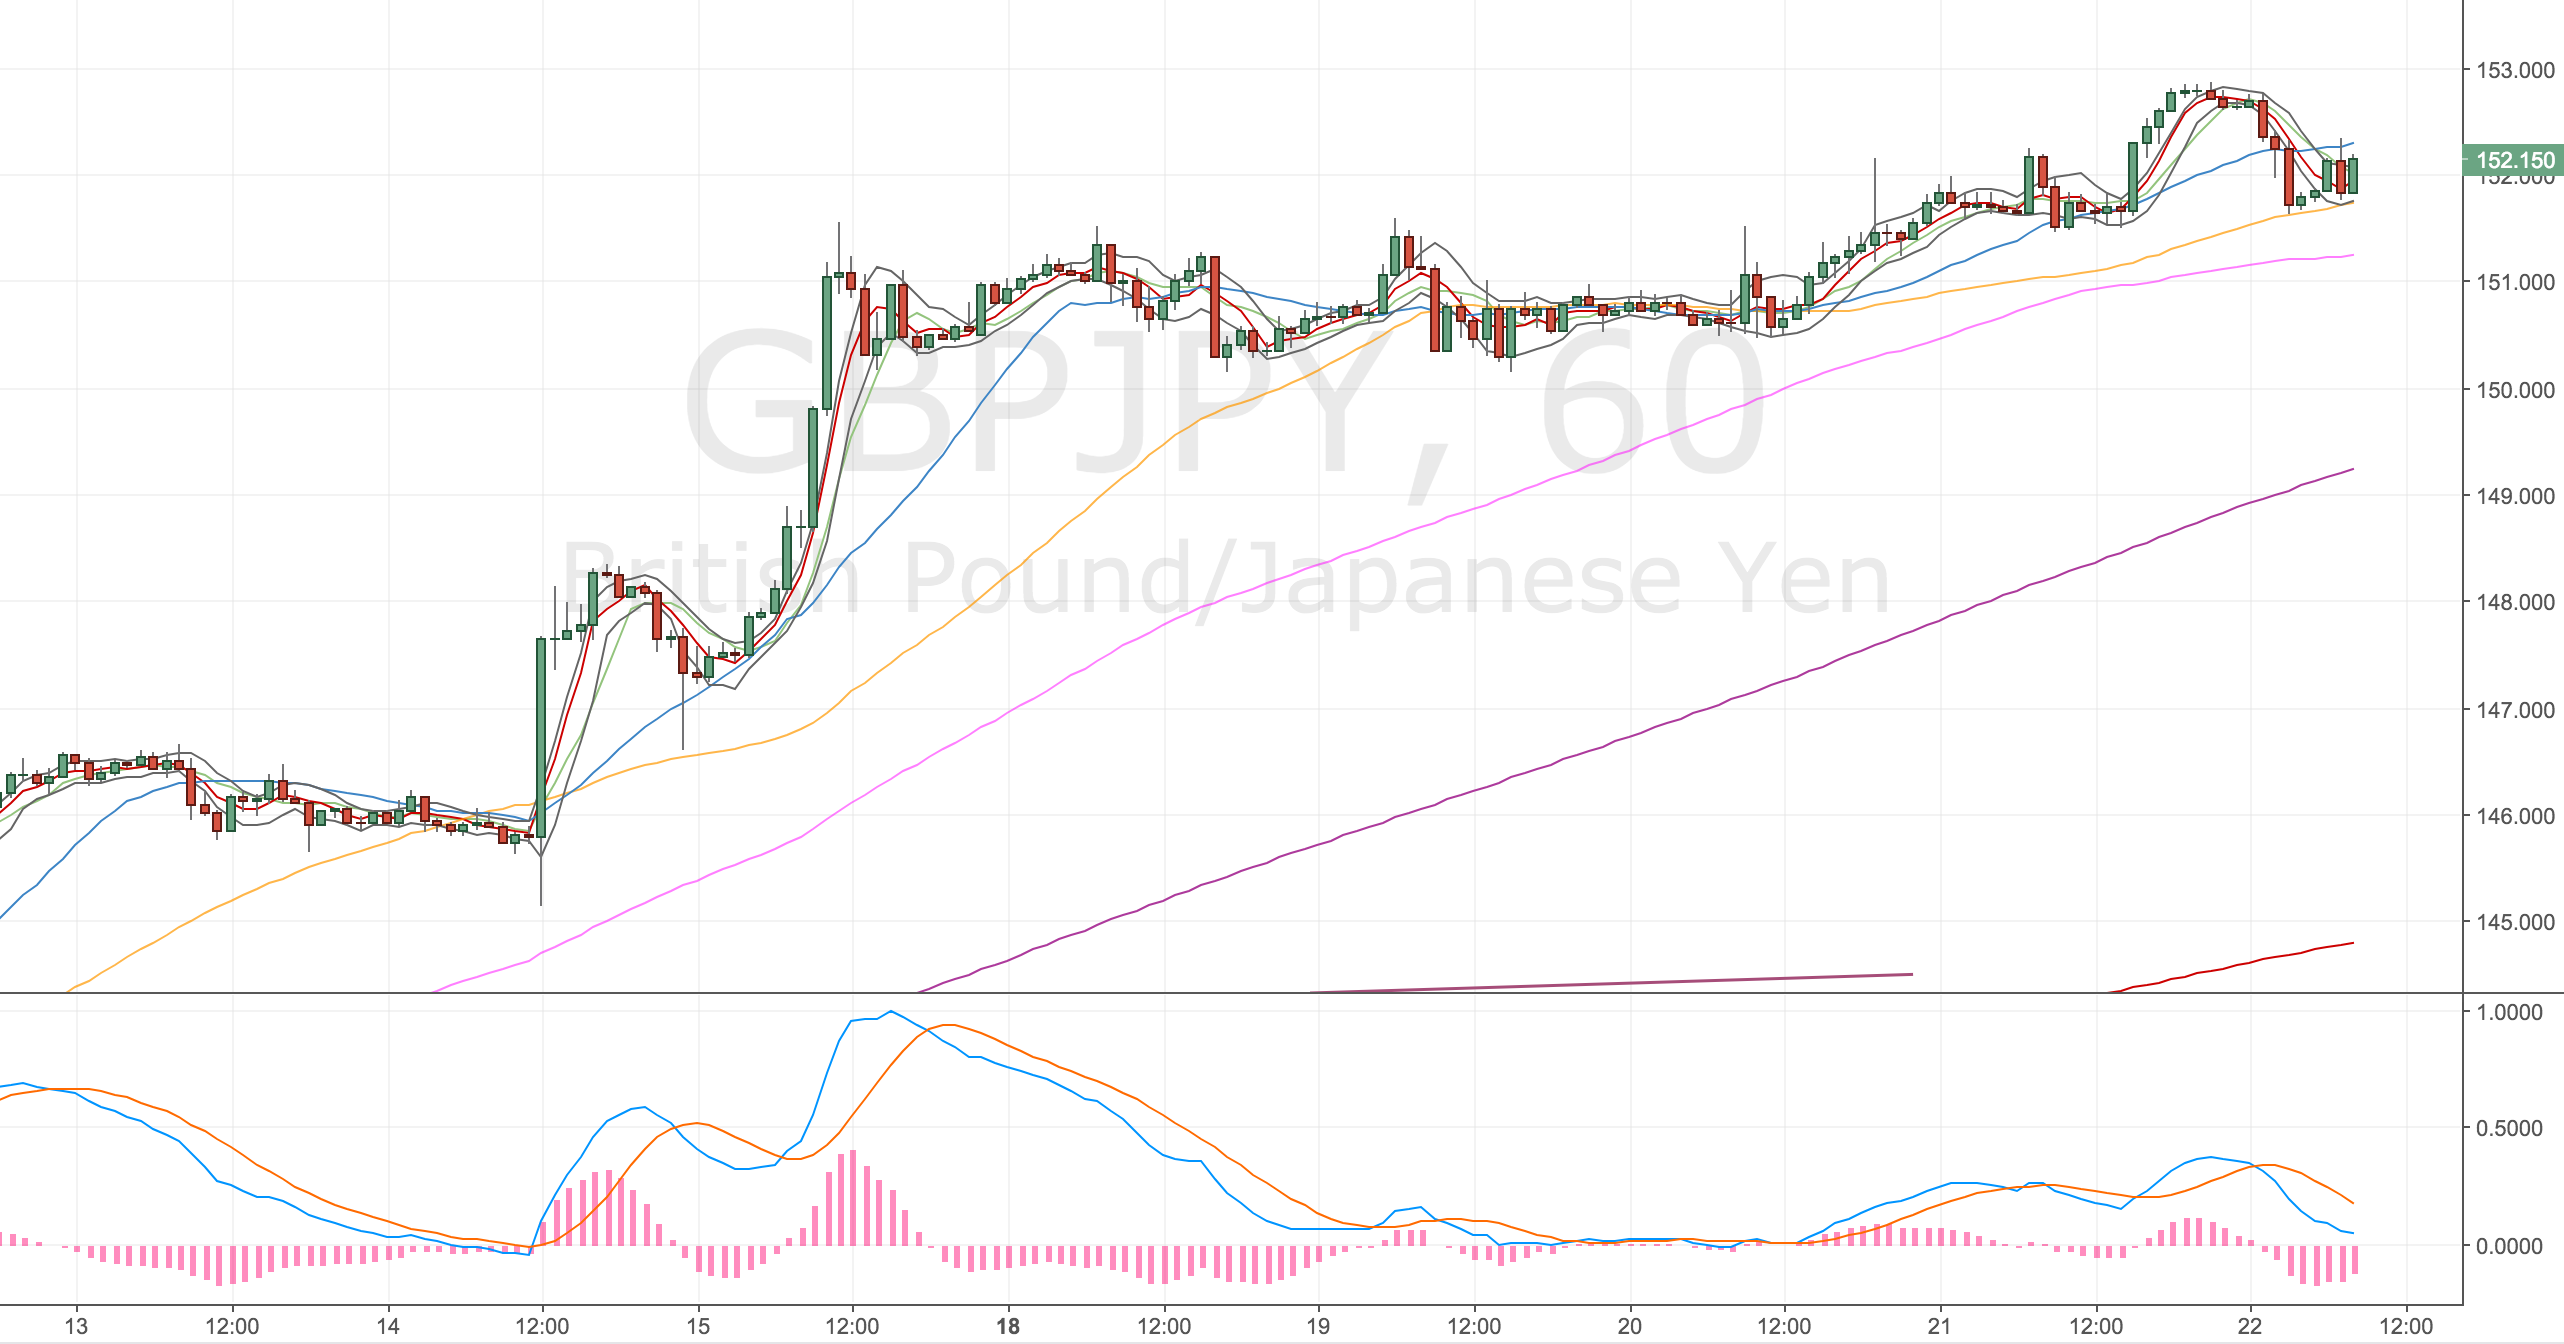
Update – 4h200 hit remainder stopped out – 4 Apr
Price hit my first target – the 4h200. I was holding for the higher fatter targets but price rolled over and stopped me out. It’s in a really tight range right now. I did notice a doji candlestick at the top of the trend channel on the daily timeframe so I guess the writing was on the wall. 🙂
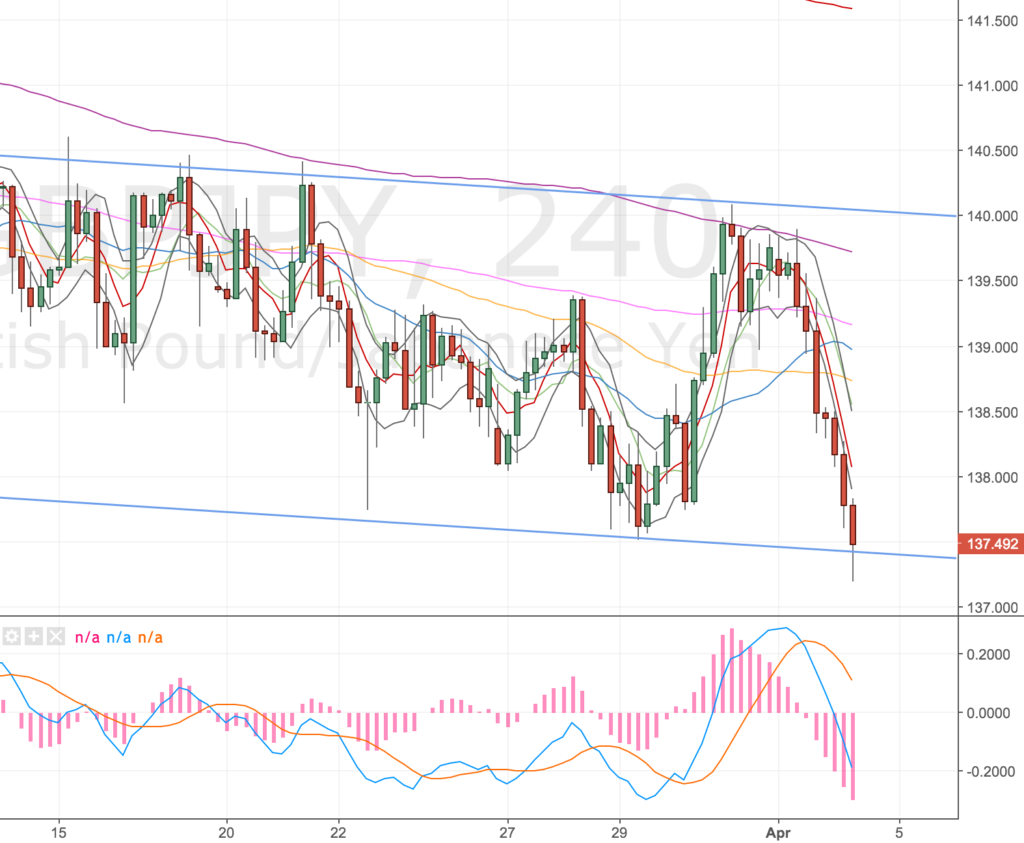
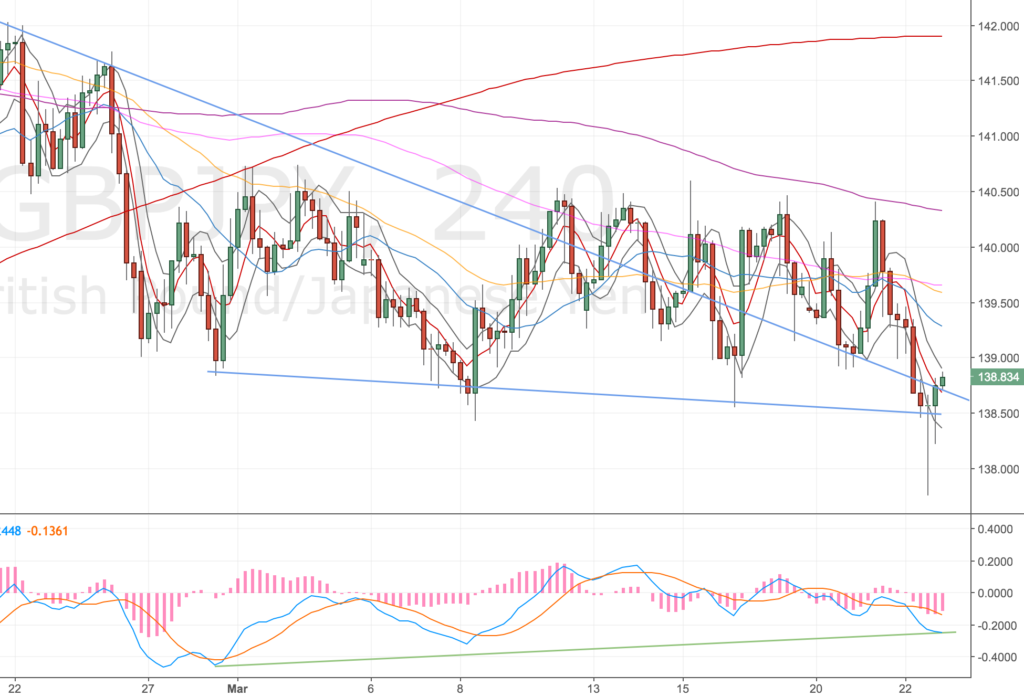
GBPJPY 4H Chart – 4 Apr
It was hard to watch a very nice profit (£200) become an OK one (£60). £200 would’ve been the bulk of my monthly target but I’ve heard so many traders say it’s the one or two odd trades that make your month or year, so you’ve got to keep something in the game if you think price can go higher.
Having said that, my strategy isn’t about holding out for those big targets, it’s about shooting at near term targets so I probably should’ve closed out. As Charlie said to me, there’s plenty of movement in price working up to a big target so there’s plenty of places to get long or short. Some more education there – price £140!
One last thing, I think I over thought the trade and probably wasted a load of time plotting my hero moment! As John Major said – it’s back to basics!

John Major getting back to basics