Category Archives: Trades

Trade Plan – wc. 03 Dec 18

last updated: 09:00, 03 Dec 2018

Last week review

Last week traded to plan fairly well, however I pulled one USDCAD short order on nerves (didn’t recognise the feeling) expecting a double top. The trade would’ve been a decent profit for me and ended the week in the money again.

Didn’t recognise the feeling which I always seem to get ahead of a profitable set up. Feeling twitchy.

Here’s the lowdown on last week’s trades.

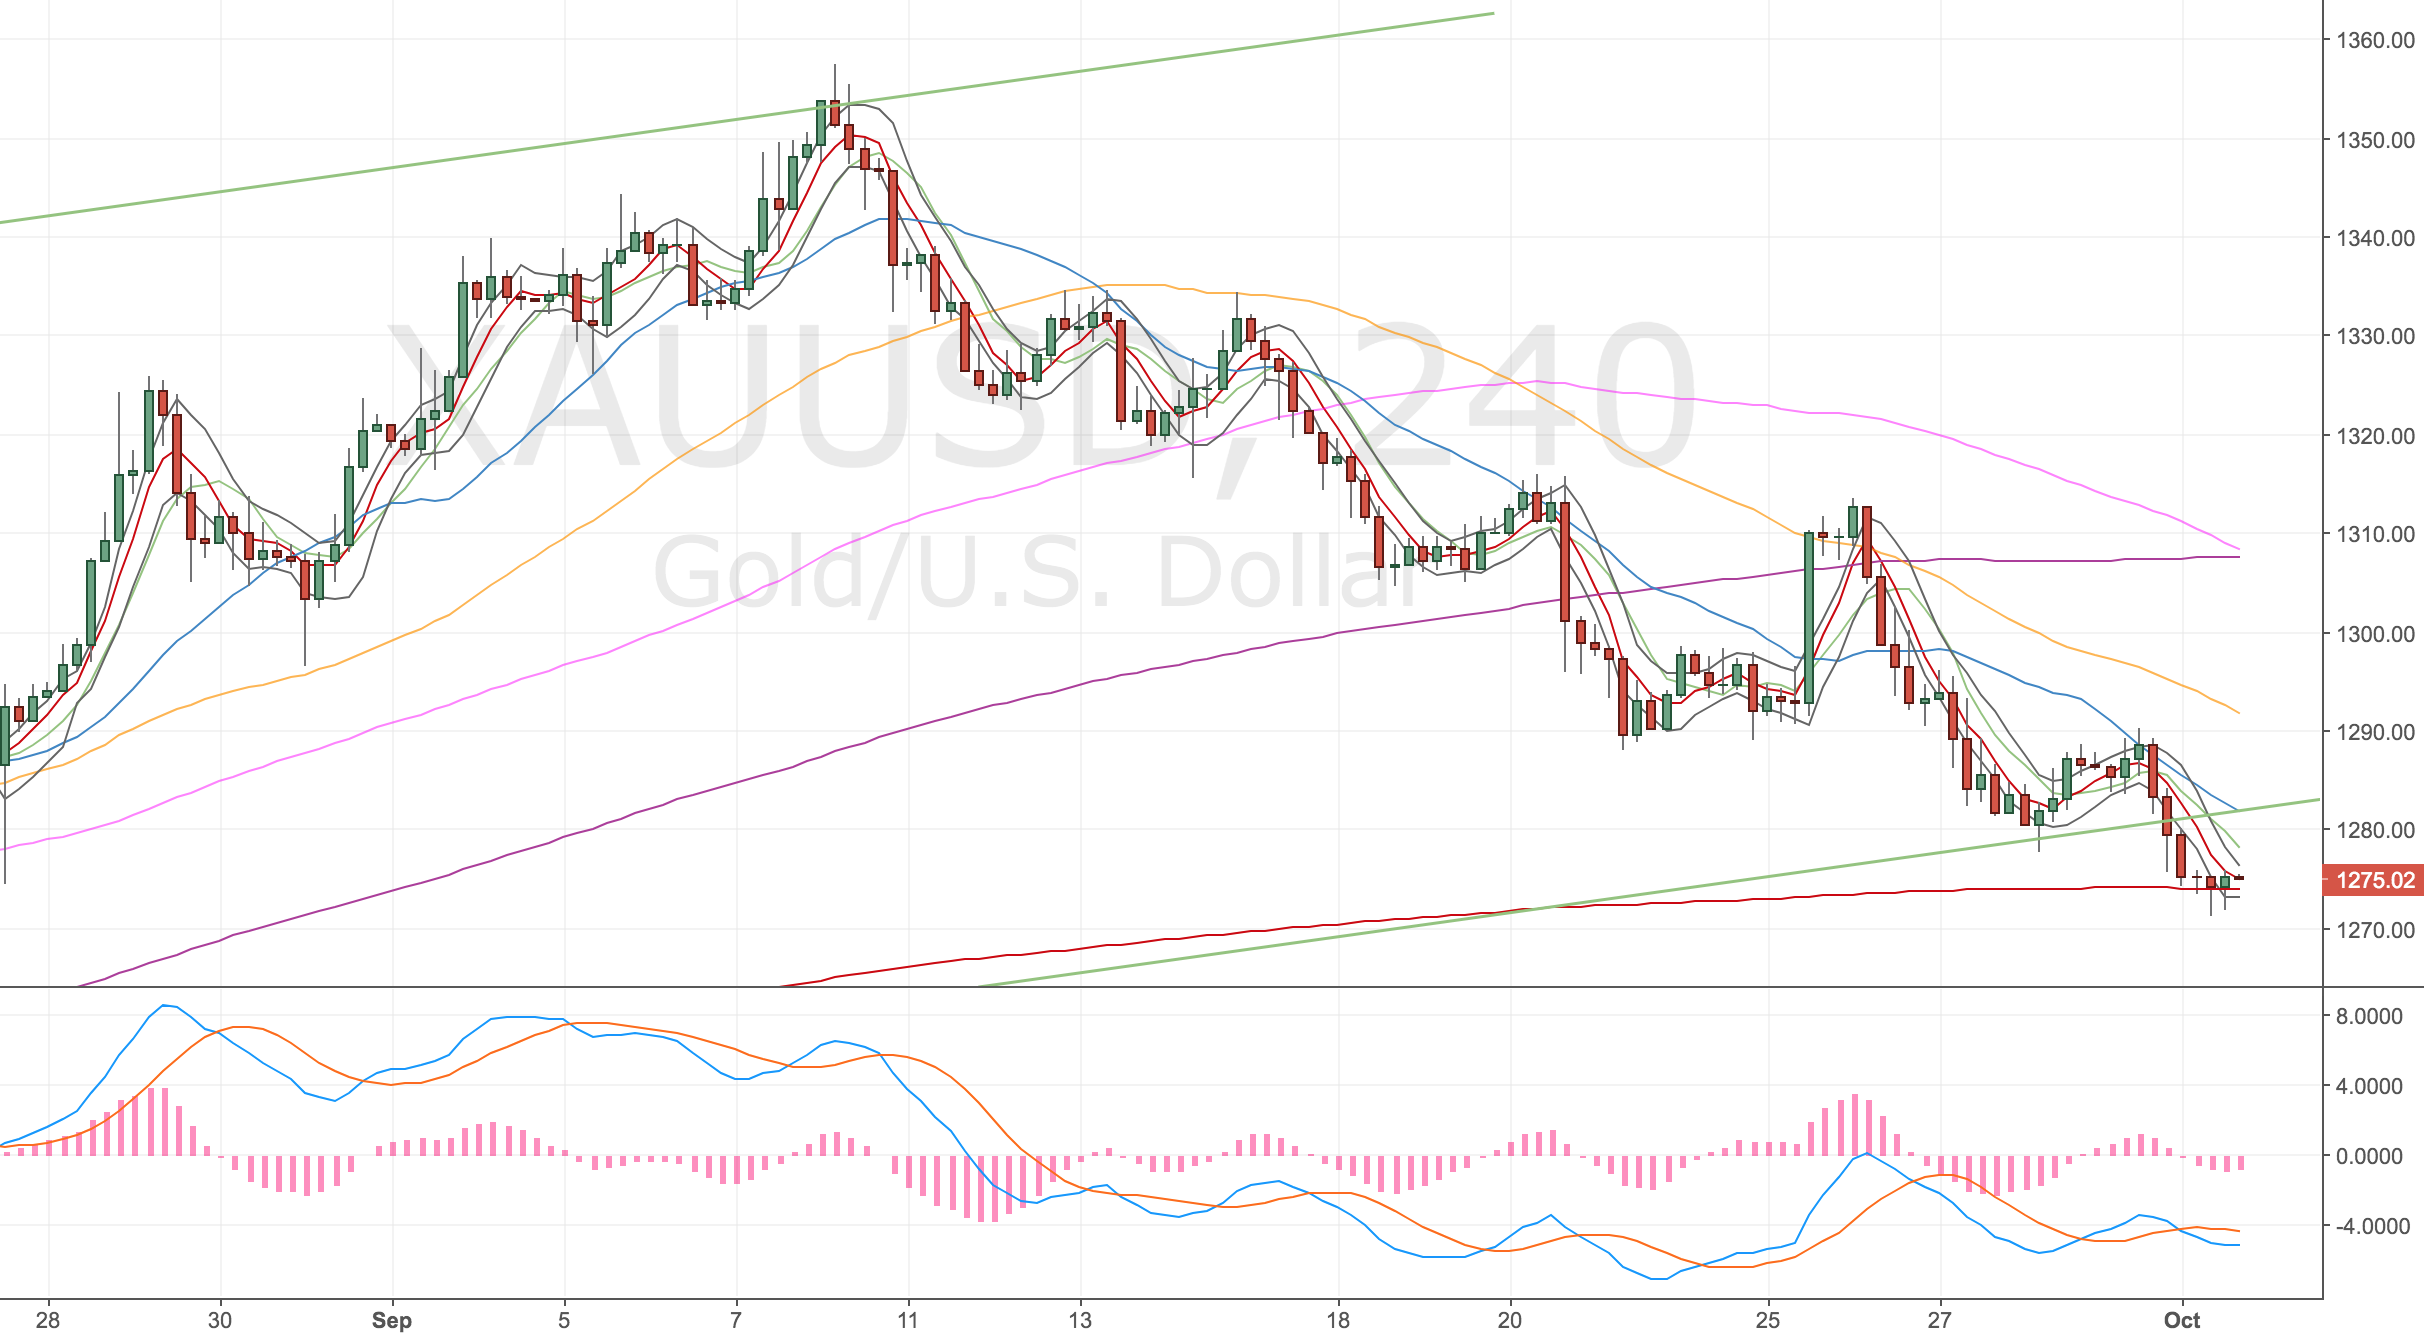
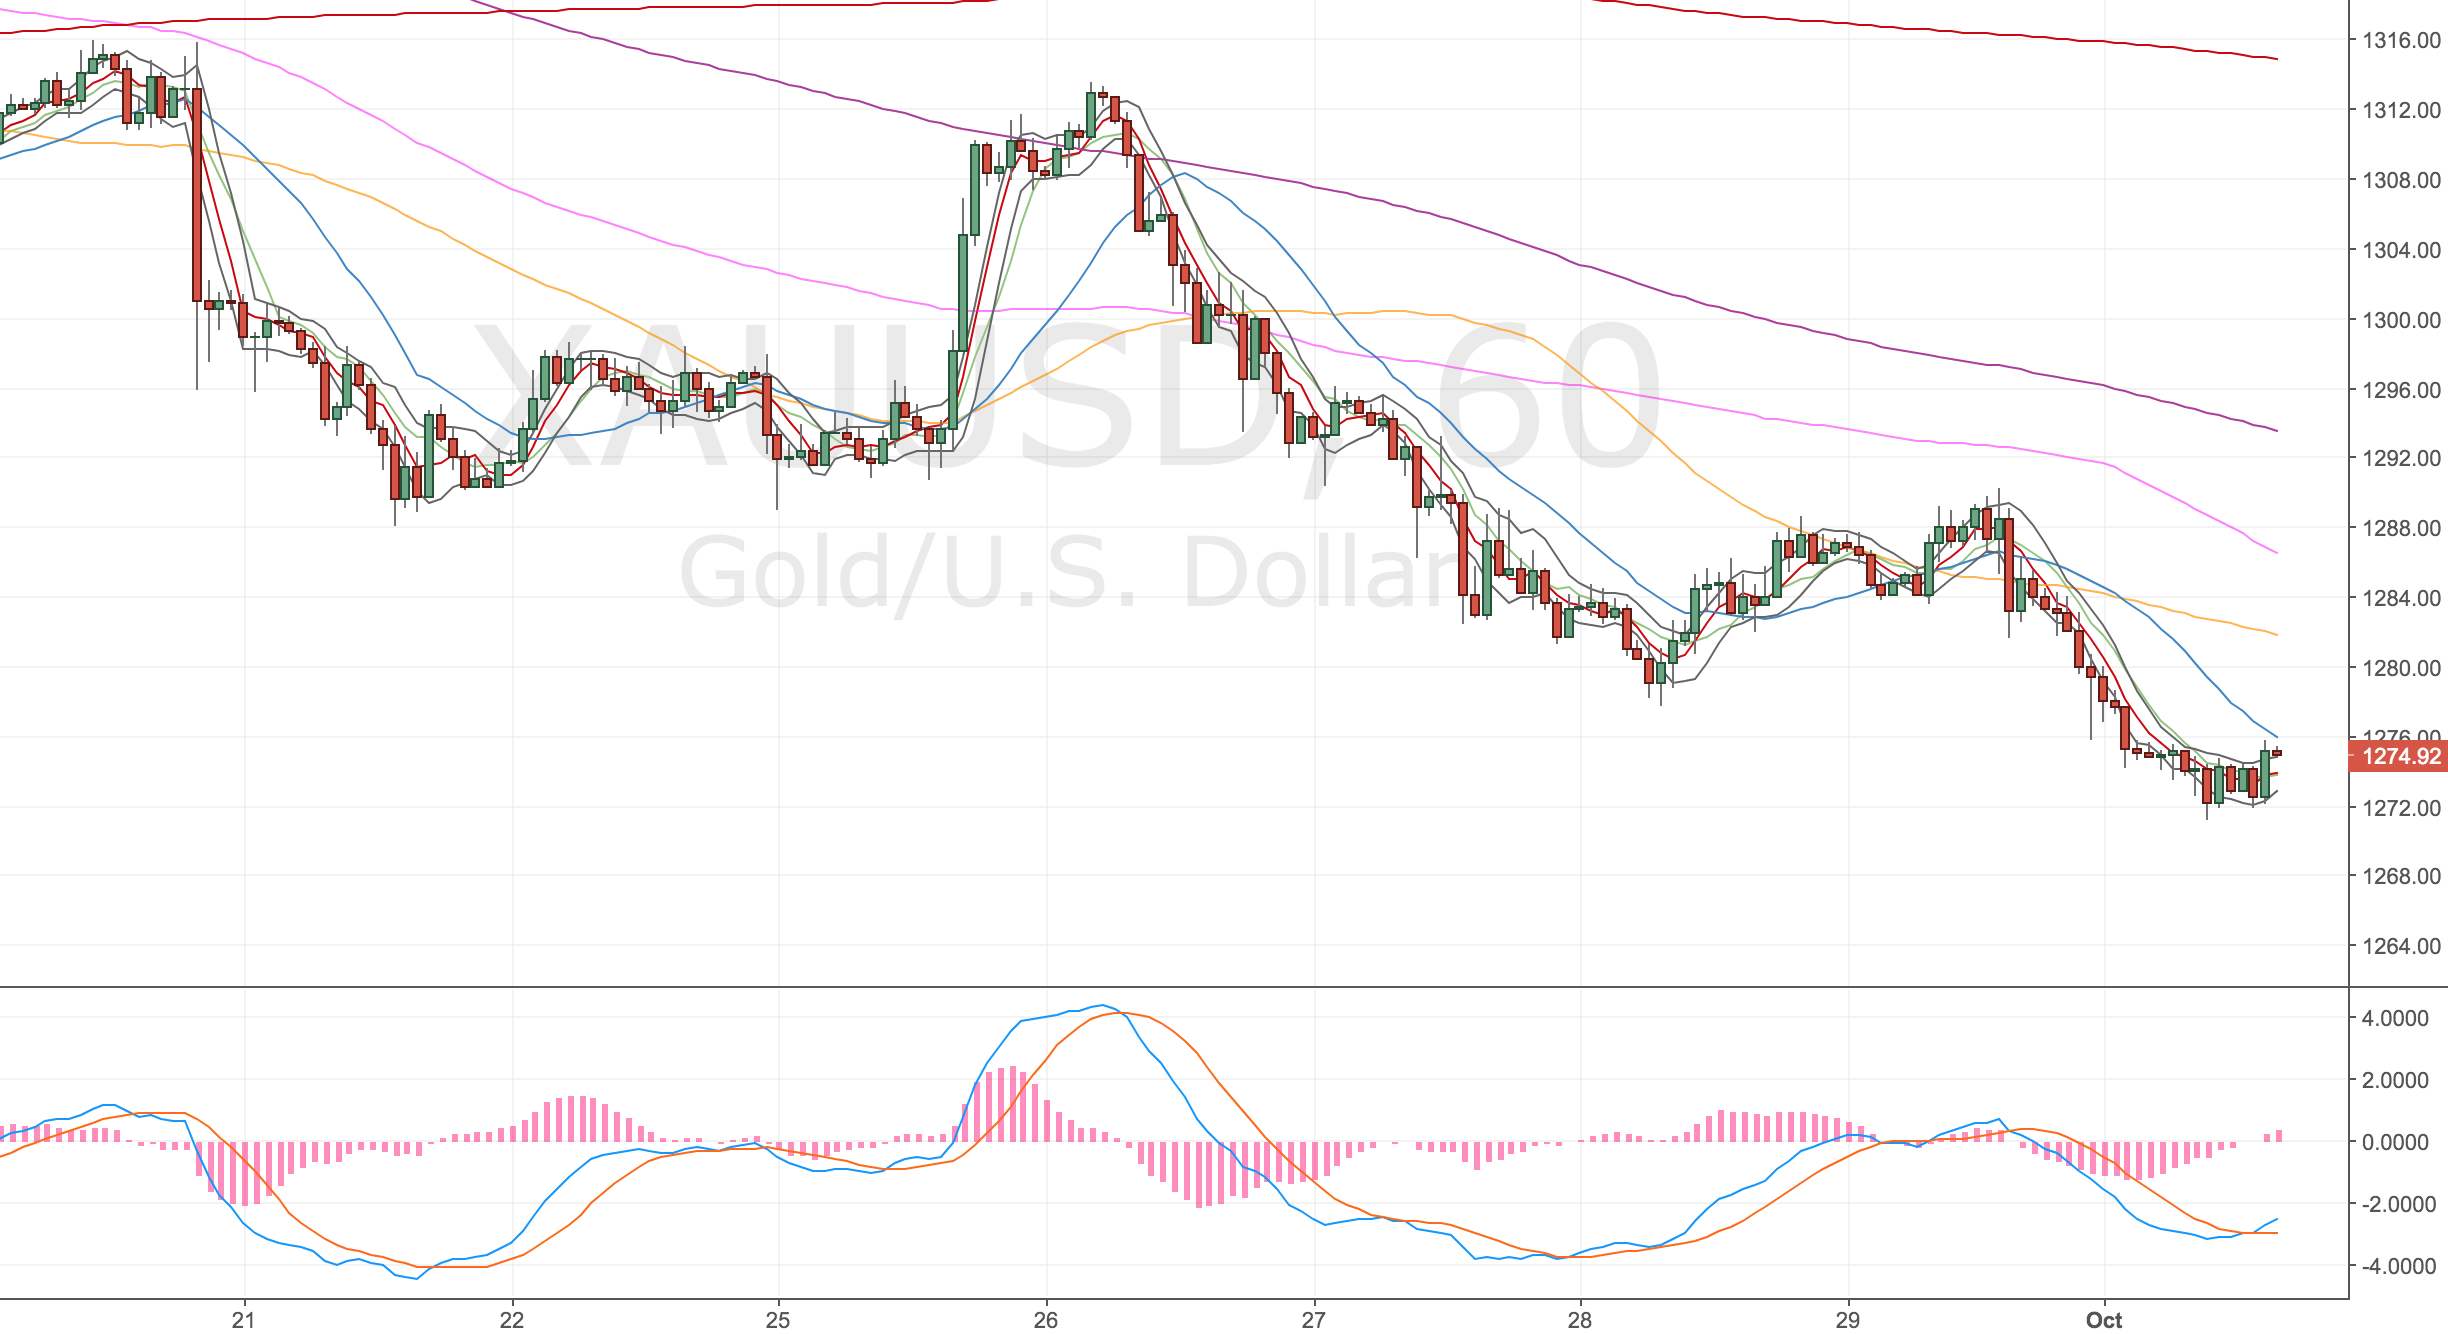
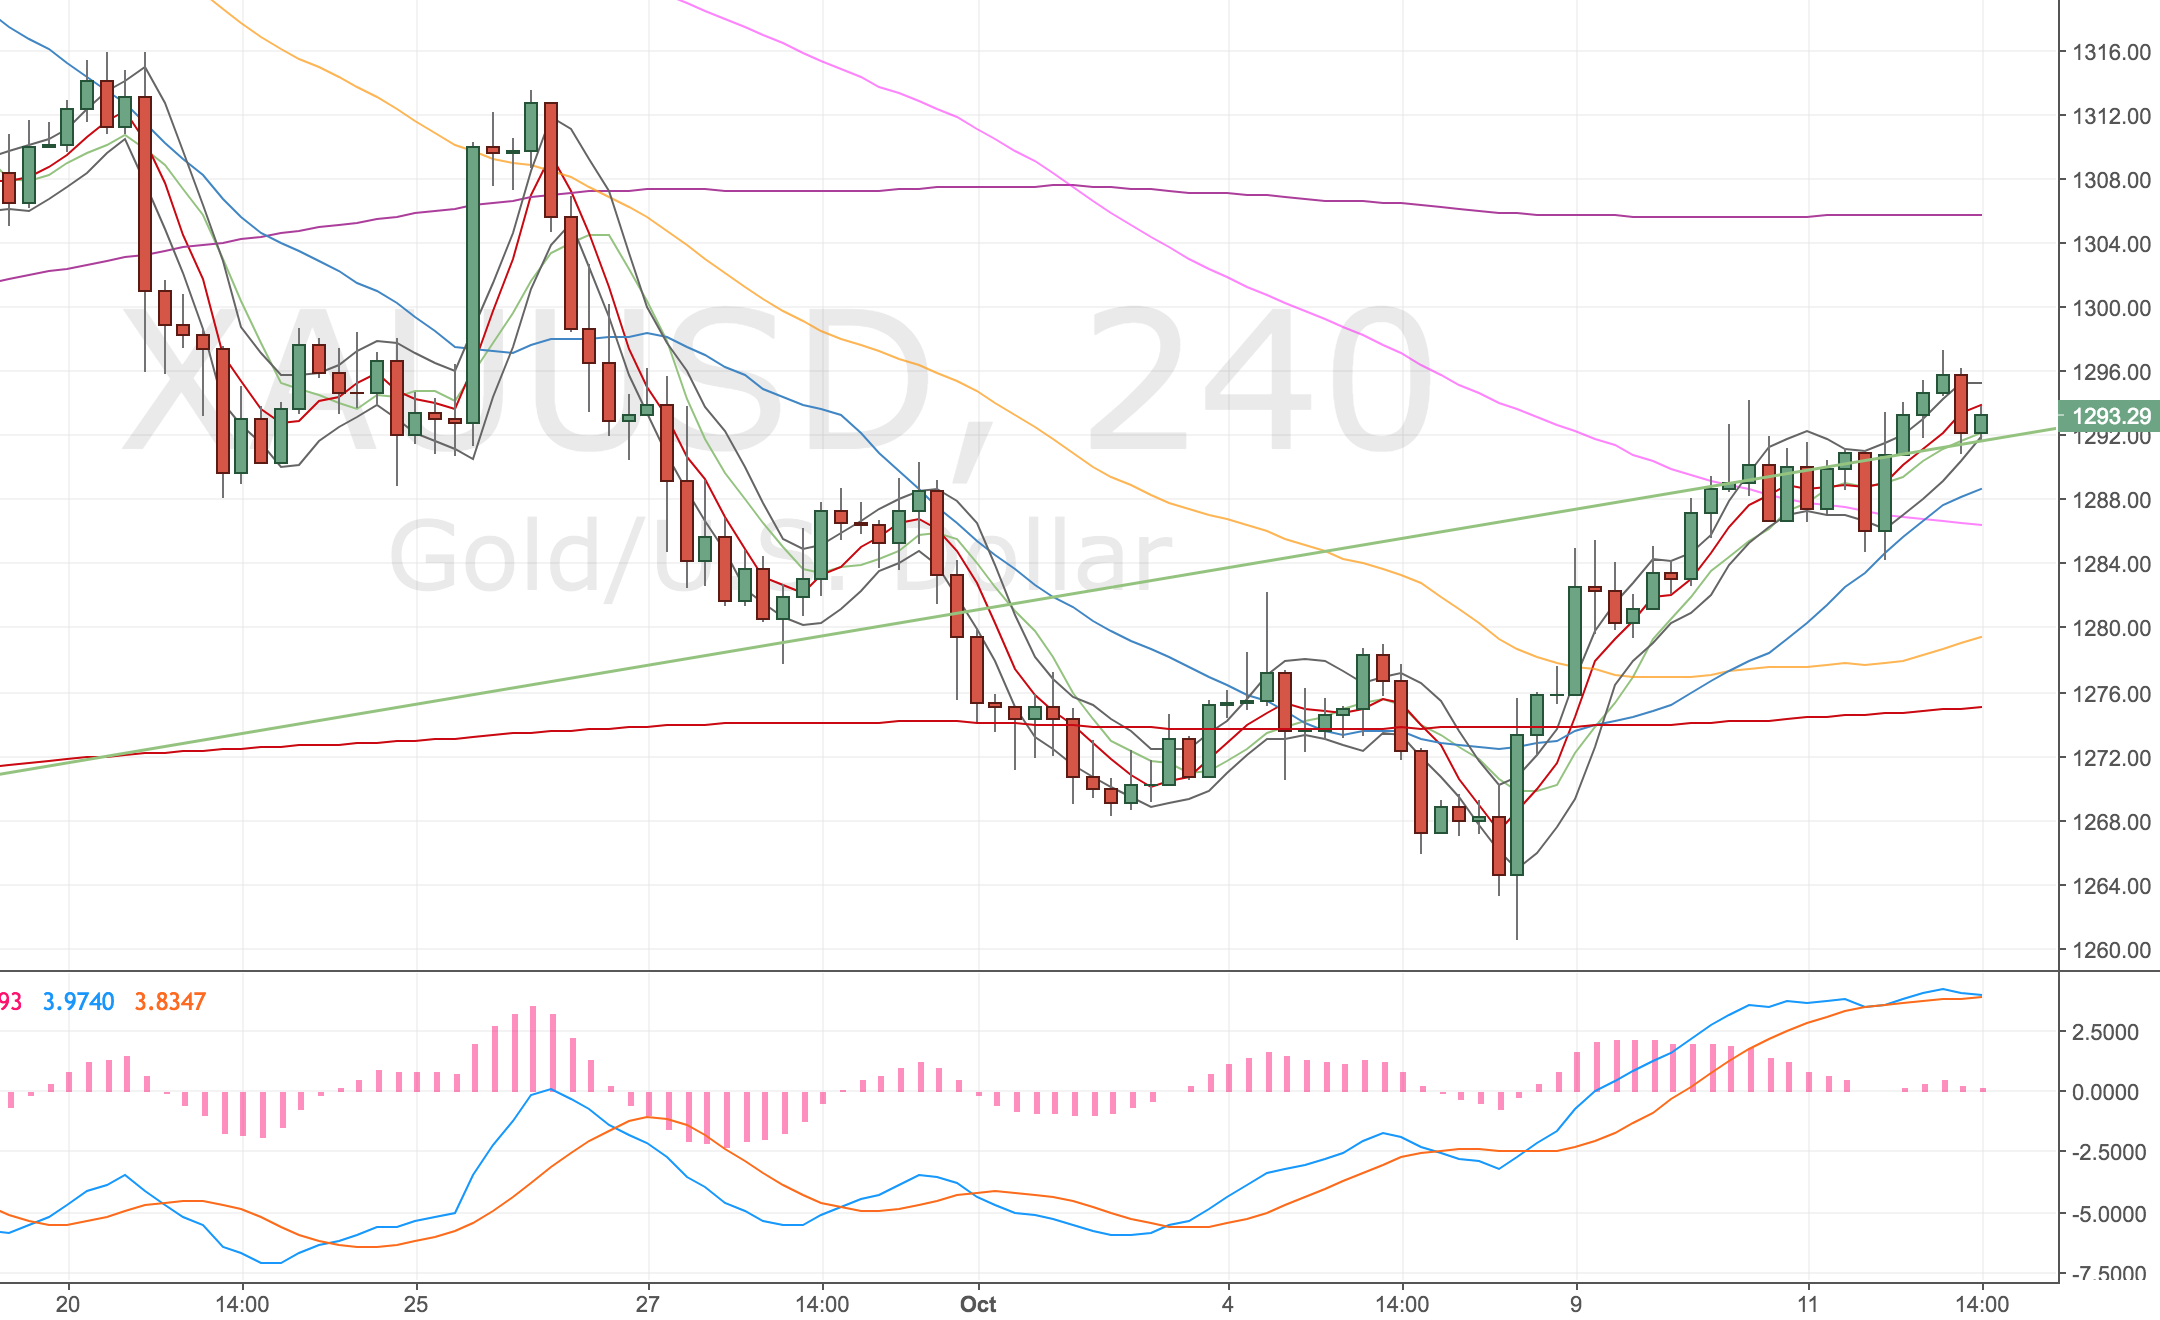
Gold 1h long @ 1222.0, 0.3% risk, result -£21.00
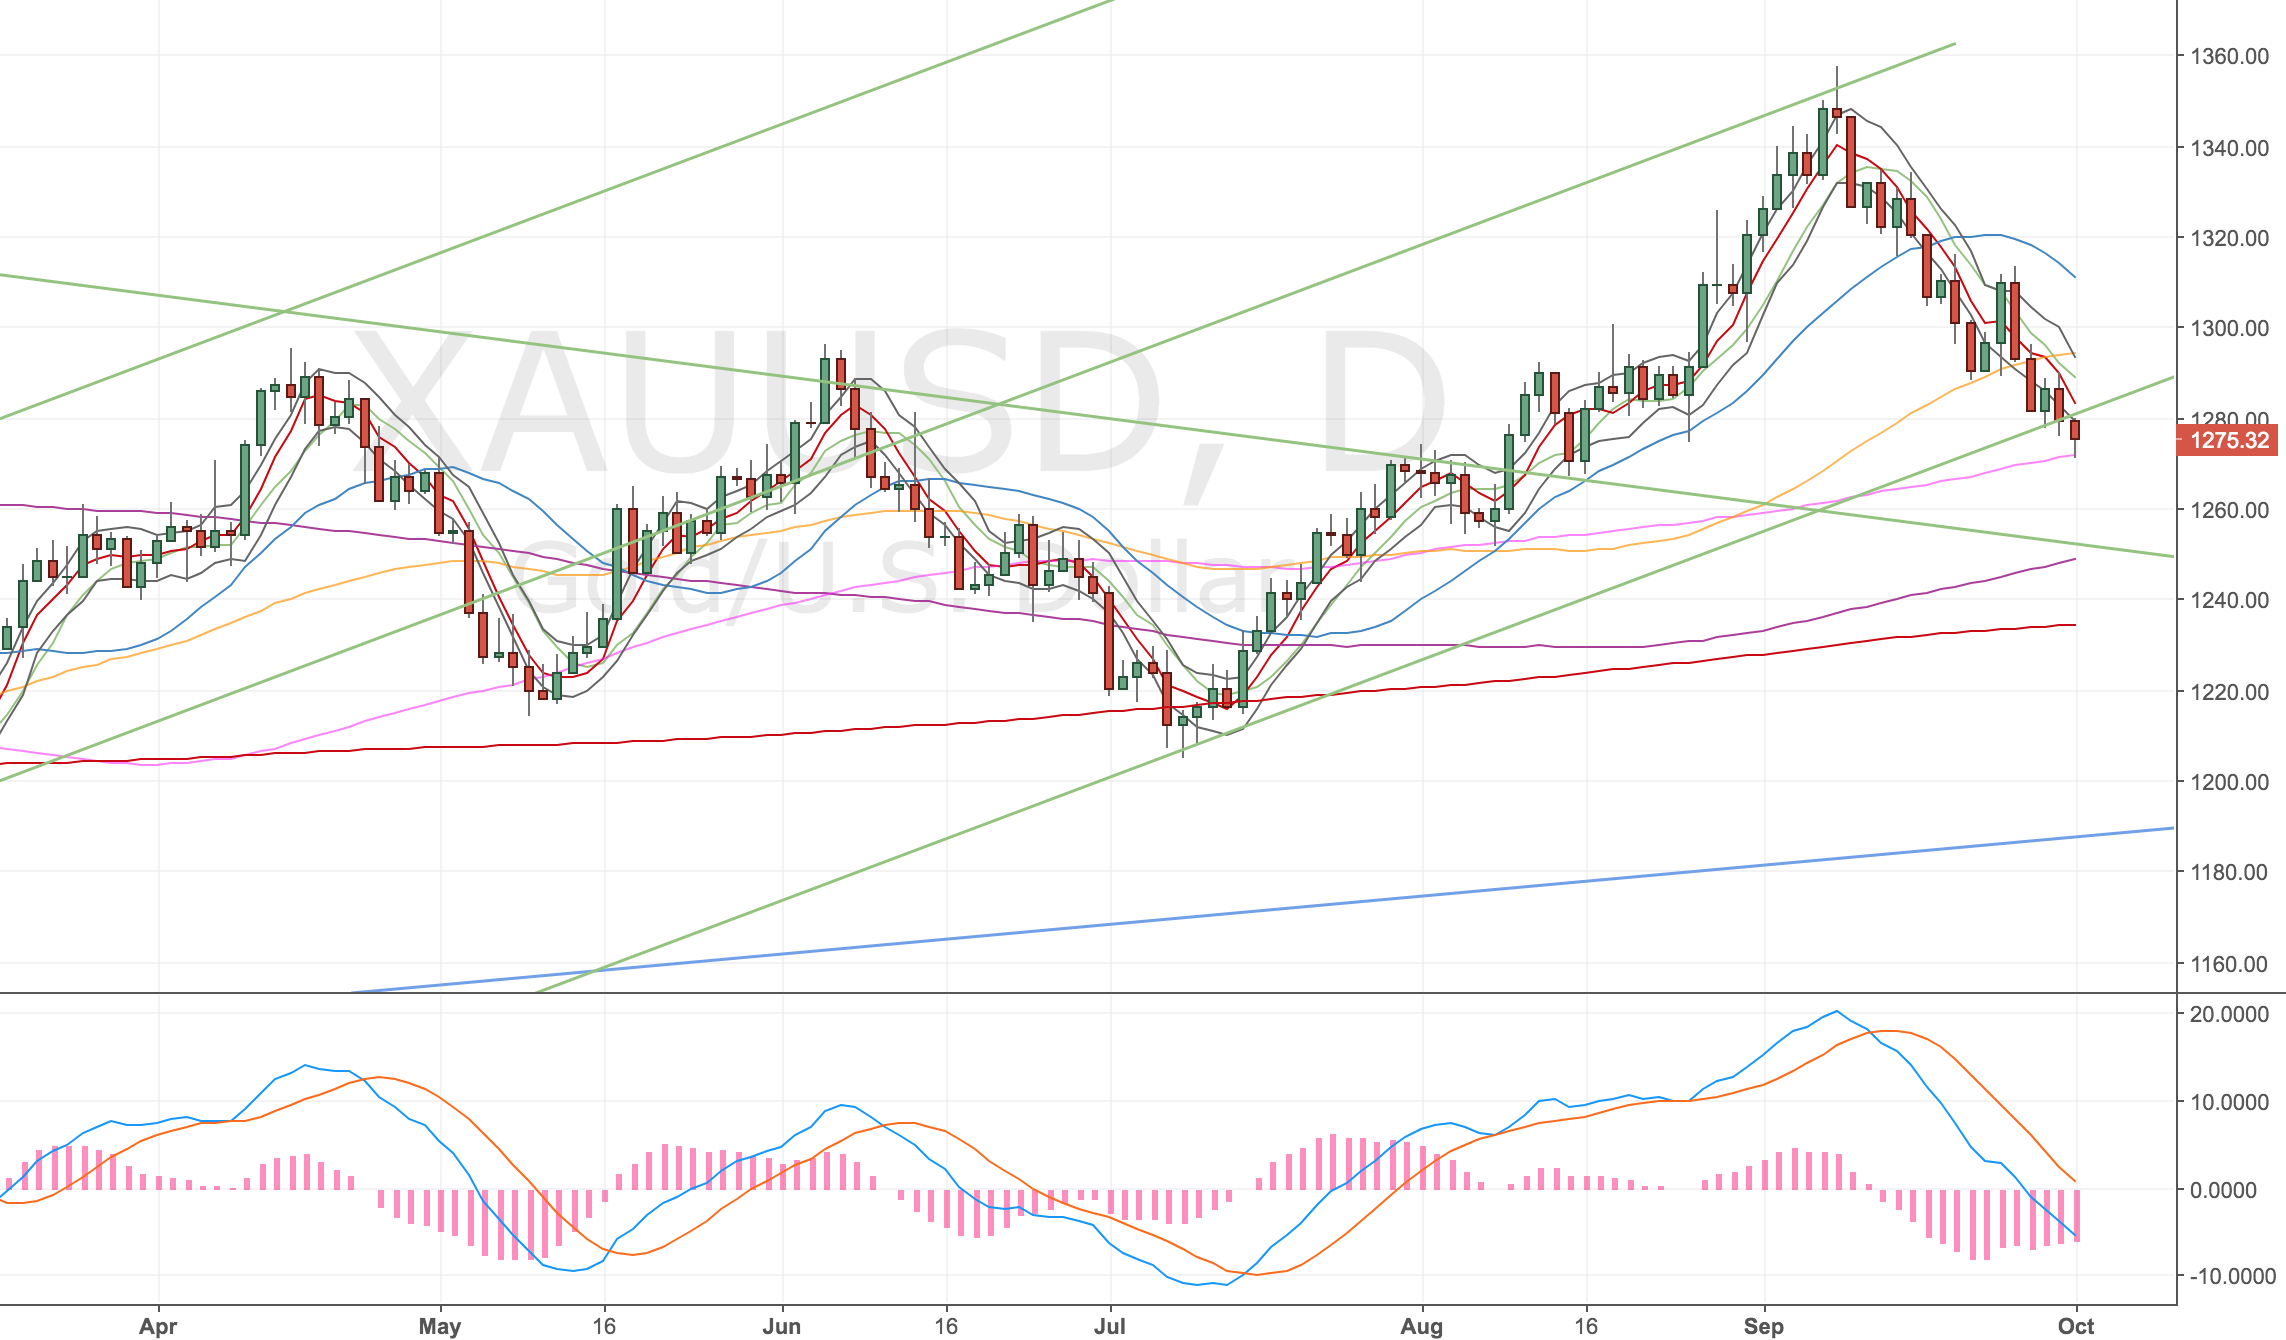
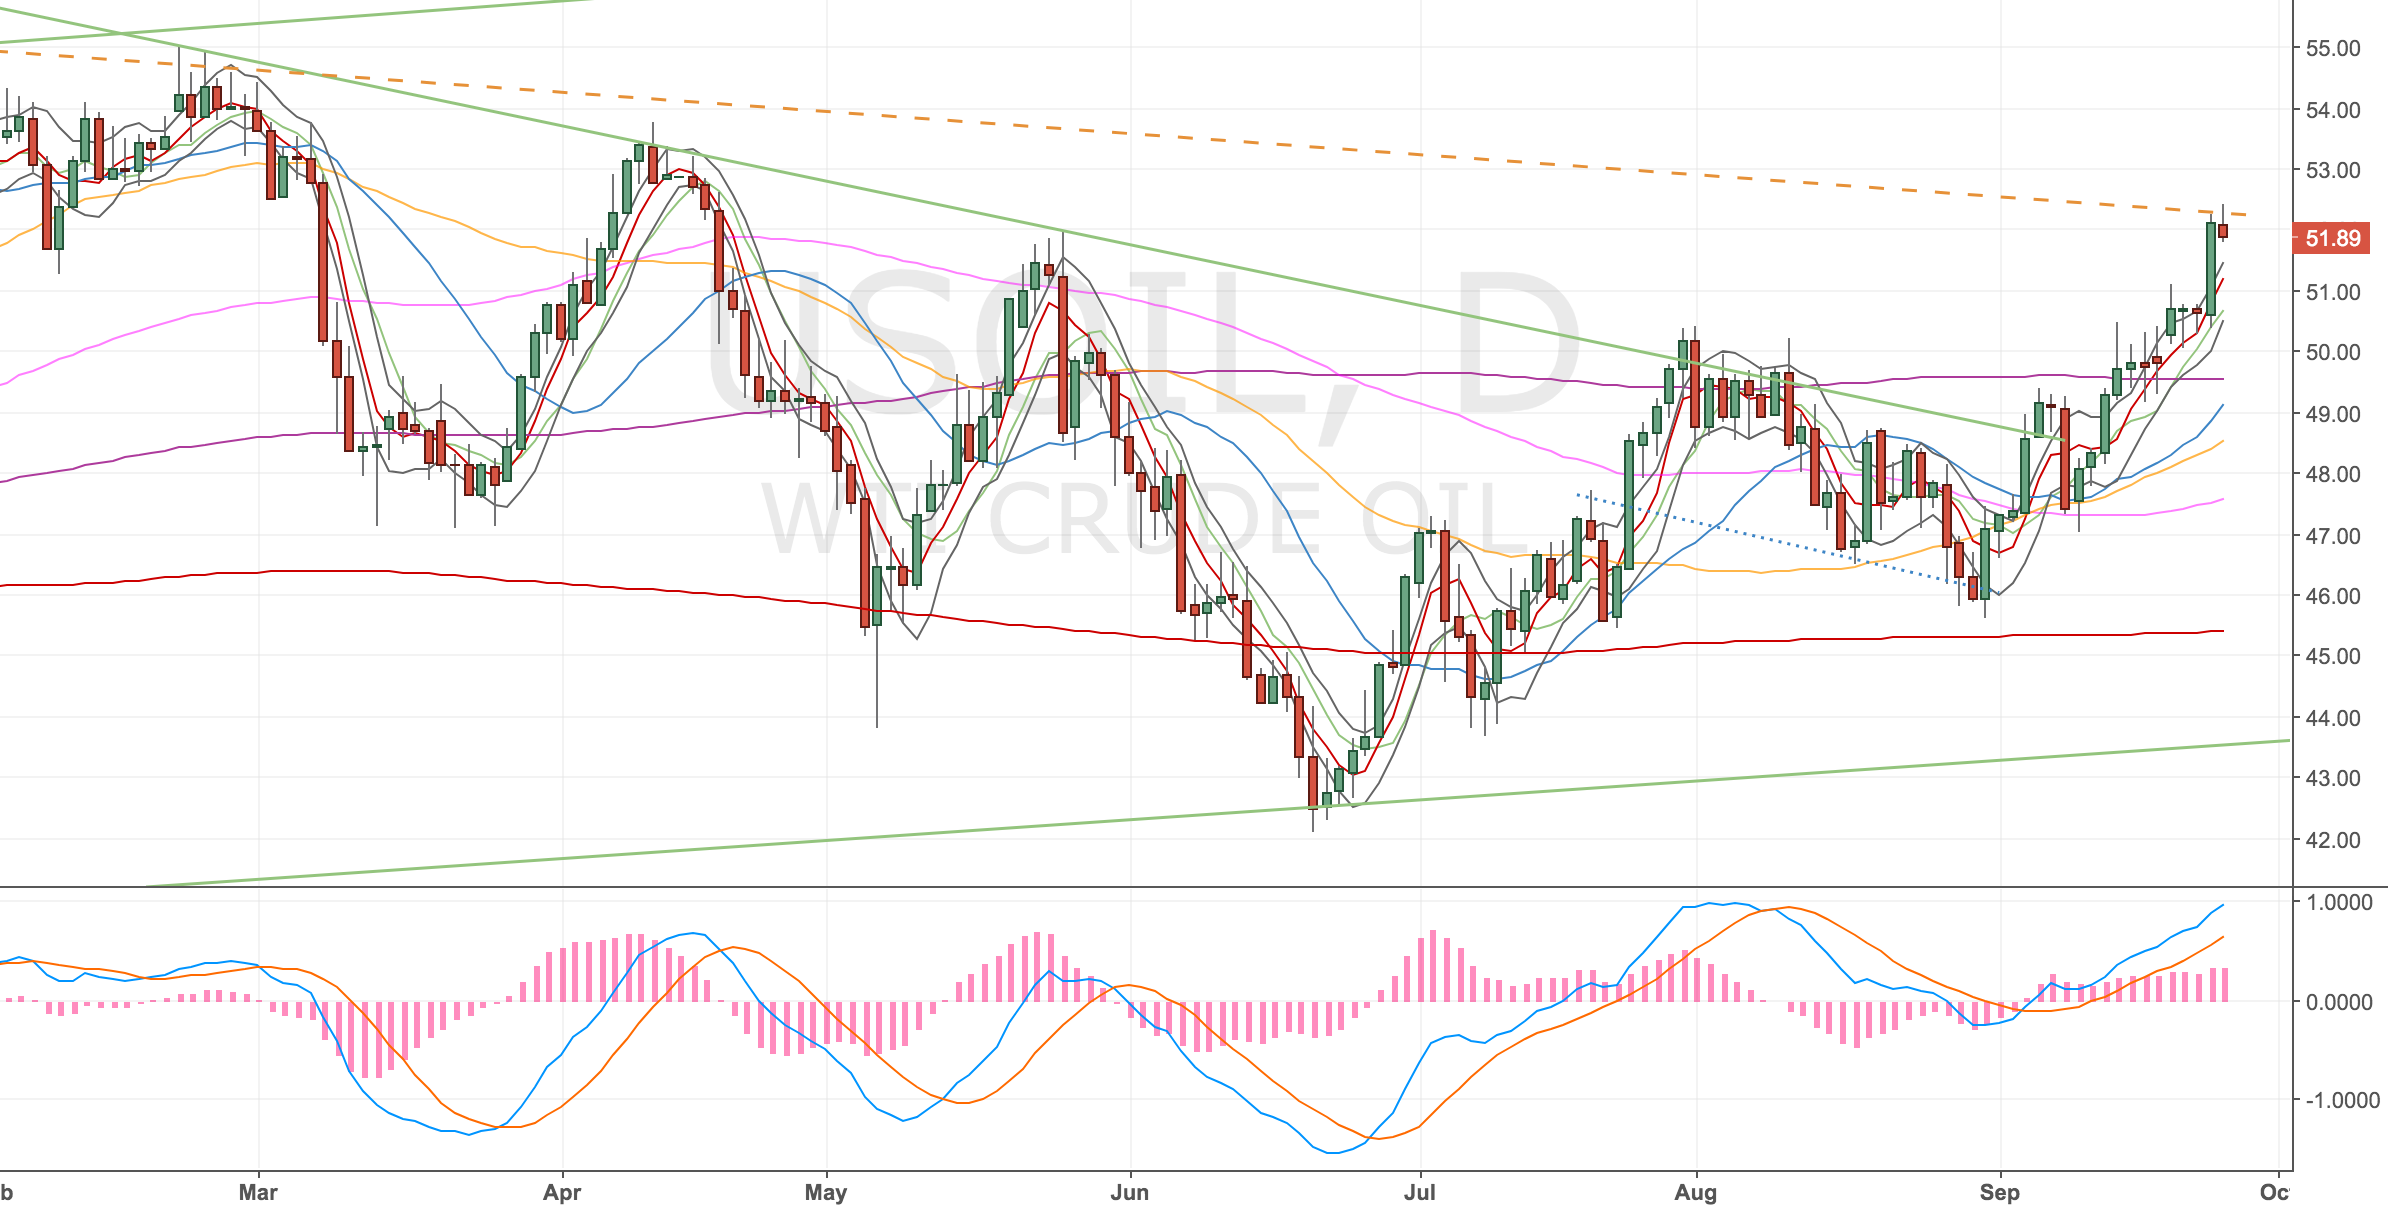
Gold daily chart

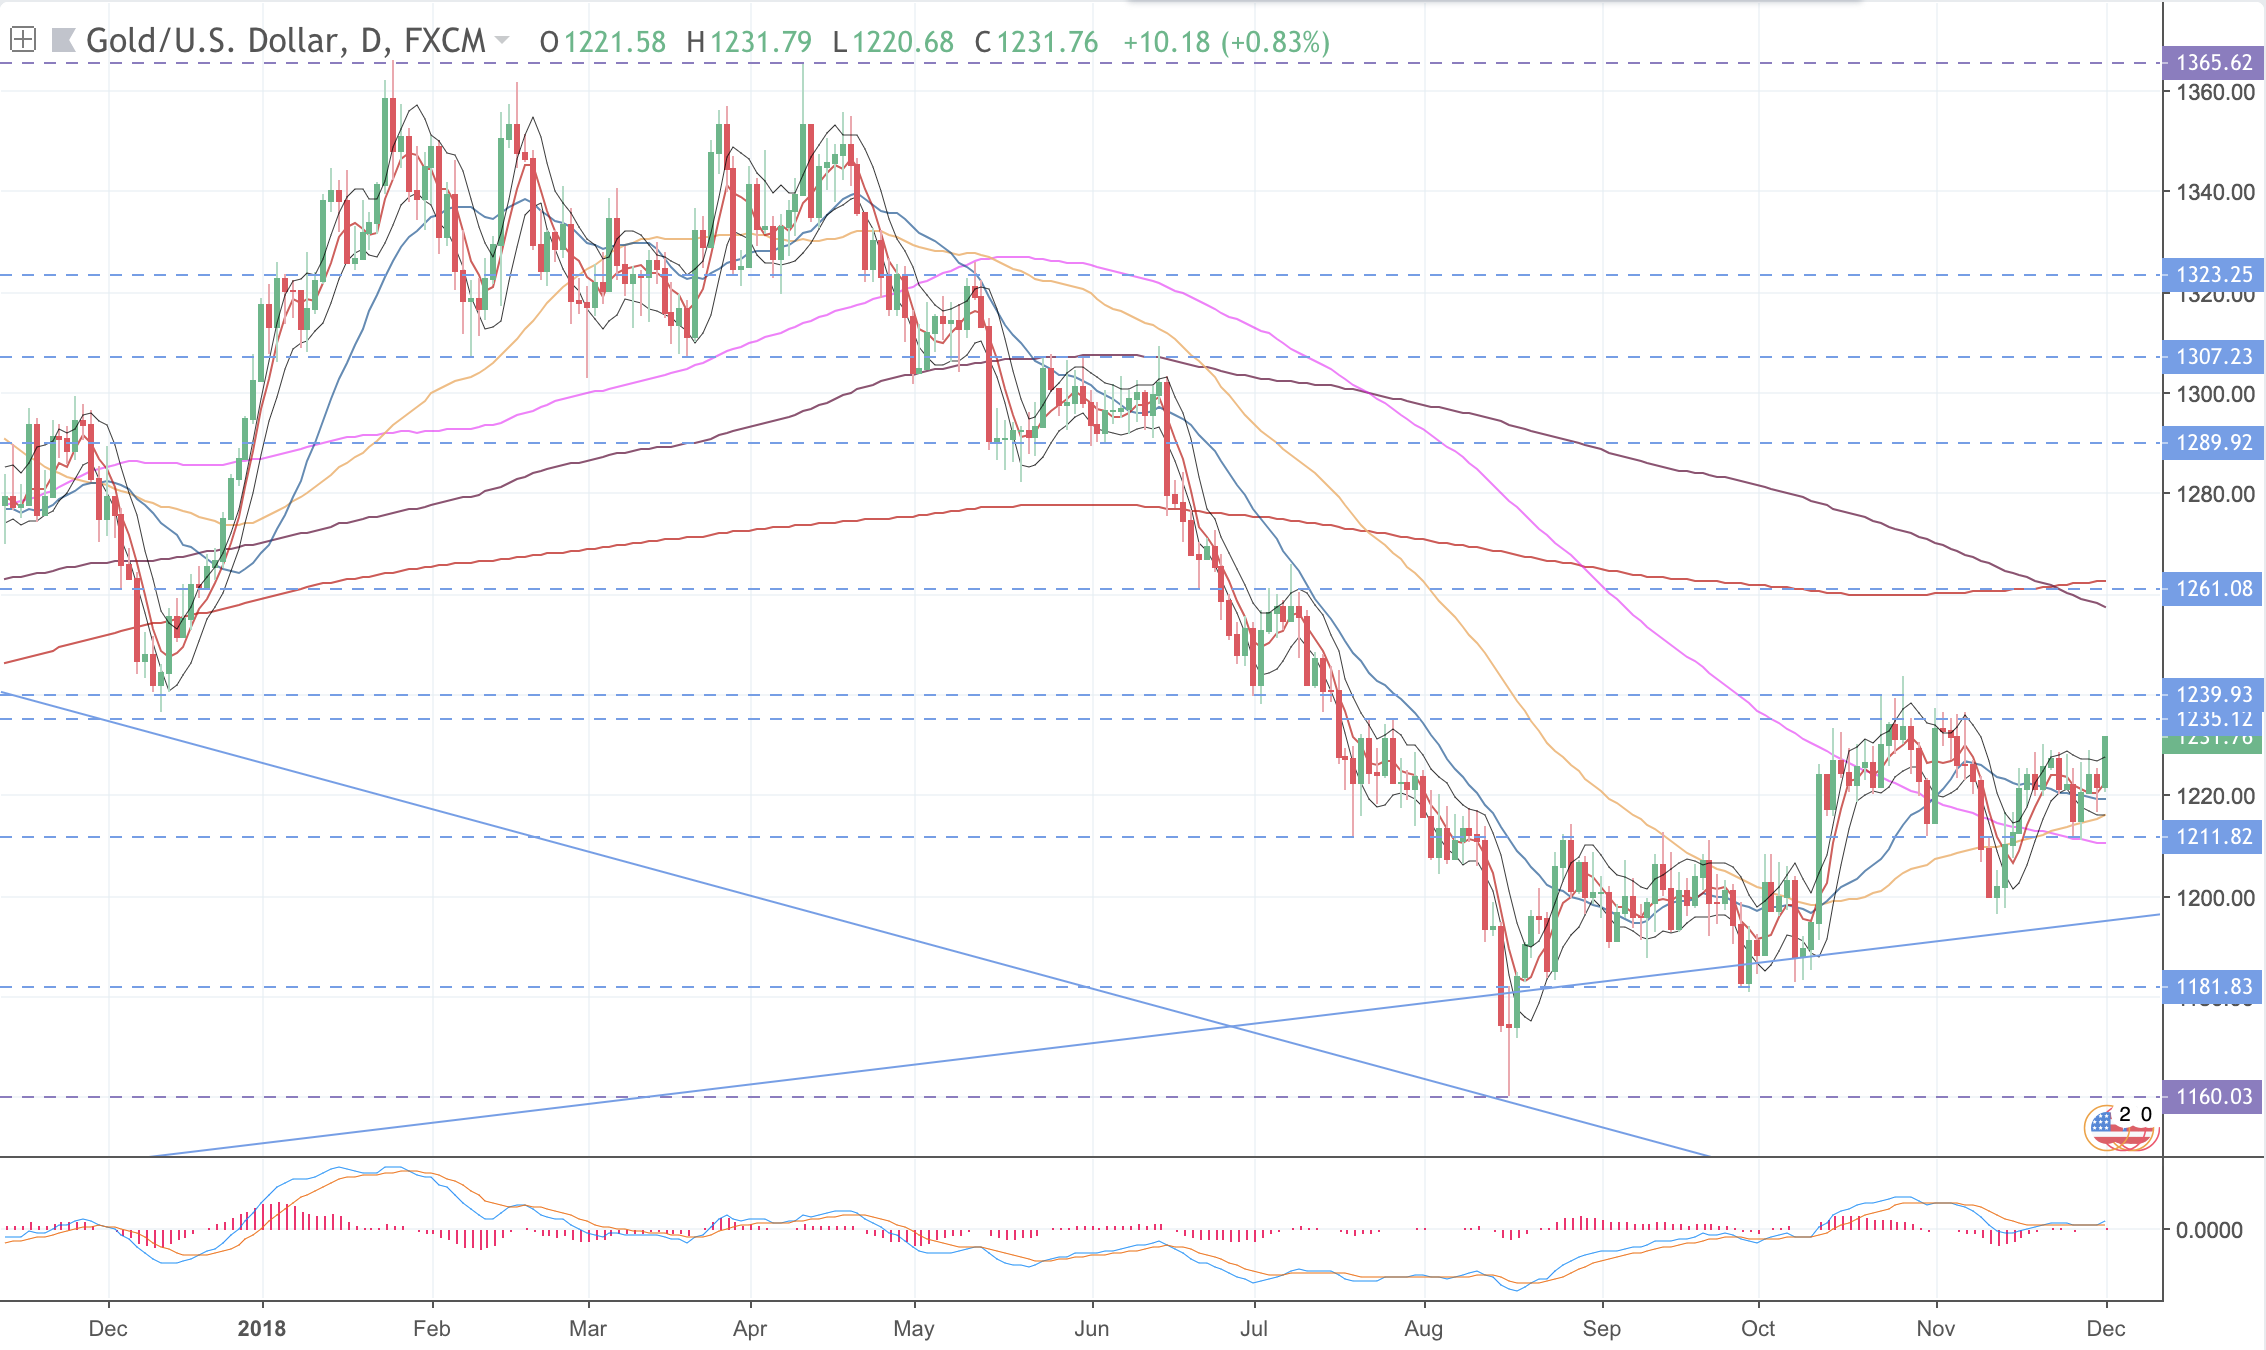
Gold daily chart – 3 Dec 18
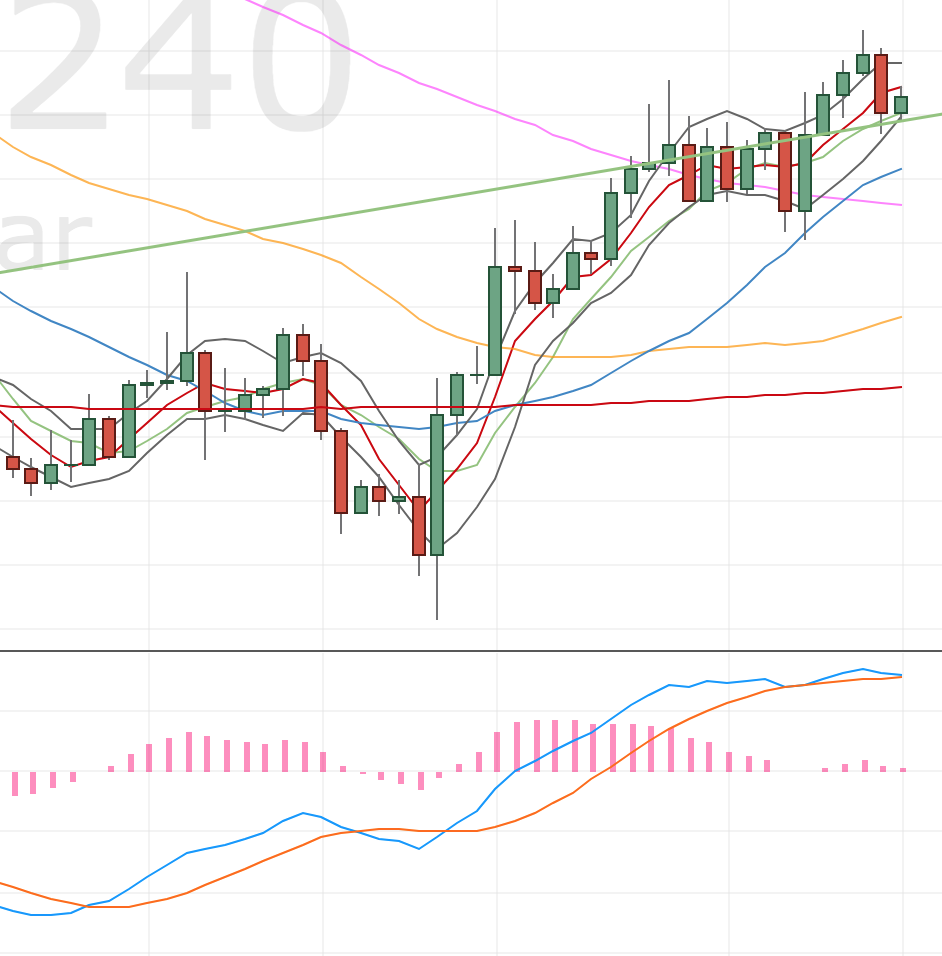
Gold hourly chart

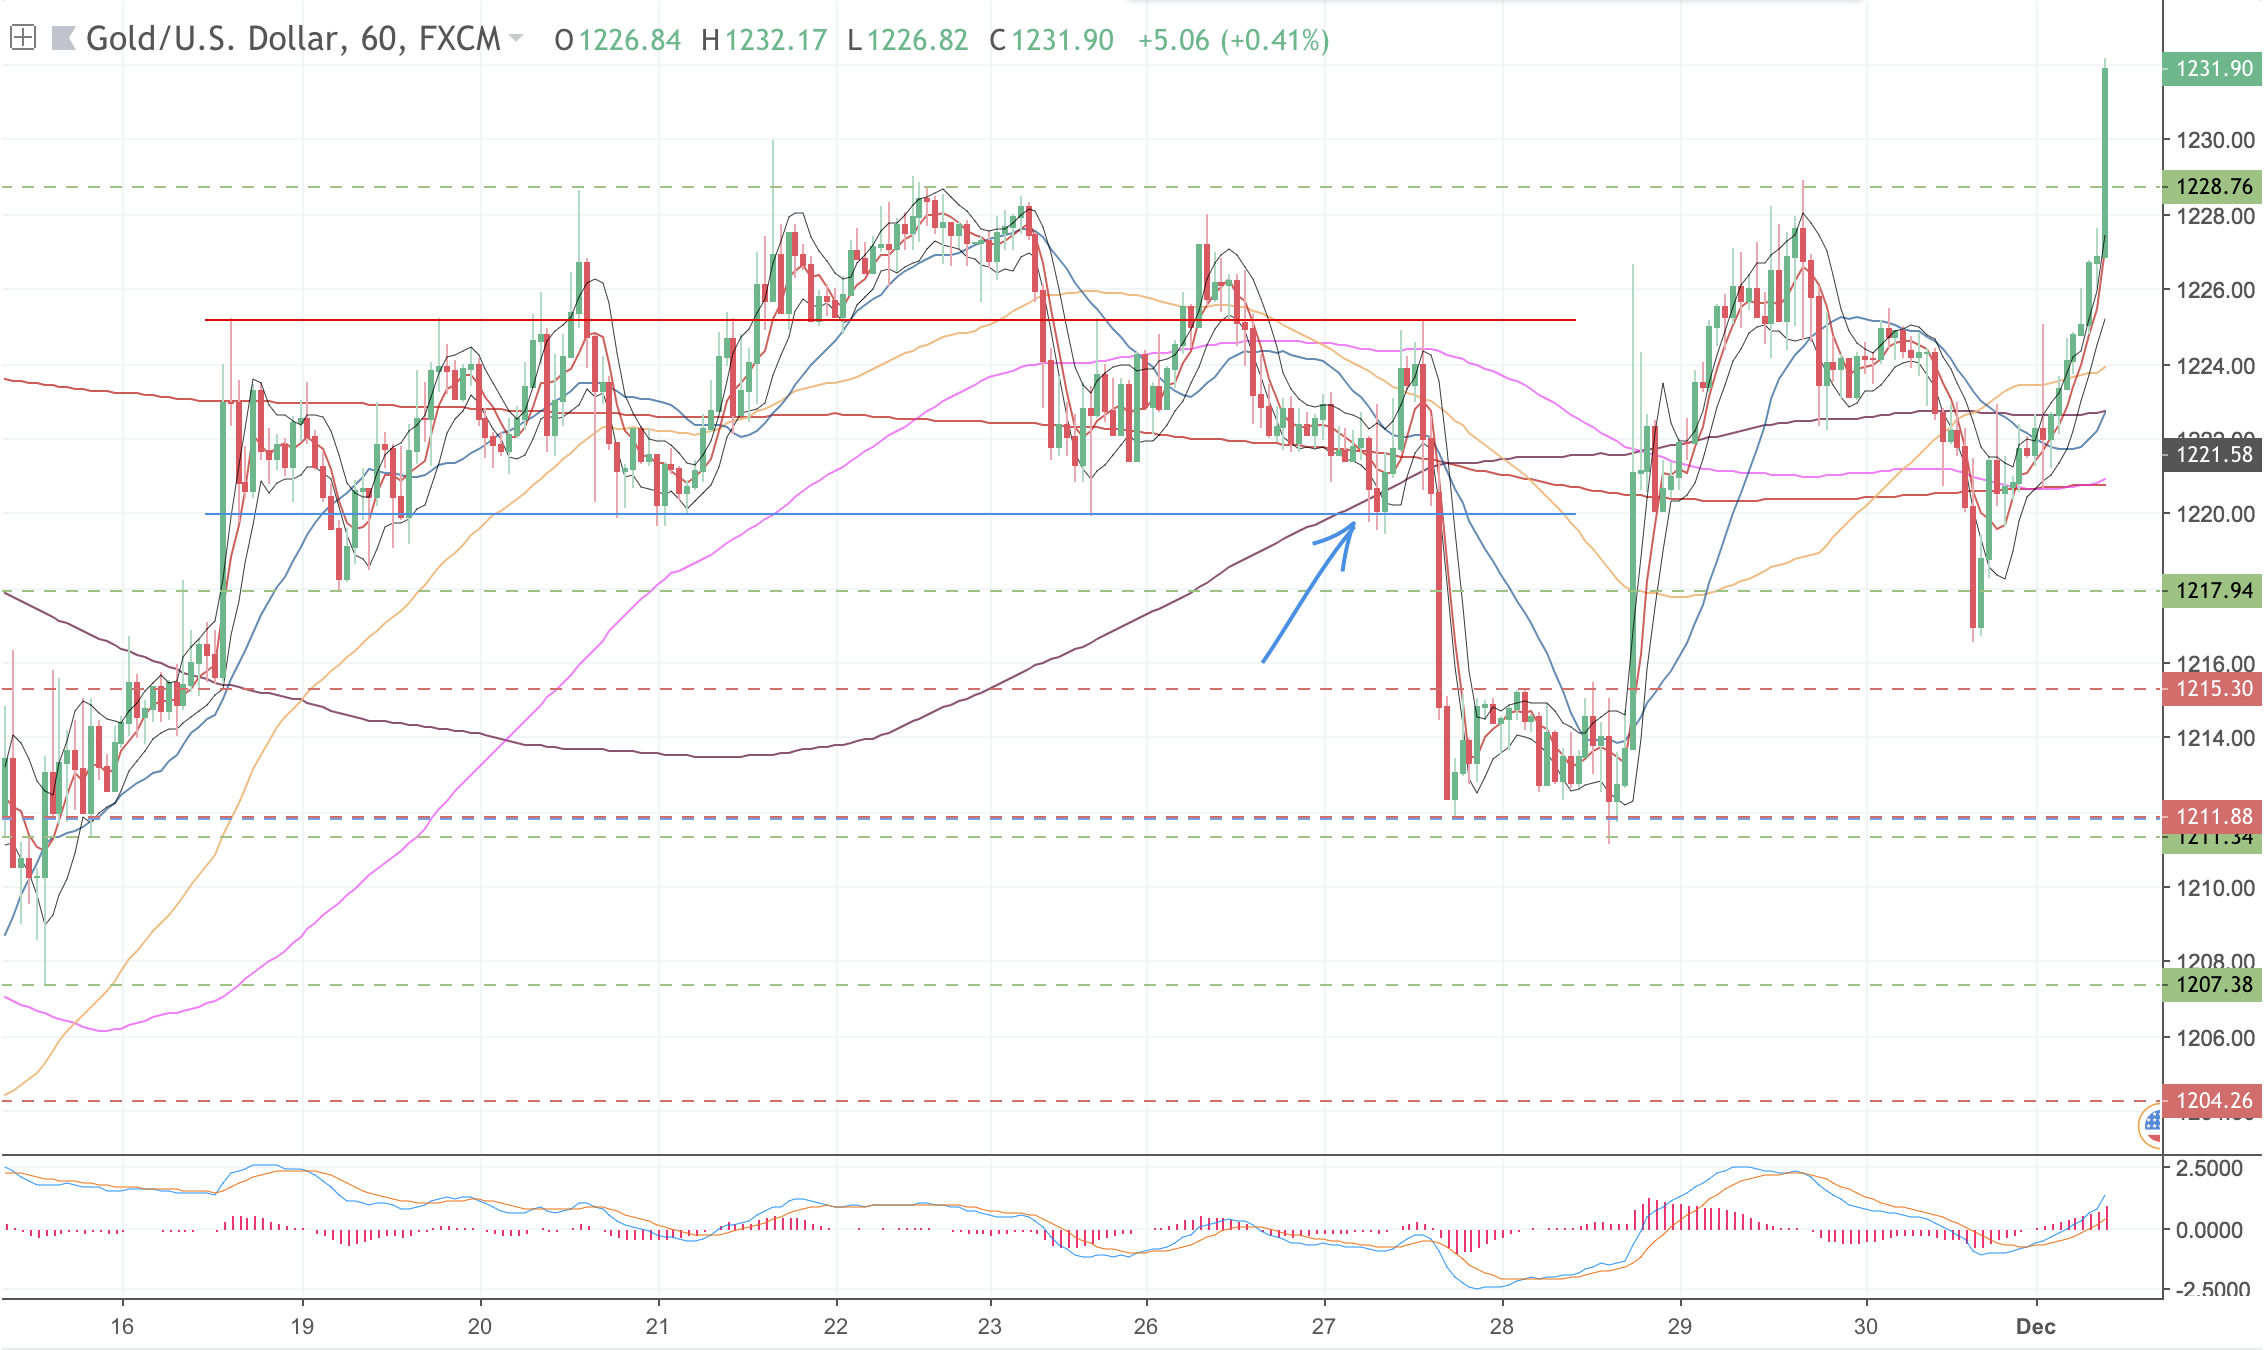
Gold 1h chart – 3 Dec 18

Generally speaking my analysis is usually right but my timing is often wrong 🙂 this is another example of that.

On the daily I’m looking for a retest of the 1235 level (which this morning looks like it’s on the cards). I saw a 1h DST set up into support at the 1h200 (blue solid line). So a reasonable set up. However price went against me first, and then rallied. The subsequent set up wasn’t there.

In retrospect, I should’ve closed part of the position at the next swing point (red solid line) and held the rest for the move higher. Given the size of my position, I’m not too fussed. It was a speculative play. The next swing point at the daily level blue dotted line, didn’t set up a divergence but with the double test would’ve been a nice place to get long. Sometimes I think I need to be a little more flexible, being a higher timeframe of support I should’ve considered this more.

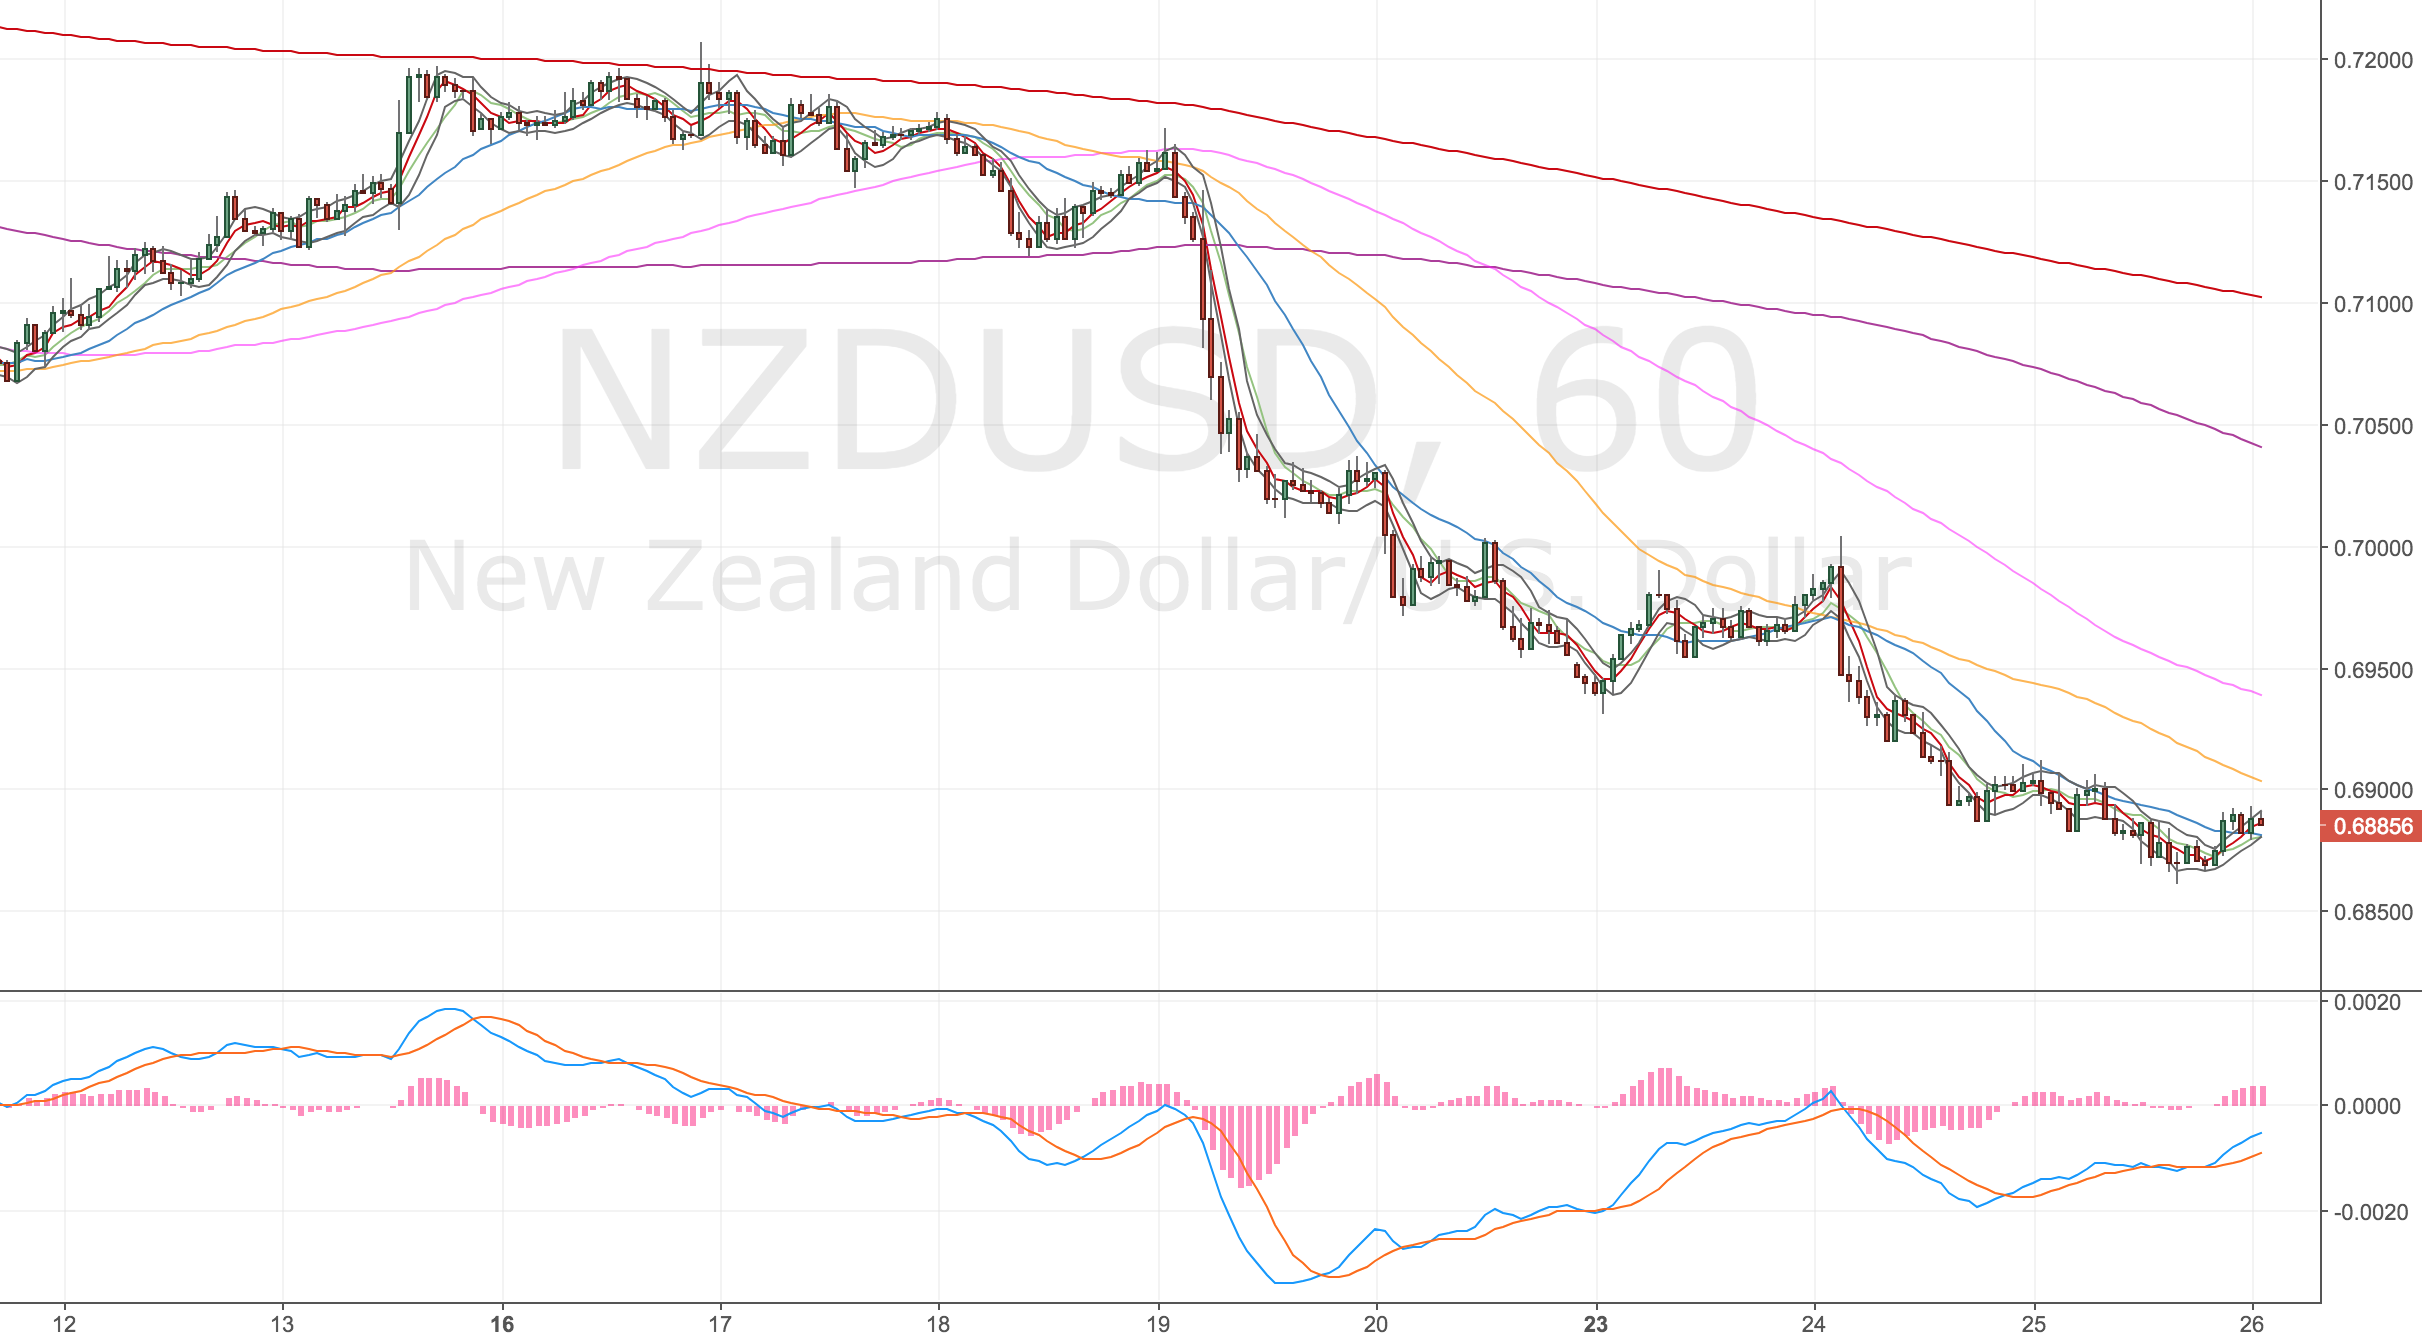
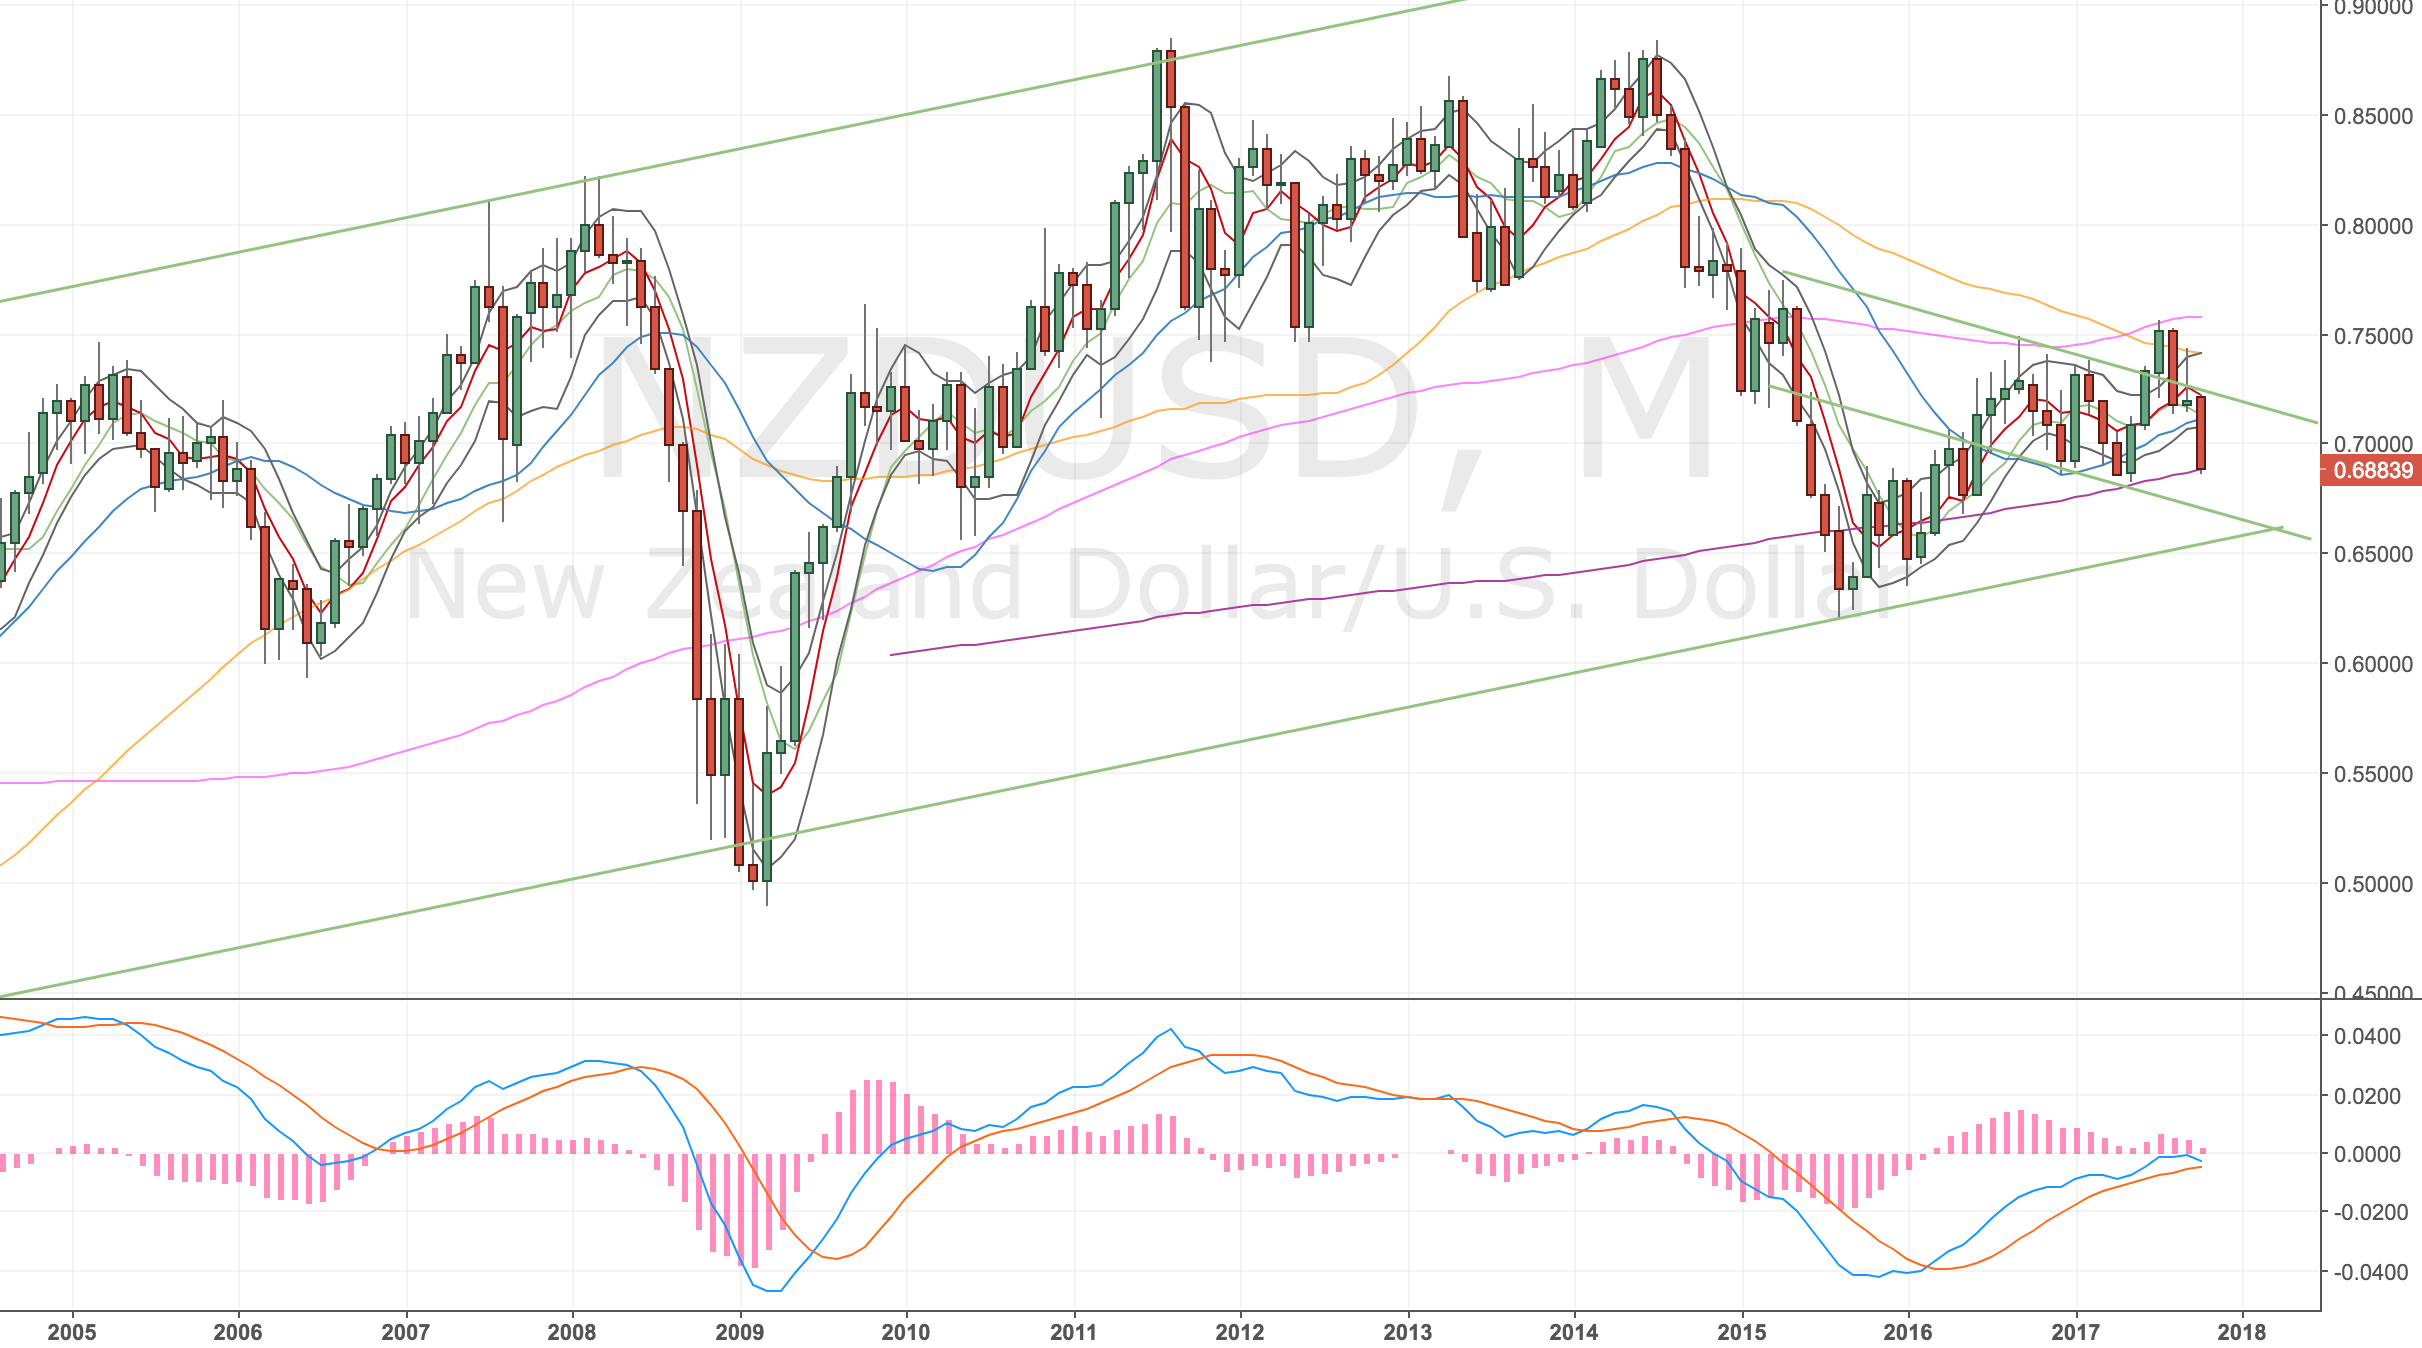
NZDUSD 4h short @ 0.68864, 0.8% risk, result -£91.72 !

This is annoying I got slipped on this trade over the weekend by 32 pips. Not a huge move and sometimes it works in your favour like my last NZDUSD short, but still ended up being a 1.45% risk trade.

In review I think I moved my daily resistance level too soon to the last high and there wasn’t any significant swing points to put emphasis on this level. The 4H price action was just not really budging, I think I felt the writing was on the wall for this one, especially as we had a decent move down on the last swing. Maybe I should’ve waited for a fresh divergence set up to get short.

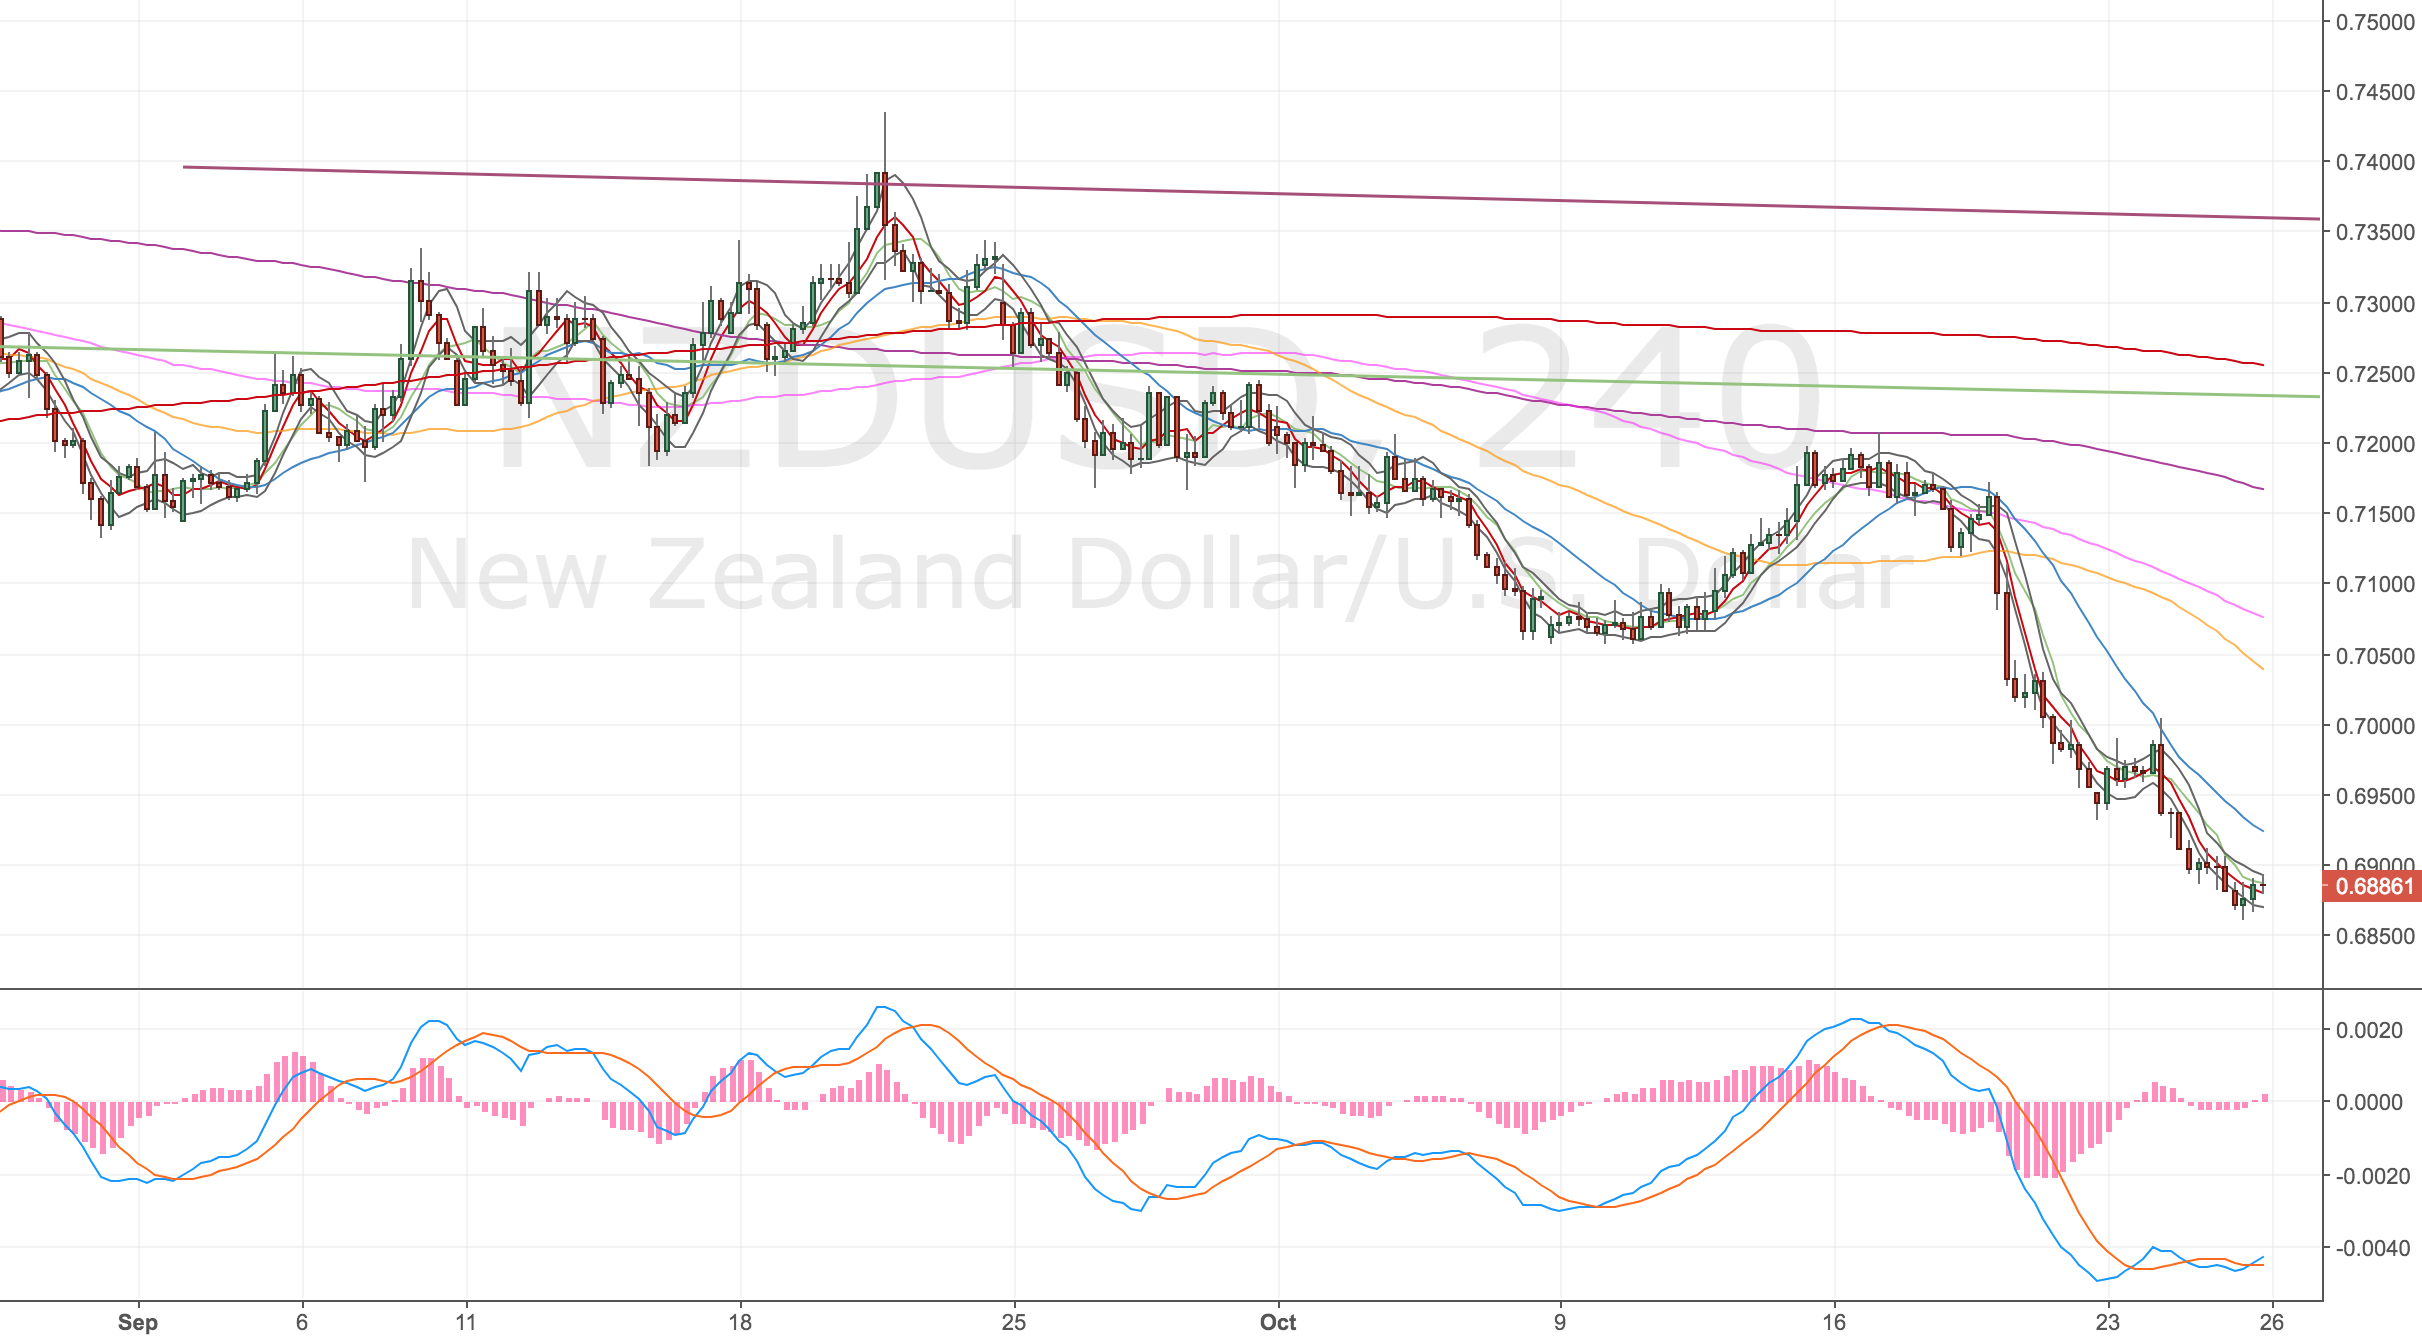
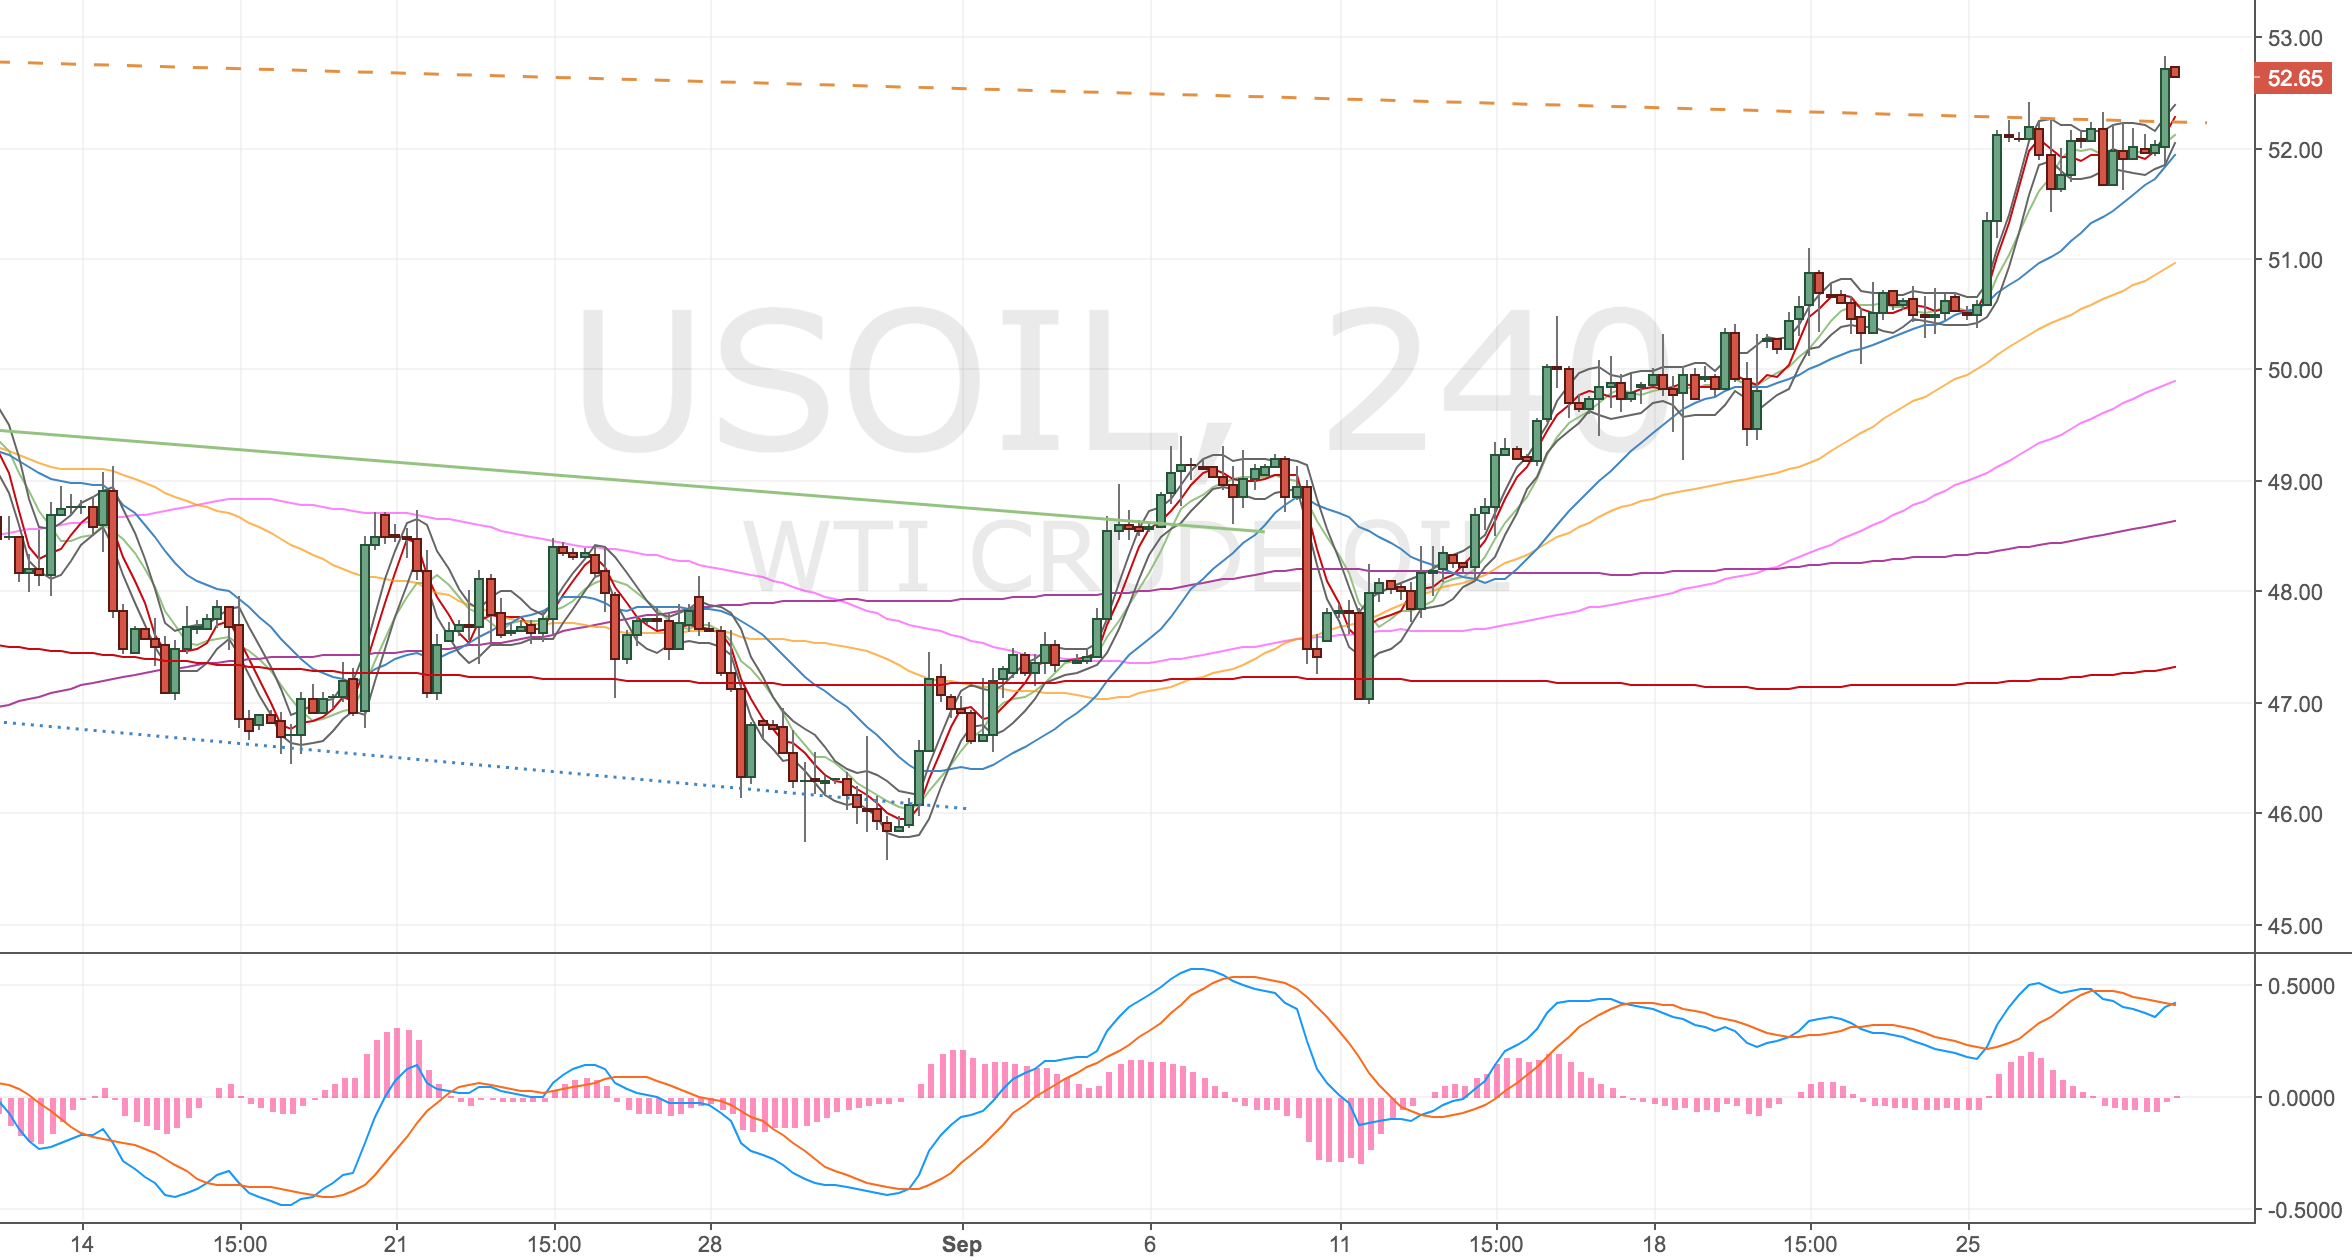
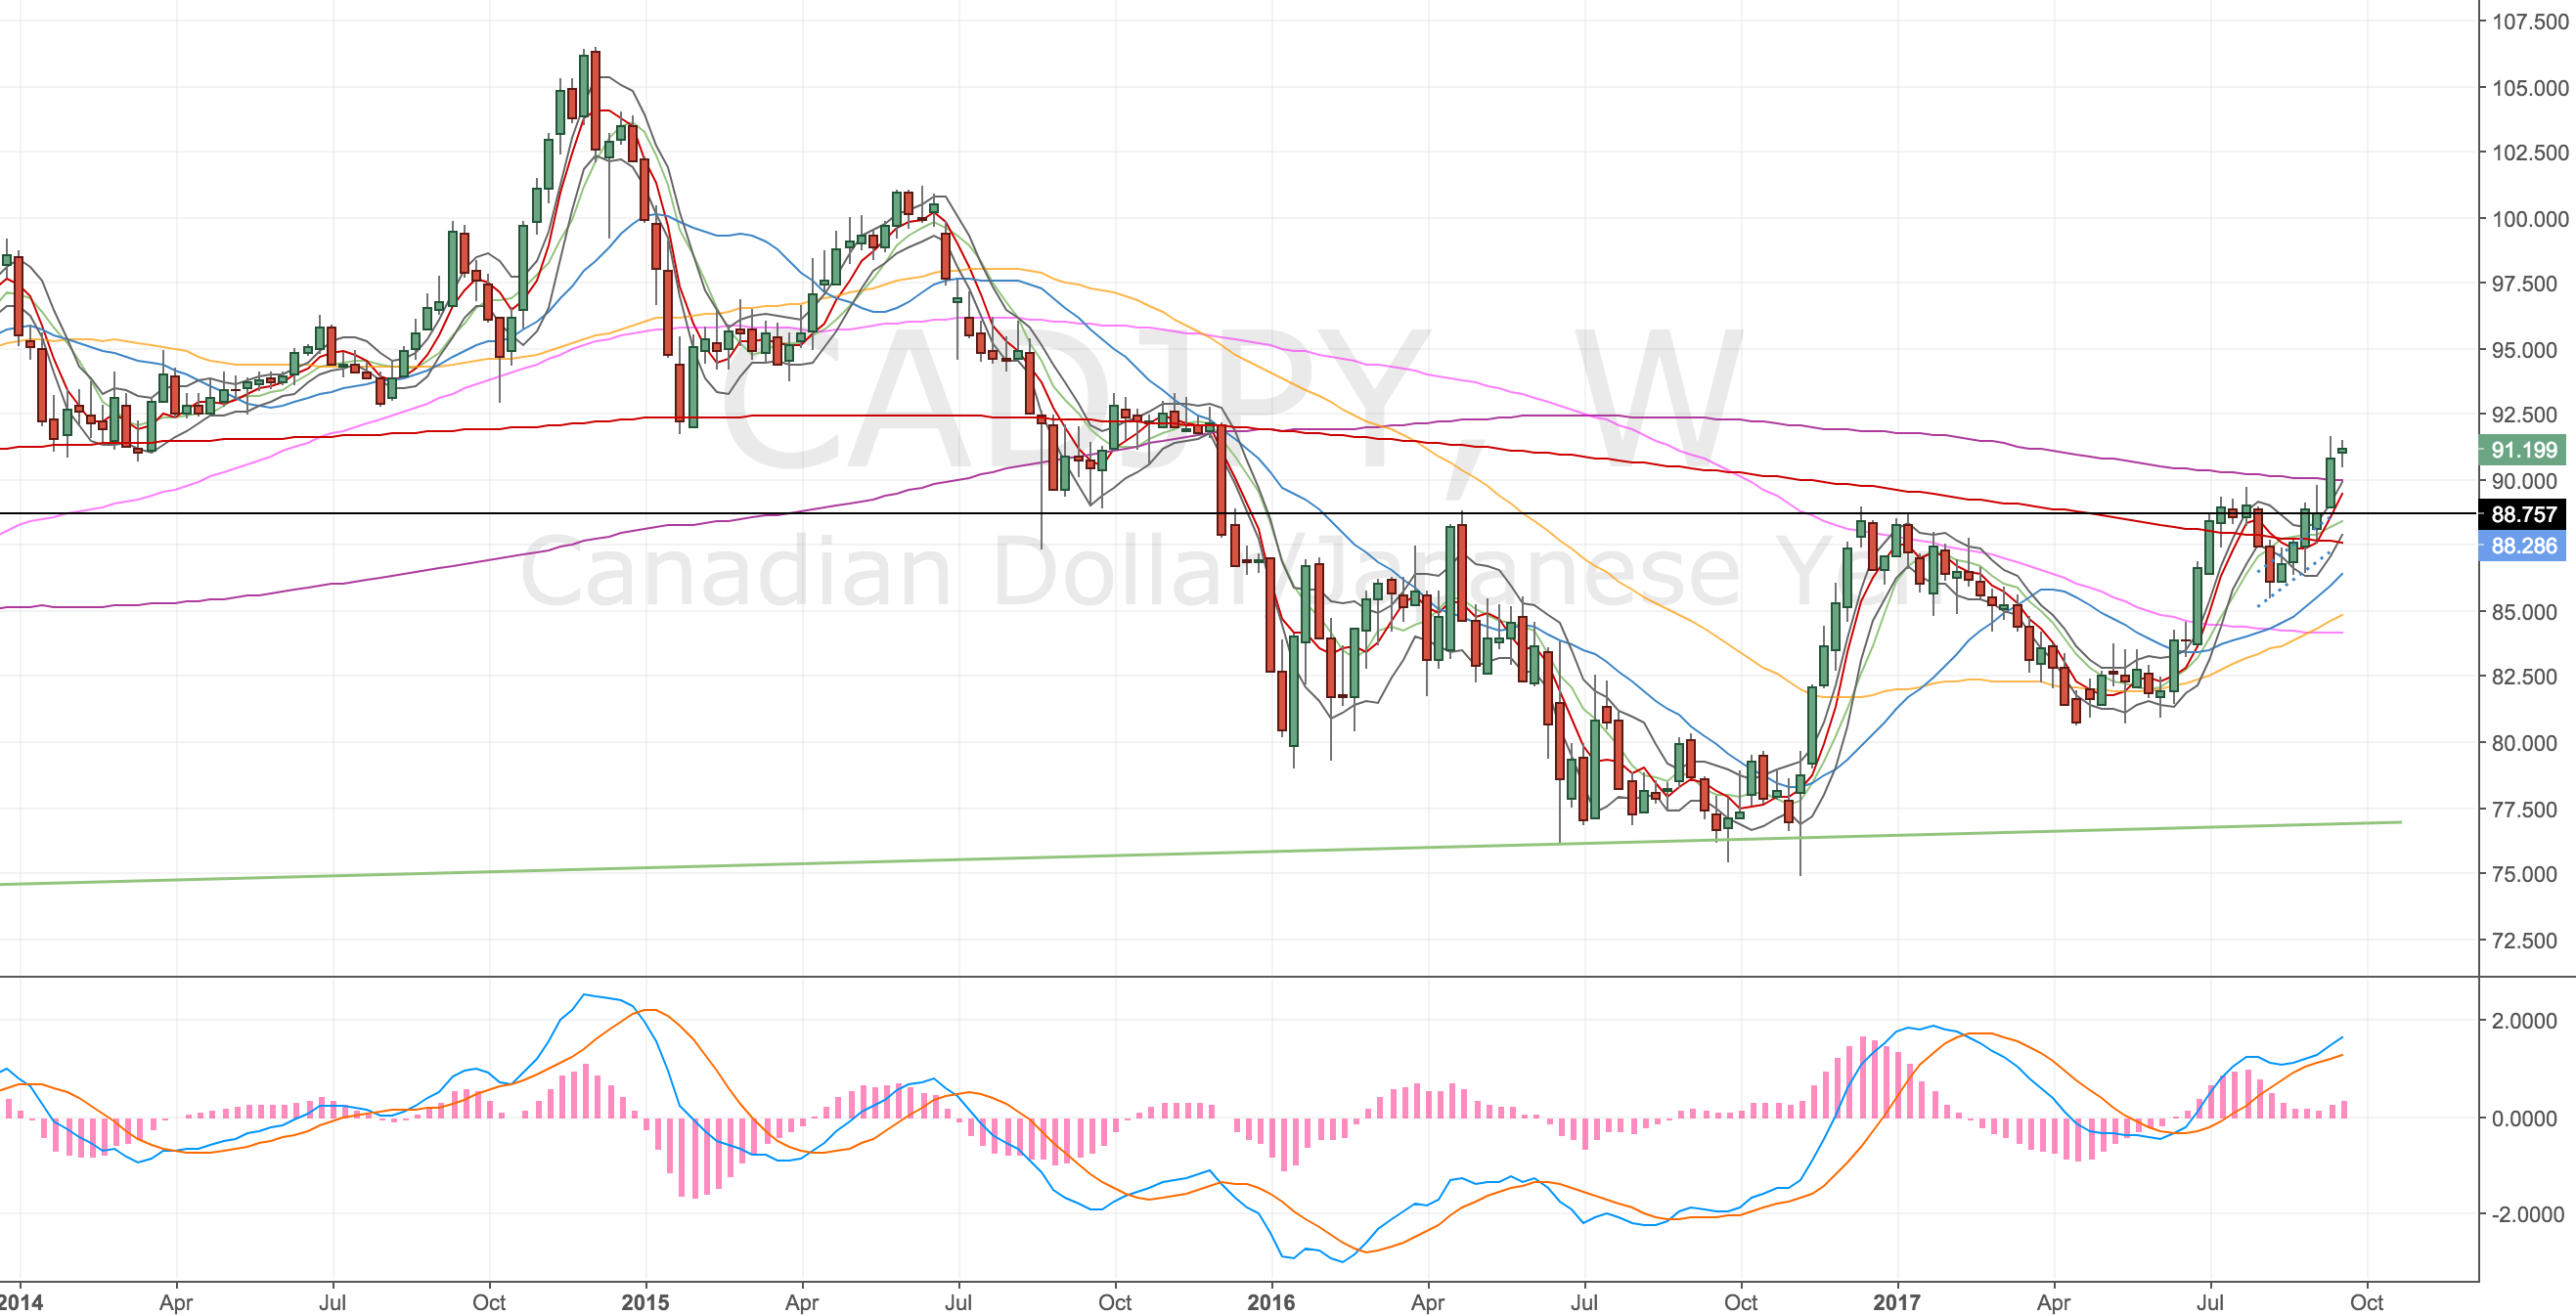
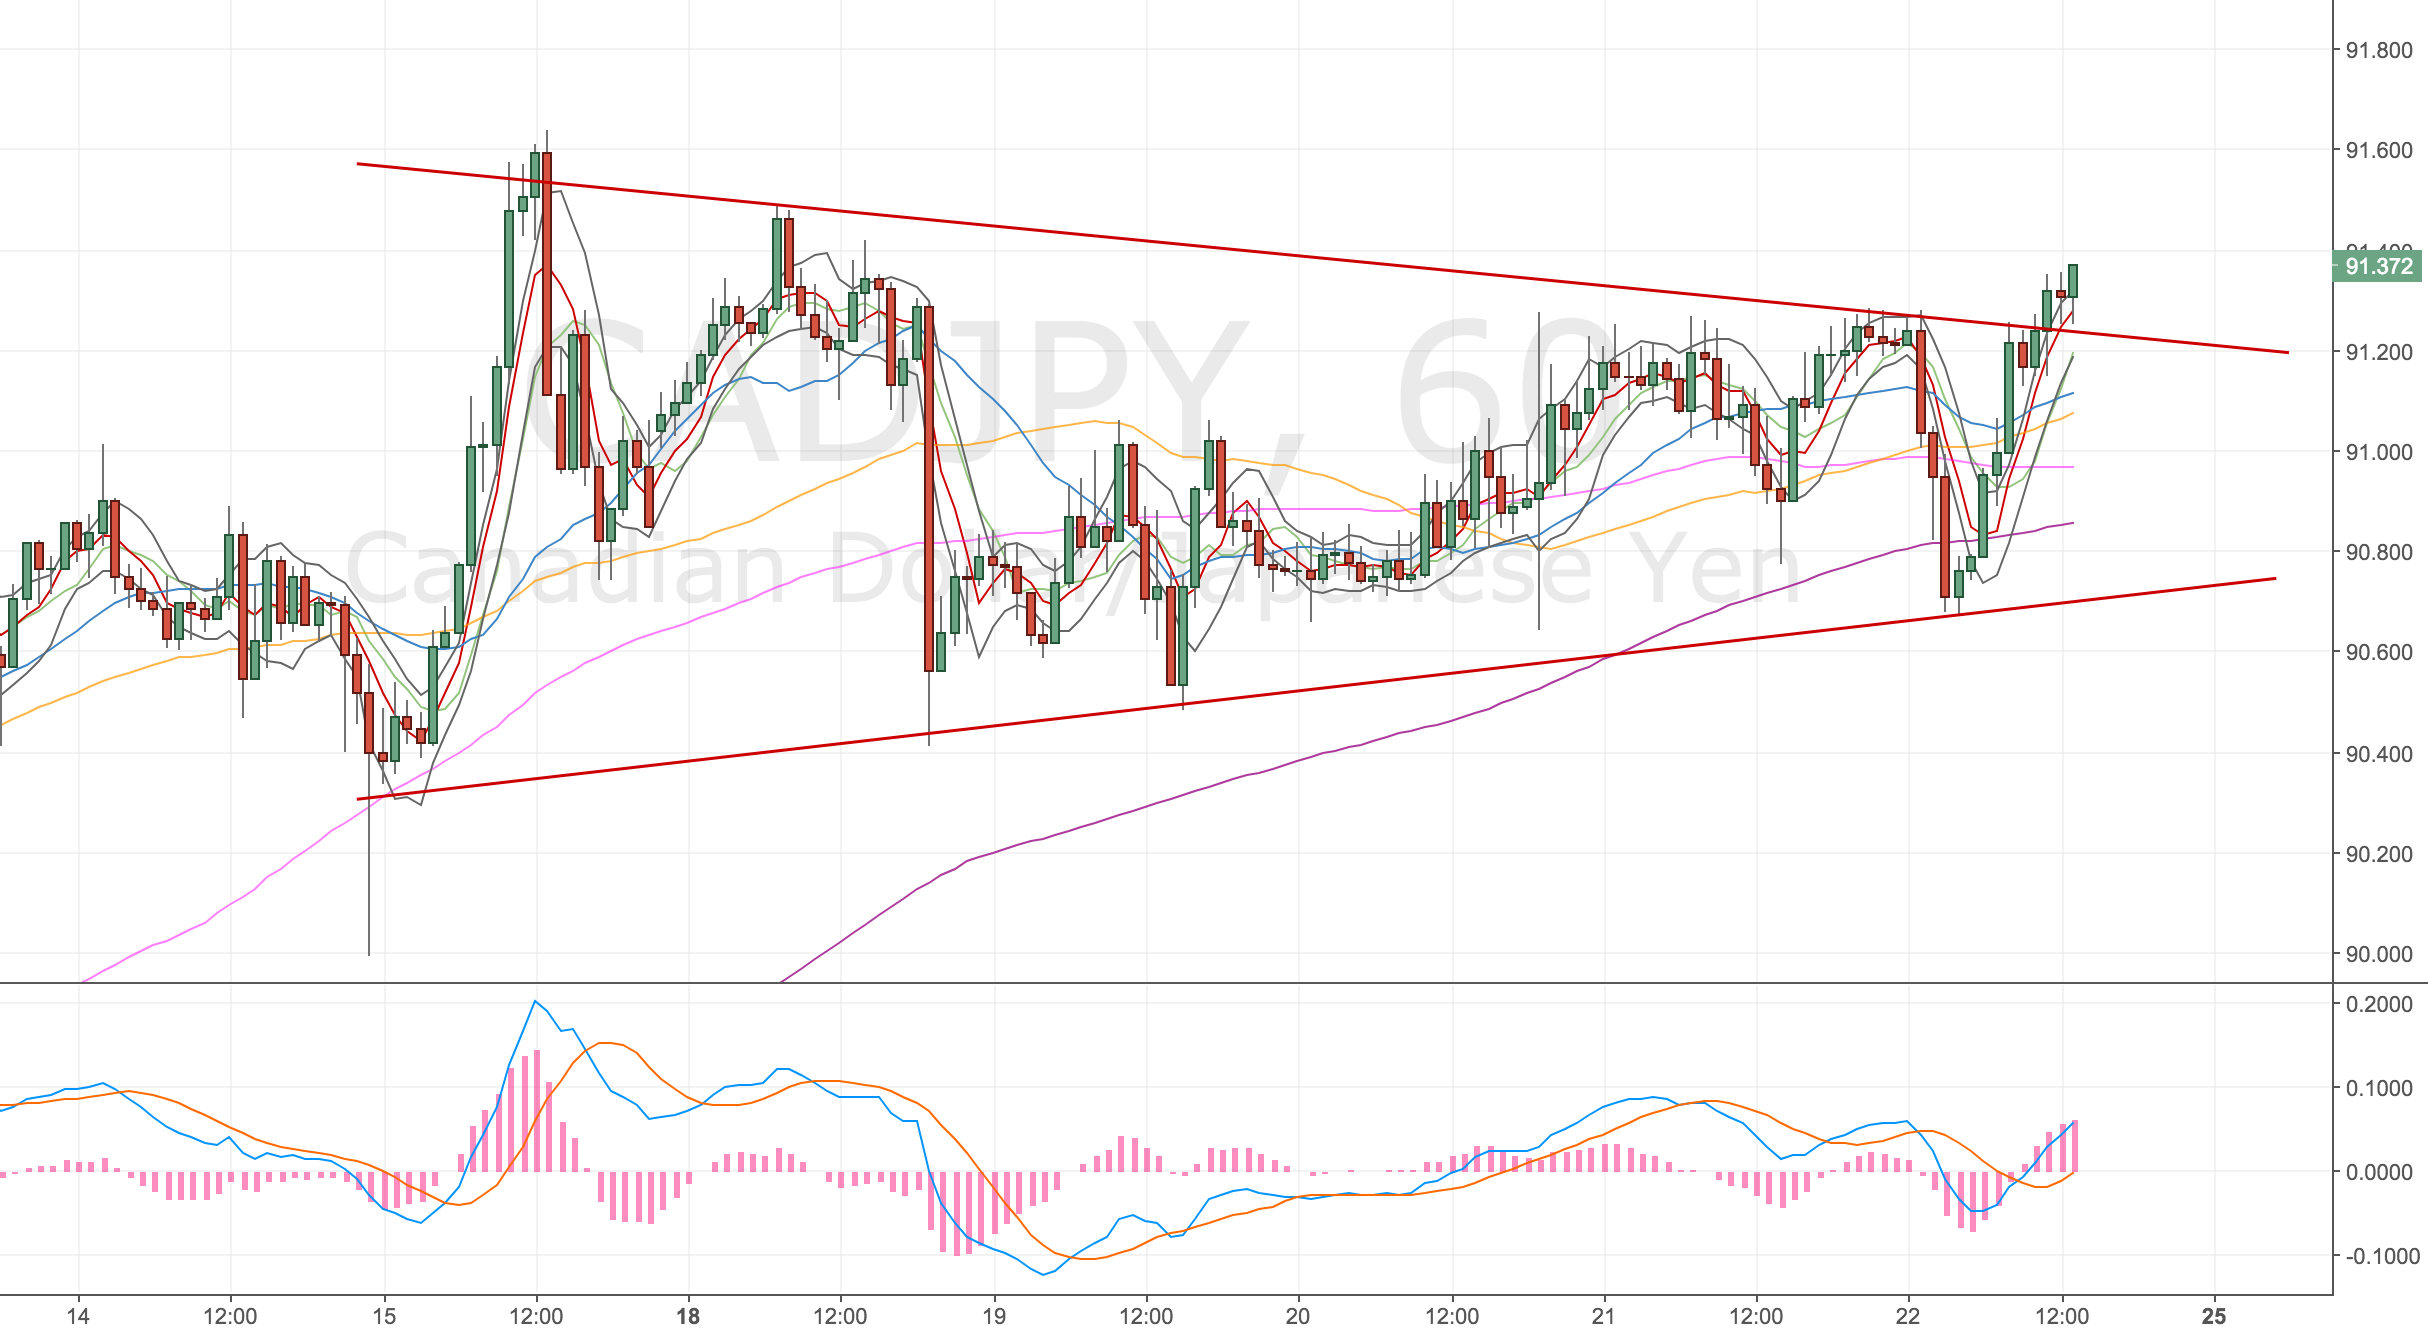
NZDUSD 4H & Daily chart

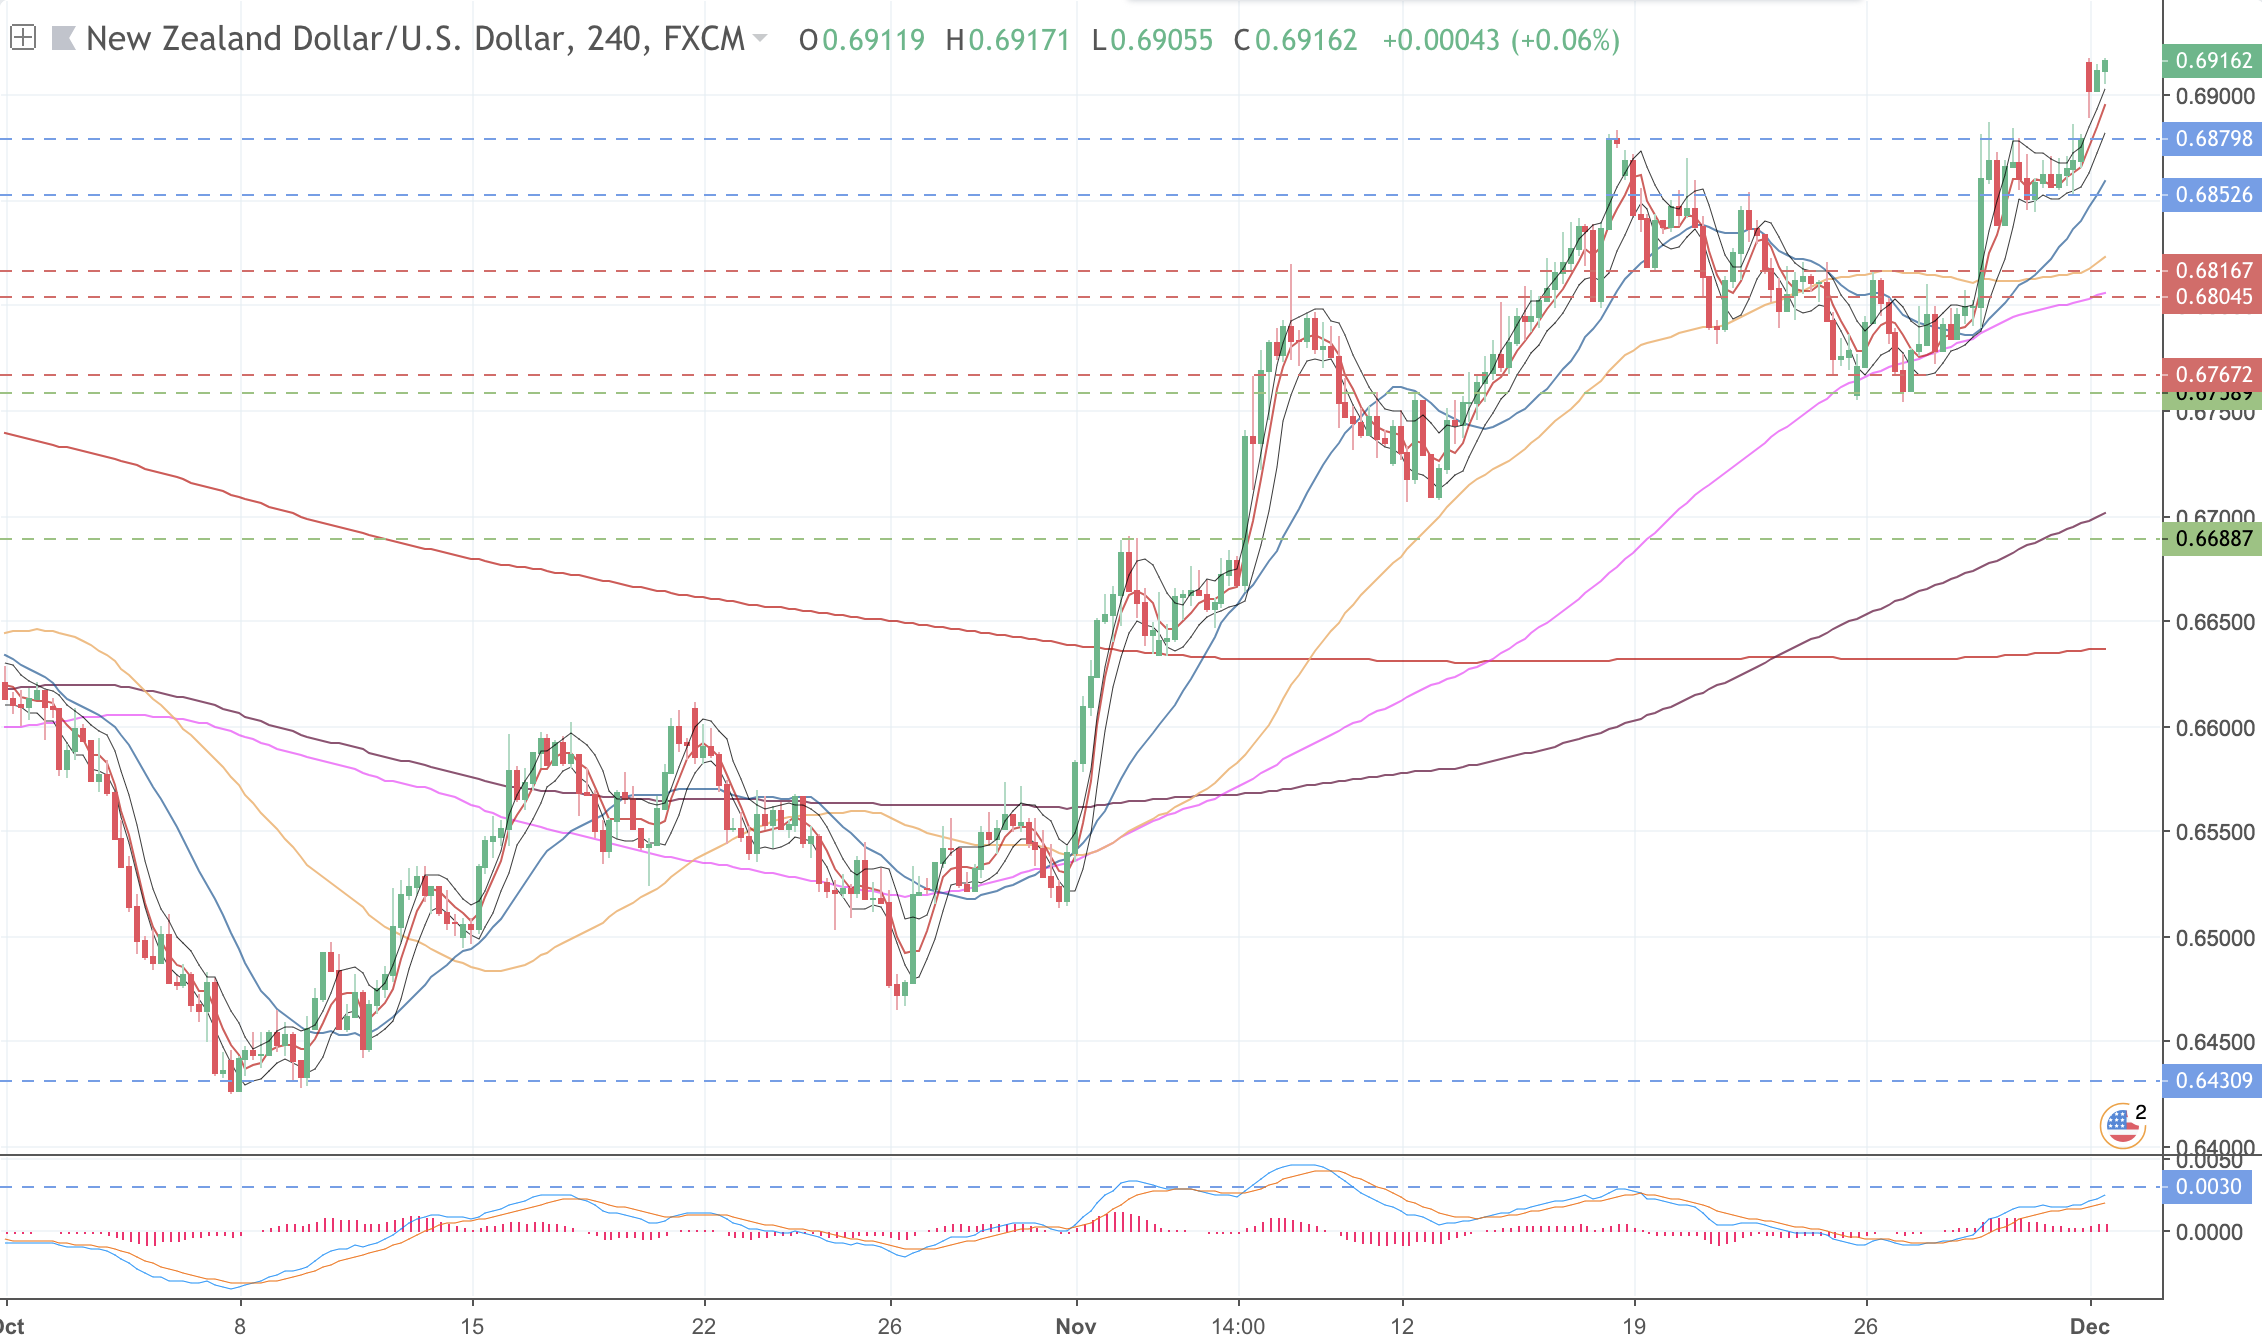
NZDUSD 4H chart – 03 Dec 18

NZDUSD – daily chart 03 Dec 18

On review I think this redrawn daily level is the correct one and we may get a swing failure from it now. So I’ll have another bash at shorting today if the set up materialises. Will see how the DXY looks too.

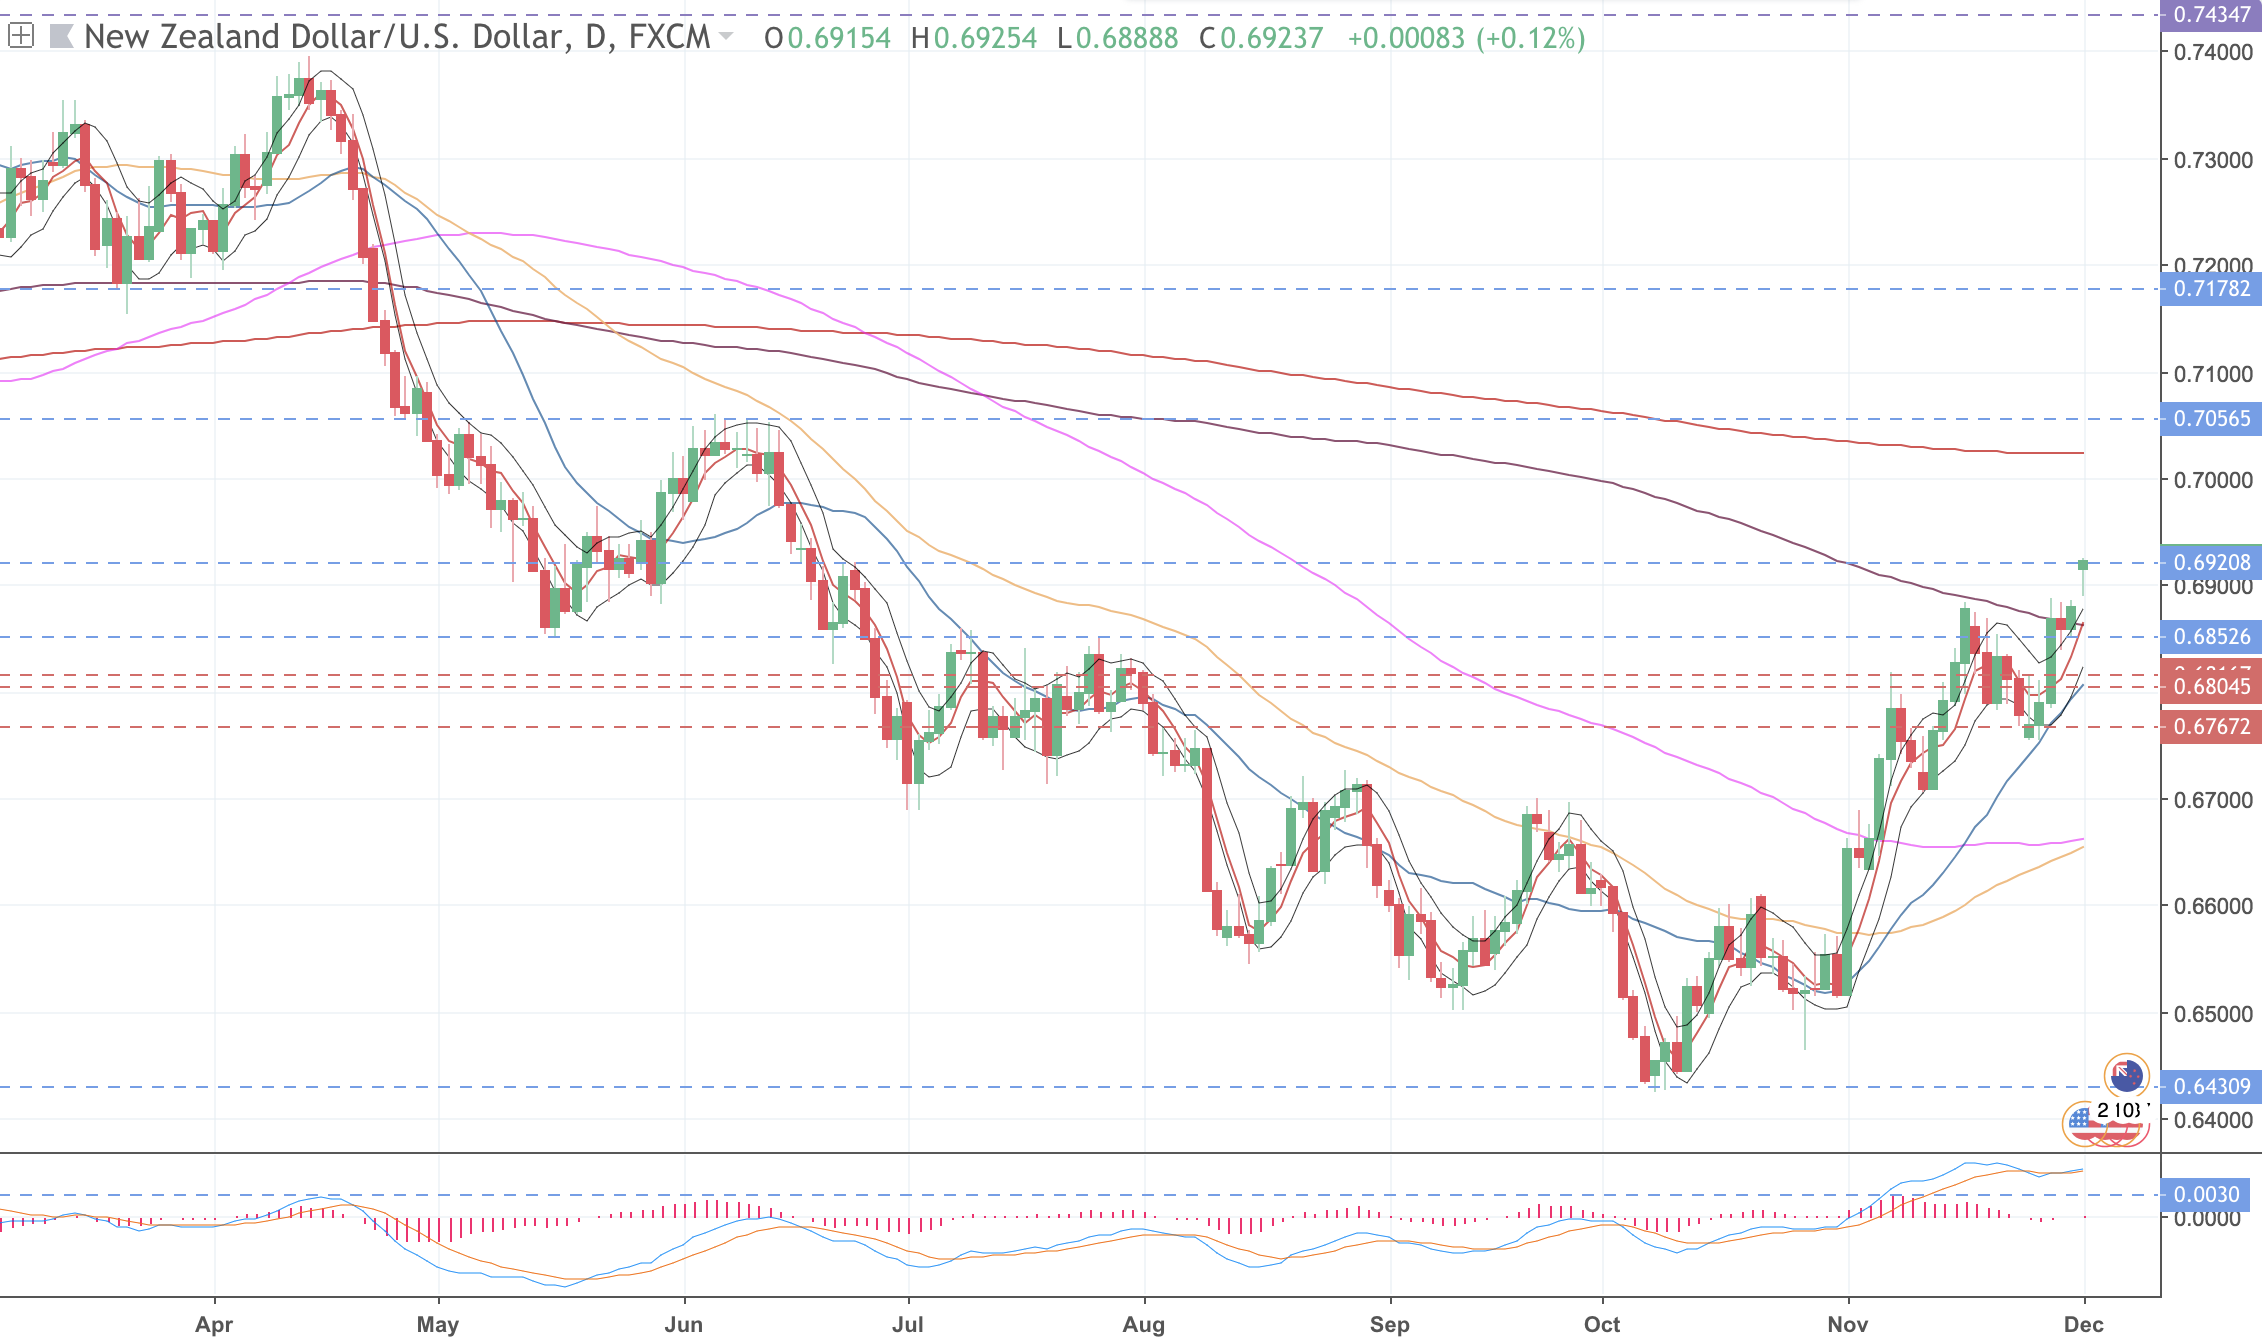
NZDUSD daily chart – 03 Dec 18. Redrawn levels.

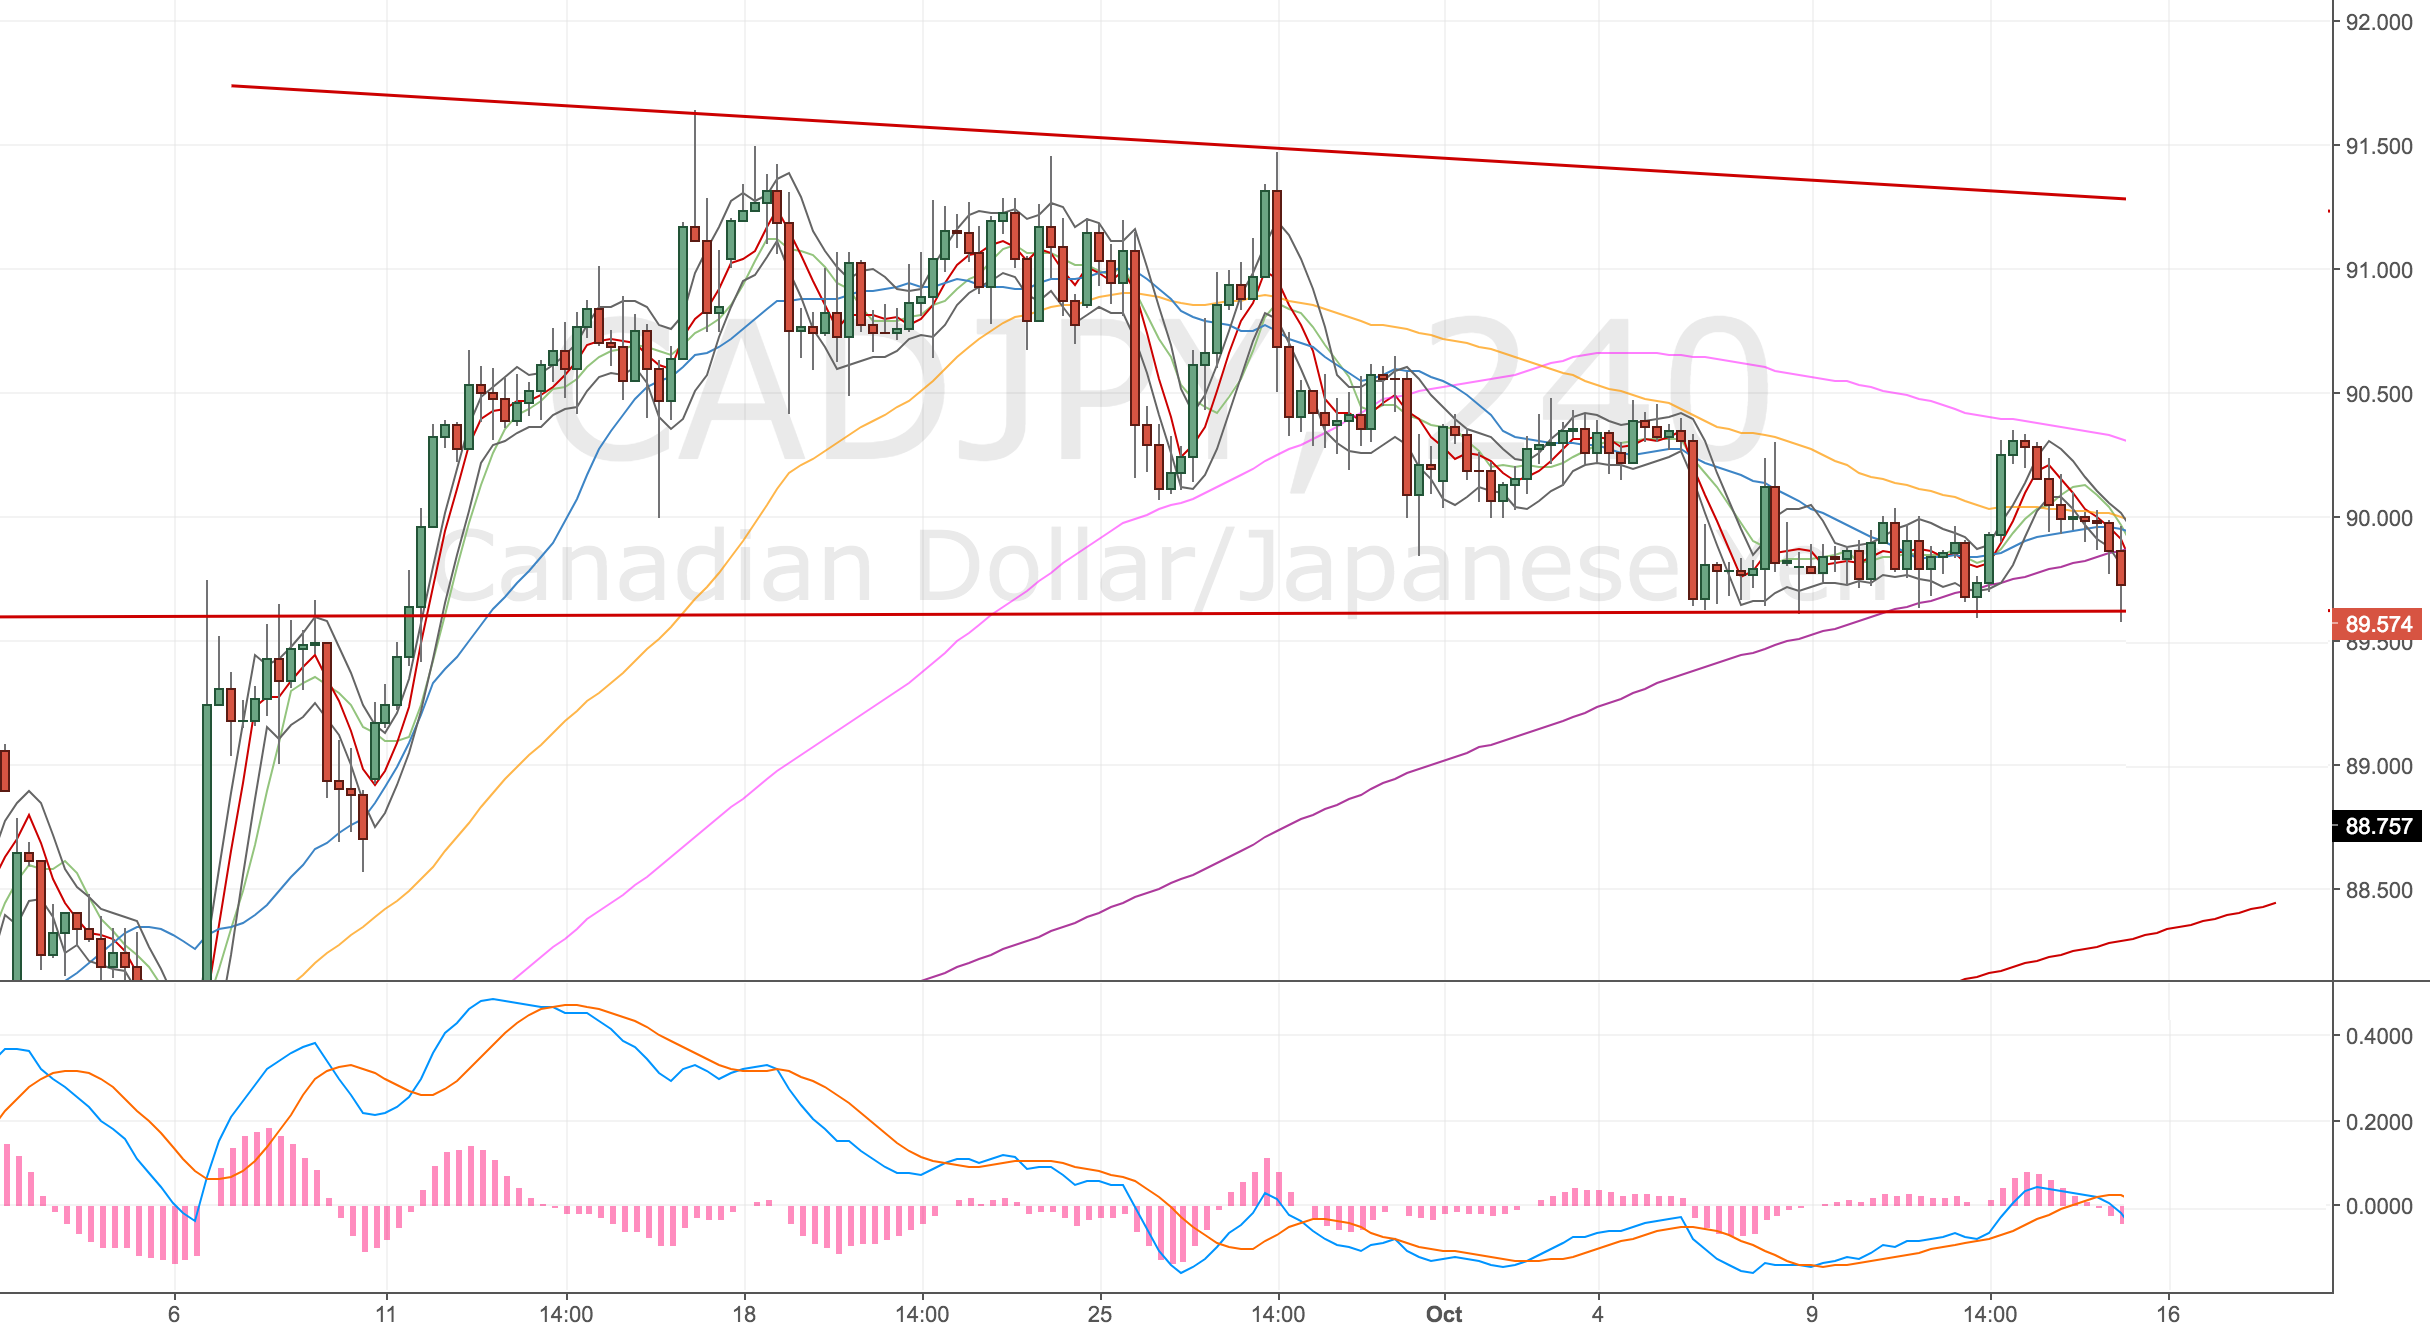
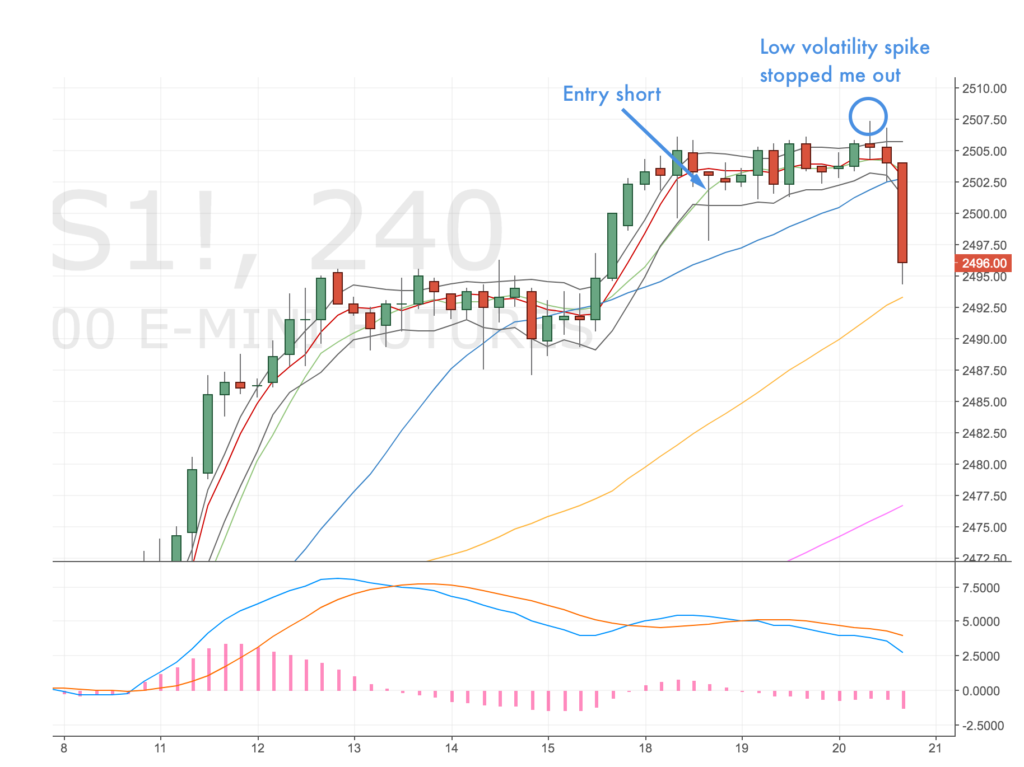
USDCAD 4h short @ 1.331, 1% risk, Pulled the order

Huge mistake! I saw the swing failure higher, got my set up on the daily chart, set up a great entry order to go short @ 1.3310 and then got jittery about another retest high, pulled the order and set an alert to see how price action materialised.

Alerts triggered still sat on this looking for more upside before shorting.

Well the weekend gap would’ve worked in my favour, the trade would’ve been a hedge of my NZDUSD position so would’ve offset my risk and meant I ended the week in profit.

Massive mistake. It’s well on the way to target. A miss of around £180 profit.

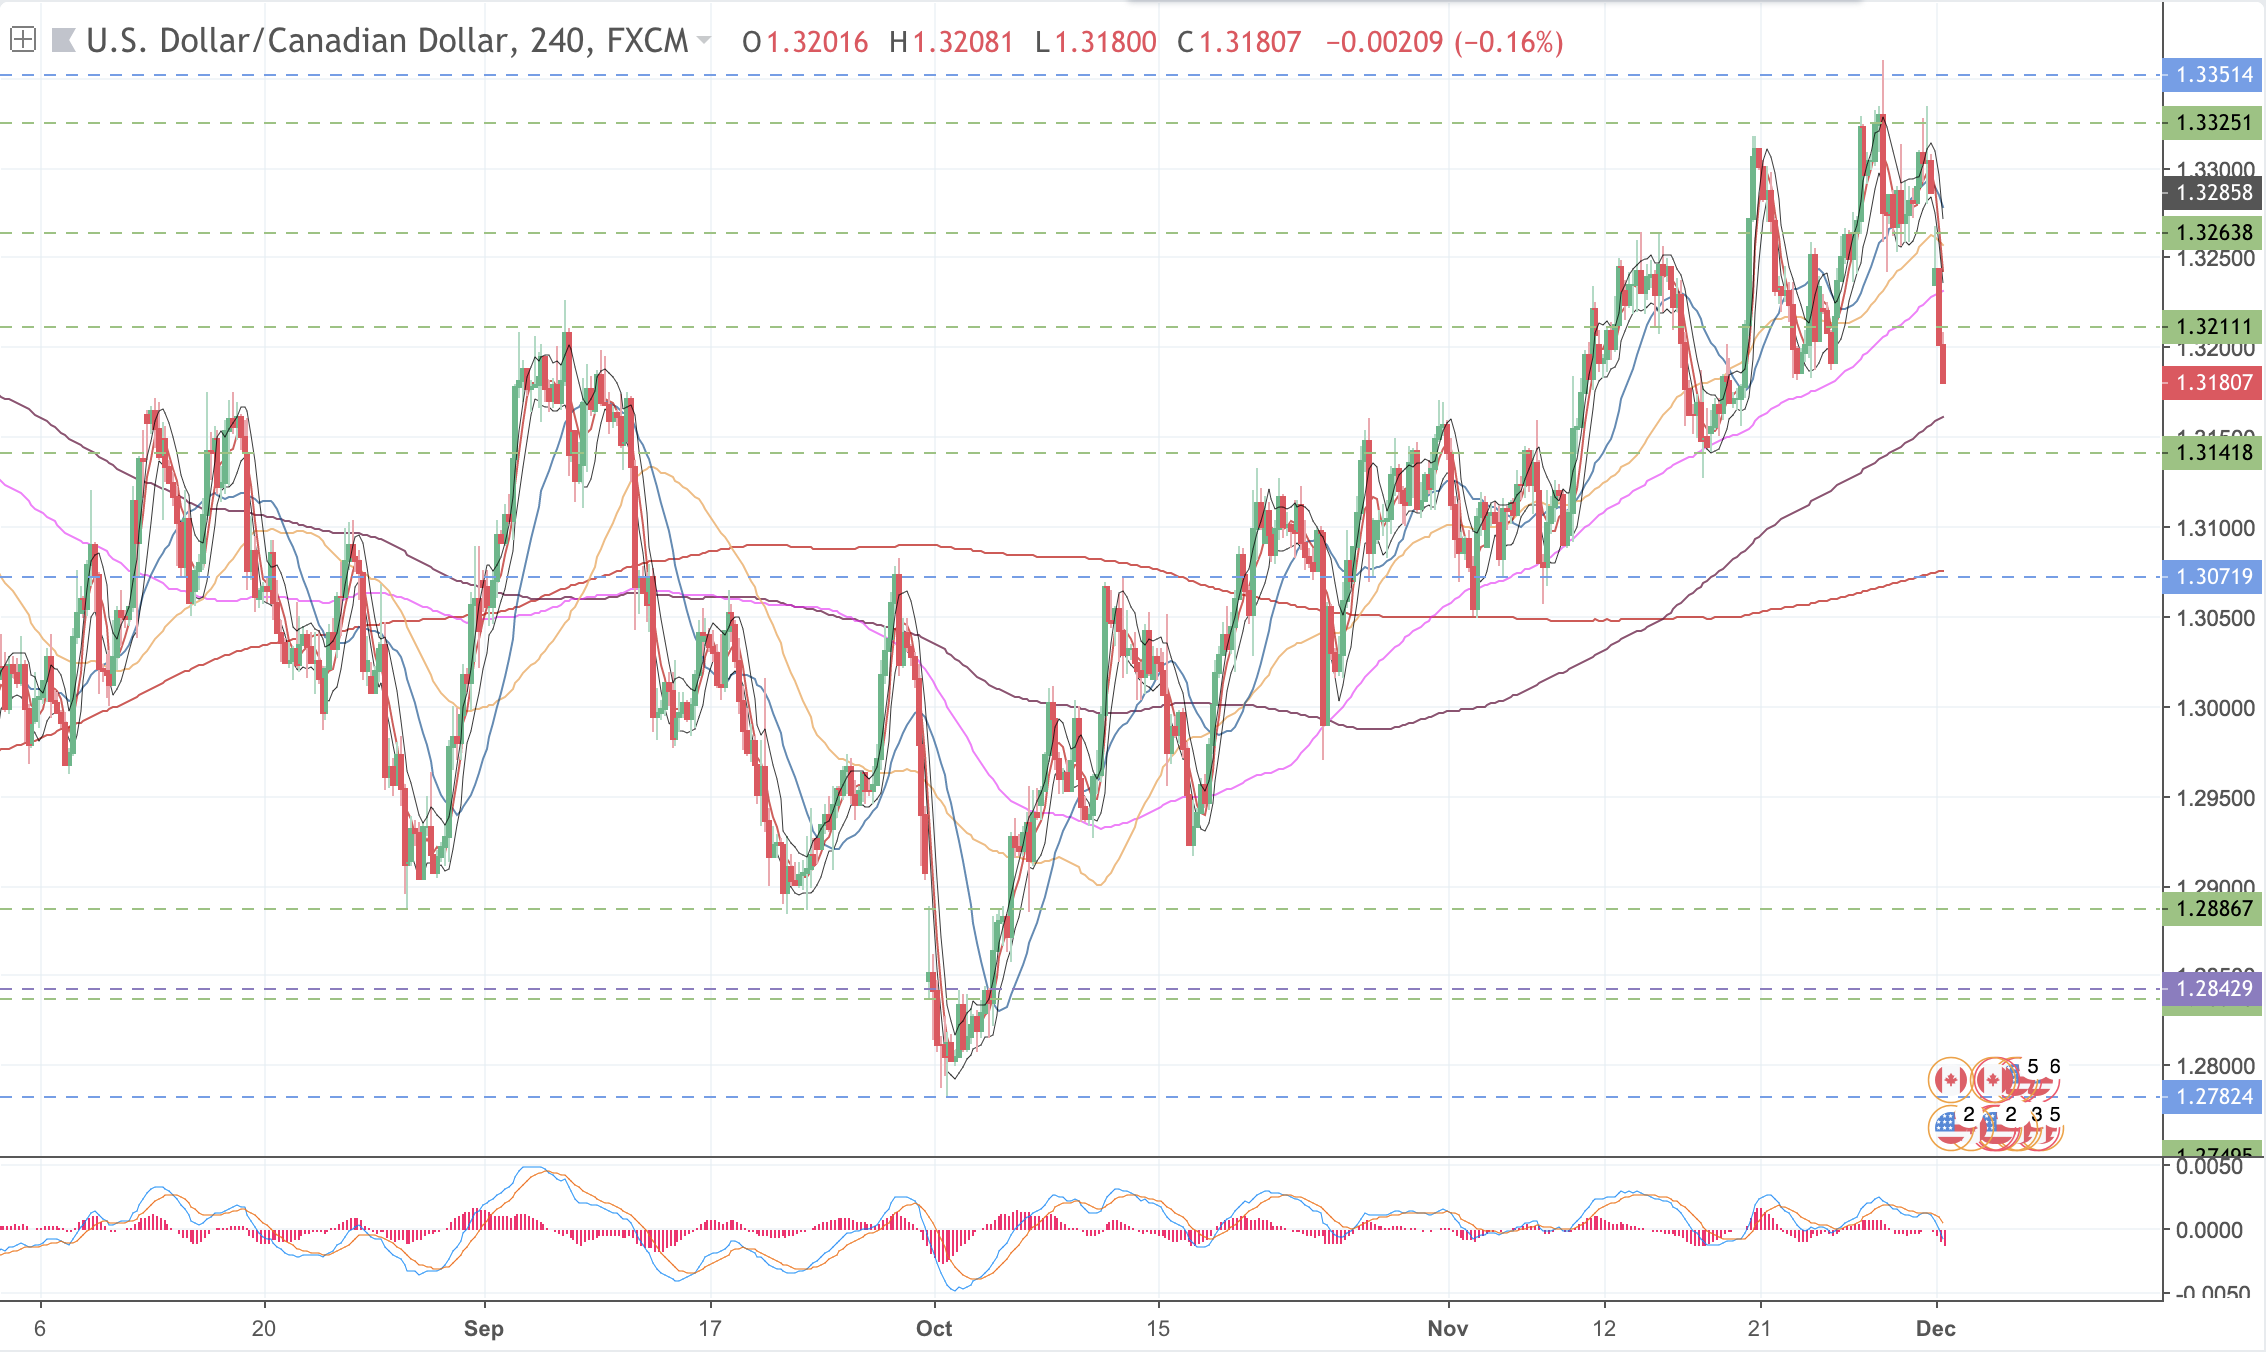
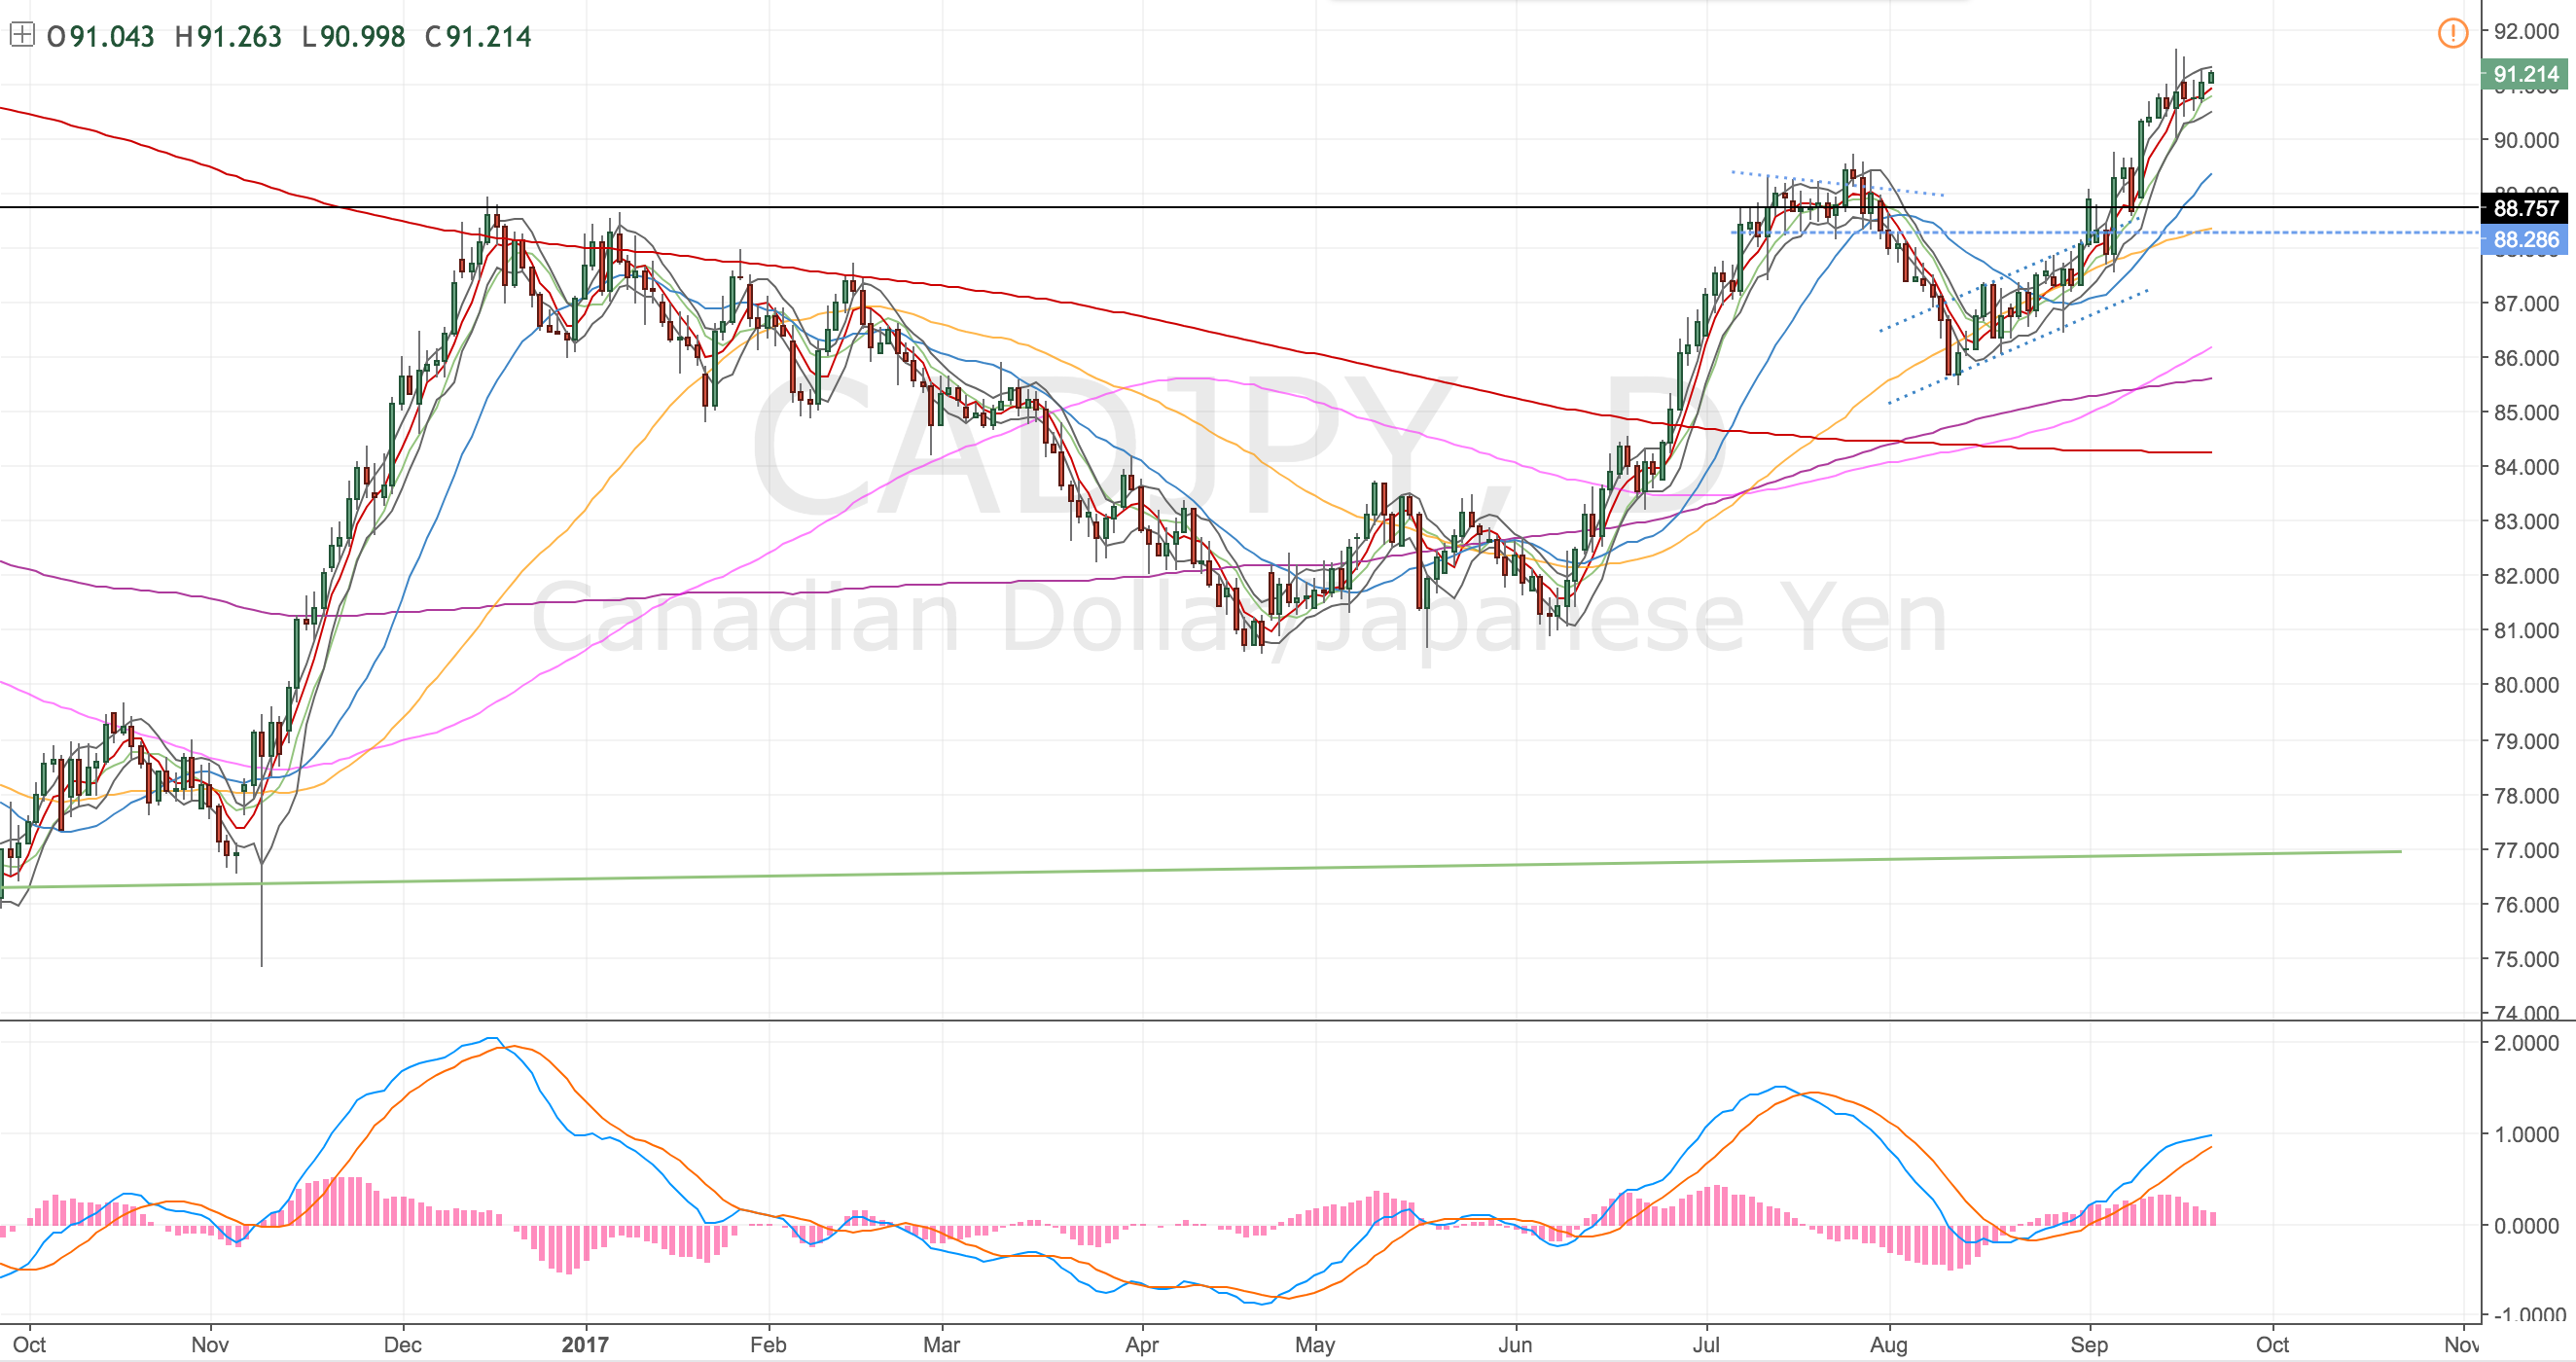
USDCAD daily chart – 03 Dec 18

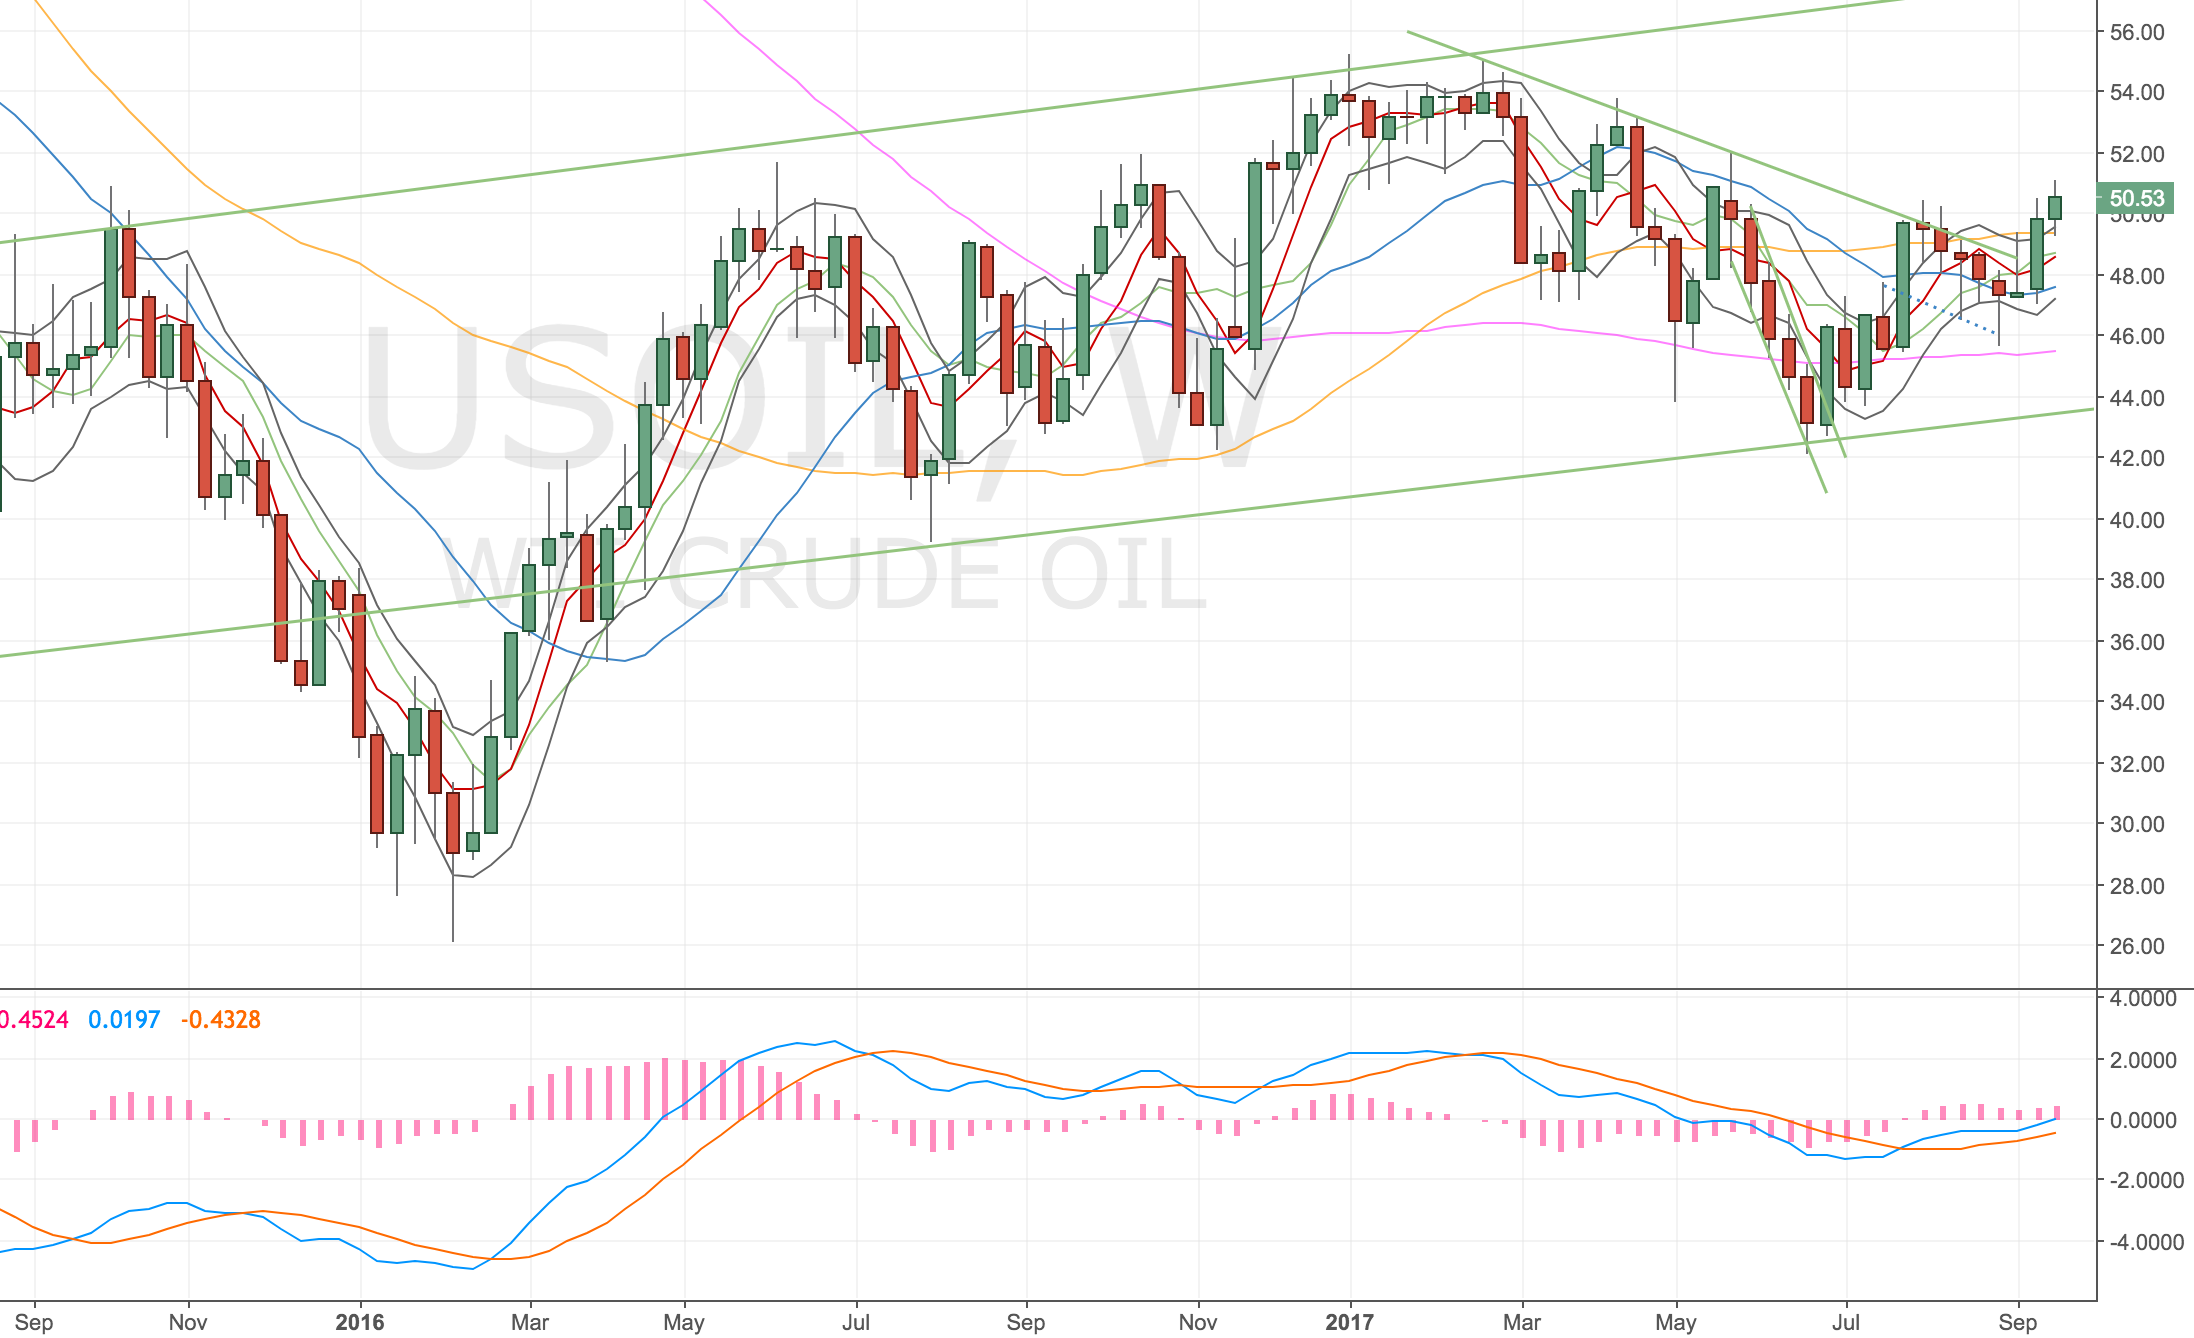
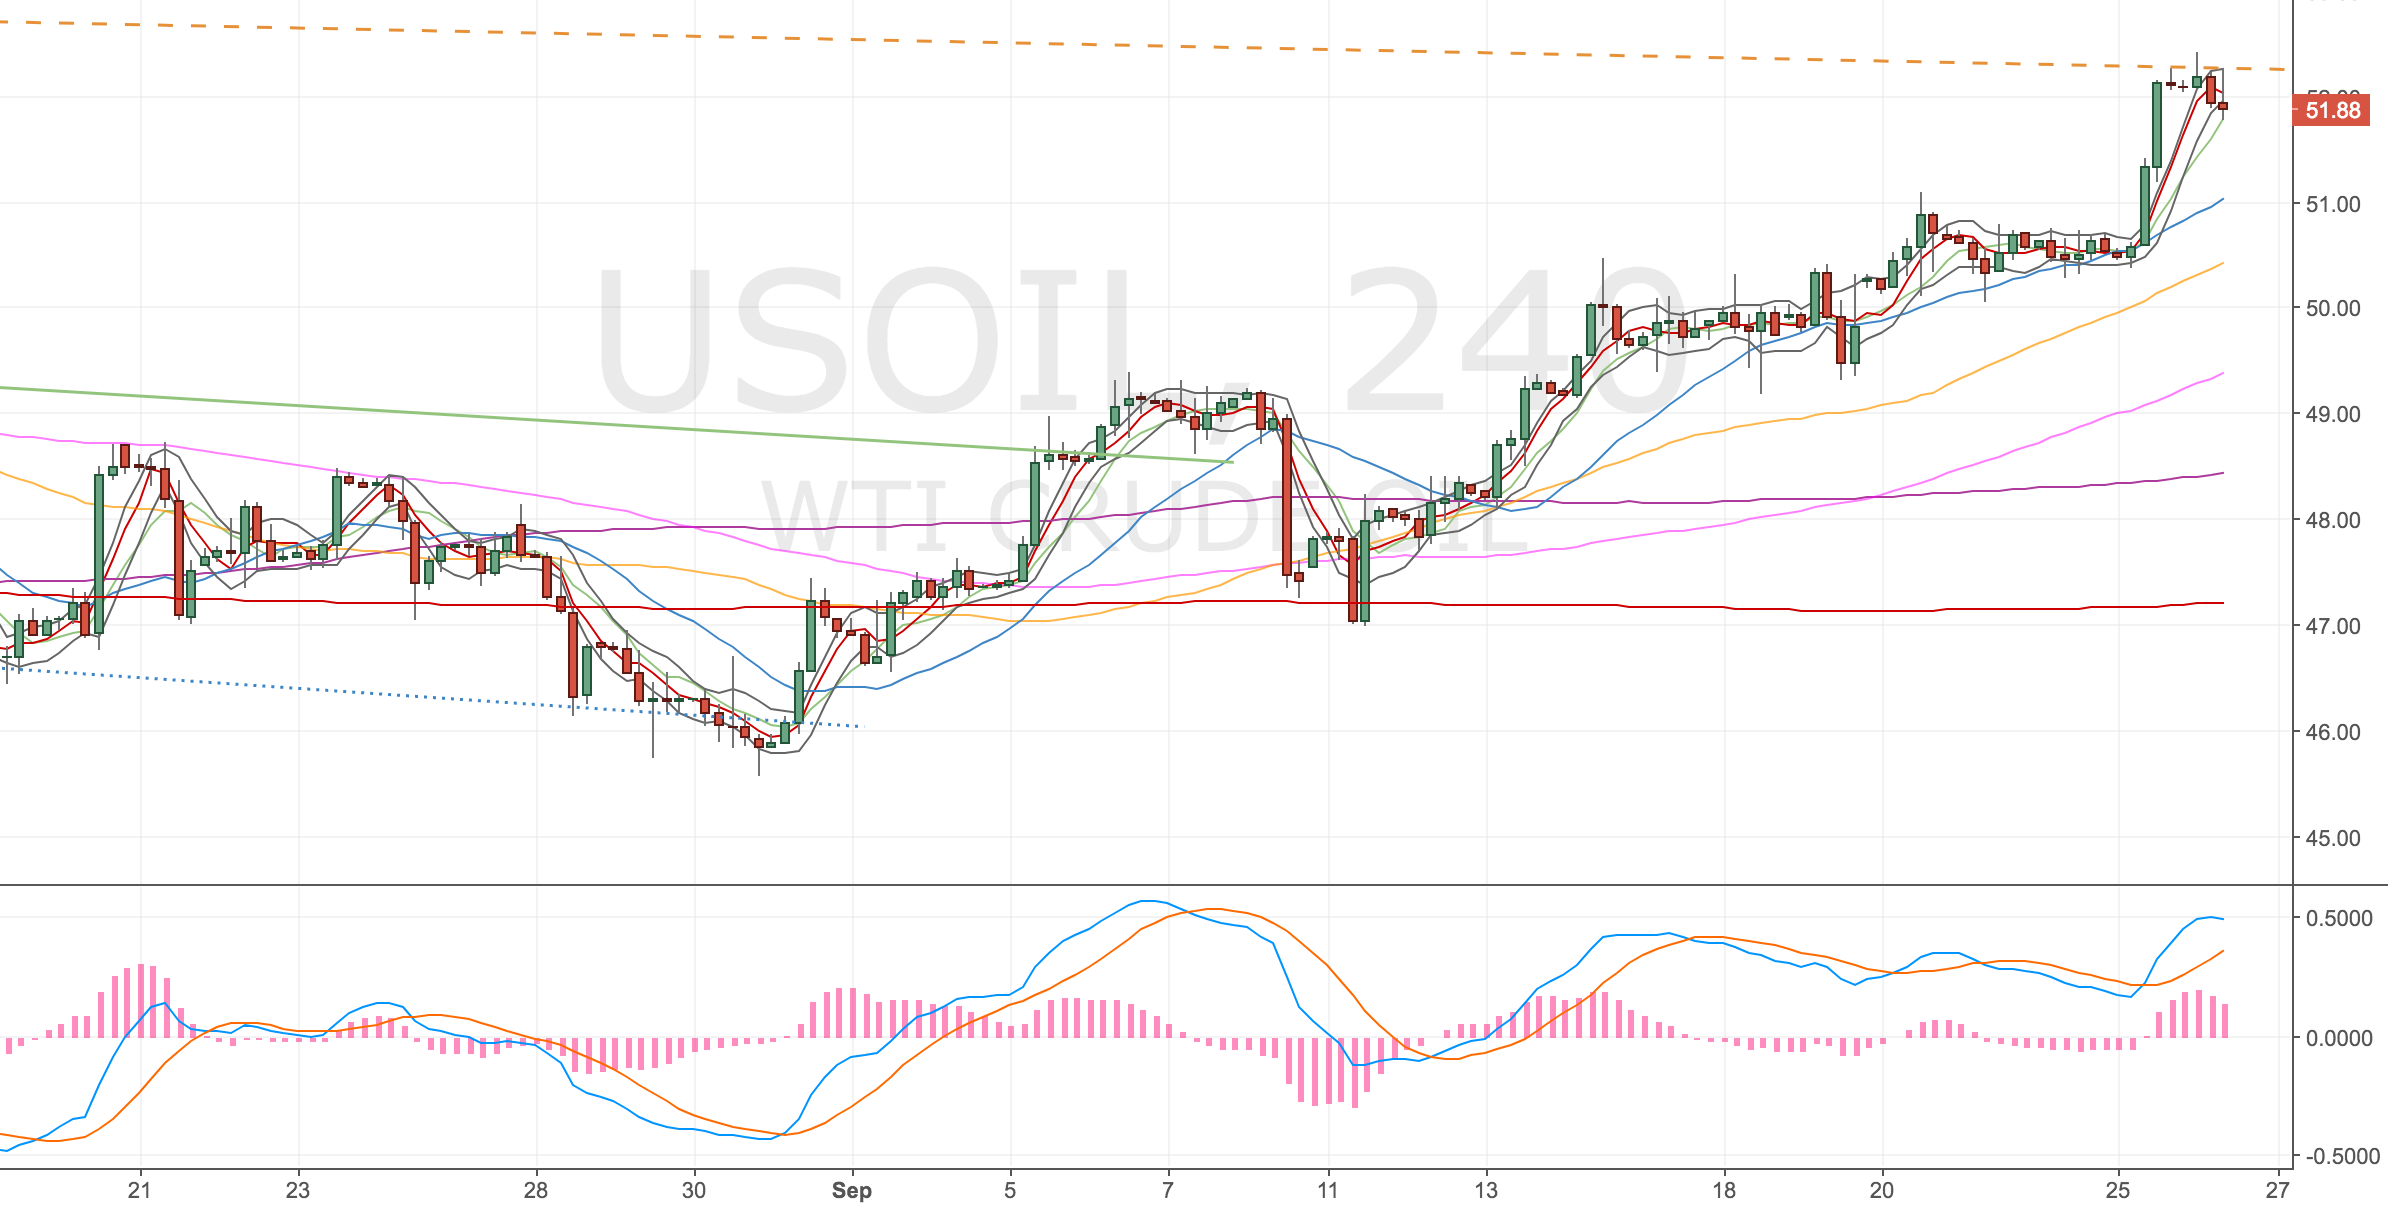
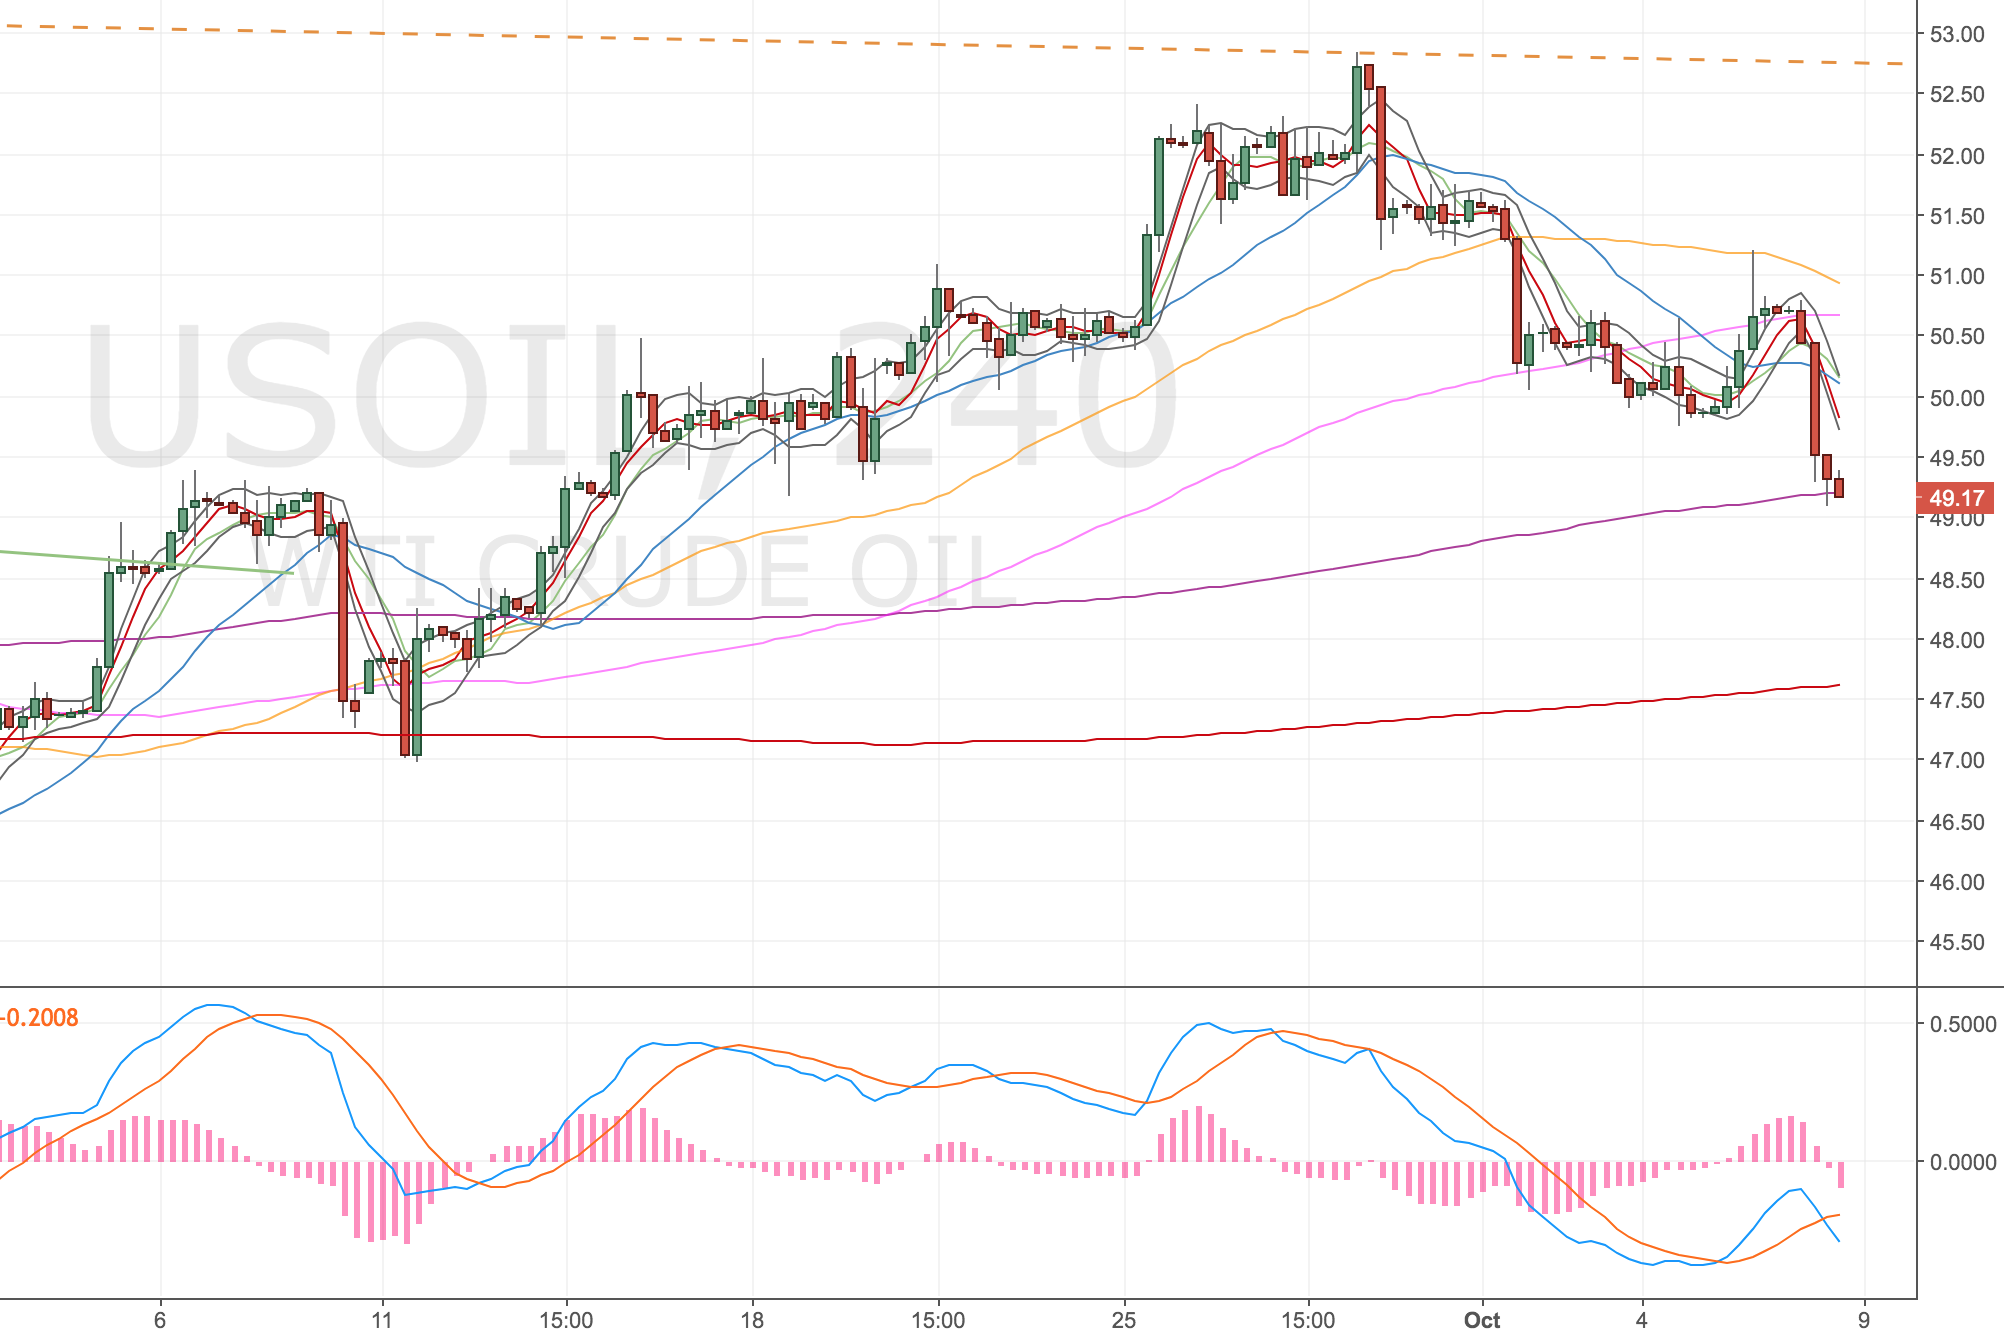
US Oil 4h long @ 49.15, Didn’t trigger

Not sure if this was a mistake, I have a level which I checked below at 49.4 – 49.15s. I still think we might come back for it, but for now it has rallied. Not sure if this was a missed opportunity. Had a good double divergence set up.

US Oil 4H Chart – 03 Dec 18

Could’ve lost a lot of money buying this ahead of the level so I’m not too bothered. Hopefully this will result in a bigger run when it comes.

Other trades

EURGBP short – Observed a short. Had a nice 3rd test SFP at 0.892s, need to finish the lecture series and back test this system.
AUDUSD short – Good call on this. AUDNZD had more downside. Felt the prior AUDUSD divergence had played out, was looking for fresh divergences.

This week’s focus: Discipline (same as last again)

This week focus is on executing to strategy, journalling and sticking to routine.
Failed again last week. Need to map out all my markets EURAUD looks interesting.

Routine

Slightly updated again. Too tired in the evenings after all the life admin etc. Focus on getting up earlier on Monday to get the weekly review and scans done, I’ll do some exercise in the morning too.

Monday morning

Planning & market overview

Country

05.50 – alarm & daily calisthenics (too tired in the evening)
06.55 – out the door
07.17 – tube in: Read/update trading plan. Coding, journal or learning
08.25 – desk and set up
08.30 – morning scan
09.30 – desk for work
12.30 – lunch (salad) be flexible, if there’s stuff to do, do it.
17.00 – leave for home
22.00 – check markets and deal with positions (update trade log)
22.30 – Bed

London

06.00 – alarm & daily calisthenics (too tired in the evening)
07.00 – out the door
07:05 – read/update trading plan
08.30 – desk and set up
08.35 – morning scan
09.30 – desk for work
17.00 – leave for home
22.00 – check markets and deal with positions (update trade log)
22.30 – Bed

Key events

Lots for the AUD, CAD and USD. Merkel replacement should be announced Friday – Saturday.

Tue 9.15am GBP – Carney speech
Tue 3.30am AUD – IR decision
Wed 8.30am EUR – Draghi speech
Wed 12.30am AUD – GDP decision
Wed 3pm CAD – IR decision
Wed 3pm USD – ISM PMI figures
Thu 12.30am AUD – retail figures
Thu 1.30pm CAD – Trade balance & poloz speech
Thu 11.45pm USD – Powell speech
Fri 1.30pm CAD – Employment figures
Fri 1.30pm USD – NFP & unemployment

Markets and levels

Current view of FX ratios – interesting to keep in mind. People are hugely long EURAUD on Alpari, so look for a short squeeze. Everyone is pretty long Gold, look for a long squeeze and pinbar to get short.

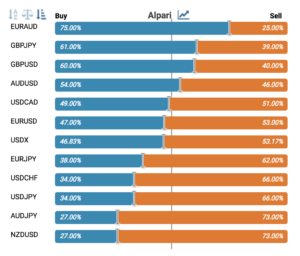
Alpari FX Ratios – 3 Dec 18

EURUSD – Short set ups @ 1.145s, Buy set ups @ 1.12s
EURGBP – Short set ups @ 0.893s, Buy set ups @ 0.87s (1h – 0.8825s)
EURJPY – Still noisy
EURAUD – Short set ups @ 1.63s, Buy set ups @ 1.53s

GBPUSD – Buy set ups @ 1.27s (maybe 1.266s)
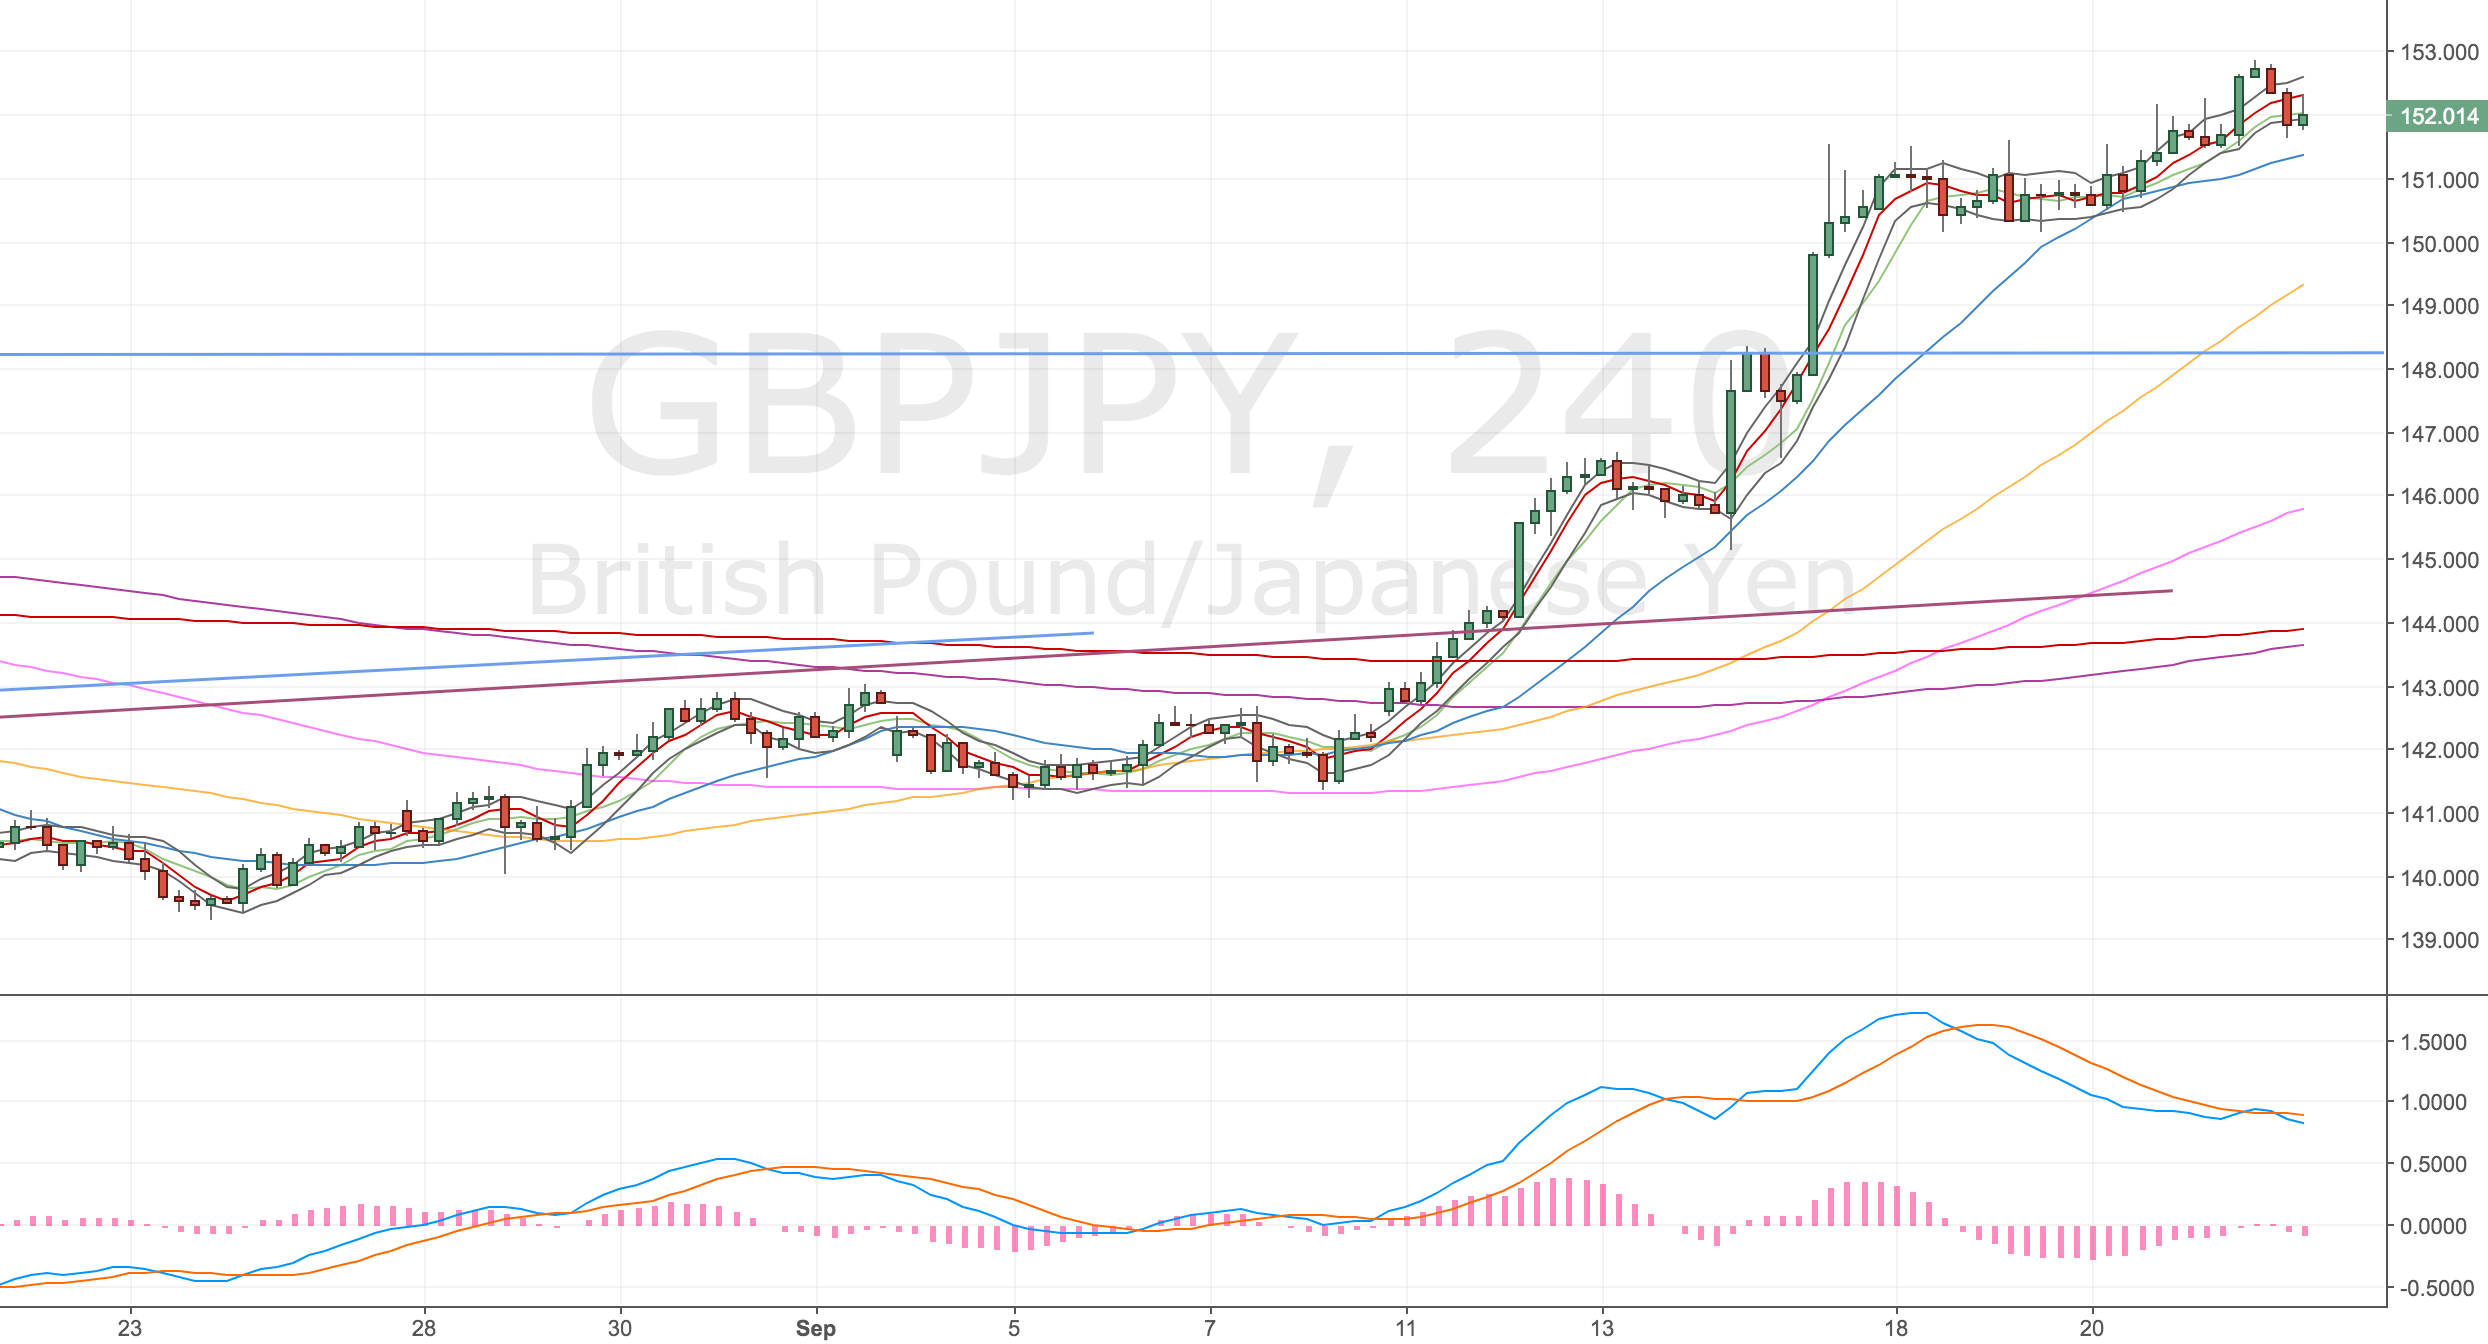
GBPJPY – Buy set ups @ 144s & 142.80s
GBPAUD – Buy SFP set ups @ 1.711

AUDUSD – Short set ups @ 0.74s, Buy set ups @ 0.7215
NZDUSD – This is a reluctant short now. Buy set ups @ 0.6757
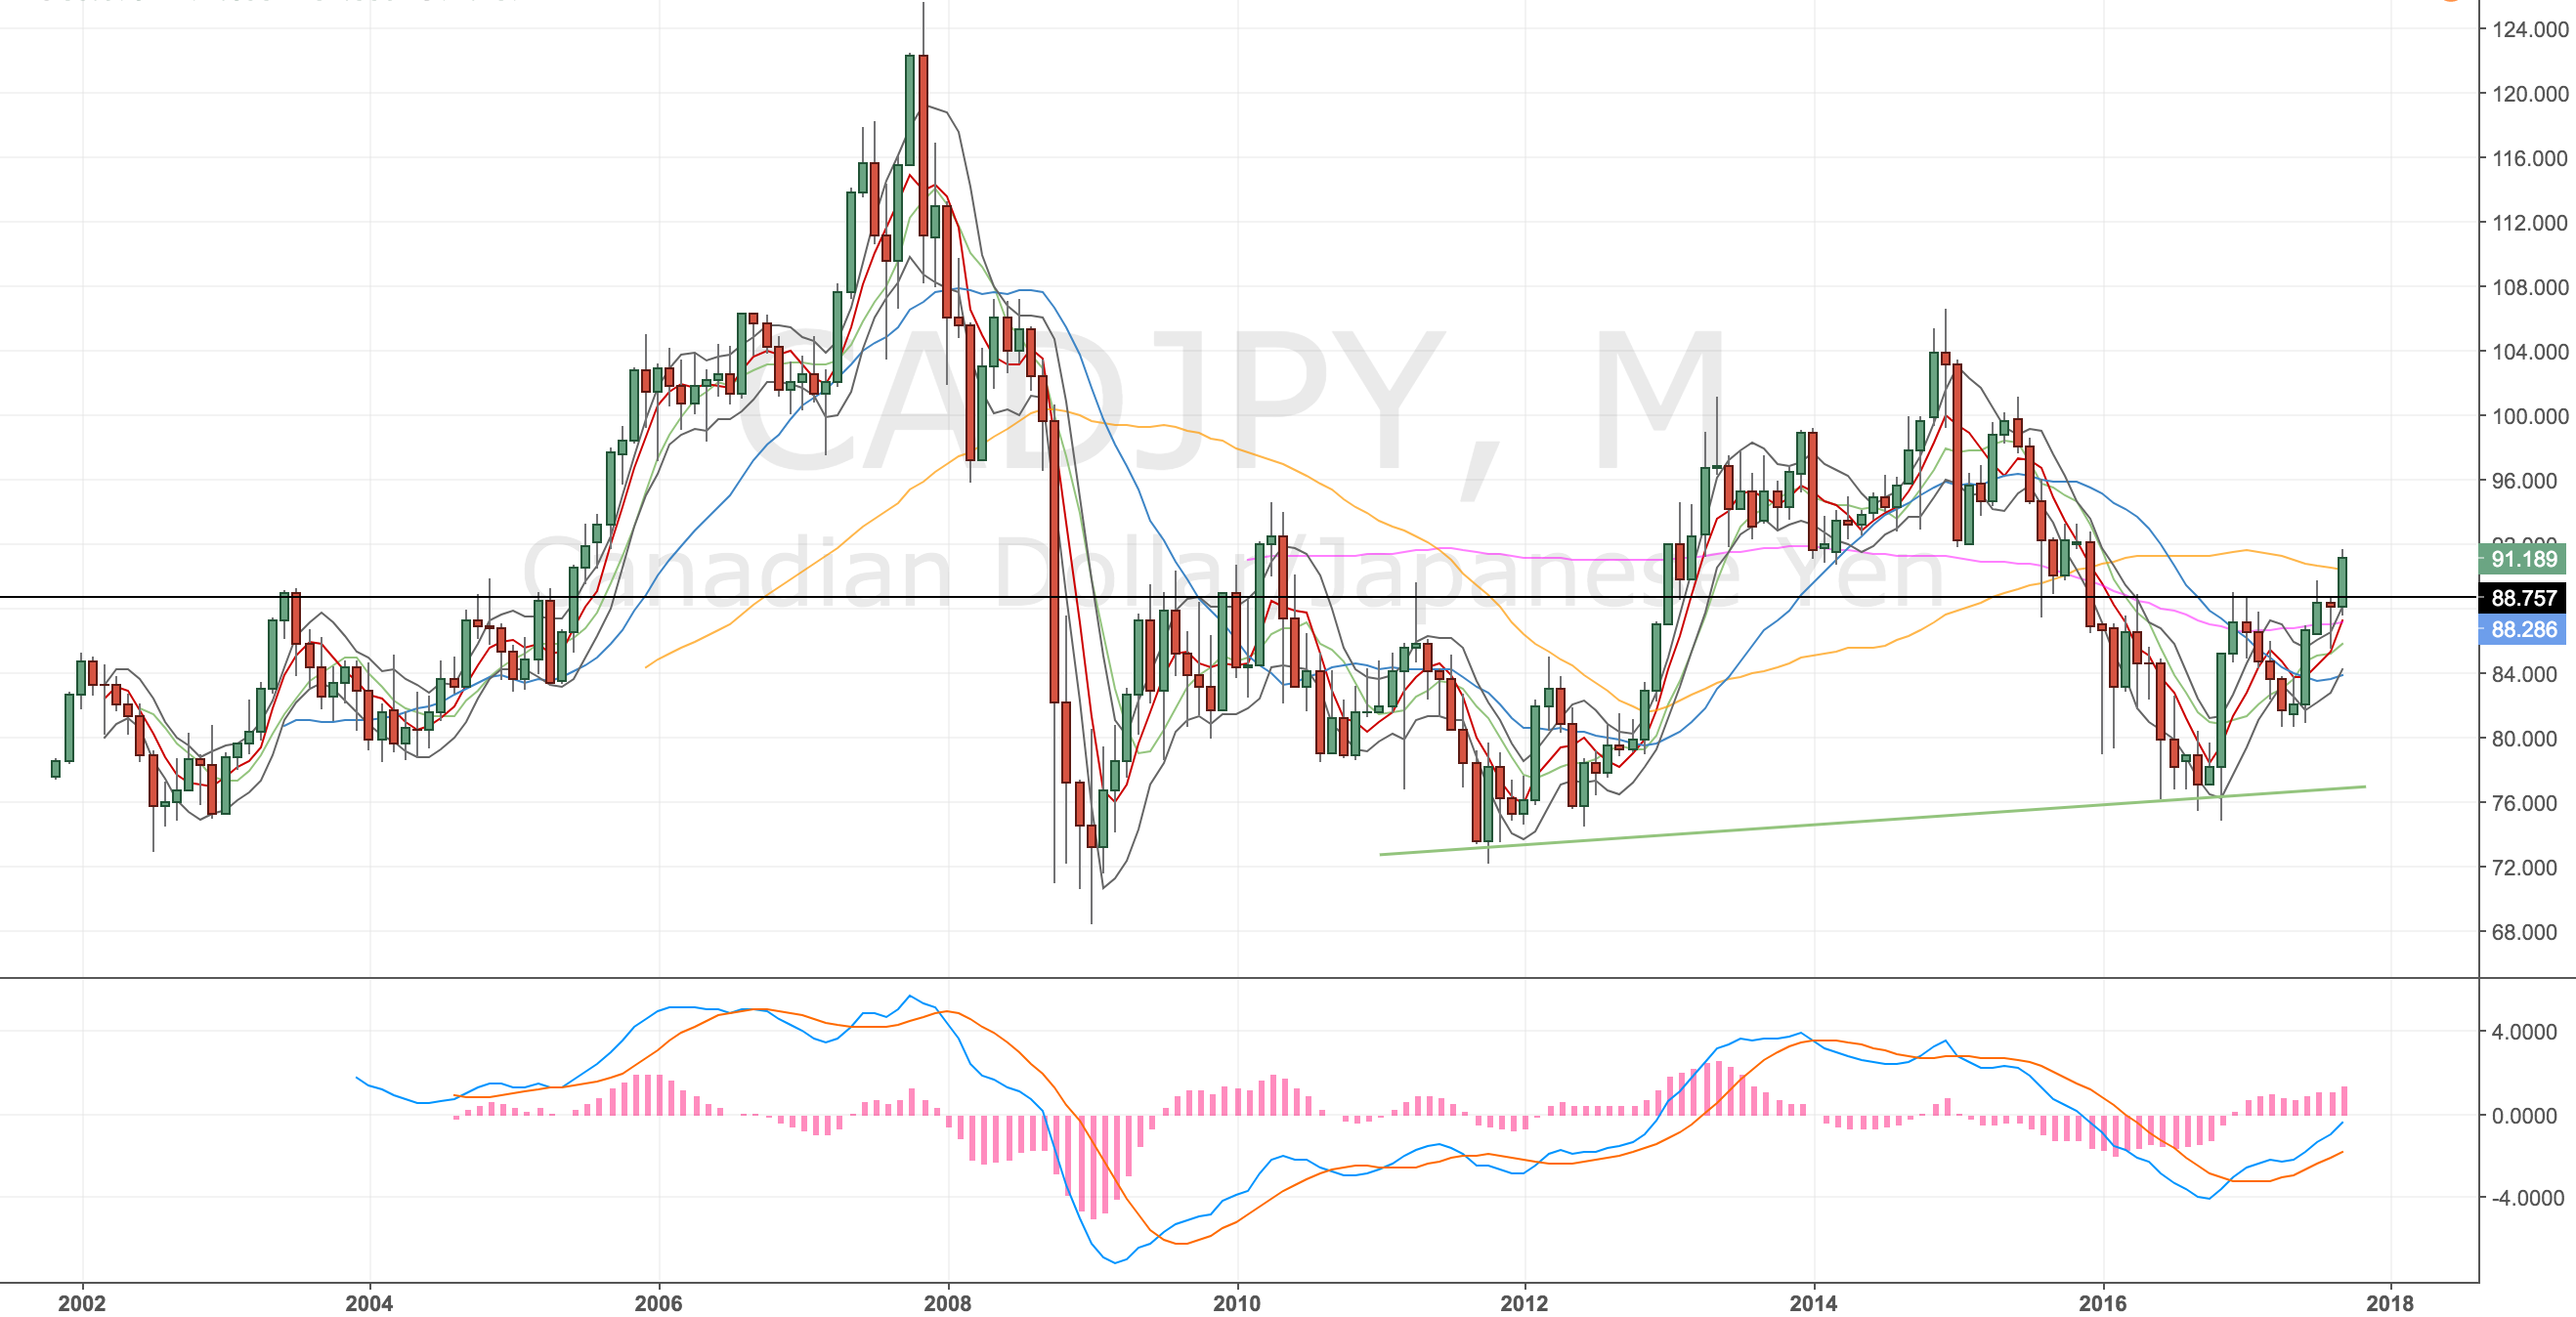
USDCAD – Missed this last week. Buy divs @ 1.3141. Short set ups @ 1.335
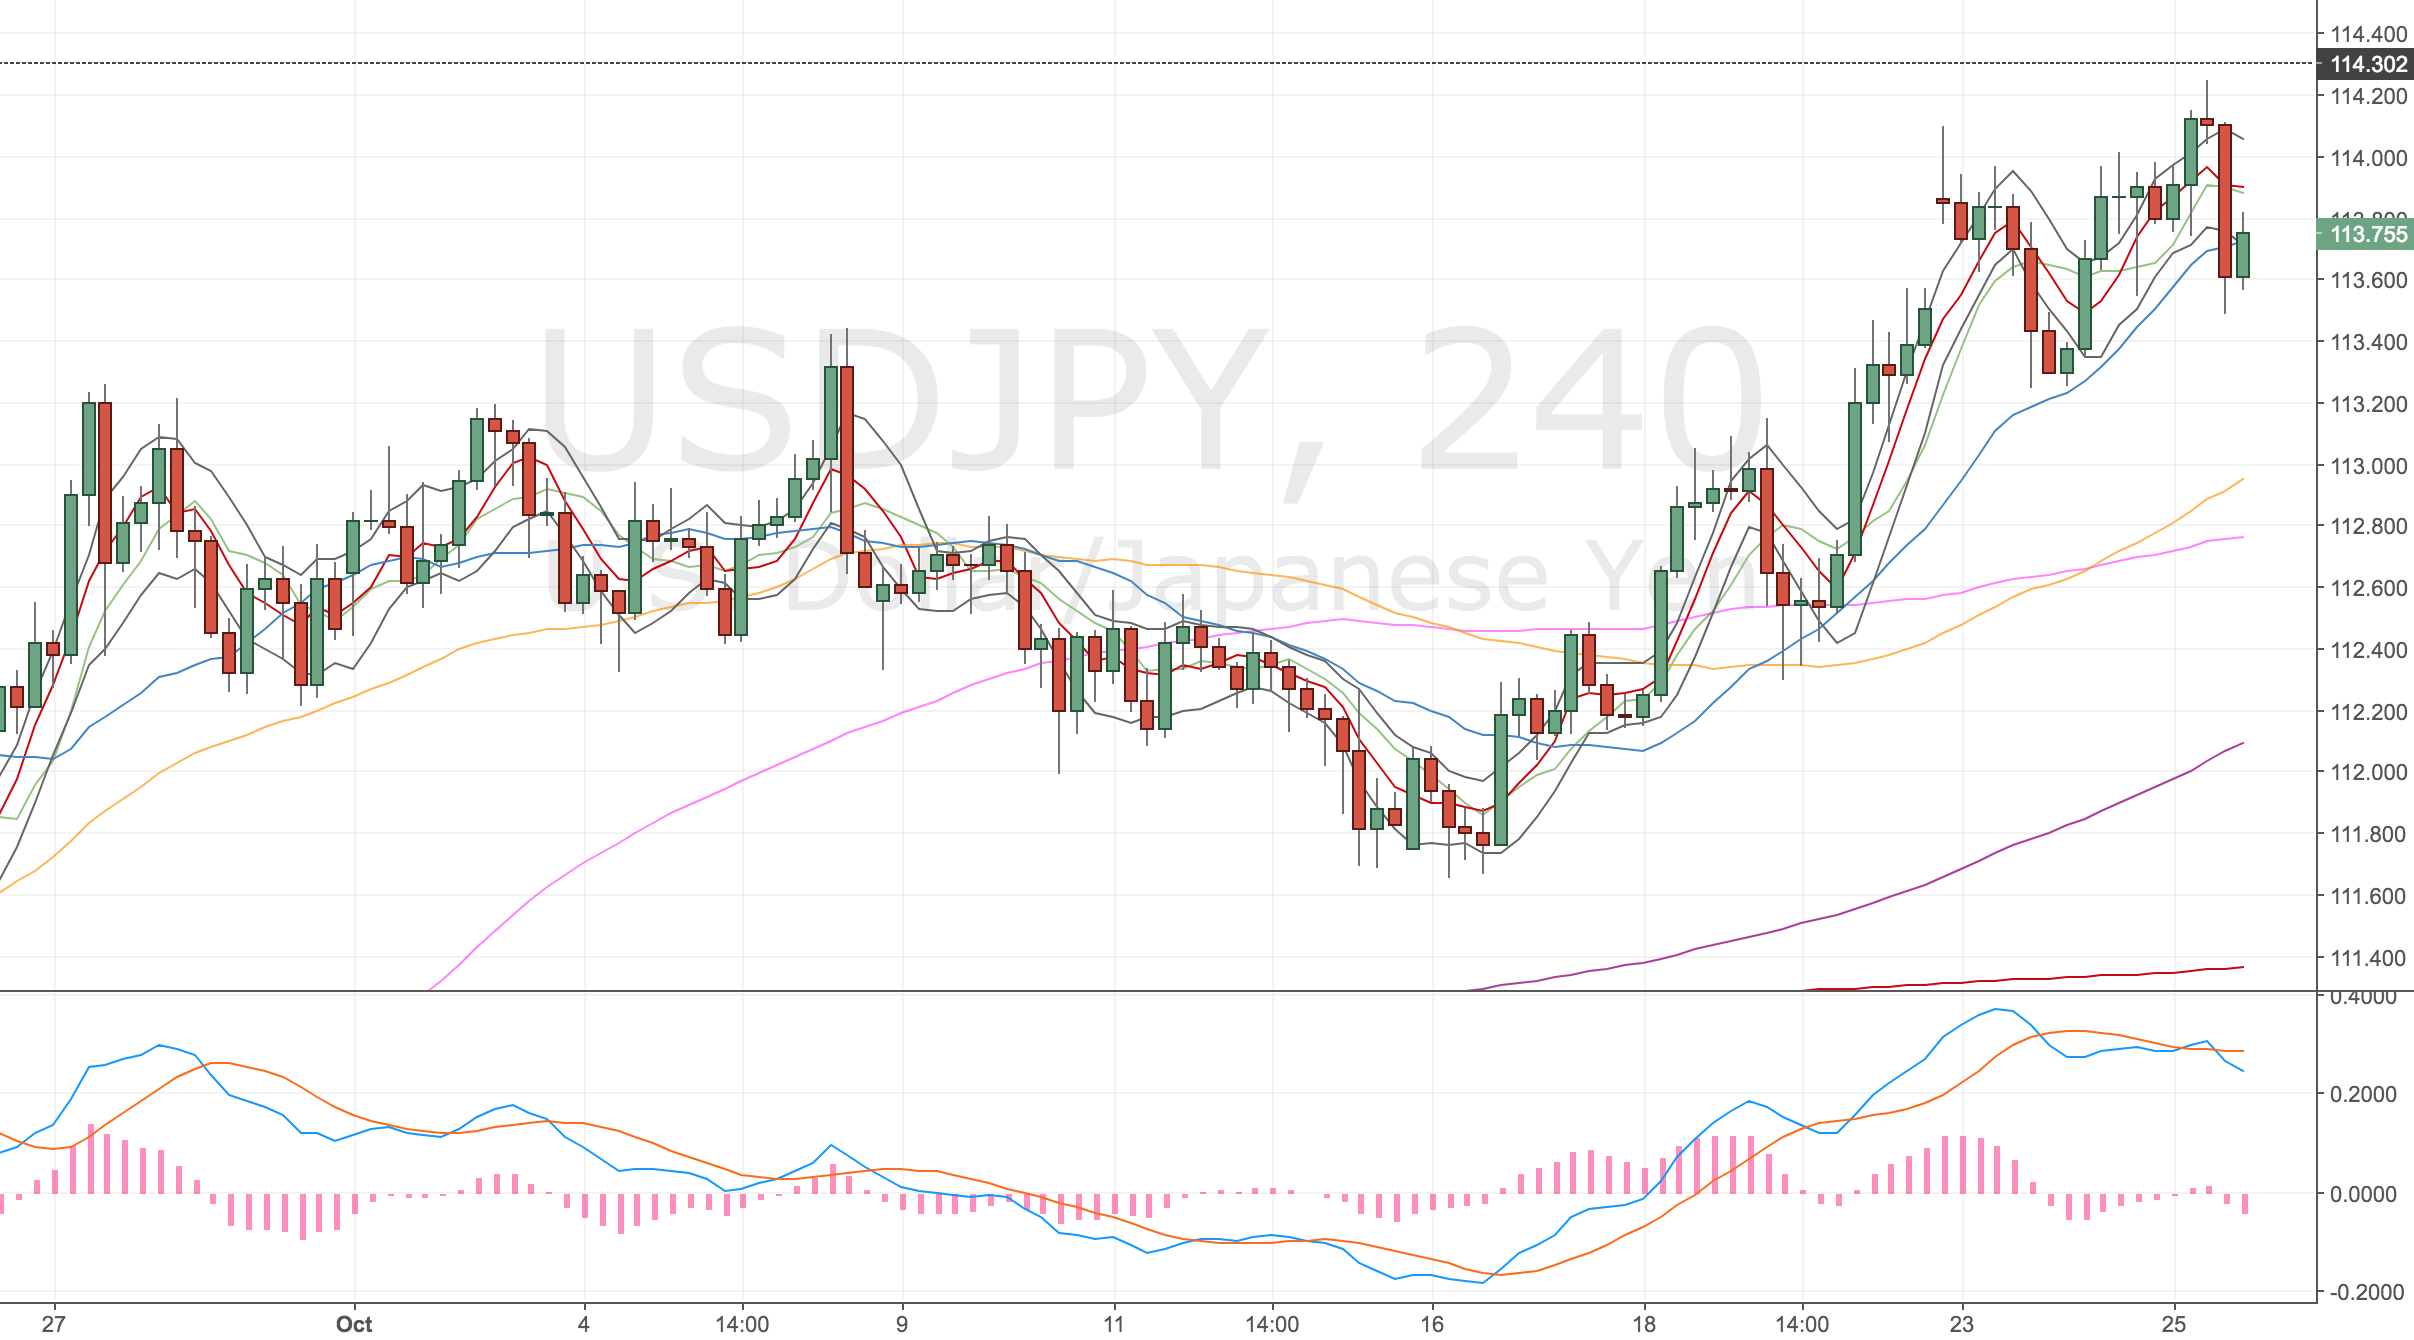
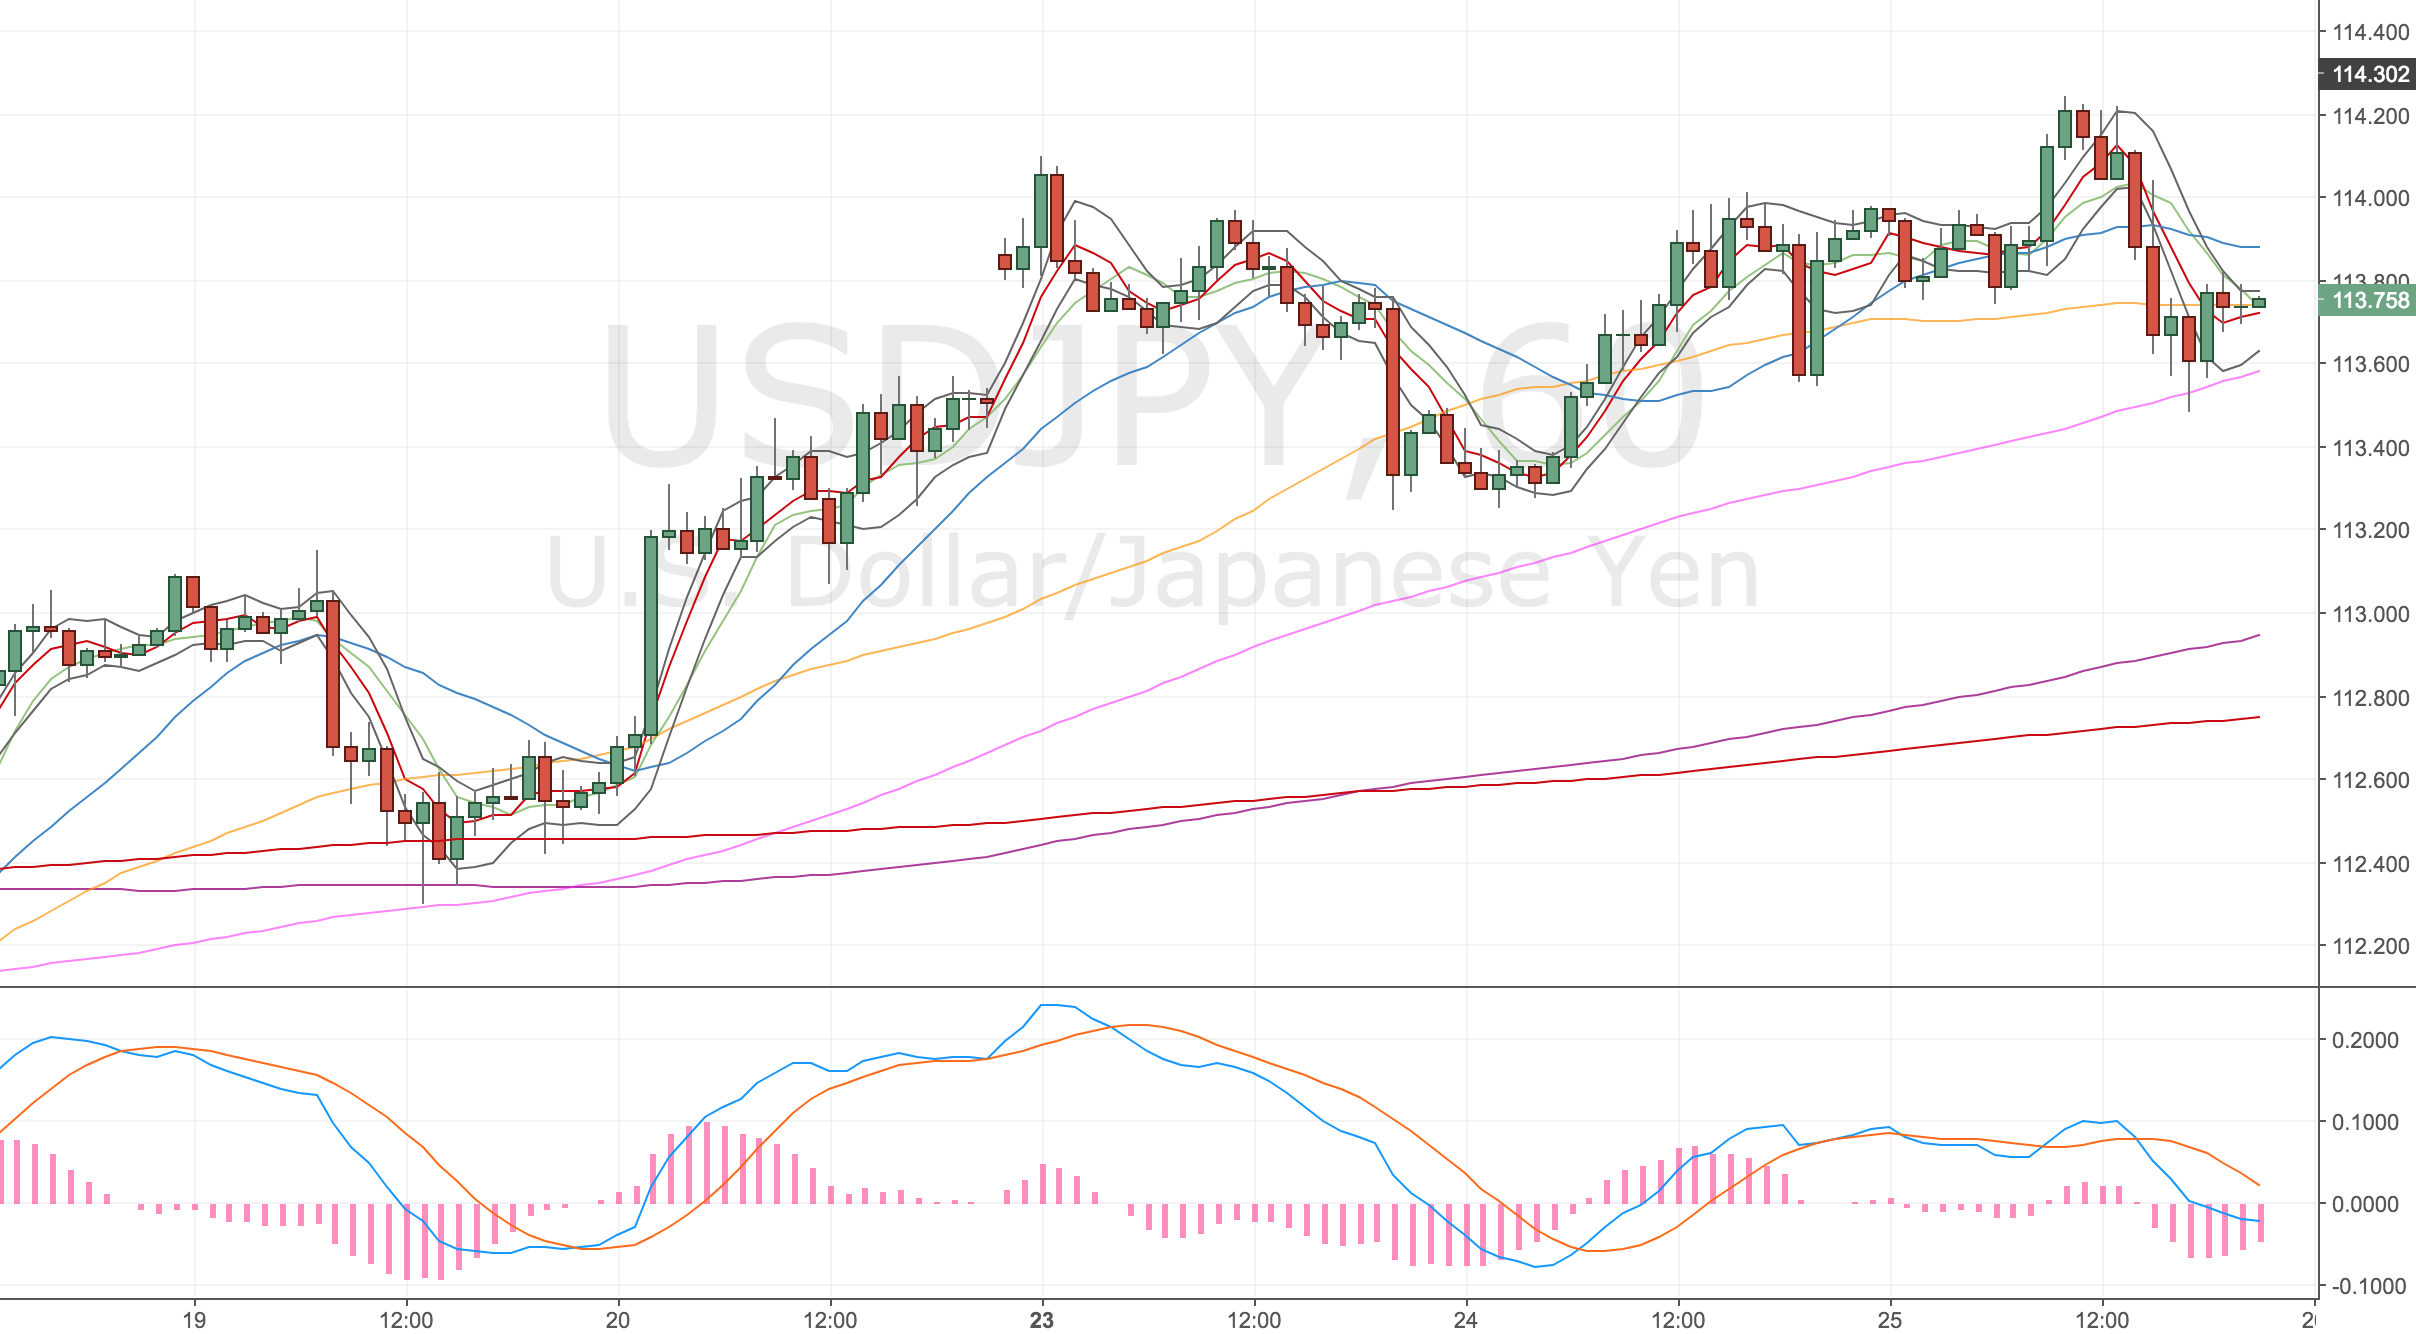
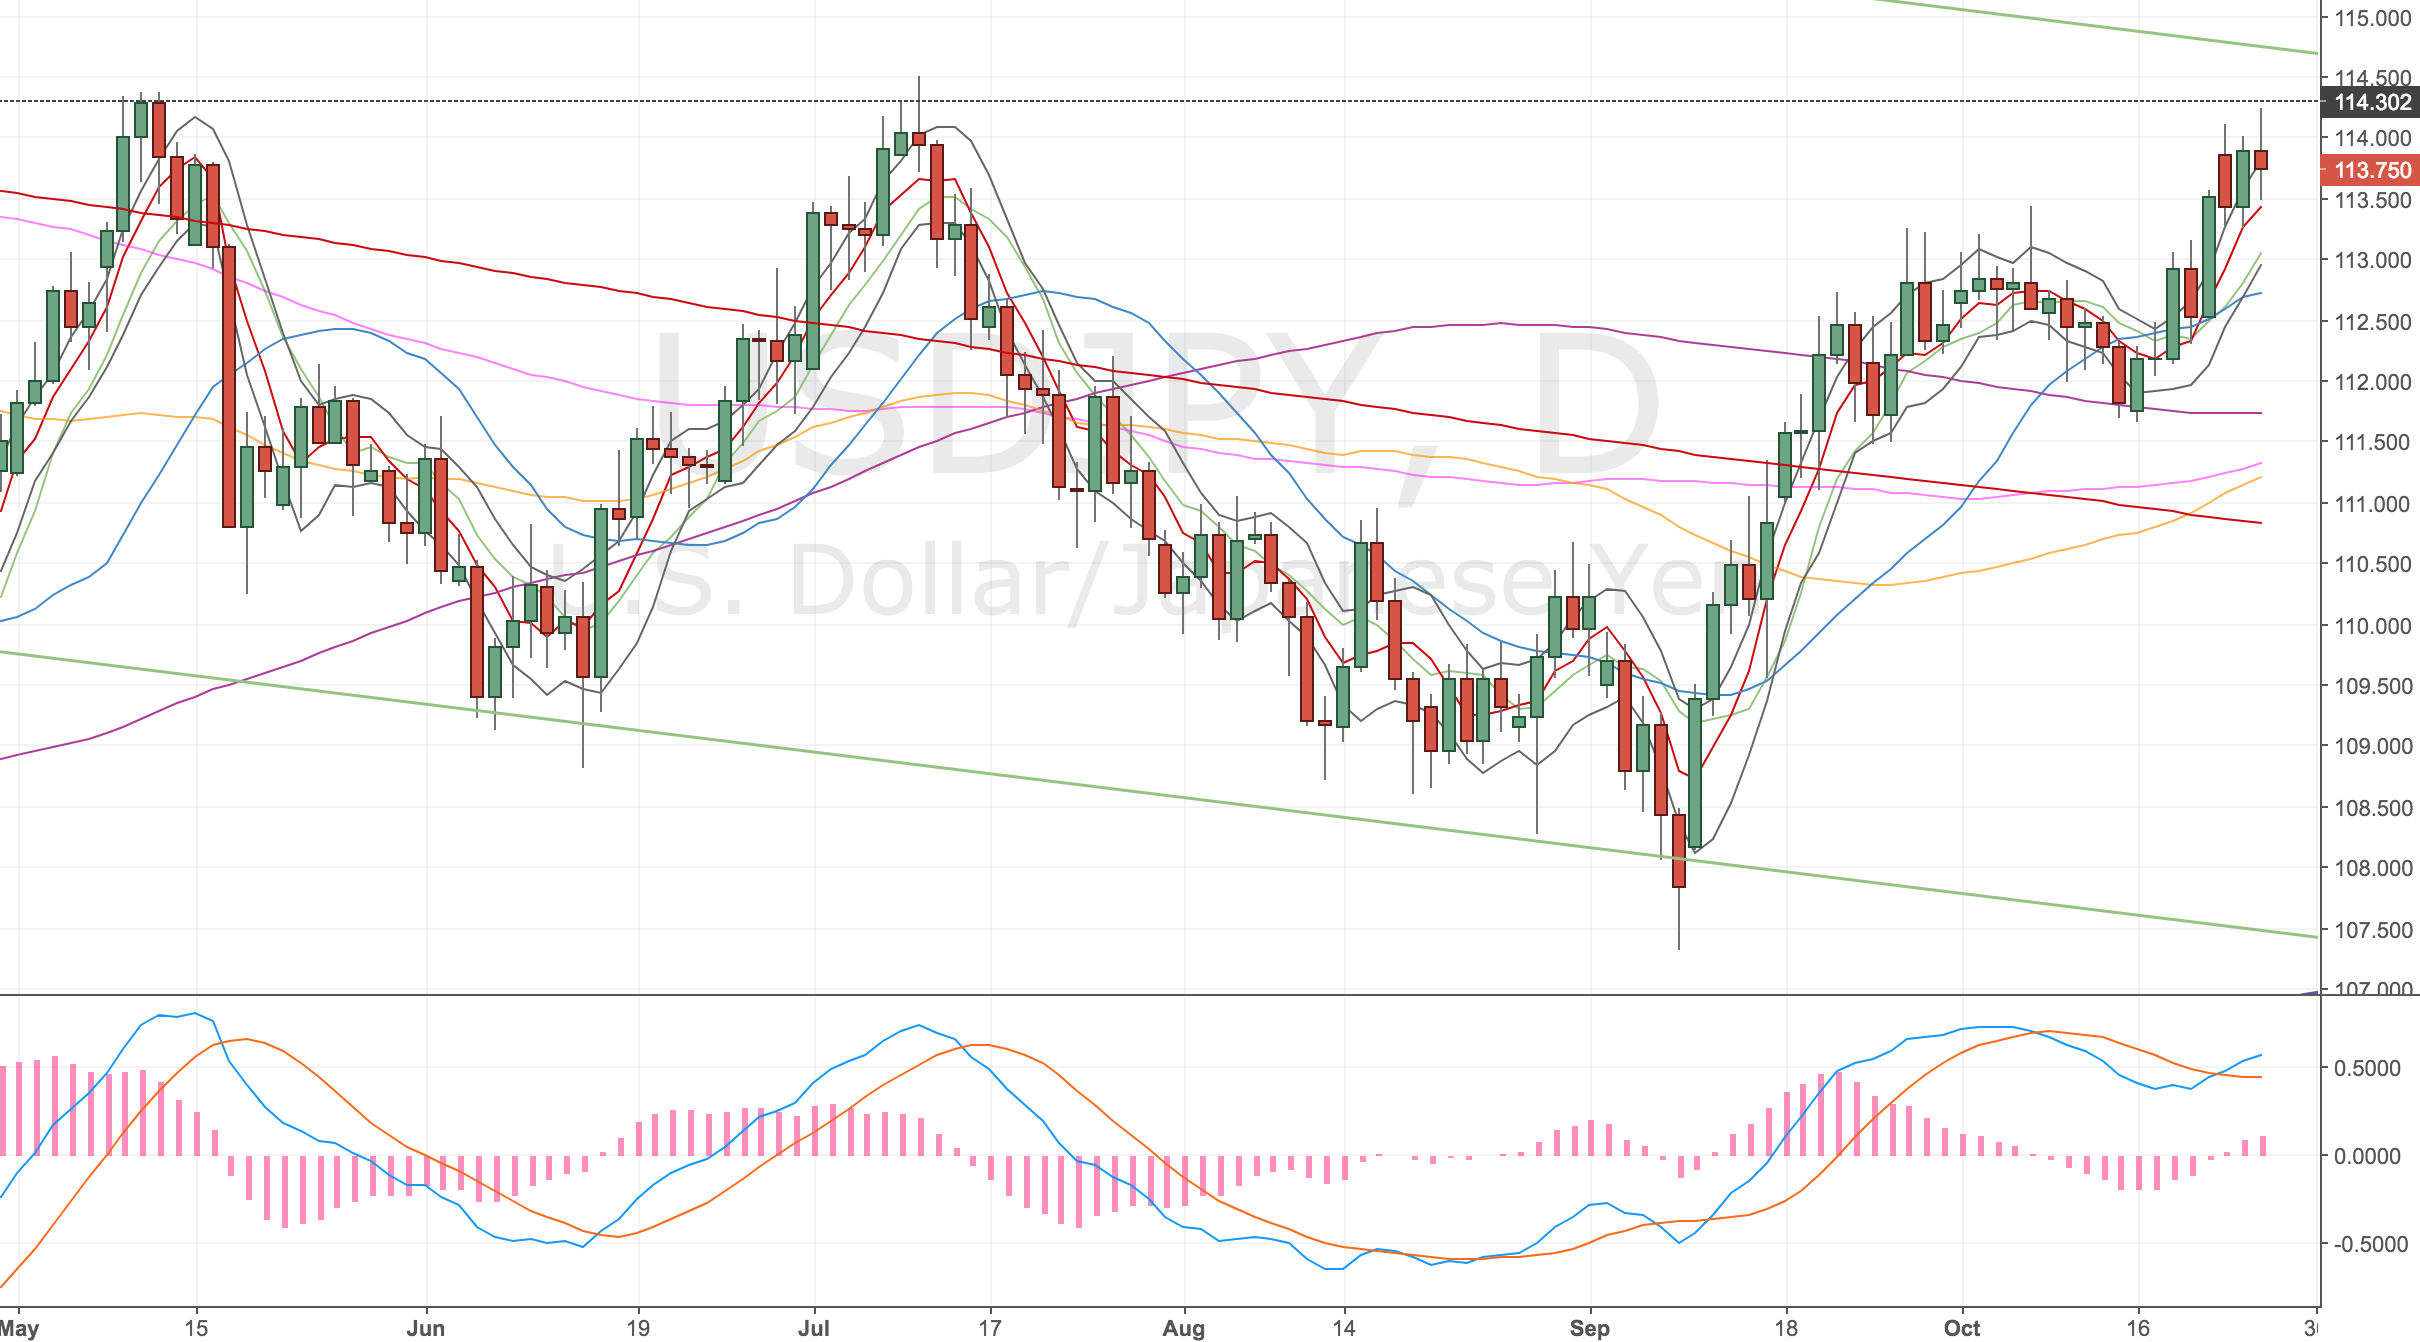
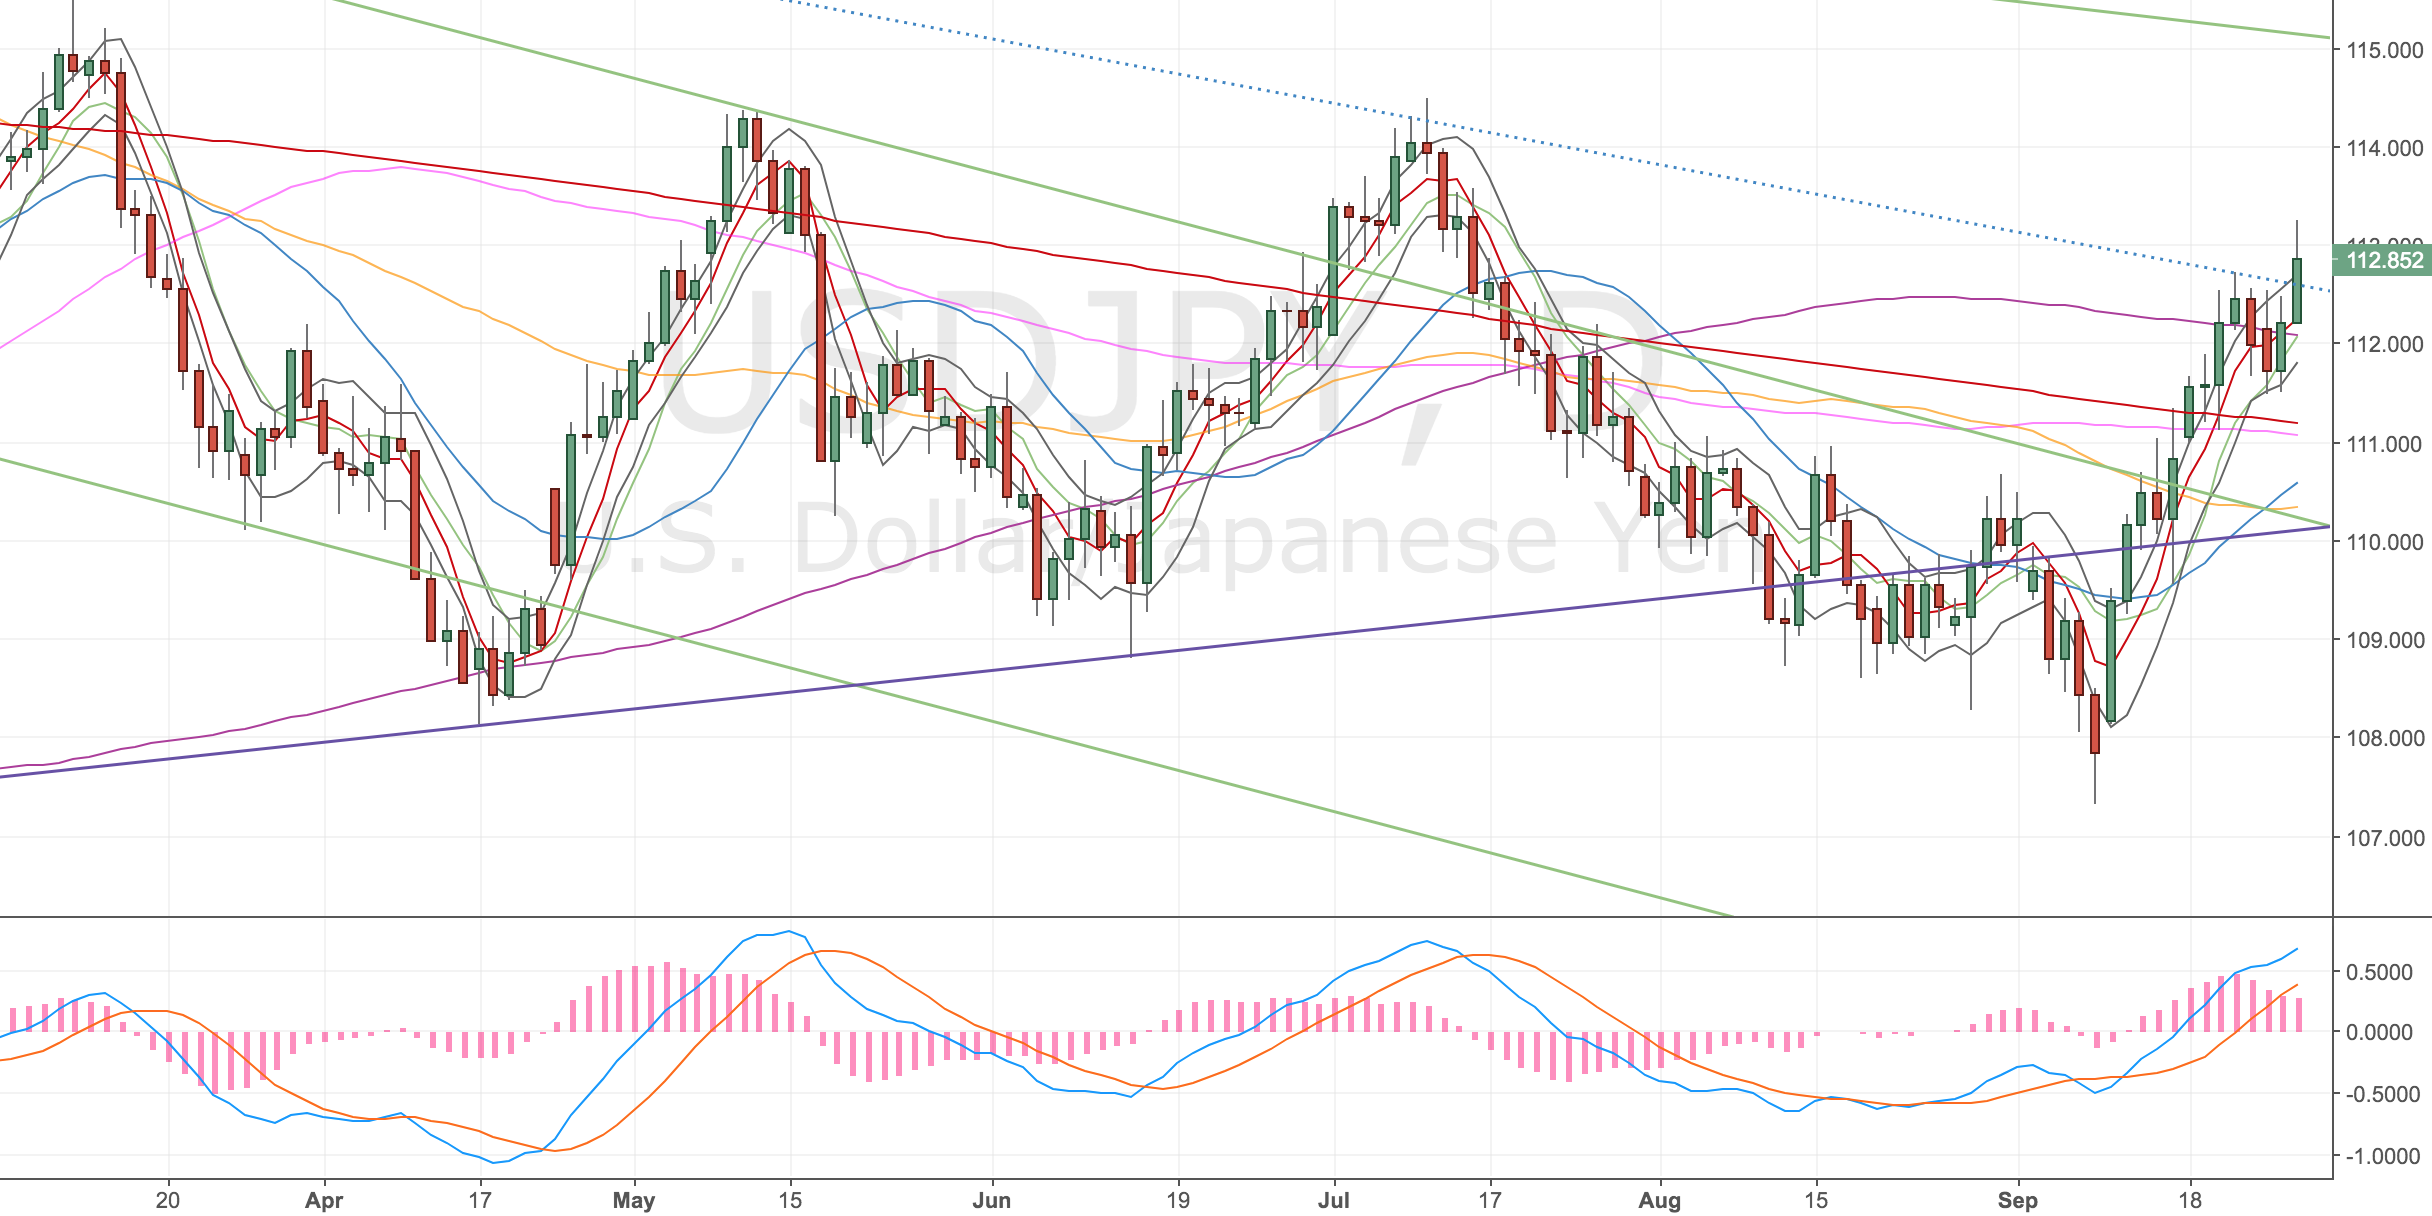
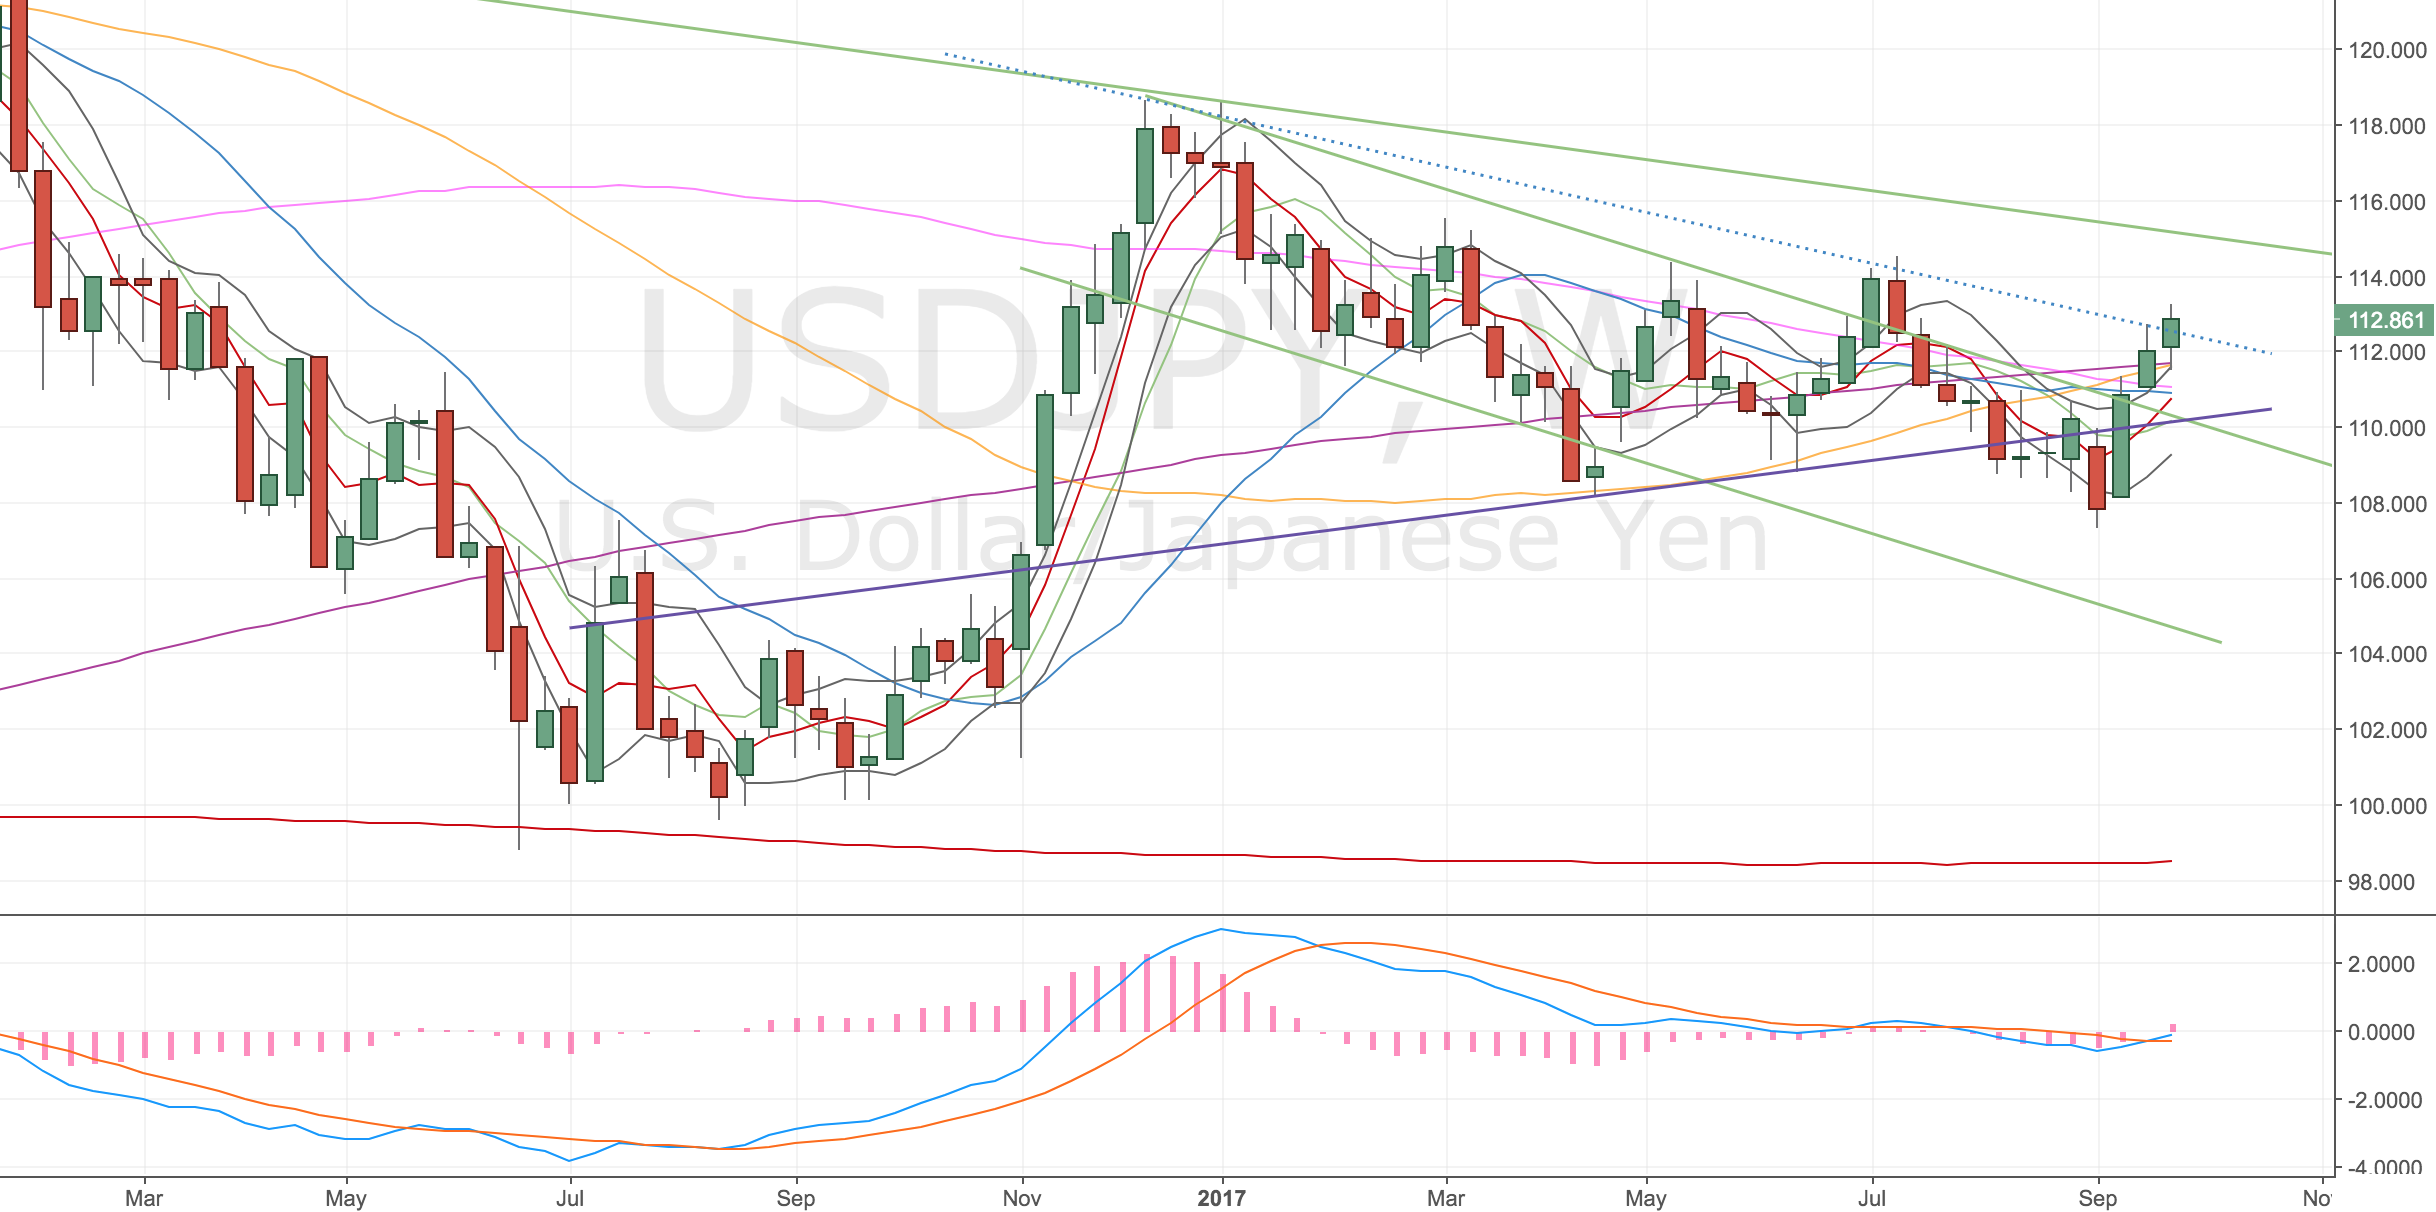
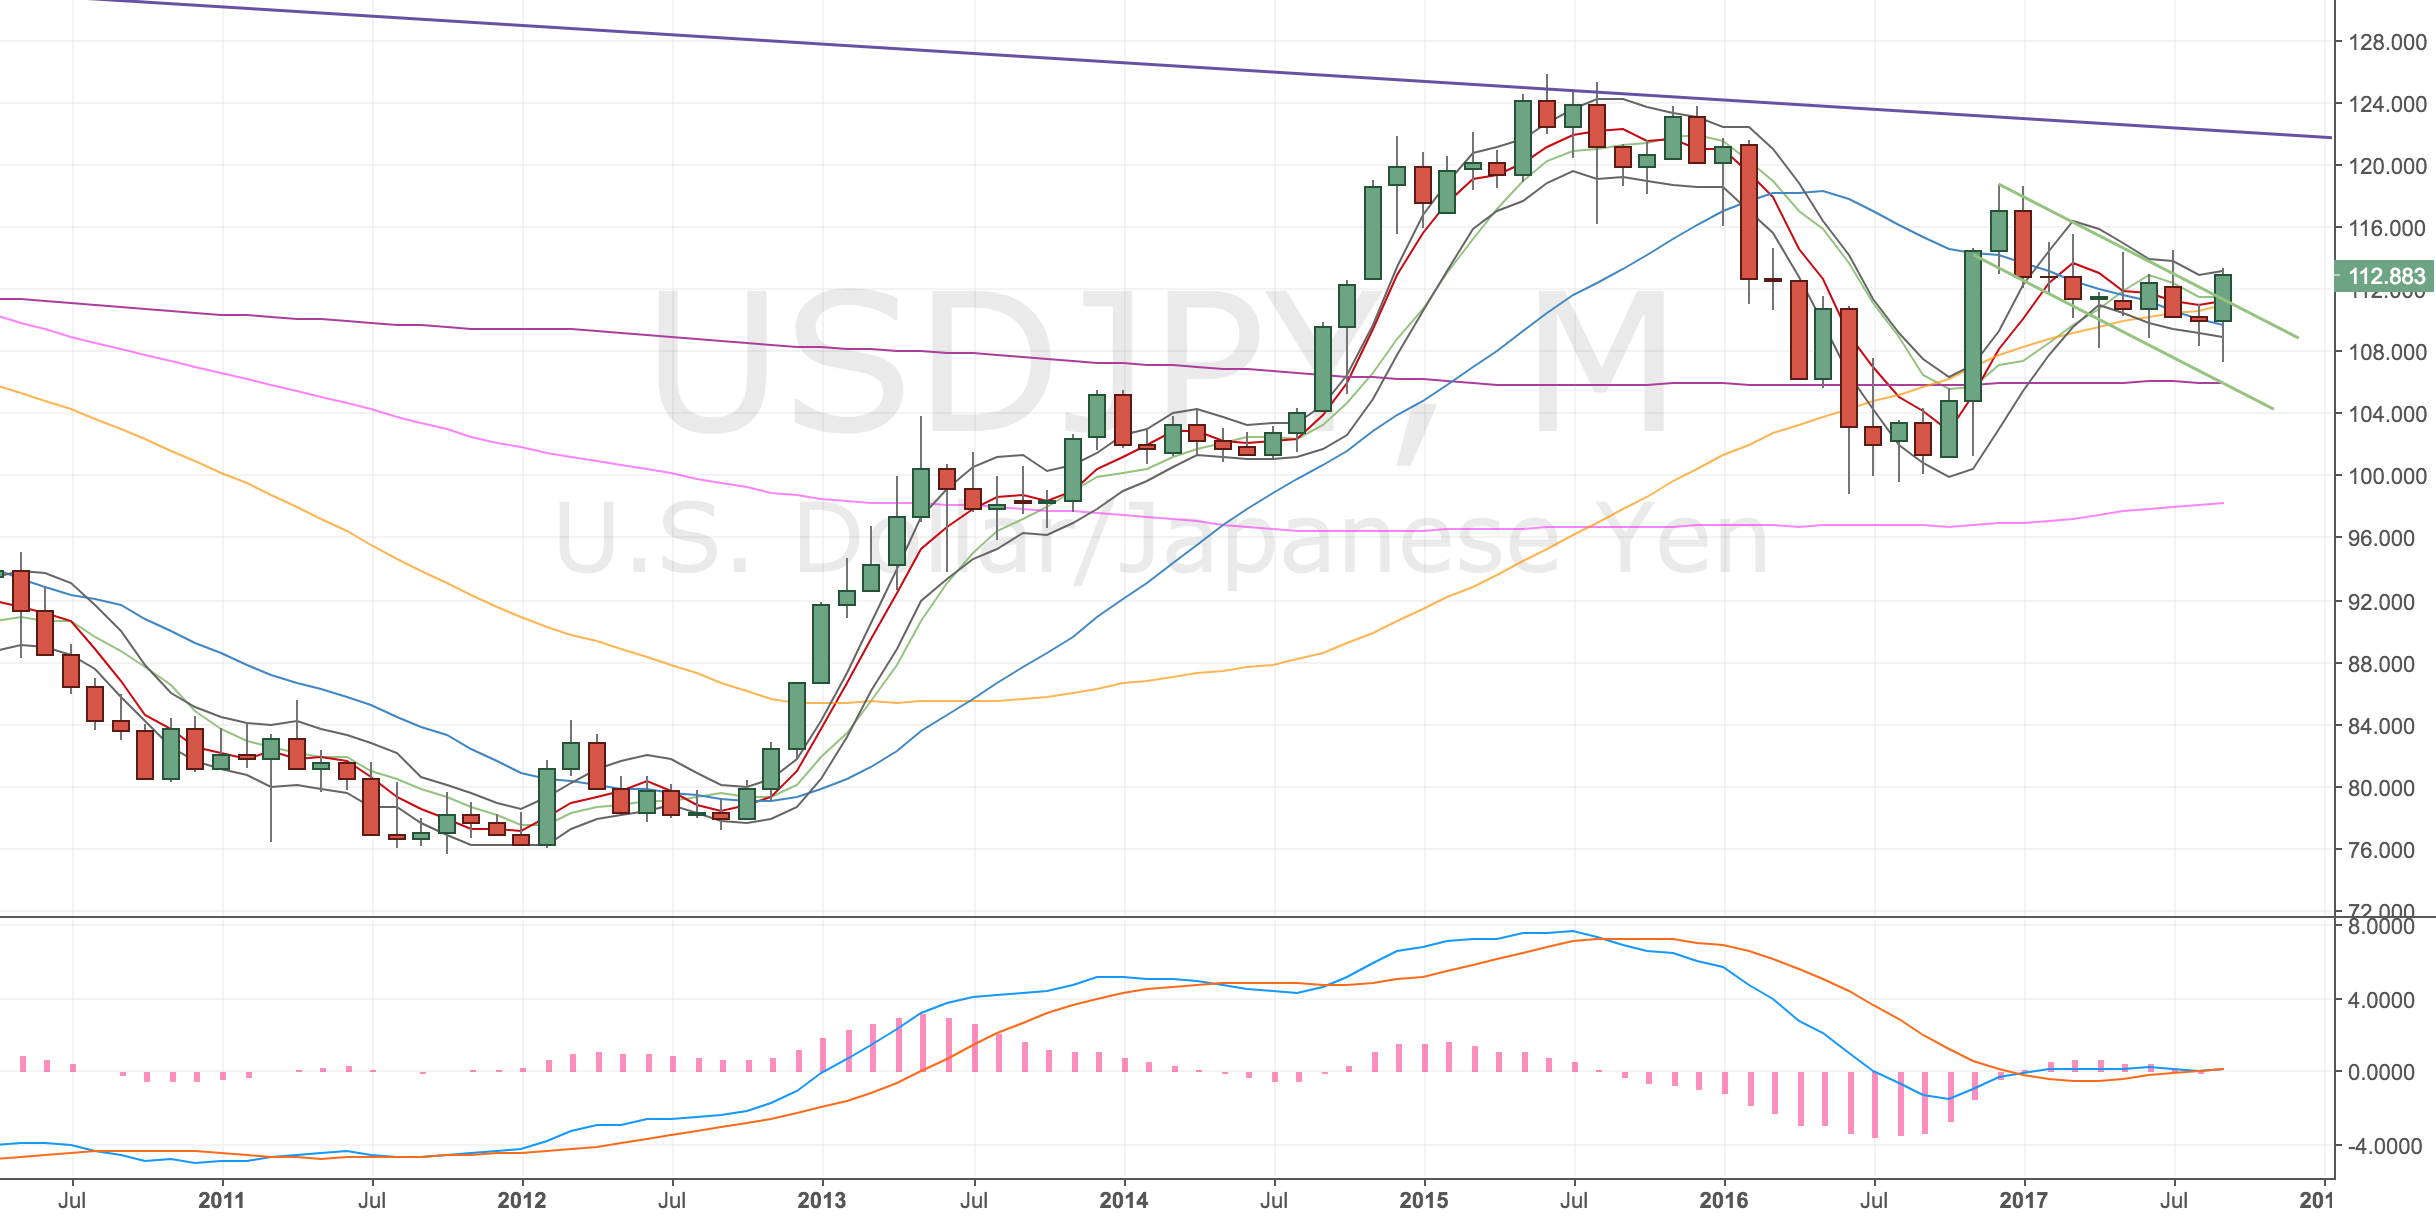
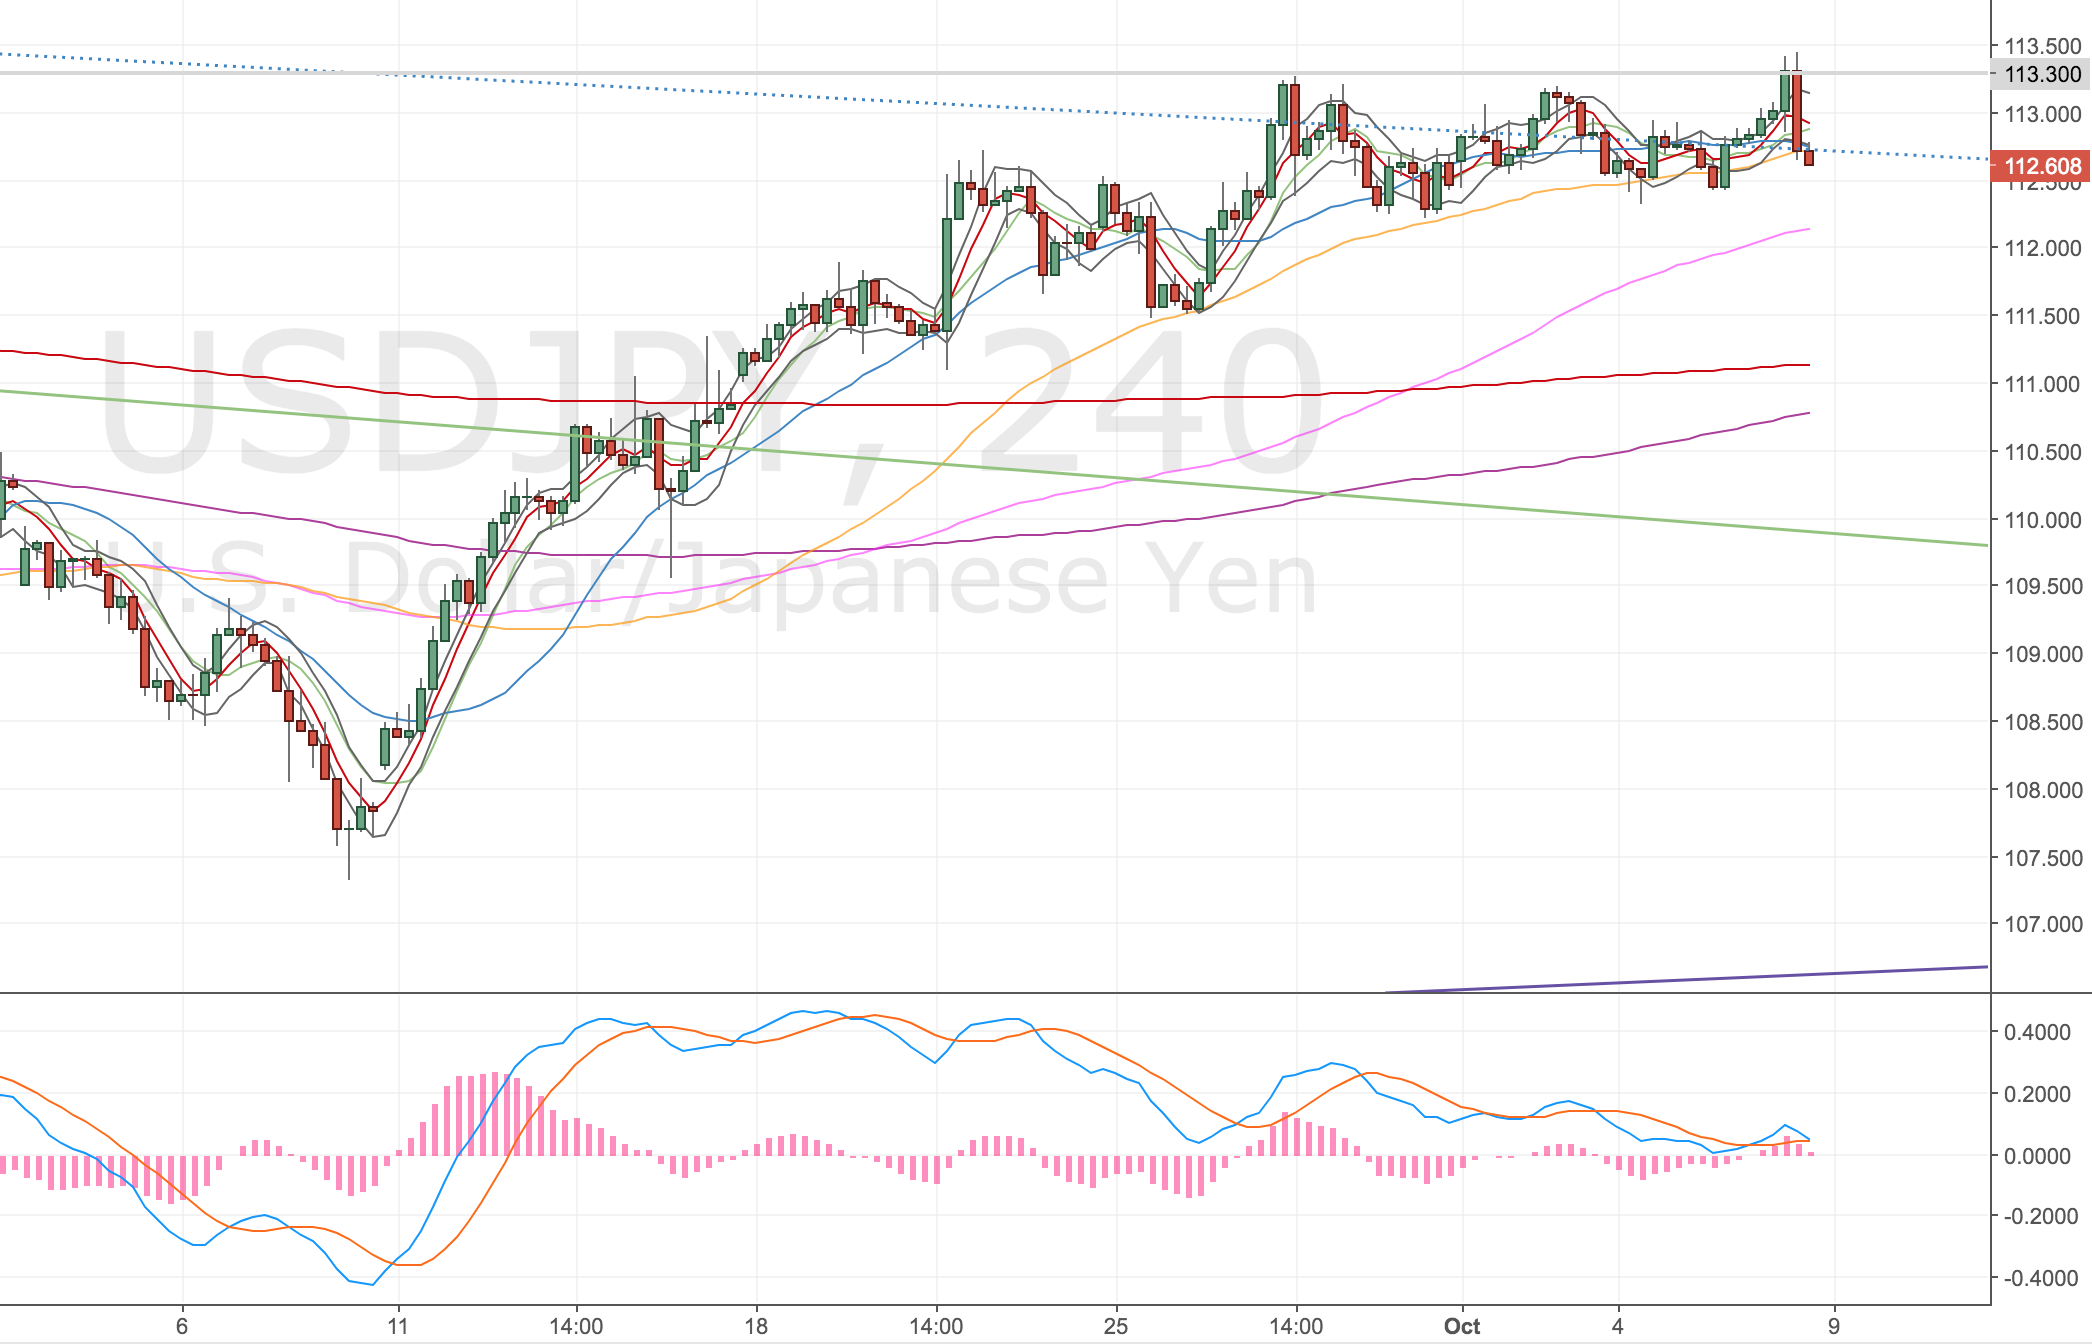
USDJPY – Buy 1h set ups @ 113.25, Short set ups 114.52

XAUUSD – Short set ups @ 1235 to 1239s
USOIL – Buy set ups @ 49.15 (diverging now)
UK100 – Buy set ups @ 6860

Outlook

Here’s the outlook for the currency indices…

This week, look for …
Longs: DXY CXY, AXY
Neutral: JXY
Shorts: EXY, BXY

EXY

Same as last two weeks, looks bullish in the long-term, will need to watch for buy set ups from support. I think a 111 test is on the cards.

Monthly – Looks like it’ll want to head higher to the TL, pebble on a pond
Weekly – Looks like a move down to 111 is likely before heading higher
Daily – Down to the 111s
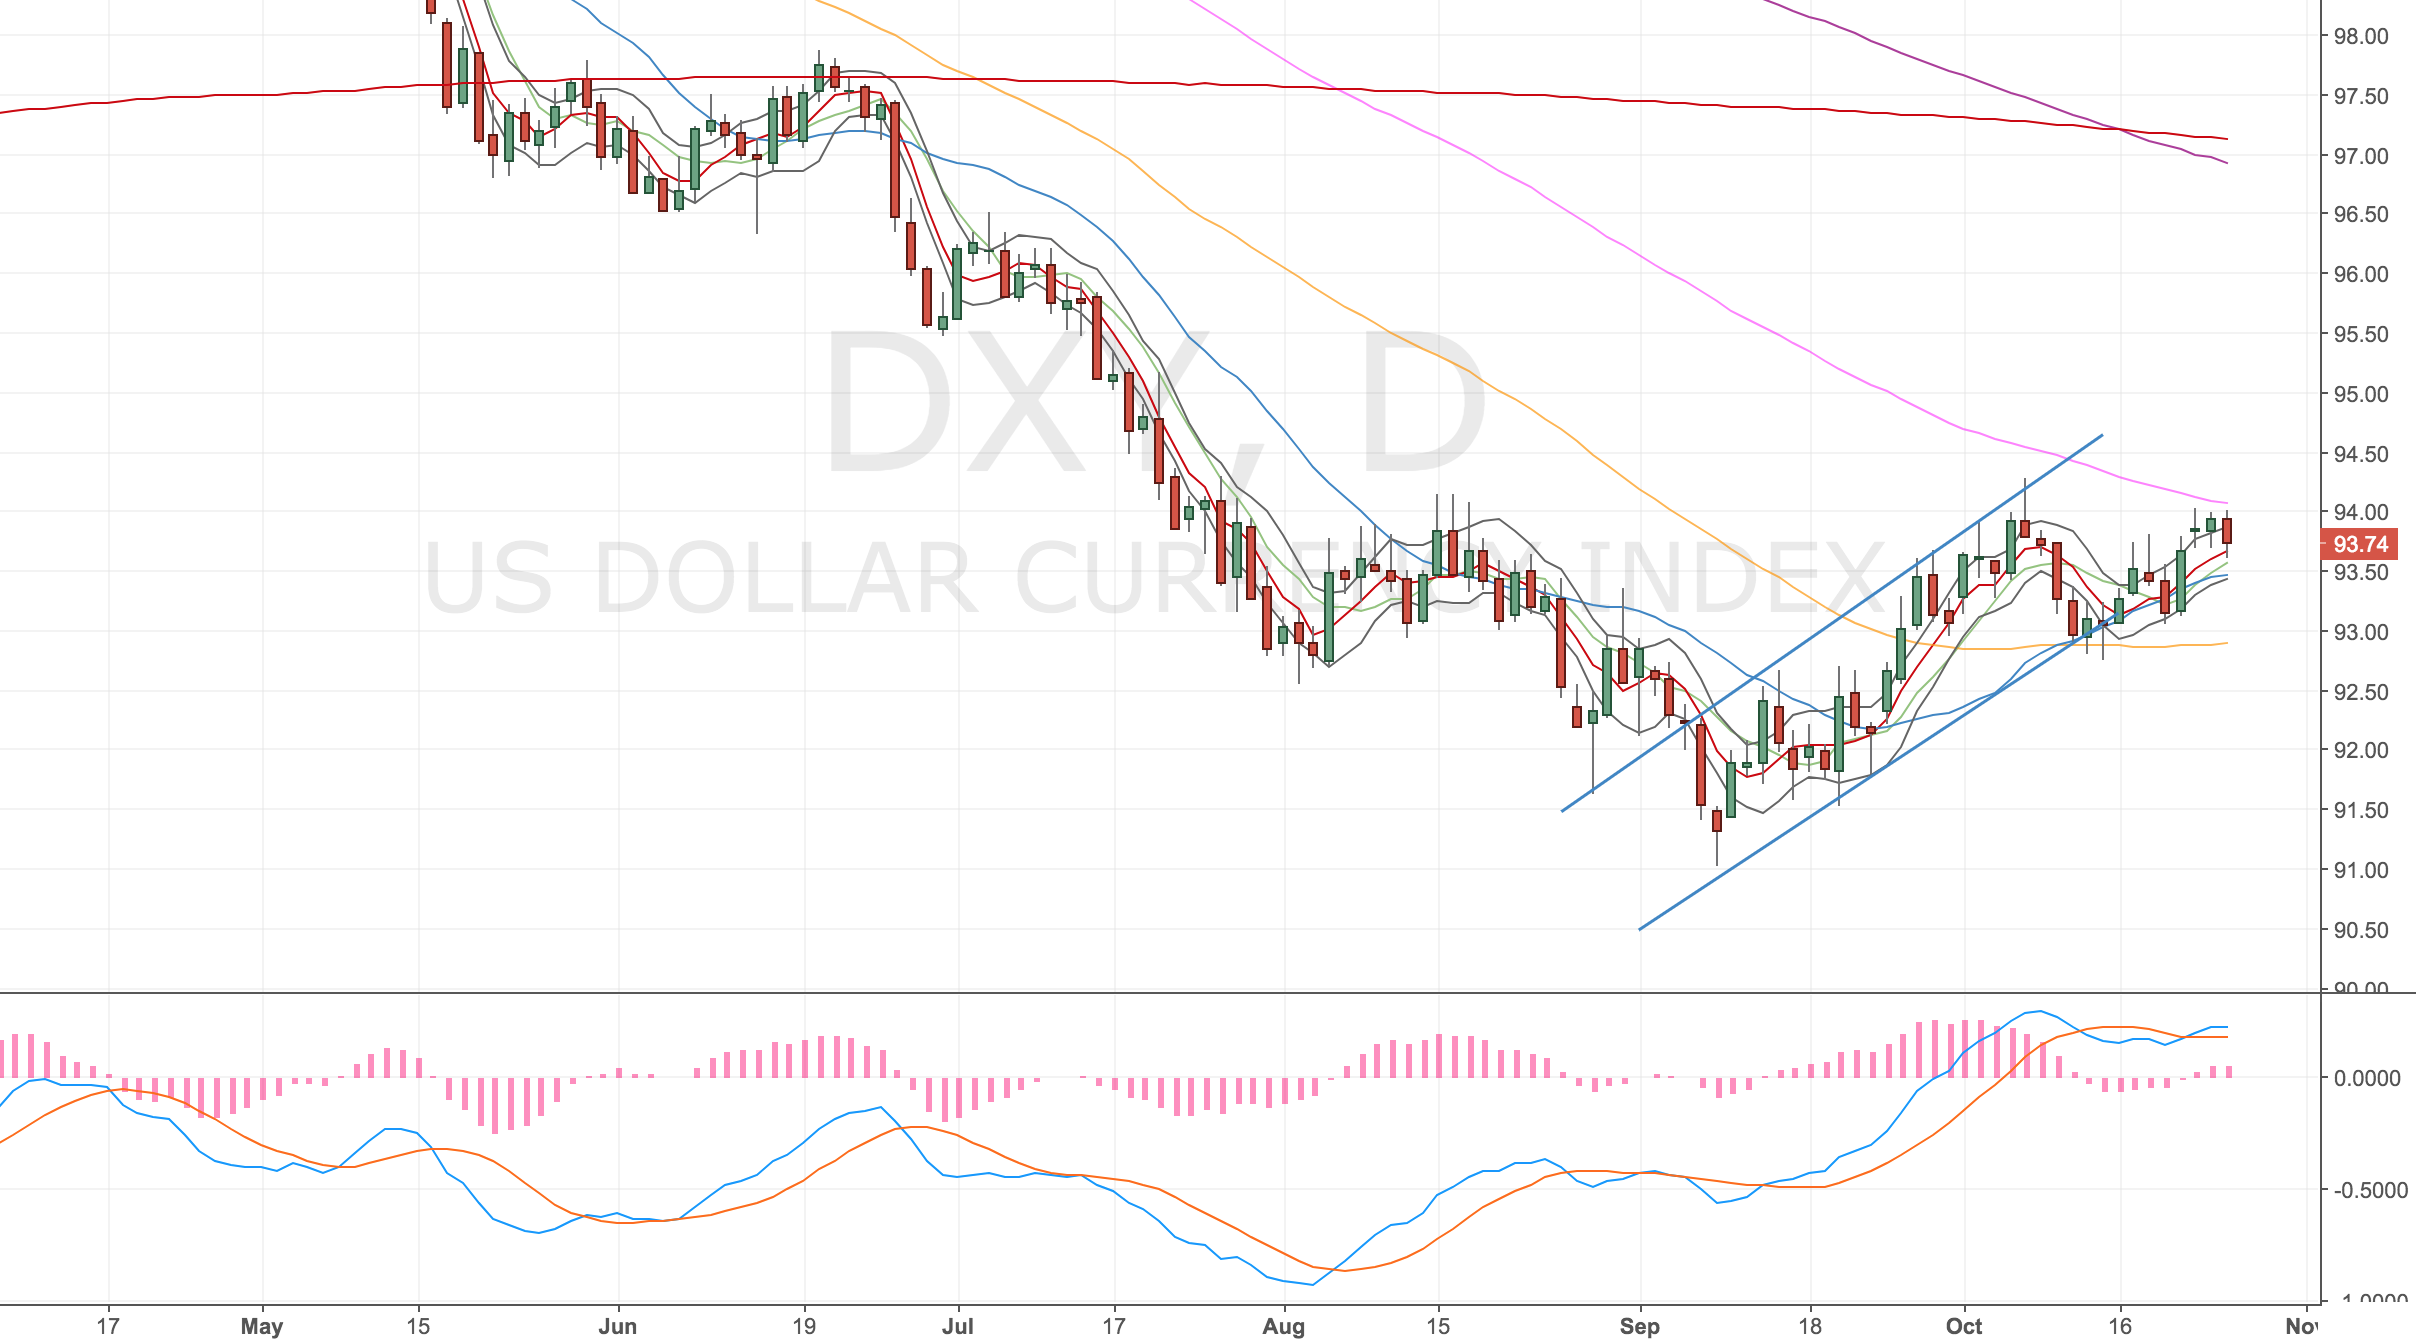
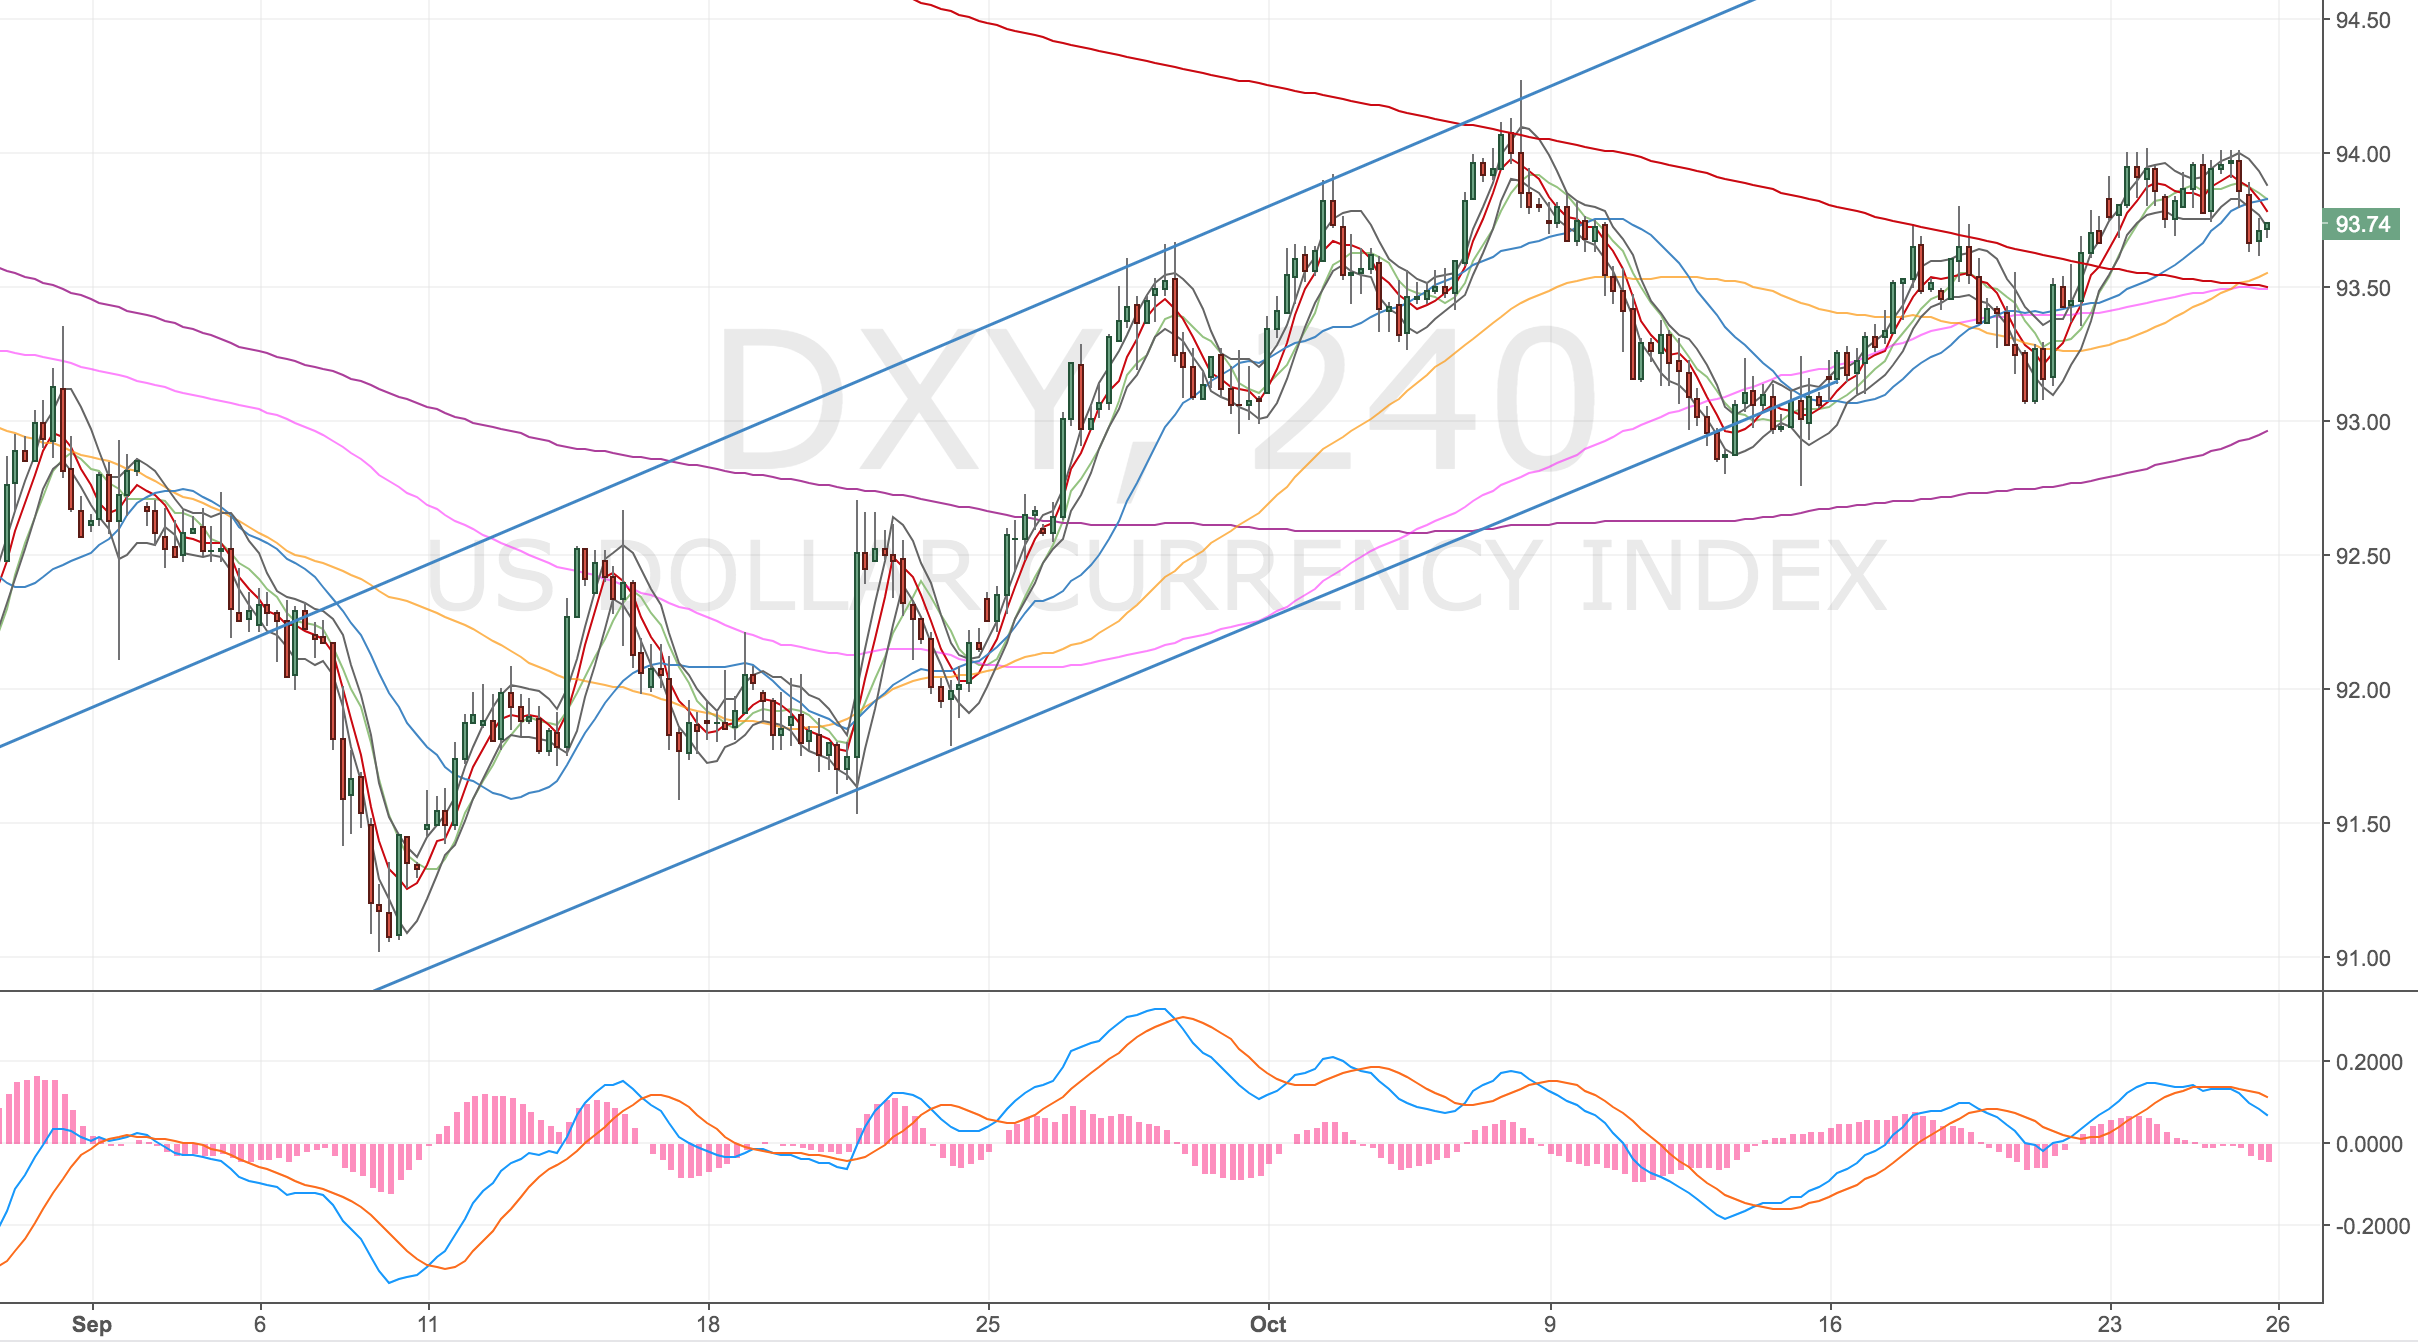
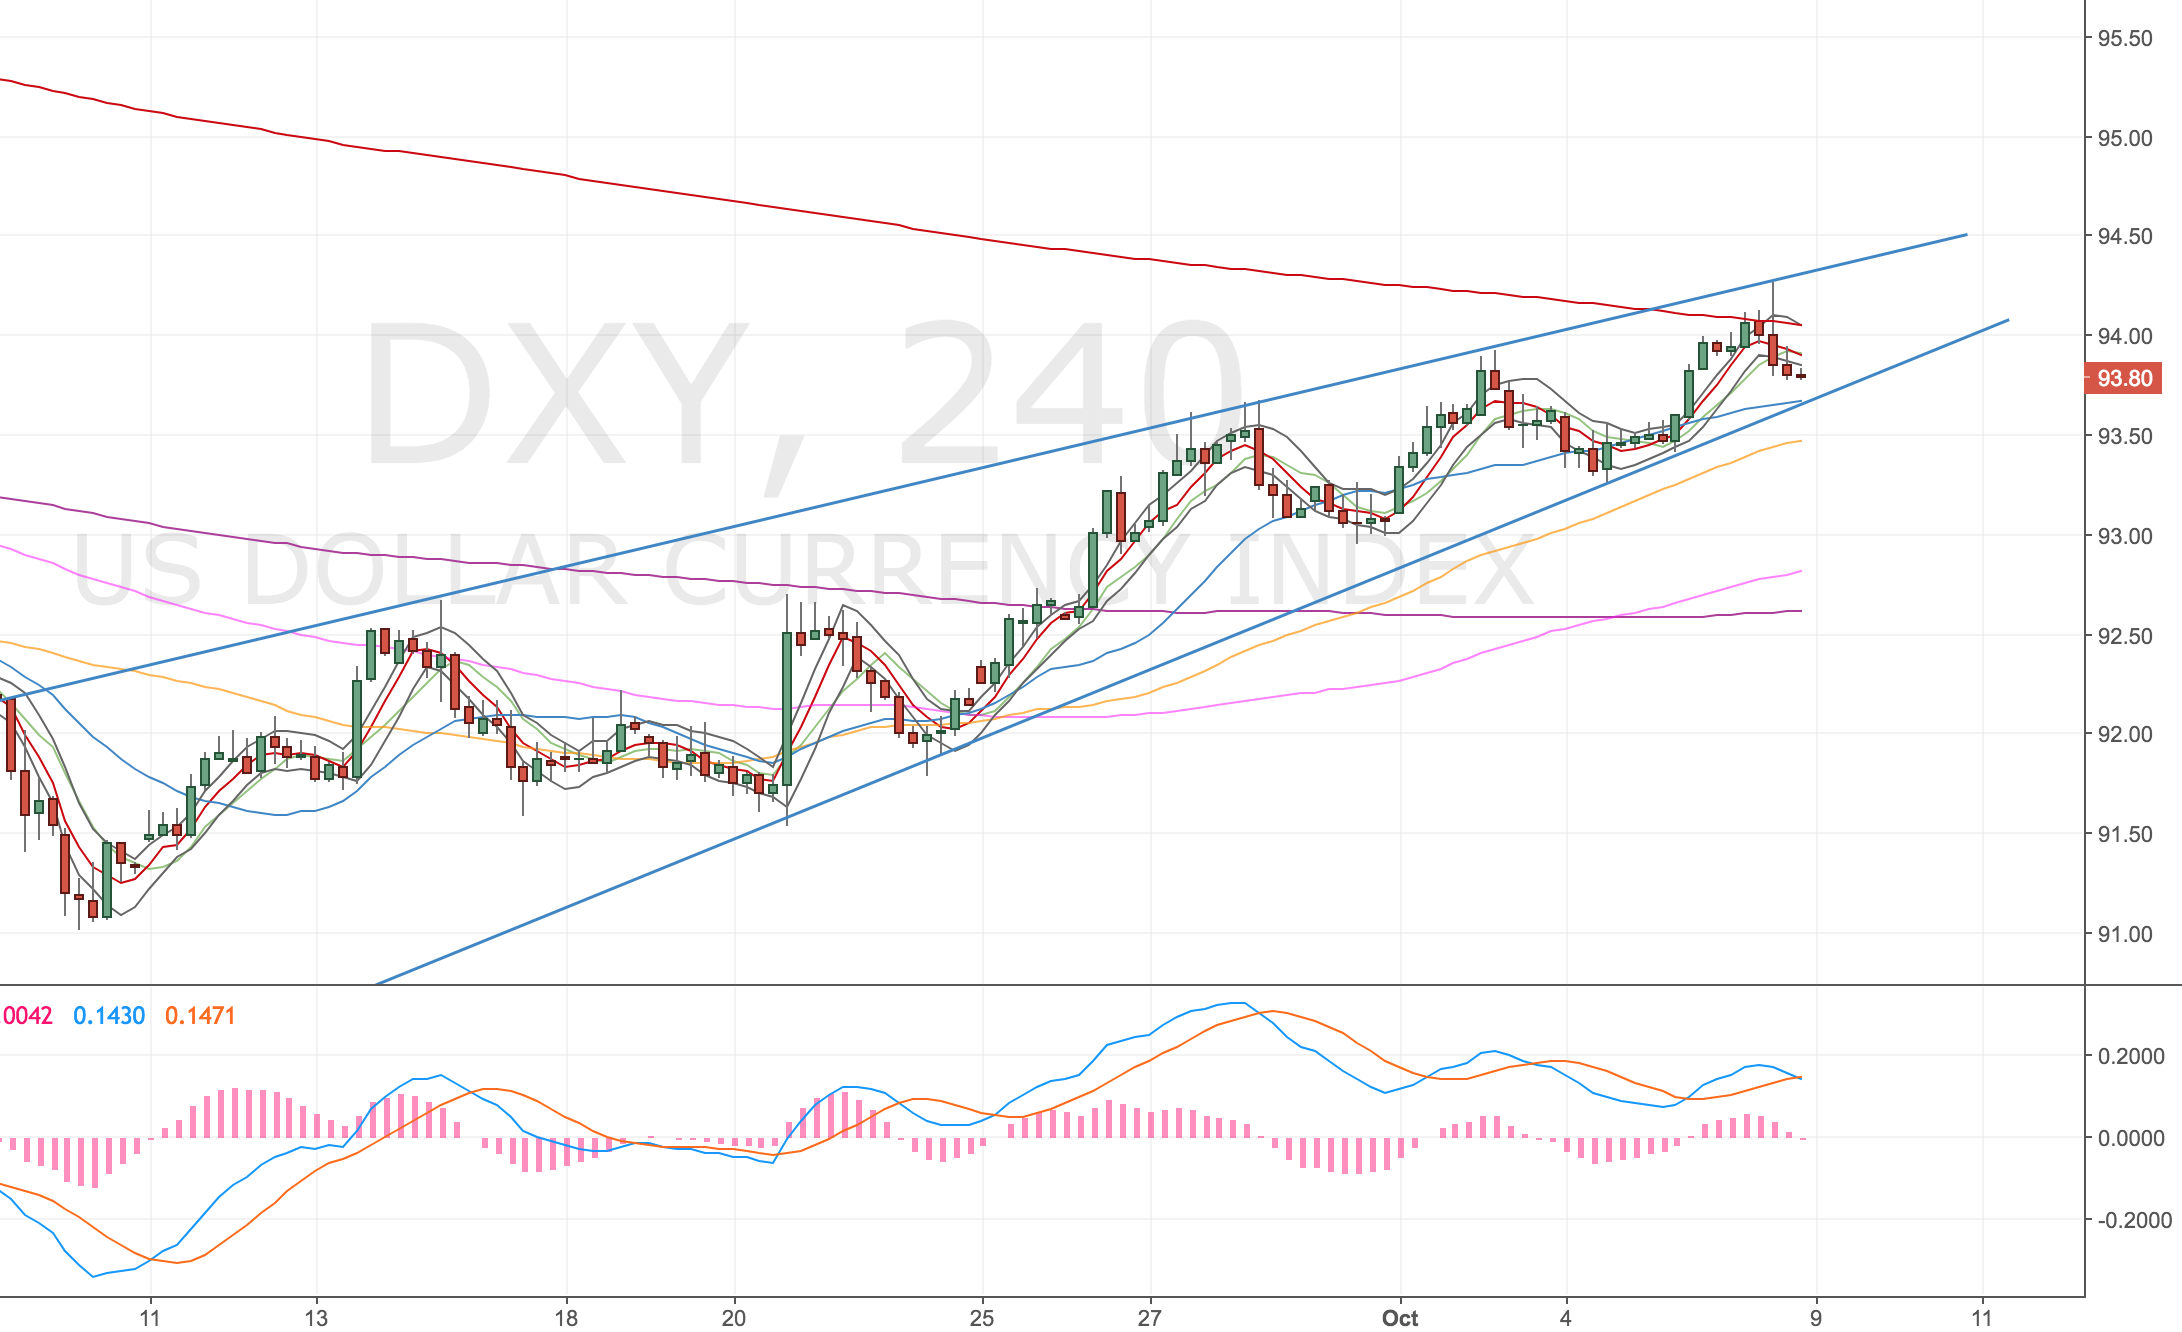
DXY

Short term sell. Looking at long set ups in the medium term. See the 100s trend-line coming into play as a target

Monthly – Looking for DXY to hit 100 – prior resistance and TL touch (could take months/years)
Weekly – Similar pattern – forming a head and shoulders at around 100
Daily – I can see a move higher to retest the highs before rolling over for a deeper pullback
4h – Looking for slightly more downside PA before we retest the highs. Ultimately I think the TL will break.
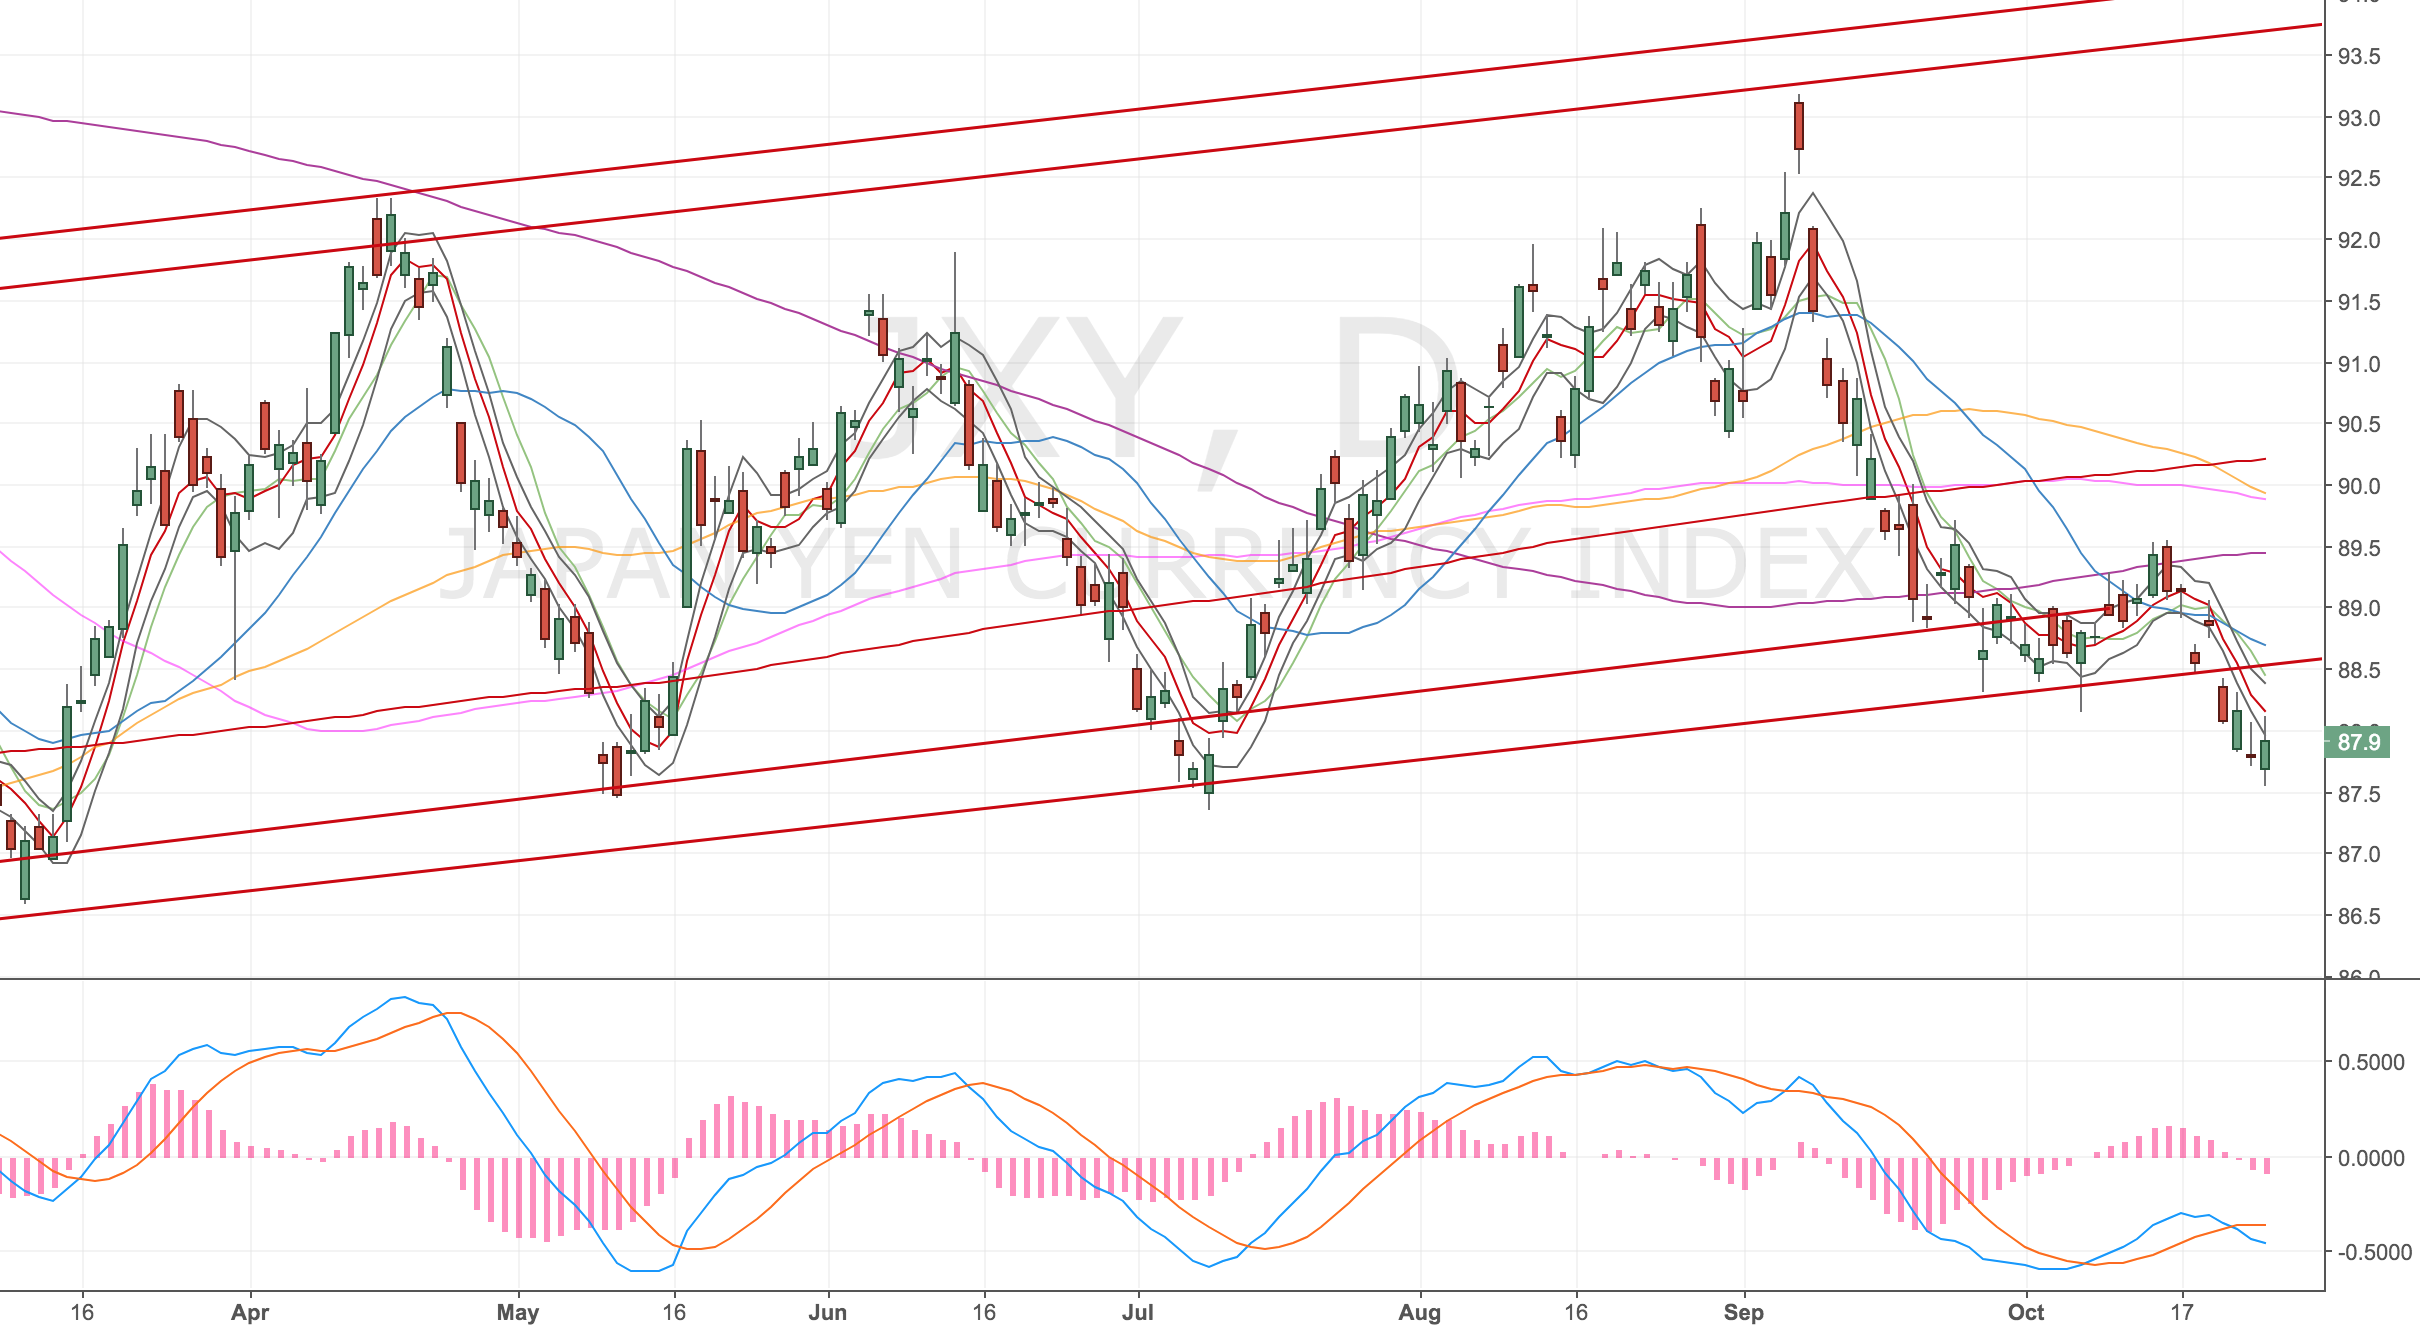
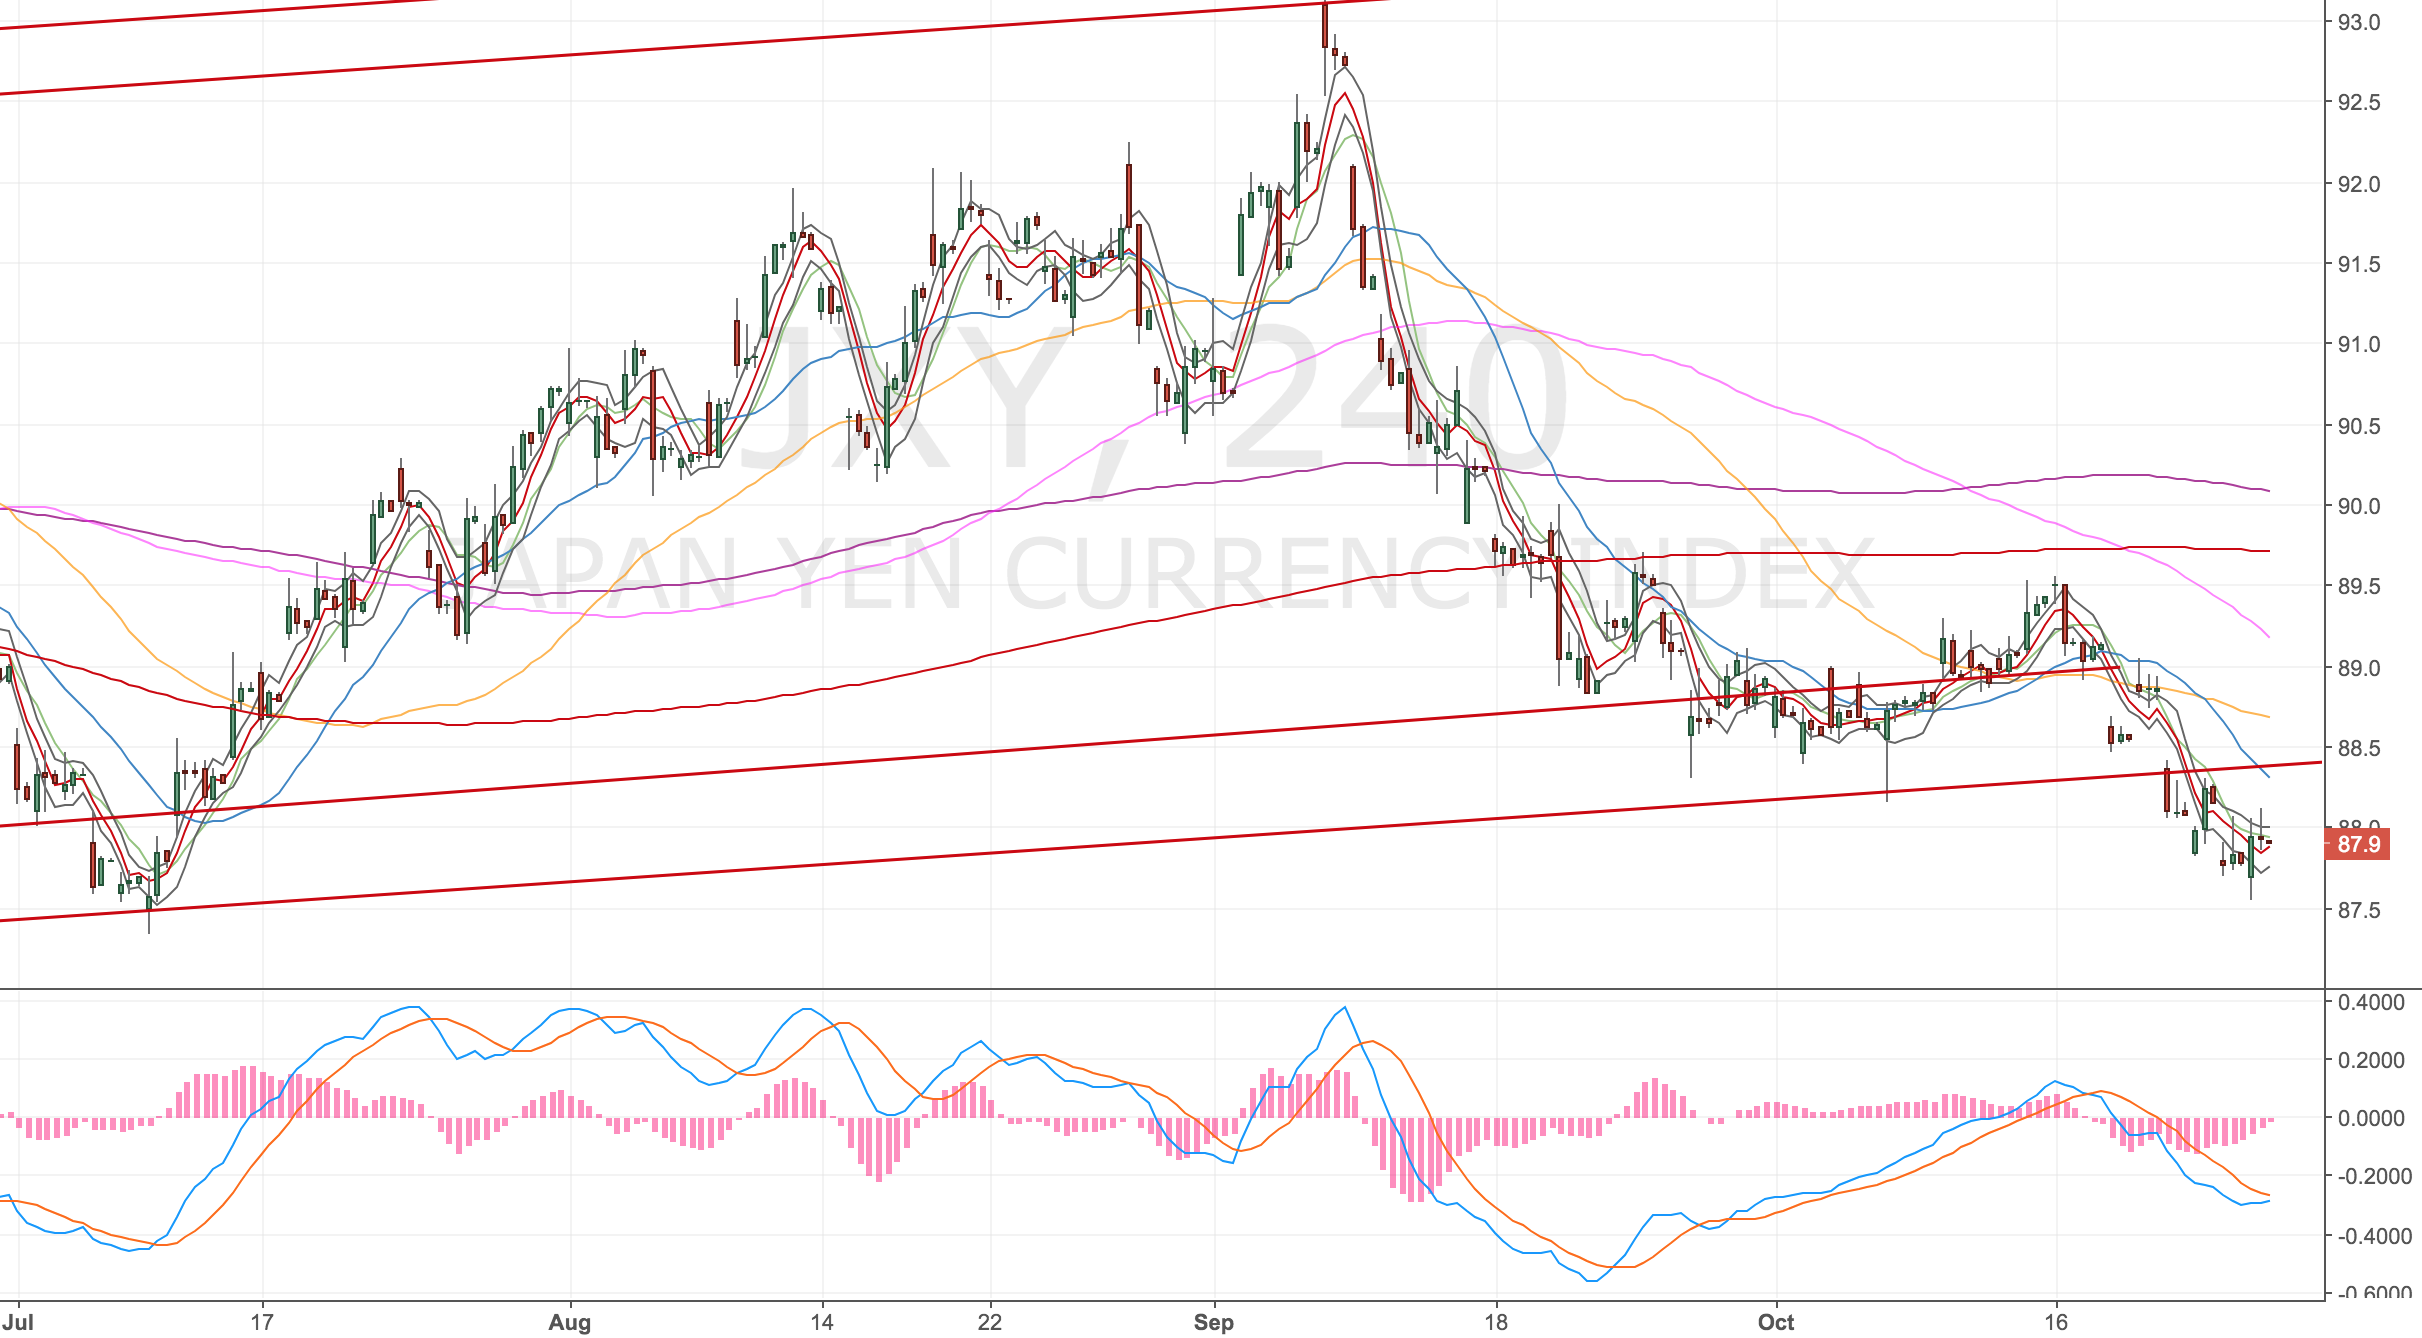
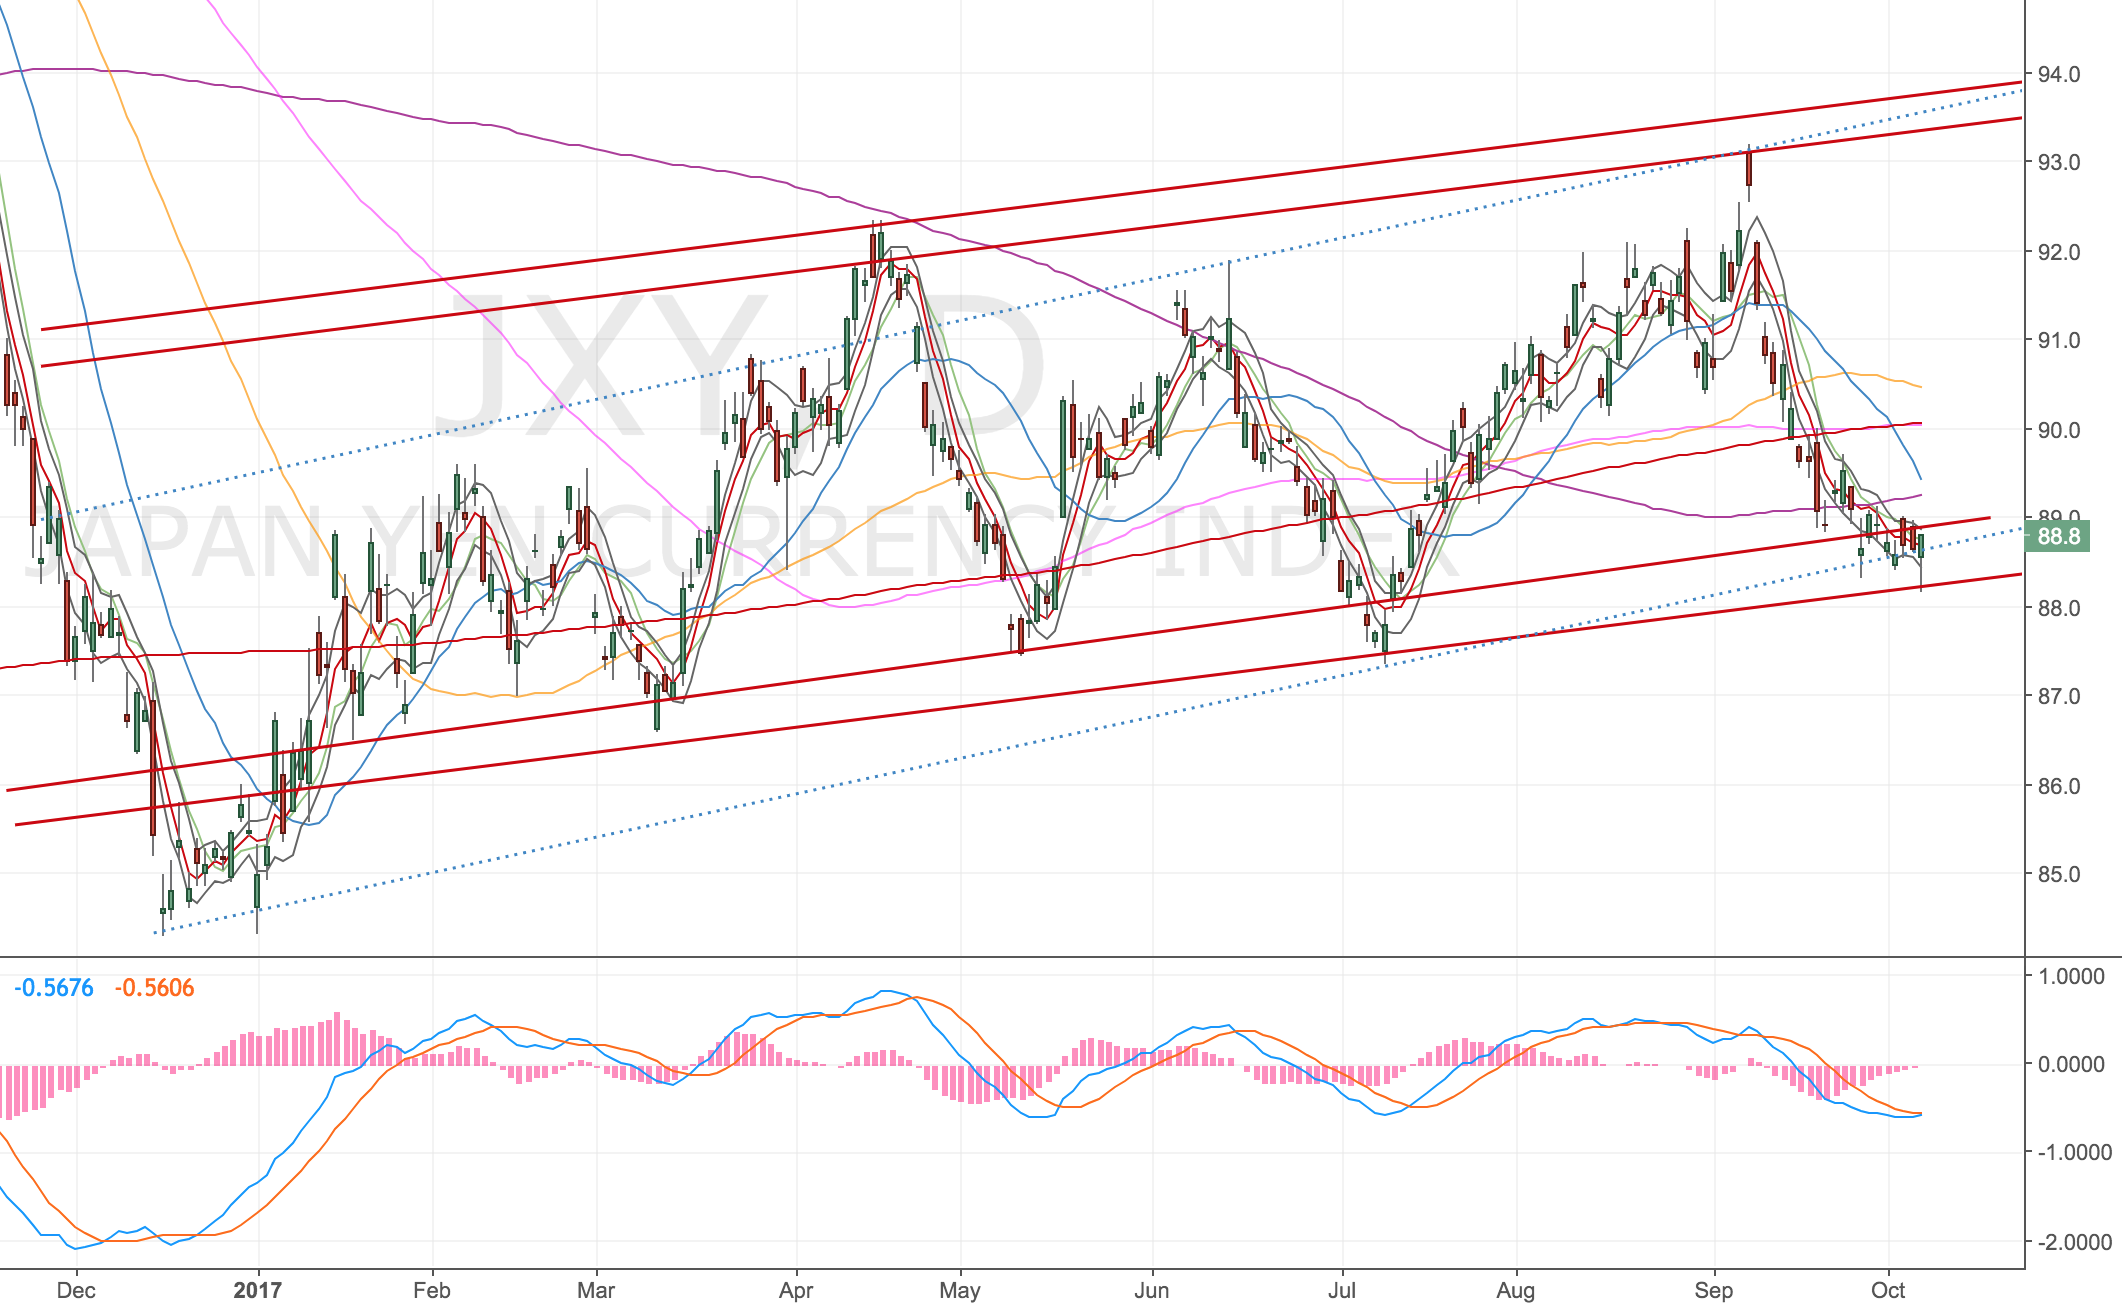
JXY

Right now expecting Yen to either diverge at the lows and move higher or continue down. This needs monitoring. Longer term lower (much lower – 84s), still look for shorts in to the 89s, longs into divergence @ 87s

Monthly – Looks bearish. Retesting the m50 but rallies have been limited and price is struggling to move higher
Weekly – Weekly looks bearish, more downside on the cards retested the TL goodbye
Daily – Might diverge at the 87s and then retest the highs at 89. Expect this to ultimately roll over. Will need to monitor this for signs which way it might go.

BXY

Looking for longs at 126s, ultimately I think it’ll head lower though.

Monthly – Prior TL that will probably get tested at some point in 2019-2020, for now continuation down, need to see if we close below 127s can see a retest of 121s (post Brexit vote lows). This would set up a monthly divergence long.
Weekly – Looking bearish, expect this to move lower. Any longs shouldn’t be too ambitious.
Daily – 126s for a long set up but ultimately lower, don’t get too ambitious with any longs from here.

CXY

Slightly more downside to the 74.7s to get long, I think this could rally nicely. Might still get my USDCAD short yet.

Monthly – Hand-railing the m50 would expect it to clear and head to 82 – 84s
Weekly – Two spinning tops on the TL, indicates heading higher
Daily – Maybe more downside from here to the 74.5 level, if so would be a confident buy, otherwise expect continuation

AXY

Still more upside for now, up to the d200?, to get short for the longer term

Monthly – Looks like it could set up a nice divergence long, volatility is low so would be a nervy long. Expect more downside to the 63s
Weekly – Bouncing a bit, any re-test of the TL would be a short and the prior resistance in the 73s
Daily – I like the long play up to the 74s for a short (maybe end of the week)

NZDUSD DST Long – 26 Oct 17


Acc Risk: 0.7%
Long: 0.6886
Stop: 0.6851 (35 pips)
Target: 0.7027 (4h50, 140 pips, 4x RR)

Updates

Stopped out – 26 Oct 17

Went long on the NZDUSD last night when I got back from painting at 1am! Had a nice 4H divergence and a double divergence on the 1H. I liked the setup although the daily was in freefall and the weekly had past the w100 and was falling too. The monthly however had support on the m200. So, a little uncomfortable, but took the plunge.

4H chart – set up

1H chart – confirmation

Daily chart

Weekly chart

Monthly chart

Stopped out – 26 Oct 17

Didn’t take long for me to get stopped out of this one. Although the divergence was a nice one, it didn’t work out. I reviewed the trade with Charlie and he gave me a few pointers to keep in mind.

  • The weekly low was close but not broken – he’d want to see that broken before getting long
  • The decline was very steep – would prefer price action to level out
  • The government has changed – the trend might be strongly to the downside for a while

USDJPY DST Short – 25 Oct 17


Acc Risk: 0.7%
Short: 113.85
Stop: 114.32 (47 pips)
Target: 113.00 (85 pips, 4h50, 1.8x RR)

Updates

Stopped out, regular price action! – 27 Oct 17

Spotted this 4H short that looked ok but I think I’m regretting now! The daily divergence is close but not quite there, we haven’t broken the daily highs yet, but we are very close. So I probably should’ve waited for that. Plus the weekly trendline going back to mid 2015 is very near. But the setup is a double divergence on the 4h.

Also, I’ve been monitoring the CCY indexes and the DXY looks to be diverging short and the JXY looks to be diverging to the long side.

DXY Daily Chart

DXY 4H Chart

Not quite diverging but close, clutching at straws?

JXY Daily Chart

JXY 4H Chart

4h chart – set up

1h chart – confirmation

Daily chart

Weekly chart

Monthly chart

Stopped out, regular price action! – 27 Oct 17

Feel kinda stupid about this, wasn’t a great trade, should’ve at least downsized given the circumstance. I will wait for the CPI news and a touch before getting in again.

USDJPY 4H Chart – 27 Oct 17

Gold DST Short – 02 Oct 17


Acc Risk: 0.75%
Long: 1274.3
Stop: 1270.3 (40 pips)
Target: 1305 (347 pips, 4h100, 8.67x RR)
Mindset: Nervous, low volatility, probably going to get stopped out.

Stopped out, ready to get back in – 02 Oct 17
Price action didn’t set up for me, missed the move – 12 Oct 17

Very nervous about this one, we’ve got a divergence (a nice one) but the volatility is very low and this is gold!

4H Chart – Set up

Price has touched the 4h500, but it hasn’t really crossed it yet. I can see this heading lower but the divergence looks good to me.

XAUUSD 4H Chart – 02 Oct 17

1H Chart – Confirmation

Got a nice double confirmation, so no excuse.

XAUUSD 1H Chart – 02 Oct 17

Daily Chart

Price has touched the d100.

XAUUSD Daily Chart – 02 Oct 17

Weekly Chart

Price has touched the w500.

XAUUSD Weekly Chart – 02 Oct 17

Monthly Chart

Touching the m5.

XAUUSD Monthly Chart – 02 Oct 17

Stopped out, ready to get back in – 02 Oct 17

Well this is frustrating, as I thought, I got stopped out. Had no real room for error with this trade. I’m primed to get back in though, the market is primed for another divergence now. So just need to be ready.

XAUUSD 4H Chart – 02 Oct 17

Price action didn’t set up for me, missed the move – 12 Oct 17

XAUUSD 4H Chart – 12 Oct 17

NFP results crossed the bands and didn’t retrace back inside so I wouldn’t have been able to get an entry on this. However I was focussing on the USDJPY as that had stopped me out too. It’s annoying as price as gone to my original target with a better RR, will need to take a look at these two examples again, and see if I can learn anything from them.

Stop out examples shorting the USD

Both markets would’ve resulted in a stop out. Given the strong move back, was there a way to get back into these markets?

XAUUSD 4H Chart – 12 Oct 17

USDJPY 4H Chart – 12 Oct 17

Oil DST Short – 21 & 26 Sep 18


Acc Risk: 0.6%
Short: 50.57
Stop: 51.15 (58 pips)
Target: 48.26 (d50, 231 pips, 4x RR)
Mindset: A little nervous again, low volatility in a traditionally spikey market.

Update

Chose the wrong instrument to trade! Trade closed scratch – 21 Sep
Found another entry – 26 Sep
Stopped out – 28 Sep
Some time later – 06 Oct

There’s an interesting pattern in Oil that I quite like a divergence forming on a couple of timeframes. So taken a small short. Here’s the low down.

Weekly Chart

Crossed the w50 and previously air-kissed the w100. Can see a pullback to retest my green trendline.

Oil Weekly Chart – 21 Sep 17

Daily Chart

Divergence off the Aug high.

Oil Daily Chart – 21 Sep 17

4H Chart – set up

Double divergence.

Oil 4H Chart – 21 Sep 17

1H Chart – confirmation

Hourly divergence confirming the trade.

Oil Hourly Chart – 21 Sep 17

Chose the wrong instrument to trade! Trade closed scratch – 21 Sep

I chose the Nymex Daily Futures which settles each day at 7.30pm! Doh, meant to trade the Nov 17 futures market. I’ve done this before – I blame the new ETX UI, confusing as hell. Rather the re-enter I’m going to wait for a new divergence to form. The price action seems range-bound and holding so I think we’ll get another divergence.

I should probably get back in as the analysis is the same.

Found another entry – 26 Sep

Looks like I’ve been lucky enough to get another entry on this. Price did hold up as I thought and we’ve moved another leg higher. We know have a marginal daily divergence and a double 4h divergence. We don’t have the 1h confirming but I’m taking the daily and 4H this time. A break of the rules so probably a mistake!


Acc risk: 0.6%
Short: 52.10 (via an order)
Stop: 52.51 (41 pips)
Target: 49.50 (4h200, 310 pips, 7.5x RR)
Mindset: Uneasy about the rule break but think the trade will be worthwhile.

4H Chart

4H Oil Chart – 26 Sep 17

Daily Chart

Daily Oil Chart – 26 Sep 17

Stopped out – 28 Sep

Just got stopped out on this trade, looks like I shouldn’t have broken my rules after all. The important thing now is to monitor the set up and see if we get another divergence to trade short. Looking back at my set up charts the daily divergence didn’t materialise so there was no confirmation of the 4H chart.

I should’ve waited for the hourly. There’s also not so much going on, on other timeframes, so in retrospect I should’ve waited for more reasons to get involved.

USOIL 4H Chart – 28 Sep 17

Some time later – 06 Oct

This is annoying, price reversed quickly and just ran off. I put an alert in for any retrace, but it didn’t happen. 🙁

Oil 4H Chart – 06 Oct 17

USDJPY DST Short – 27 Sep 17


Acc Risk: 0.7%
Short: 112.85
Stop: 113.33 (48 pips)
Target: 111.00 (185 pips, 4h500, 3.85x RR)
Mindset: Optimistic

Updates

Stopped out on NFP results

I’ve triangulated this trade in with the CADJPY and USDCAD. CADJPY I’m already short, USDCAD is into a reversal zone so therefore I should be short this divergence on the USDJPY. Let’s see how it plays out.

4H Chart

USDJPY 4H Chart – 27 Sep 17

Daily Chart

USDJPY Daily Chart – 27 Sep 17

Weekly Chart

USDJPY Weekly Chart – 27 Sep 17

Monthly Chart

USDJPY Monthly Chart – 27 Sep 17

Stopped out on NFP results

I’m fine about being stopped out – I knew it was coming – I should probably get smarter about my stops. The reversal, if it sticks, seems quite predictable. Dollar index is diverging as it ran into the 4h500 and the Yen index is bouncing off a lower daily trendline. I’ve set a couple of alerts looking for a re-entry inside the bands.

USDJPY 4H Chart

USDJPY 4H Chart – 06 Oct 17

DXY 4H Chart

DXY 4H Chart – 6 Oct 17

JXY Daily Chart

JXY Daily Chart – 6 Oct 17

Annoyingly this divergence has crossed the bands and doesn’t look like it’s going to retrace. 😐

GBPJPY DST Short – 22 Sep 17


Acc risk: 0.65%
Short: 152.15
Stop: 152.99 (84 pips)
Target: 149.48 (4h50, 267 pips, 3.1x RR)
Mindset: A little uncomfortable as this is my second JPY trade and there’s a Brexit speech due today

Updates

Reached target nice and quickly – 25 Sep

I’m also in a CADJPY trade and whilst I like this set up too, I’m a little nervous about my exposure given what’s going on with North Korea. If a war becomes real, I can’t imagine the Yen will still be the safe haven people treat it as. However, I trade what I see and try my best to control the risk.

Here’s the set up …

Weekly Chart

We’ve run into the w500 but can still see this going further. We’ve only just touched it.

GBPJPY Weekly Chart – 22 Sep 17

Daily Chart

Wasn’t sure if this was a divergence from Nov/Dec 2016, but decided not given the distance between the price moves. We’ve crossed the d500 which could make a good target for a bounce?

GBPJPY Daily Chart – 22 Sep 17

4H Chart – set up

Not a perfect divergence, the gap is quite big, and the MACD cross slight, but given that:

  1. The higher timeframes have run into MAs
  2. All other Yen pairs I follow are diverging
  3. There’s hourly divergence confirming the set up

I’m still interested.

GBPJPY 4H Chart – 22 Sep 17

1H Chart – confirmation

Not a perfect divergence confirmation, but it’s valid.

GBPJPY H Chart – 22 Sep 17

Reached target nice and quickly thanks to North Korea – 25 Sep

North Korea propaganda poster. It reads: “Our answer!” KCNA

It’s always handy to have a trade end quickly, especially when the moving average you’re aiming for is 200 pips away! GBPJPY hit my target at the end of the day following a unofficial war declaration by the US against North Korea. For some reason despite the Japanese siding with the US and being next door to North Korea, any mention of war seems positive for the Yen!?!

Here’s the closing chart.

GBPJPY 4H Chart – 25 Sep 17

CADJPY DST Short – 21 Sep 17


Acc Risk: 0.6%
Short: 91.20
Stop: 91.75 (55 pips)
Target: TBC – depends if the weekly divergence forms but at least 89.80
Mindset: Mixed

Updates

Wedge forming on the hourly with divergence – 22 Sep
Closing part of the trade – 13 Oct
Taking my first hedge – 15 Oct
Ops – 15 Oct
Hedging again – 17 Oct

Seeing a lot of divergence on the JPY pairs, some stronger than others I really like this one because the daily and weekly charts are diverging. So I can see a big target here, especially as the last weekly divergence didn’t make the w50. Coming into CPI figures I’m hopeful that we’ll get some movement in my direction but can easily see this stopping me out for a 2nd attempt.

Monthly Chart

Testing the m50.

CADJPY Monthly Chart – 21 Sep 17

Weekly Chart

Weekly divergence has formed but not yet played out.

CADJPY Weekly Chart – 21 Sep 17

Daily Chart

Daily double divergence in play

CADJPY Daily Chart – 21 Sep 17

4H Chart – set up

Single divergence – possible double may form.

CADJPY 4H Chart – 21 Sep 17

Hourly Chart

Double divergence confirmation.

CADJPY H Chart – 21 Sep 17

Wedge forming on the hourly with divergence – 22 Sep

Noticed there’s a wedge forming on the hourly chart – which has some short divergence. We’re heading into CAD CPI news, so I’m expecting an answer on this trade sooner or later.

CADJPY Hourly Chart – 22 Sep 17

I’m a little nervous about holding this position over the weekend, with N Korea firing missiles over Japan it’s pretty likely we can see gaps over the weekend against me.

Closing part of the trade – 13 Oct

It’s been a while since I updated this post, the trade has been meandering down to my target, but it’s taking ages. My charges are creeping up all the time, now about 10% of the total profit is on charges alone! I might try trading a currency futures market instead of the rolling daily charts.

CADJPY 4h chart – 13 Oct 17

Price has come down to the 4h200 which also corresponded with a trenline, I had an oppotunity to close here earlier in the week but I didn’t choosing to hold for the d50. However I can see divergence creeping into the chart and we’ve not had a test of the upper wedge for a long time. So I’ve decided to protect my position.

I wanted to close half of my position here but minimum position sizes mean I have to close 2/3rds. So I’m banking 153 pips now. Will hold the remainder and watch price action. Still undecided about whether to target the d50 or w50/w500.

just an observation here, my indecision about my target probably means I’m going to pick the nearer one

Taking my first hedge – 15 Oct

We’ve got a long divergence confirmed, we’re near the d50 but far enough away for me to take a chance. It’s pretty marginal but I find in patterns like this the divergences often get skewed. I also see this when price almost stretches down to touch an MA, the divergence doesn’t technically form but a divergence still happens.

CADJPY 4H Chart – 15 Oct 17

Here’s the divergence, I’m looking to hedge my position now, taking a smaller 0.6% position size long, looking for a break of the 4h100 (as it’s been recently tested – air kiss?) and a move up to the upper trendline. I’ll keep my tiny 0.2% remaining position open.

Ops – 15 Oct

ETX didn’t let me hold two positions. It closed my short and netted out my long. Not what I wanted. I thought this might happen so I adjusted the position size slightly to compensate, but now I’m only long!


Acc risk: 0.5%
Long: 89.73
Stop: 89.25 (48 pips)
Target: TBC – 4h100/PH as a minimum (60 pips)
Mindset: Excited to be taking my first hedge!

Hedging again – 17 Oct

CADJPY 4h Chart – 17 Oct 17

Well got stopped out of the CADJPY long, price has now air-kissed the d50 and come back inside the wedge. The set up is still there so I think we’re good for another go at this.

Long again at 89.45 stop below the low plus the spread at 88.88. Target is for a break of the 4h100v to the prior high (PH) and a test of the upper trendline around 91.


Acc risk: 0.6%
Long: 89.45
Stop: 88.88 (57 pips)
Target: TBC – PH as a minimum (87 pips)
Mindset: Still like the set up, feel more positive about this one.

From here I’ll look to get short again, daily might well set up for another divergence short. Weekly chart might not though!

S&P DST Short – 18 Sep 17


Acc Risk: 0.6%
Short: 2501.5
Stop: 2506.5 (50 pips)
Target: 2348 (w50, 1535 pips!, 30x RR)
Mindset: The low volatility concerns me. I can’t ignore the many divergences I see across different timeframes

Updates

Stopped out on low volatility – 19 Sep

Haven’t traded this market before, and I know it’s an expensive market to trade, a 1 point move is a 10 pips move, so what looks like small price changes can impact me a lot. Regardless, I can’t ignore the number of divergences I see across the different timeframes. Whilst I can see this heading higher, especially with such low volatility, the market looks ripe for shorting.

Monthly Chart

Divergence forming on the monthly chart?

S&P Monthly Chart – 18 Sep 17

Weekly Chart

Weekly divergences in play – another one forming this week?

S&P Weekly Chart – 18 Sep 17

Daily Chart

Double/triple divergence in play on the daily chart.

S&P Daily Chart – 18 Sep 17

4H Chart – Set up

Double divergence on the 4H Chart. However very low volatility makes me nervous, great to have a tight stop but on low volatility it seems pretty stupid.

S&P 4H Chart – 18 Sep 17

1H Chart – Confirmation

Divergence confirming the trade.

S&P 1H Chart – 18 Sep 17

Stopped out on low volatility – 19 Sep

Well I’m not surprised that (a) a double divergence has played out on the 4H chart and (b) I got stopped out on a tight stop. Will need to speak to Charlie about this price action. Seems kind of dumb to set such a tight stop and then get stopped out on expected/minimal price action.

I’ve set an alert for price to form another high @ 2508 – I think it might – seasonally we might get lower prices before the traditional Christmas rally.

Gold DST Short – 6 Sep 17


Acc Risk: 0.5%
Short: 1340.0
Stop: 1344.7 (47 pips)
Target: 1319.0 (210 pips, 4h50, 4.46x RR)

Updates

Stopped out – 7 Sep 17

A slightly smaller position size, wanted to keep my positions to £40 or under, had previously been £30. (I’m thinking I should probably increase this to £50 otherwise I’ll never progress much further.) I quite like this divergence on the 4h chart, but we’re near a trendline I had previously drawn on the daily chart.

Try not to put too much emphasis on trendlines though!

4H Chart – set up

A relatively late stage divergence which looks promising.

Gold 4H Chart – 6 Sep 17

1H Chart – confirmation

A double divergence? Would need to see further back to confirm … one sec … yep it’s a double!

Gold 1H Chart – 6 Sep 17

Daily Chart

Close to my trendline but not putting too much emphasis on it. The gap has already been filled.

Gold Daily Chart – 6 Sep 17

Weekly Chart

Nothing of note really.

Gold Weekly Chart – 6 Sep 17

Monthly Chart

Into the m100. Might get a bit of ping pong between it and the m50?

Gold Monthly Chart – 6 Sep 17

Stopped out – 7 Sep 17

Not surprised to get stopped out, but I was surprised to get slipped on this trade. I don’t think I should’ve been, reviewed the price action on MT4 and the slippage didn’t look justified. I checked with Charlie and on his chart the slippage was there, so I’ve left it, but I got slipped 20 pips and took an additional loss of £10.

Not much money, but it’s still a 20% addition to the original amount risked.

XAUUSD 4h Chart – 7 Sep 17

Here’s the video replay of that slippage – original stop was 1344.7 actual stop was 1346.6.

What’s worse is the next divergence that came in I missed the set up – on holiday – so I didn’t get to trade it and run it down to the 4h100. I did set an order hoping to get triggered end of the day but cancelled it over the weekend (worried about gaps – probably shouldn’t have). Either way, the move went without me.