Starting balance: £7,083.36
Target return: £247.91 (3.5%)
Actual return: £120.93 (1.7%)
Win rate: 50%
Closing balance: £7,204.29
Still not been a great month. Holiday and renovations got in the way of things this time! I’ve really only been trading the odd day and this last week, so I’ve been lucky to make any money really. Very sporadic and you’ve got to take all of the set ups to really maximise the strategy performance.
I have started to log my missed trades this last week more diligently so that I can see whether I am dodging the right trades and of the ones I miss, why I am missing them. Hopefully the October review will have some findings I can implement.
September’s Goals
Here are the goals I set myself at the start of the month.
- Maintain a 40% win rate – Success
- Do at least one scan every trading day – Miss
- Log all my missed trades with reasons why I didn’t take them – Miss
Daily performance
| All Signals | Win Loss % | Signals Taken | Win Loss % | |
|---|---|---|---|---|
| Winners | 3 | 37.5% | 0 | 0% |
| Losers | 2 | 25% | 0 | 0% |
| Still live | 2 | 25% | 0 | 0% |
| Missed | 1 | 12.5% | 0 | 0% |
| Total Pips | 162 | - | 0 | - |
4H performance
| All signals | Win Loss % | Conf. signals | Win Loss % | Signals Taken | Win Loss % | |
|---|---|---|---|---|---|---|
| Winners | 14 | 53.8% | 10 | 55.6% | 3 | 50% |
| Losers | 11 | 42.3% | 8 | 44.4% | 3 | 50% |
| Still live | 1 | 3.8% | 0 | 0% | 0 | 0% |
| Missed | 0 | 0% | 0 | 0% | 0 | 0% |
| Total Pips | 1,150 | - | 954 | - | 176 | - |
September trade log
A mixed bunch. I shouldn’t have taken the S&P500 short, not on my plan to trade that market. The gold trade should’ve been followed by a 200 pip winner but I didn’t check each morning. The Oil trade would’ve been a loser had I not traded the wrong market.
| # | Date | Stgy | Mkt | Pos | Acc Rsk | Open | Stop | Stp Pips | Tgt | Tgt Pips | R:R | Close | Fnl Pips | Fnl R:R | Days | P&L (£) |
|---|---|---|---|---|---|---|---|---|---|---|---|---|---|---|---|---|
| 1 | 01 Sep 17 | DST | NZDUSD | Long | 0.75% | 0.7162 | 0.7125 | 37 | 0.7261 | 99 | 2.67 | 0.7240 | 78 | 2.1 | 6 | 85.53 |
| 2 | 04 Sep 17 | DST | AUDCAD | Long | 0.6% | 0.9865 | 0.9846 | 19 | 0.9919 | 54 | 2.84 | 0.9909 | 44 | 2.32 | 2 | 66.83 |
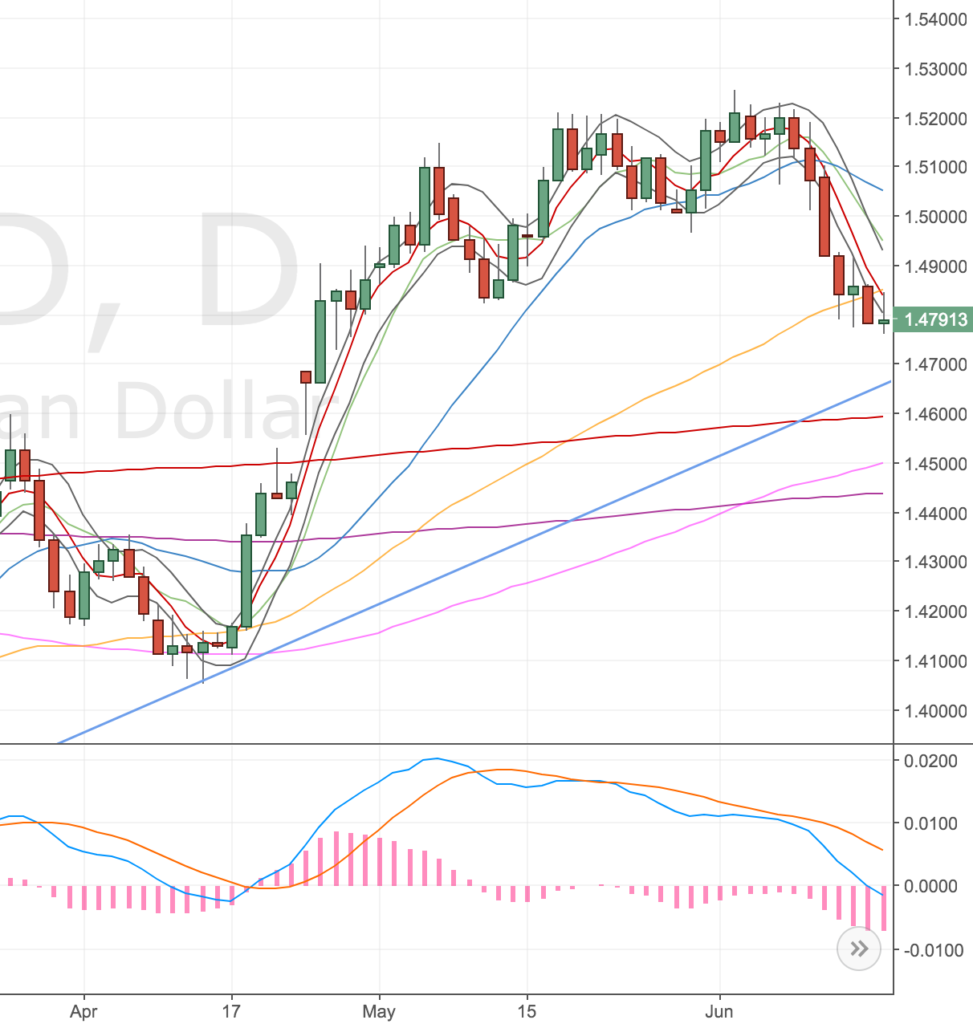
| 3 | 06 Sep 17 | DST | EURGBP | Long | 0.75% | 0.9150 | 0.9127 | 23 | 0.9214 | 64 | 2.78 | 0.9127 | -23 | -1 | 1 | -41.30 |
| 4 | 06 Sep 17 | DST | Gold | Short | 0.5% | 1340 | 1344.7 | 47 | 1319 | 210 | 4.46 | 1346.6 | -66 | -1.4 | 2 | -53.44 |
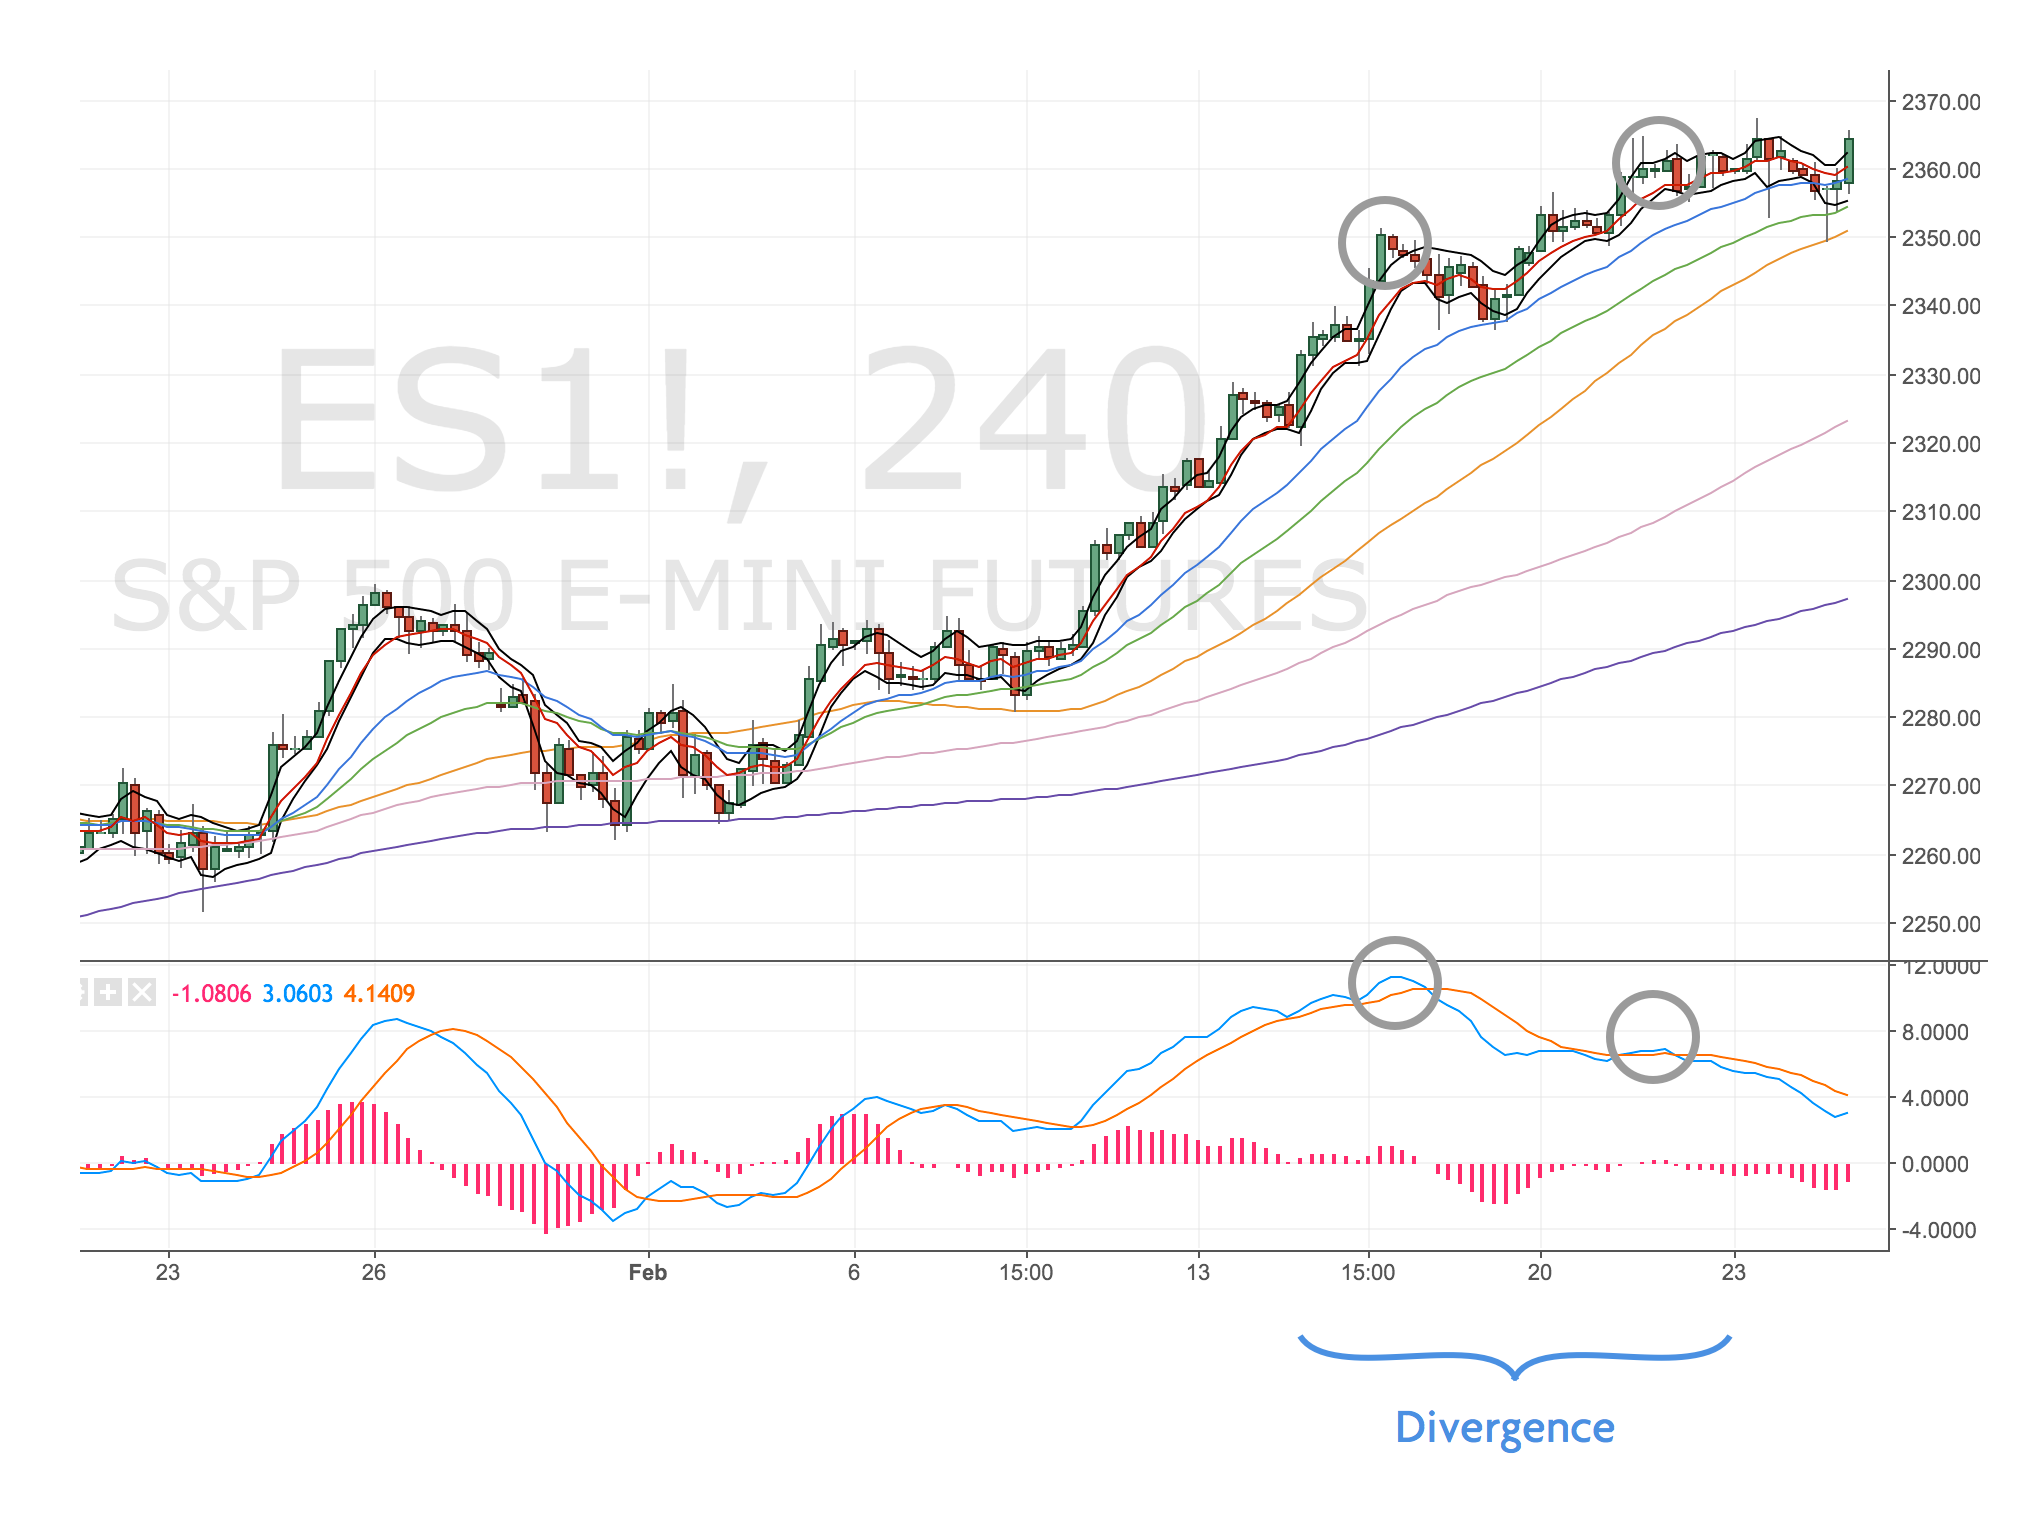
| 5 | 18 Sep 17 | DST | SPX | Short | 0.6% | 2501.2 | 2506.5 | 50 | 2348 | 1535 | 30 | 2506.5 | -50 | -1 | 2 | -40.00 |
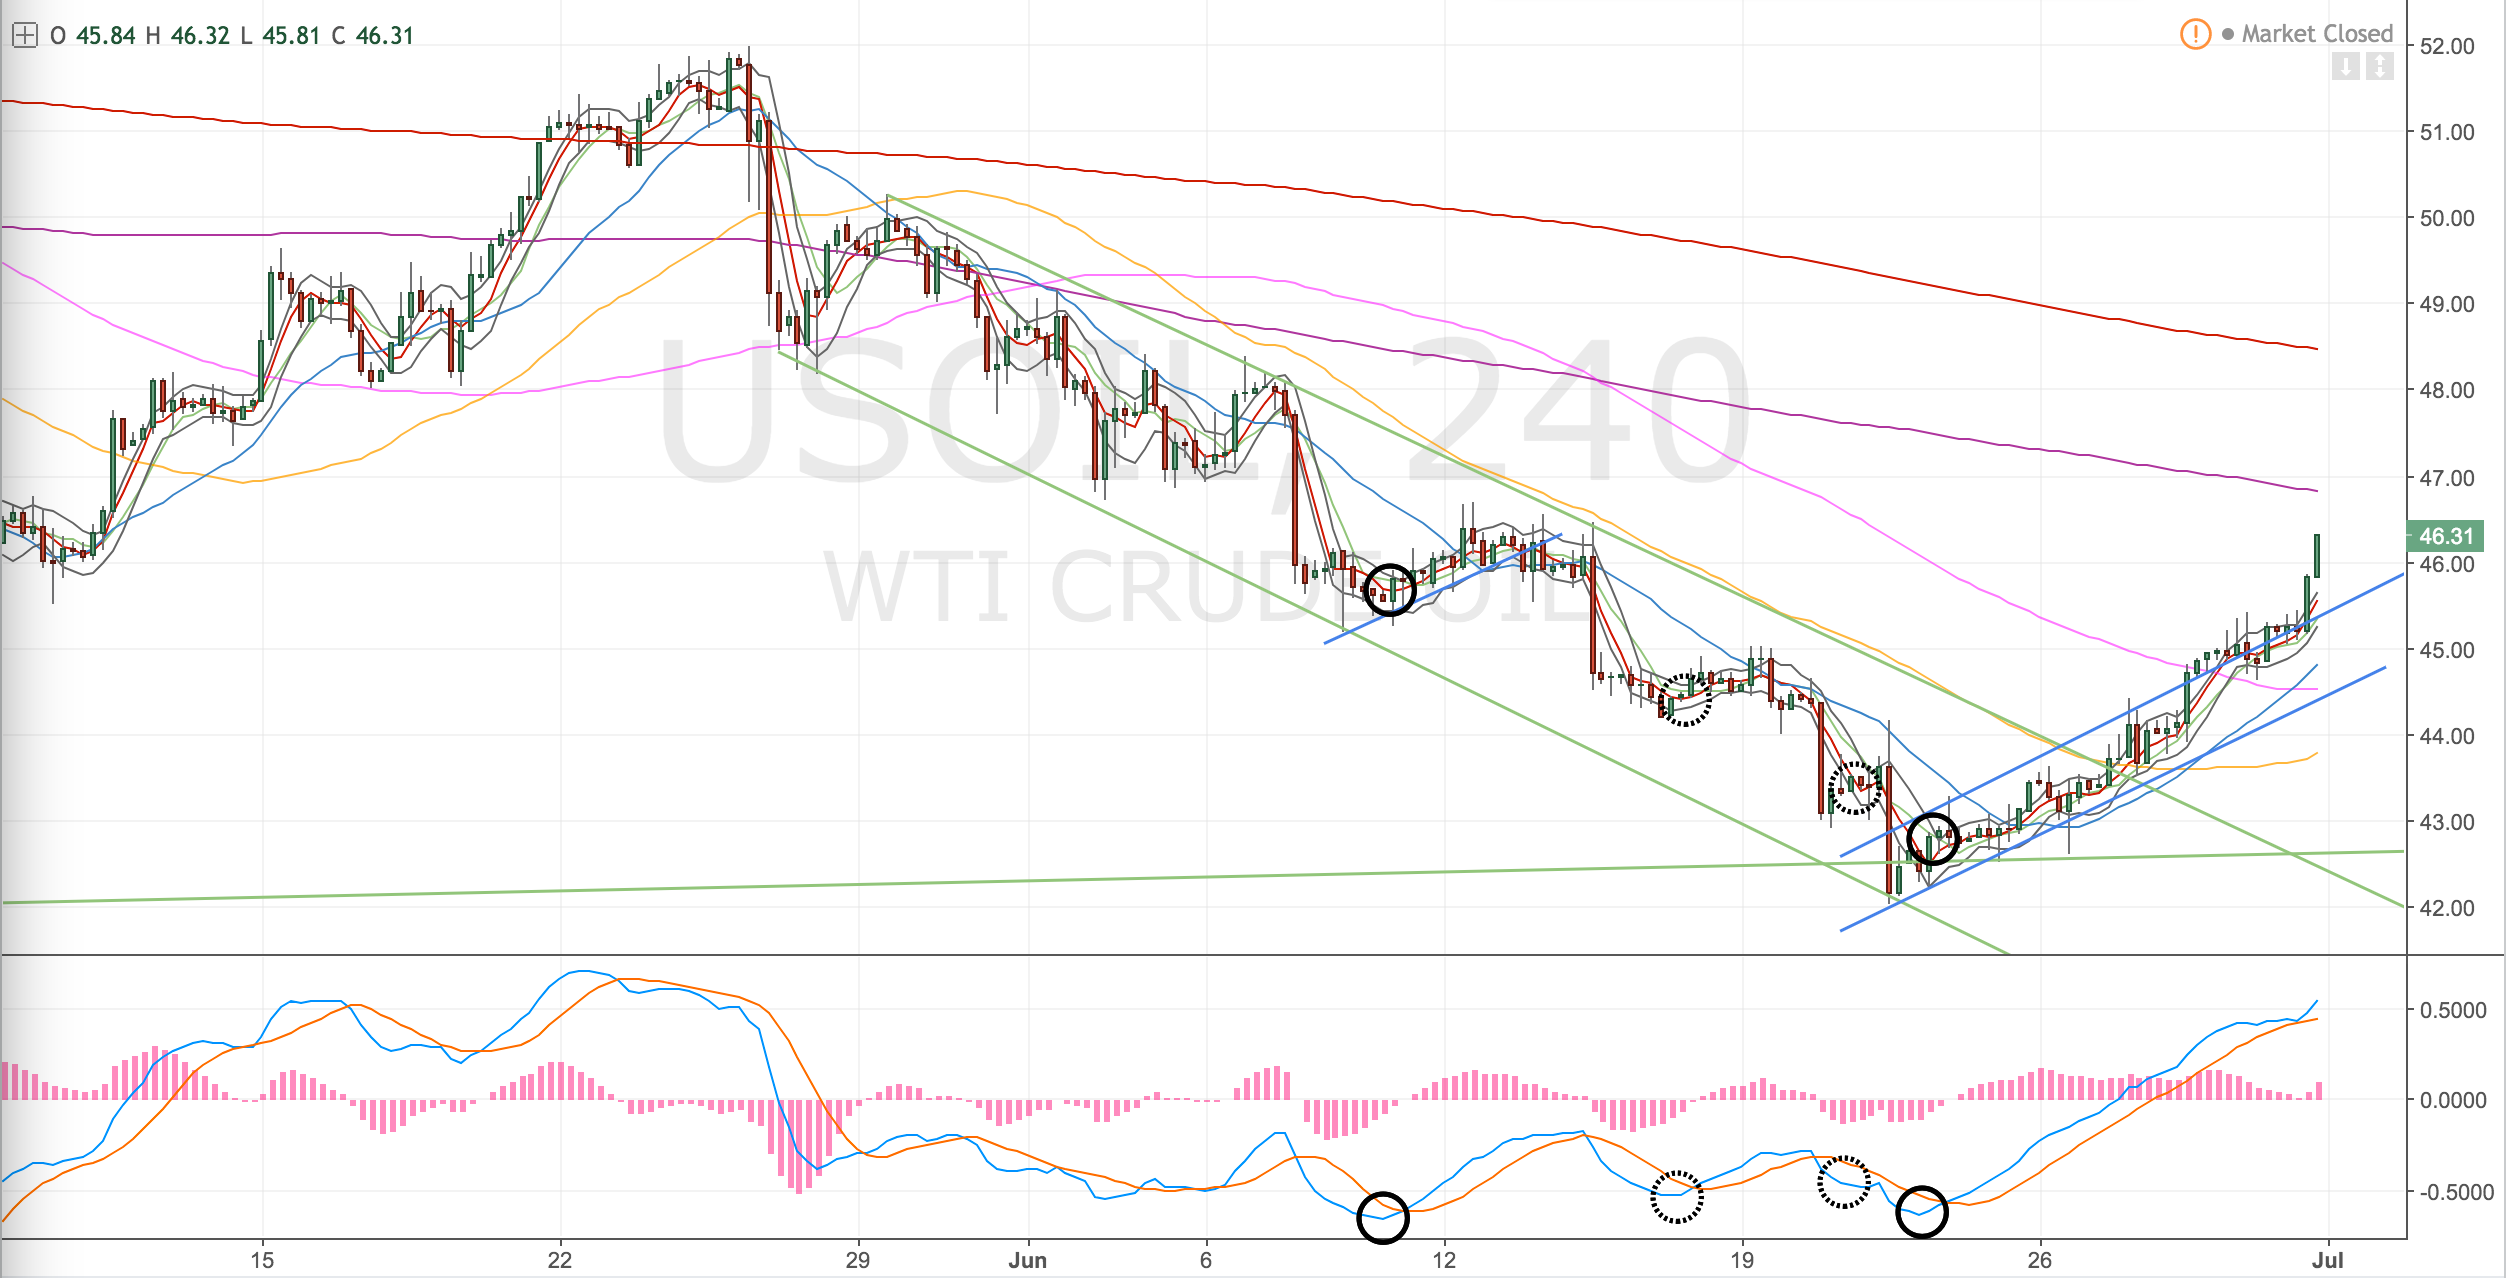
| 6 | 21 Sep 17 | DST | Oil | Short | 0.6% | 50.57 | 51.15 | 58 | 48.26 | 231 | 4 | 50.57 | -4 | 0 | 1 | -1.80 |
| 7 | 21 Sep 17 | DST | CADJPY | Short | 0.6% | 91.20 | 91.75 | 55 | - | - | - | - | - | - | - | - |
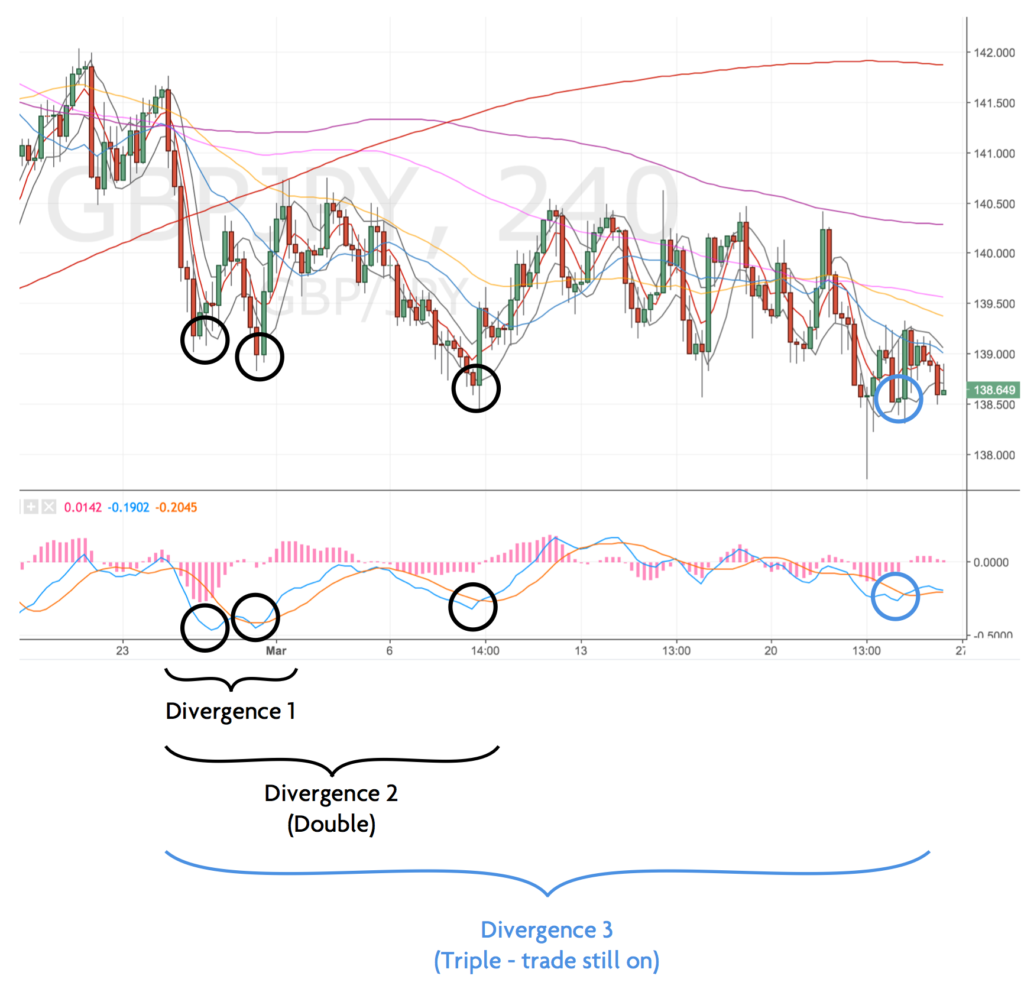
| 8 | 22 Sep 17 | DST | GBPJPY | Short | 0.65% | 152.15 | 152.99 | 84 | 149.48 | 267 | 3.1 | 150.18 | 197 | 2.34 | 4 | 107.73 |
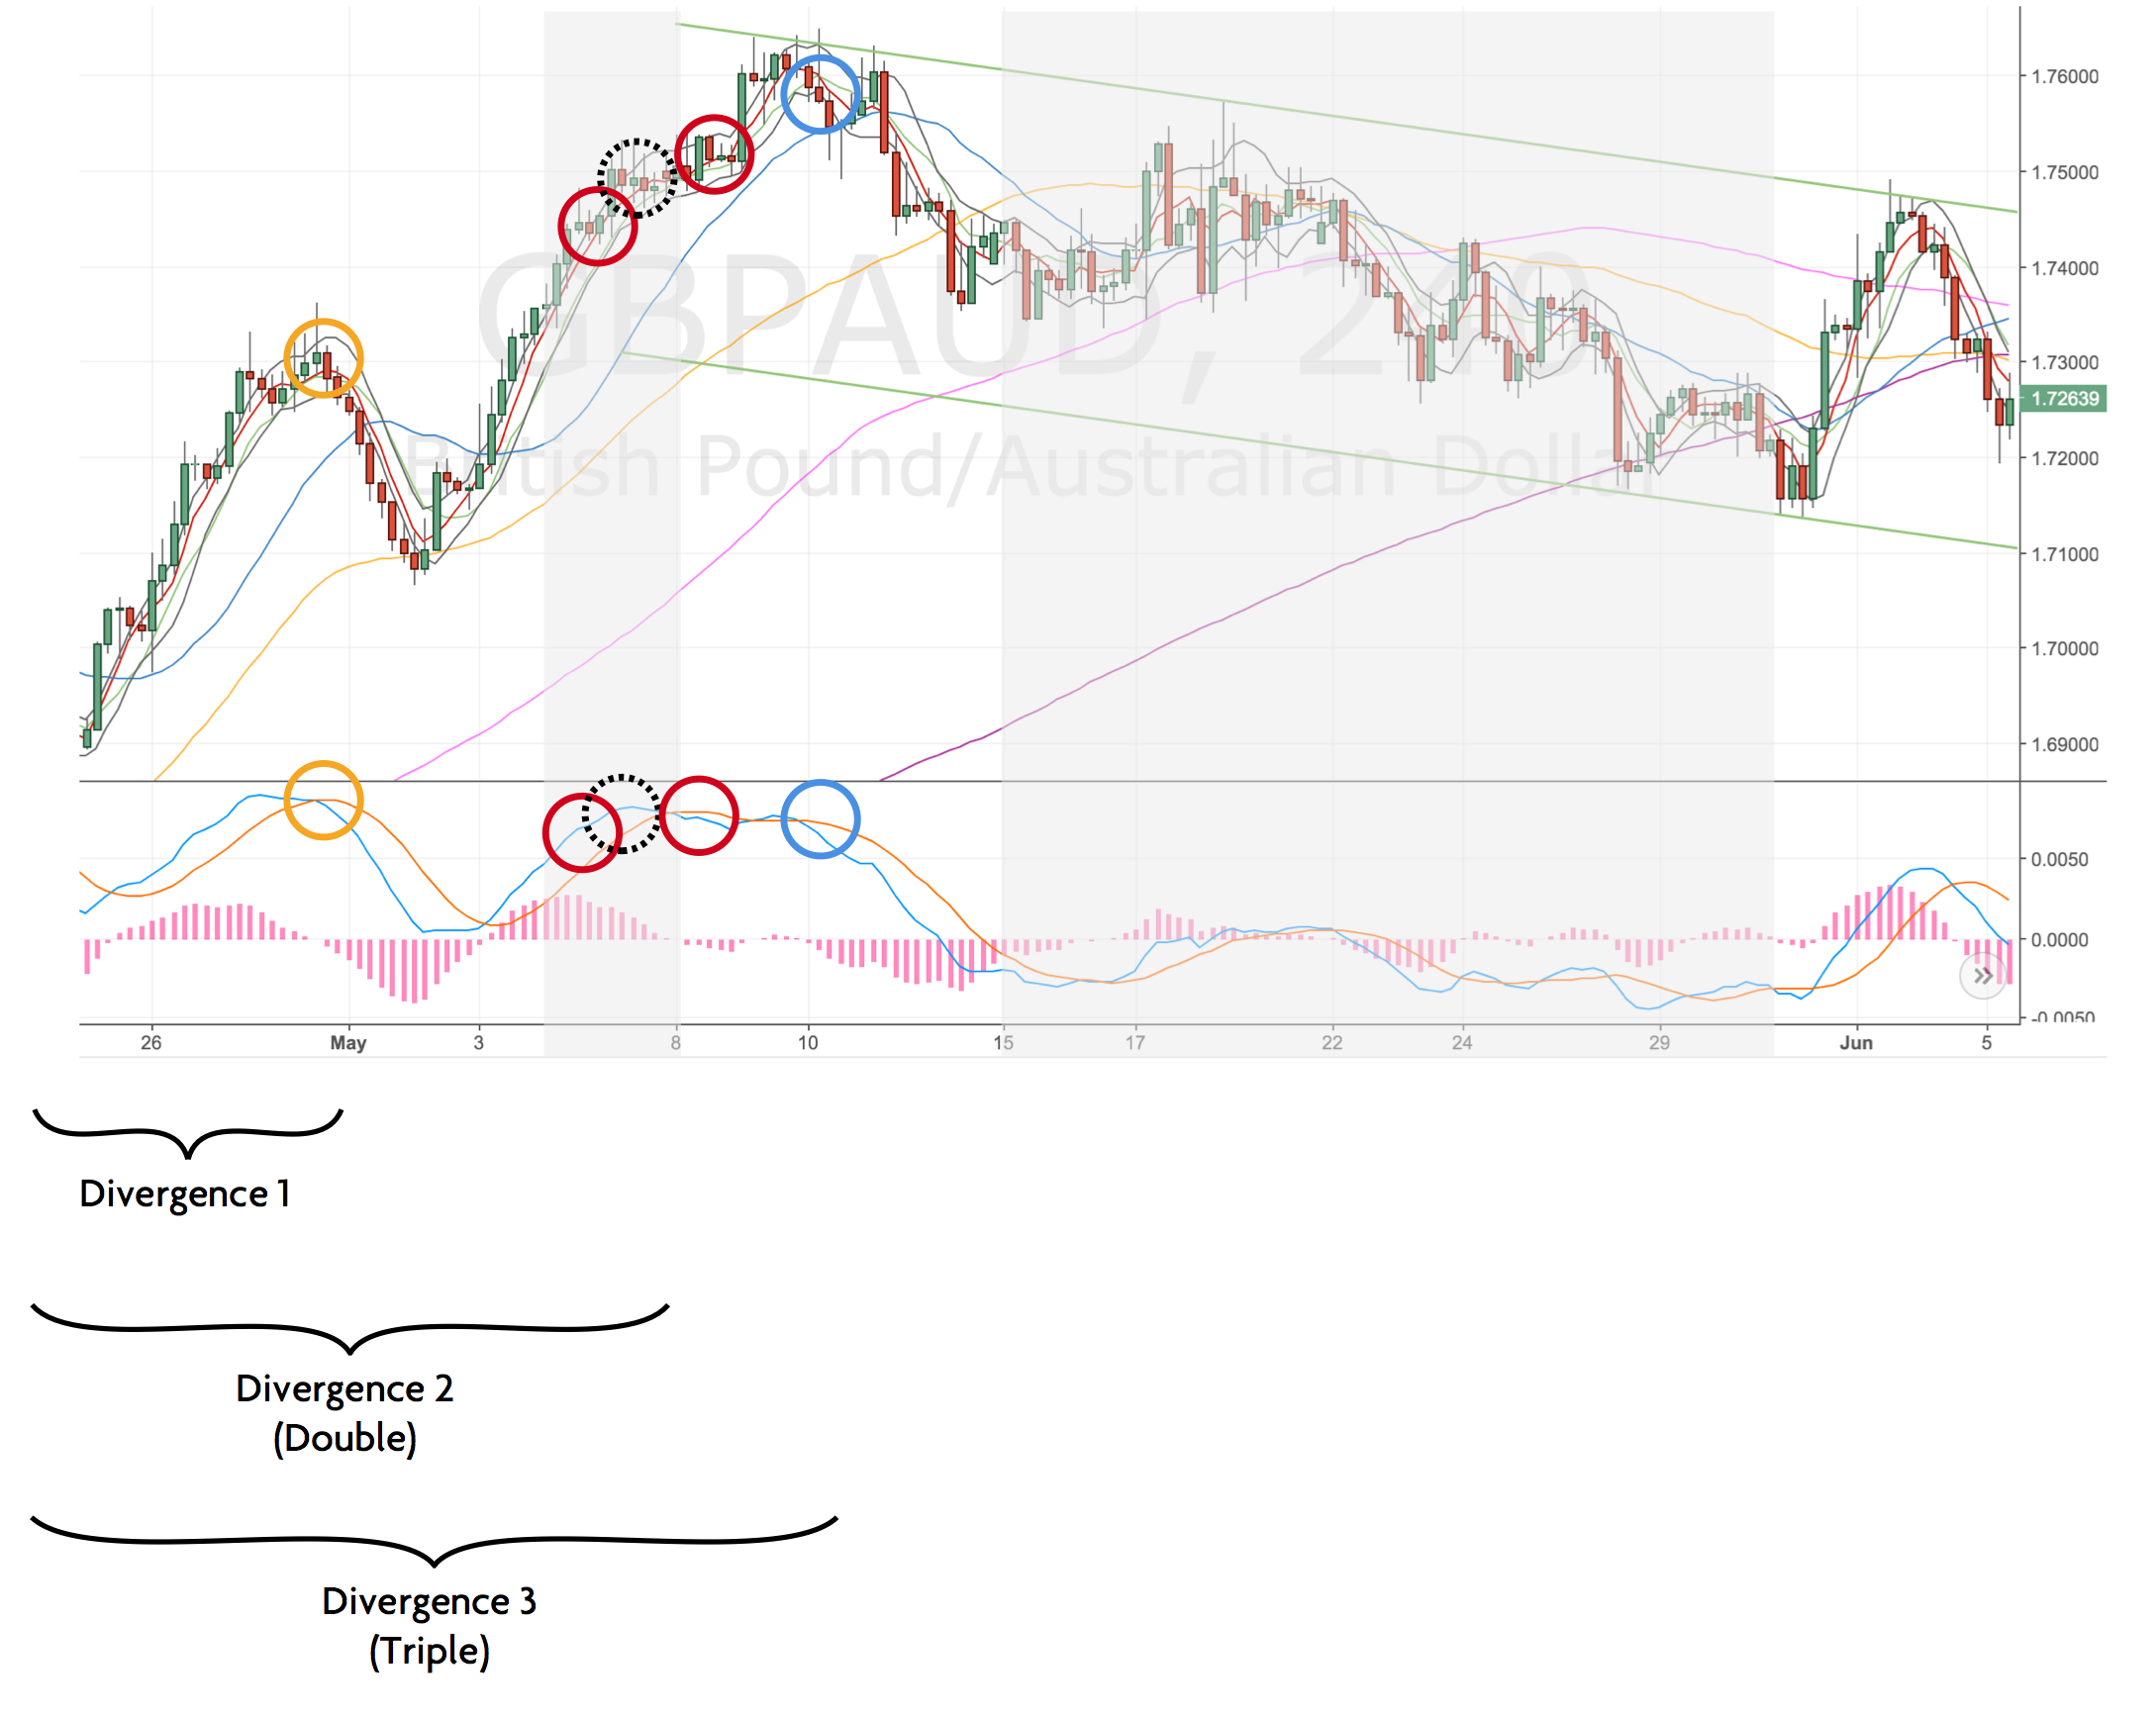
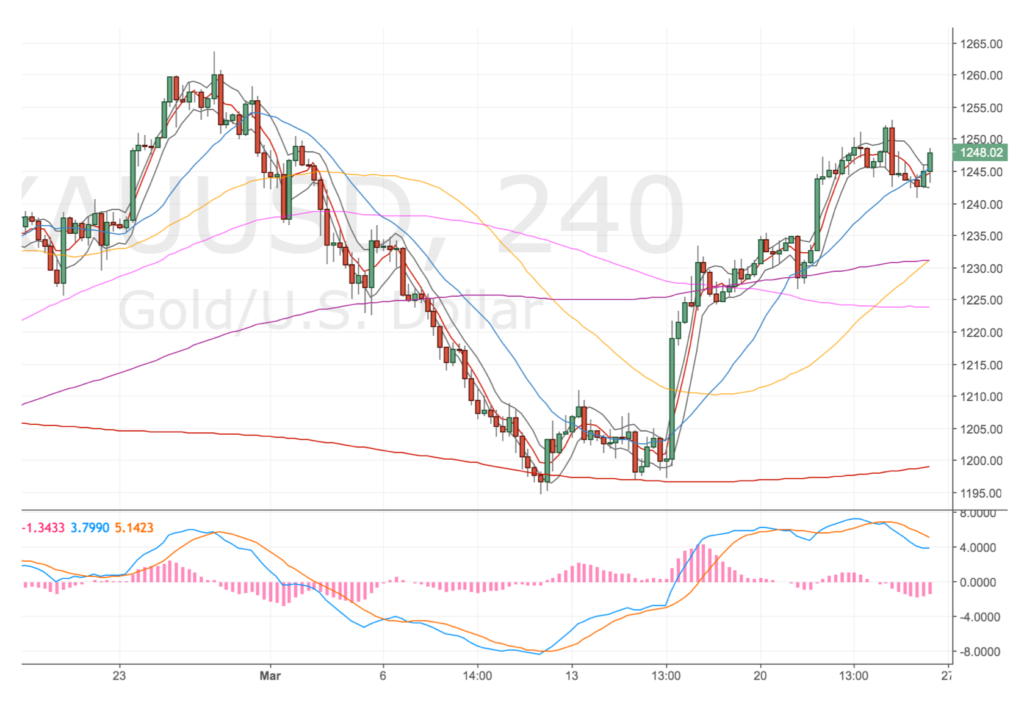
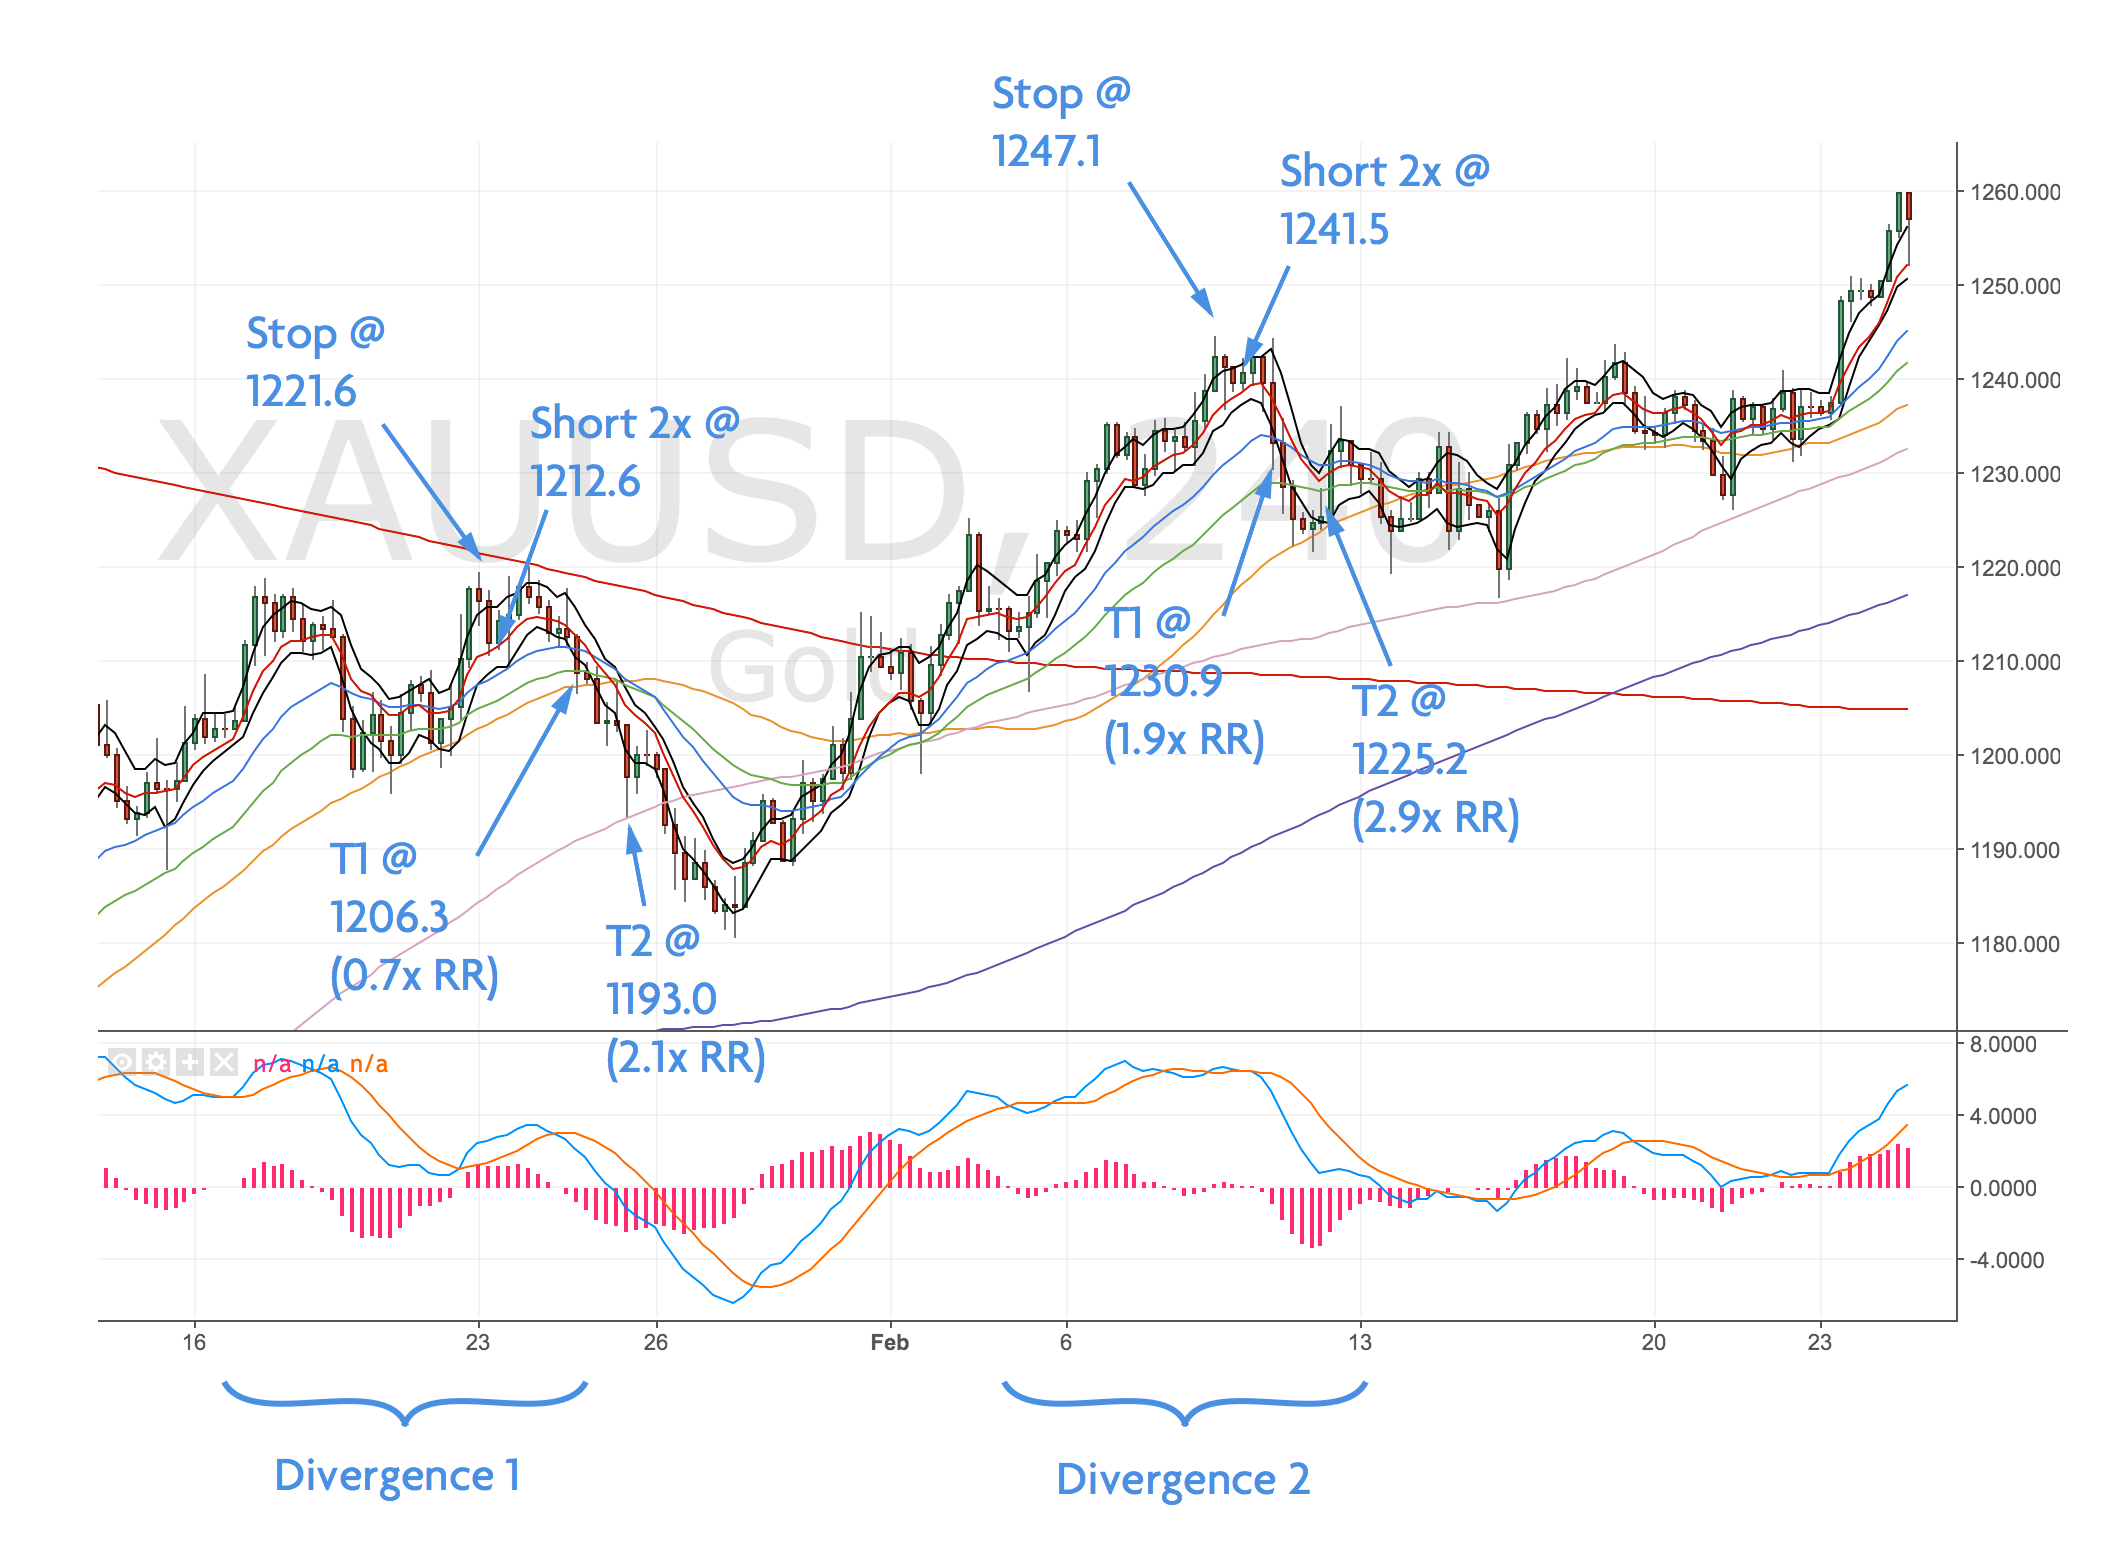
Miss of the month – Gold
Down to my poor routine, I got stopped out, got another divergence entry to go short but wasn’t around to trade it. Frustrating because it corresponded to a trendline touch and a test of the m100.
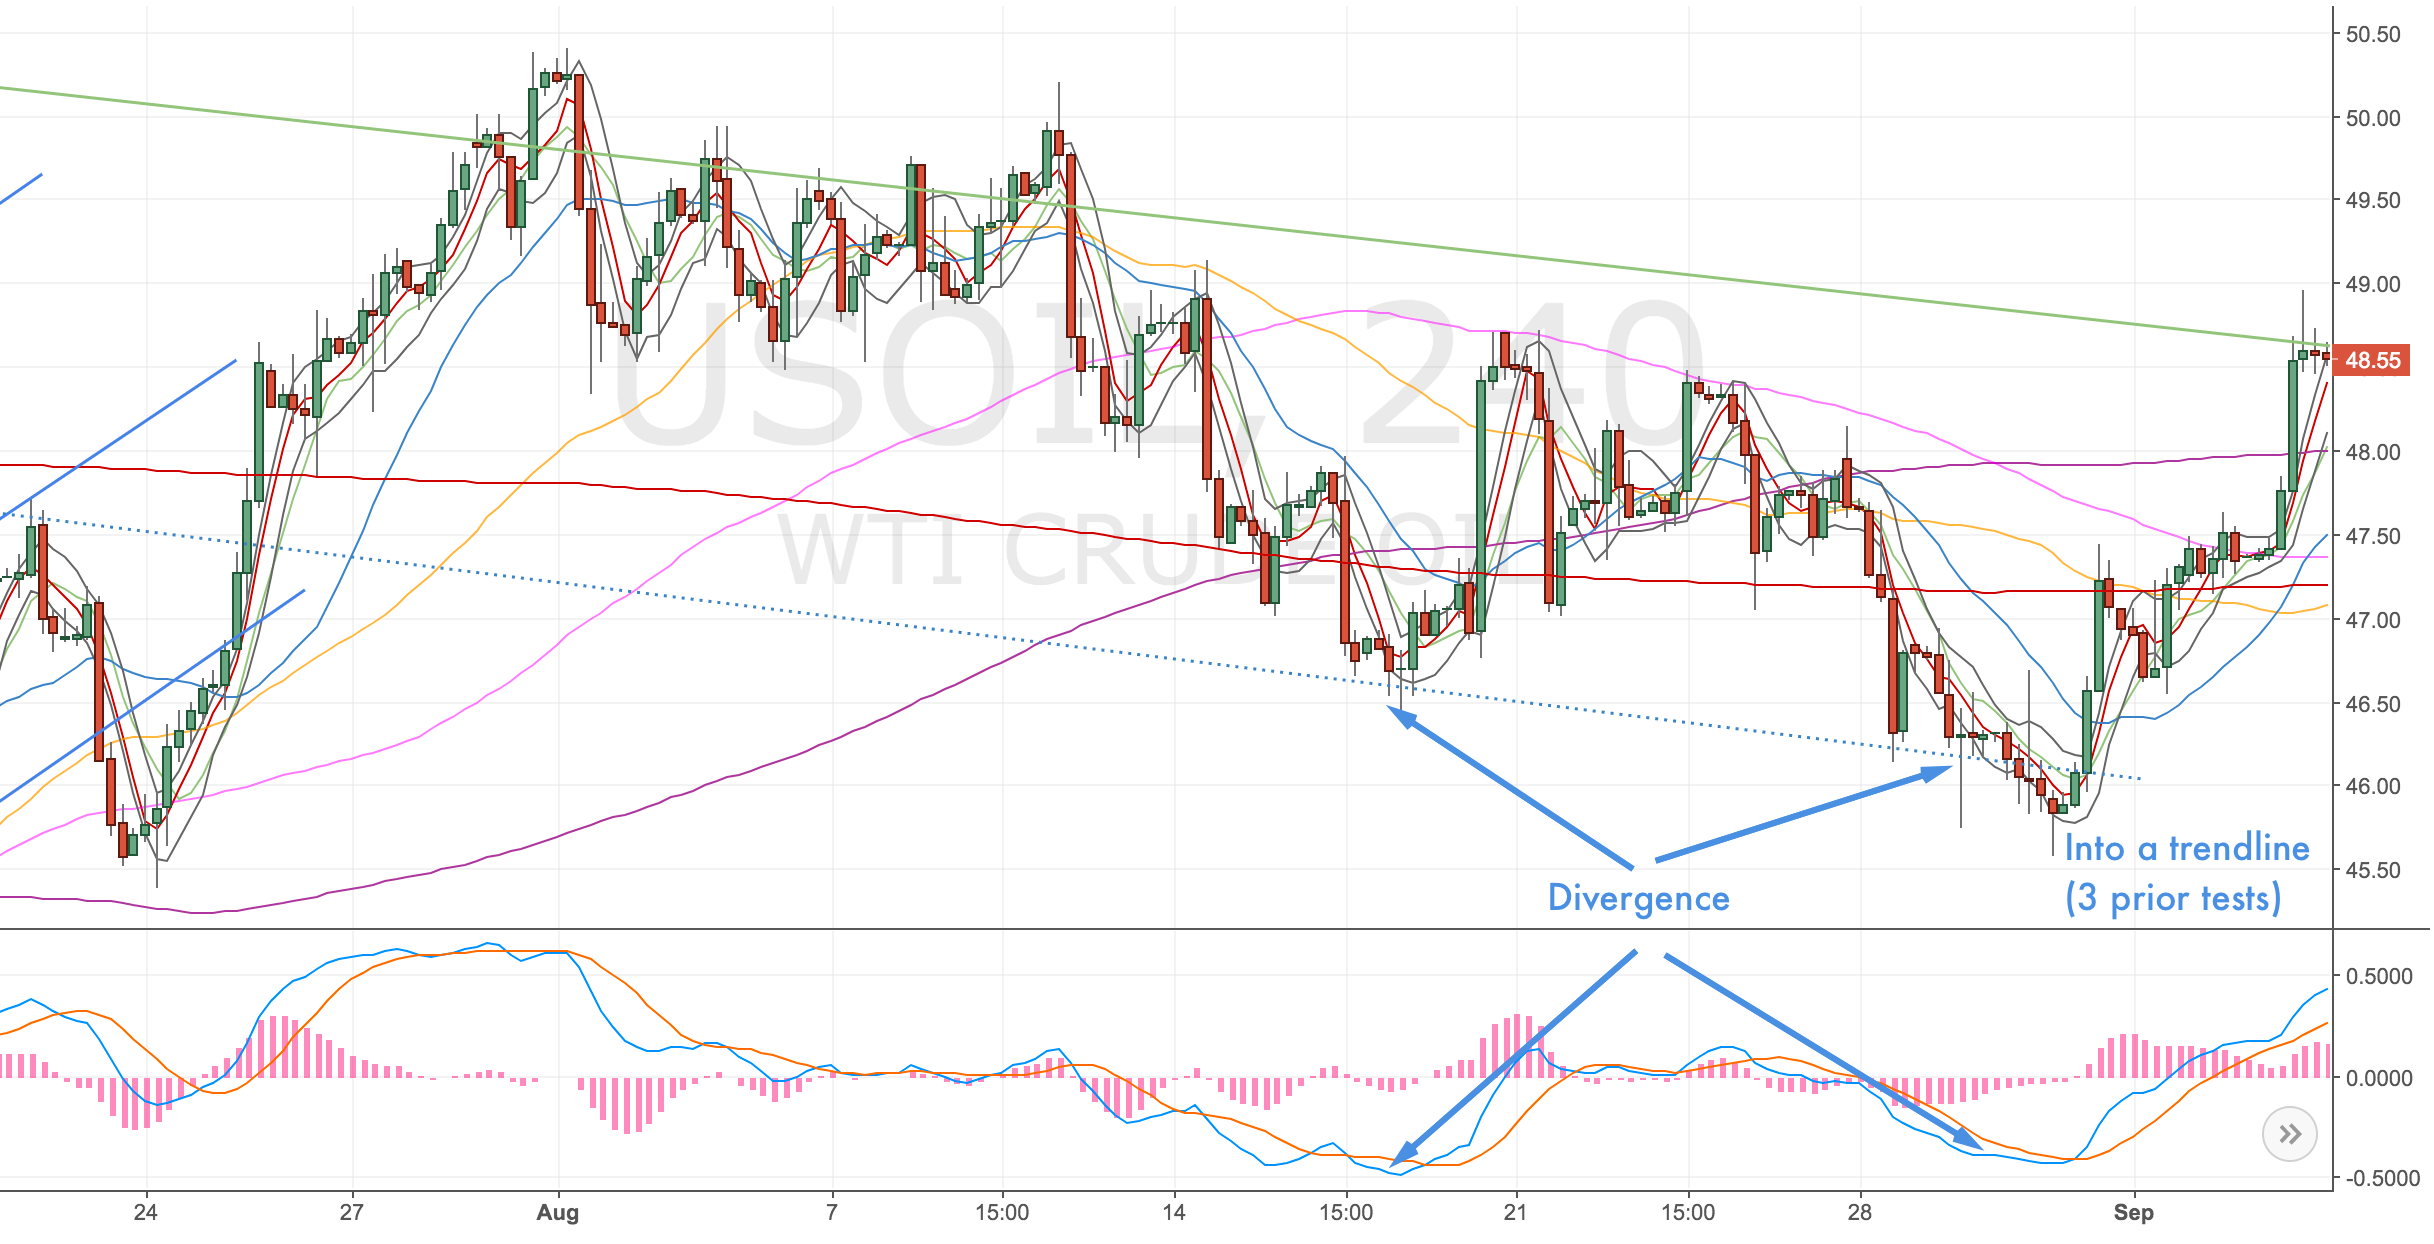
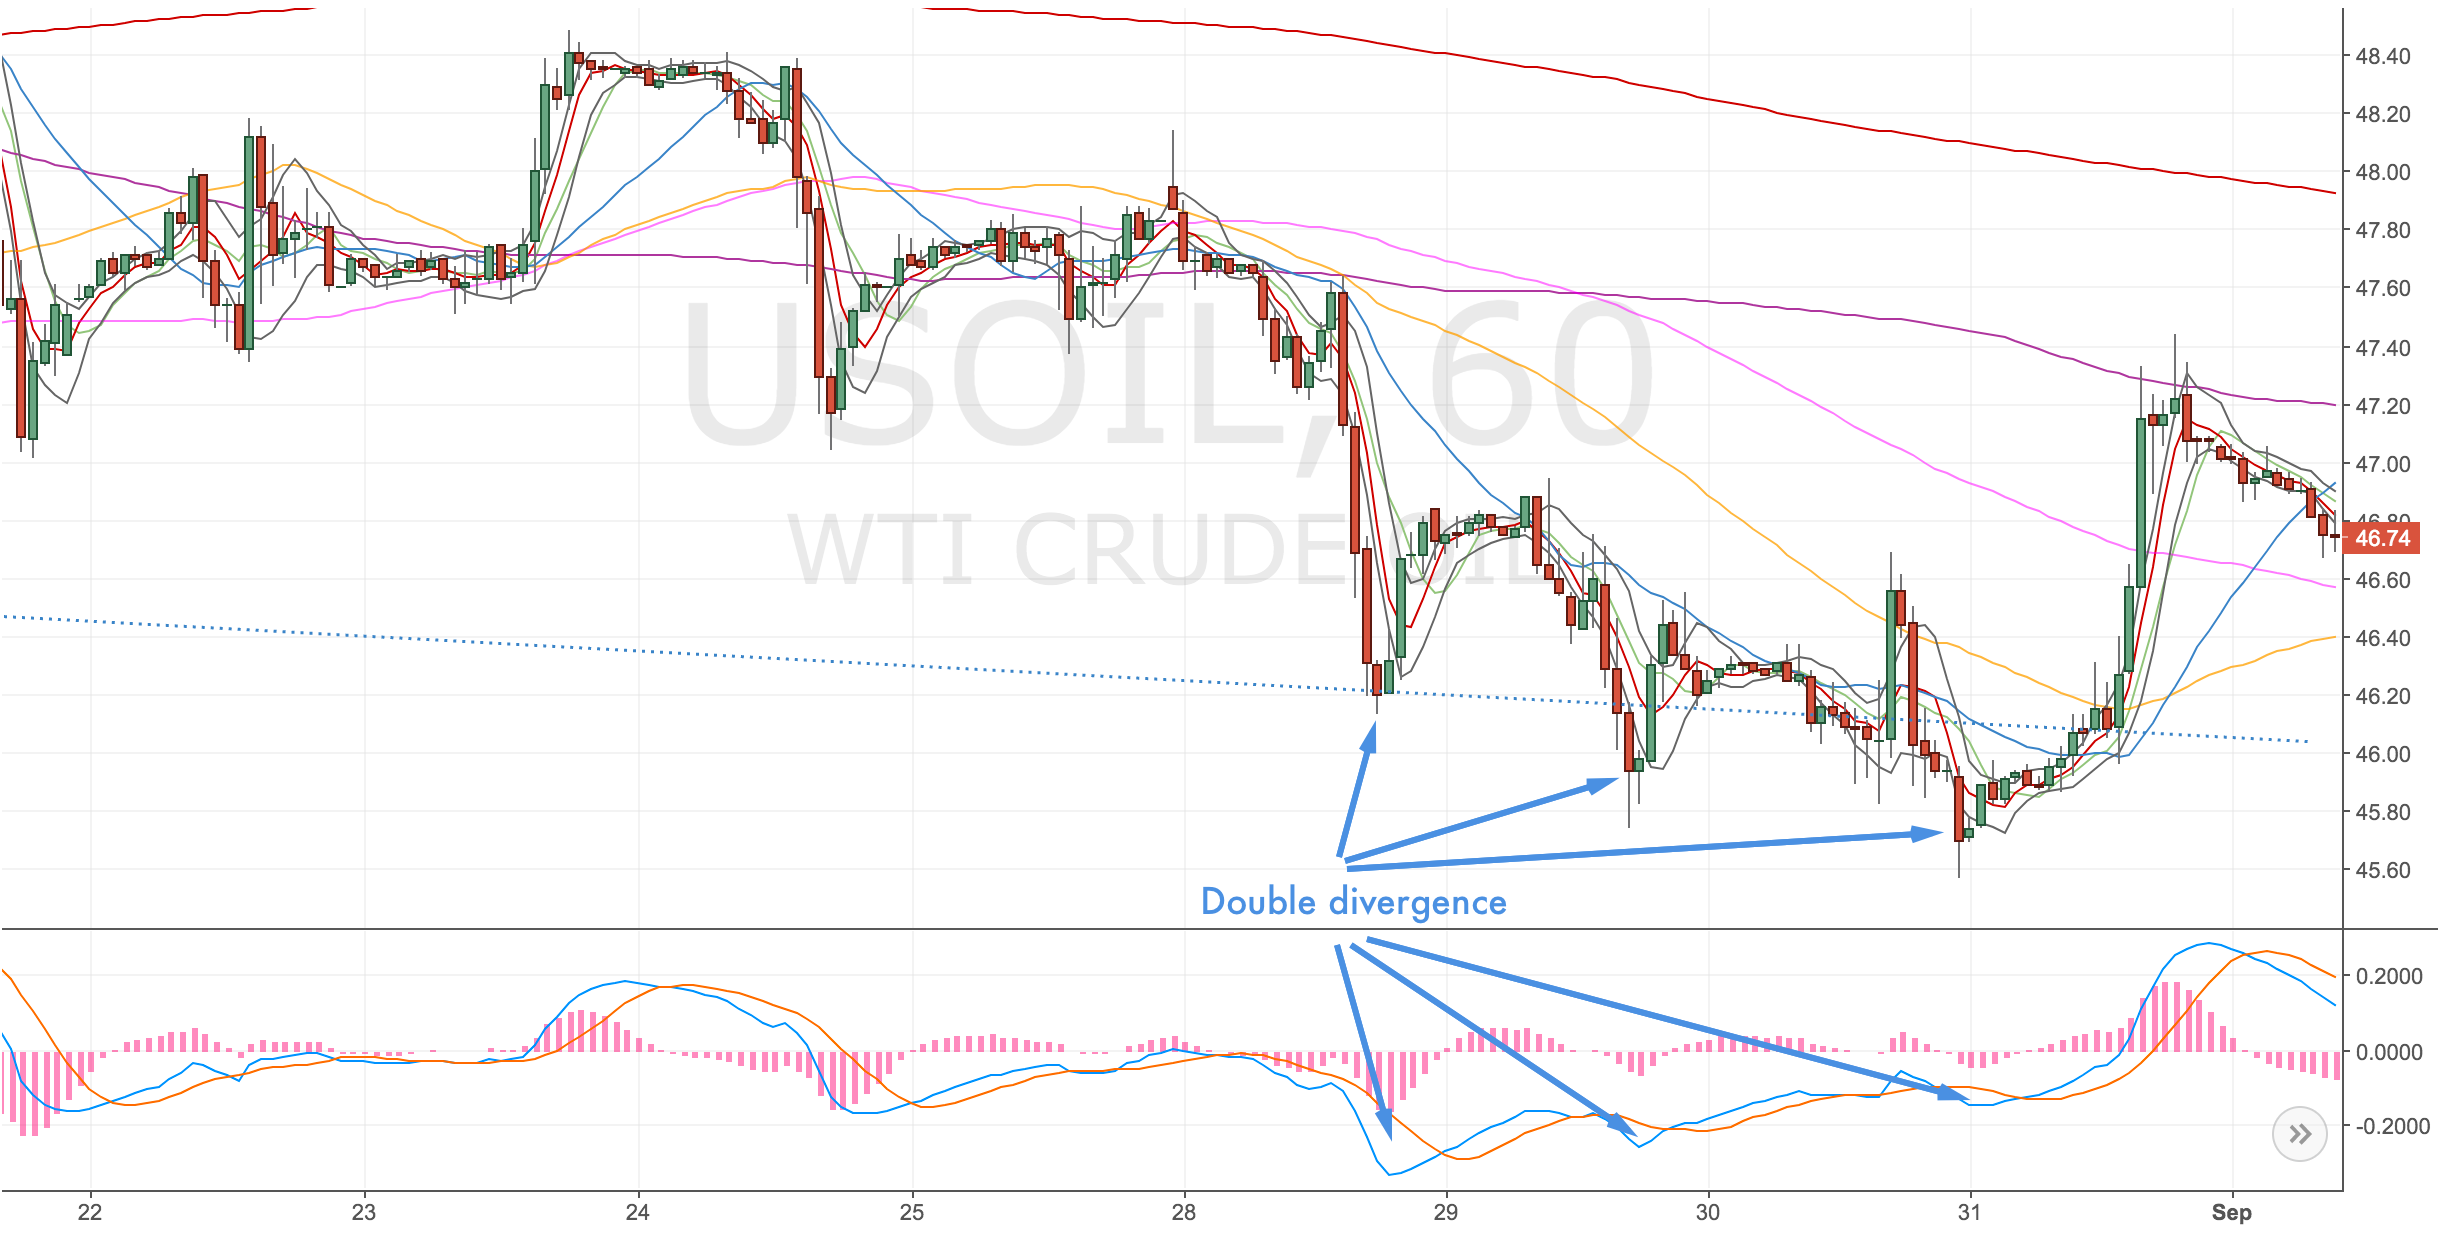
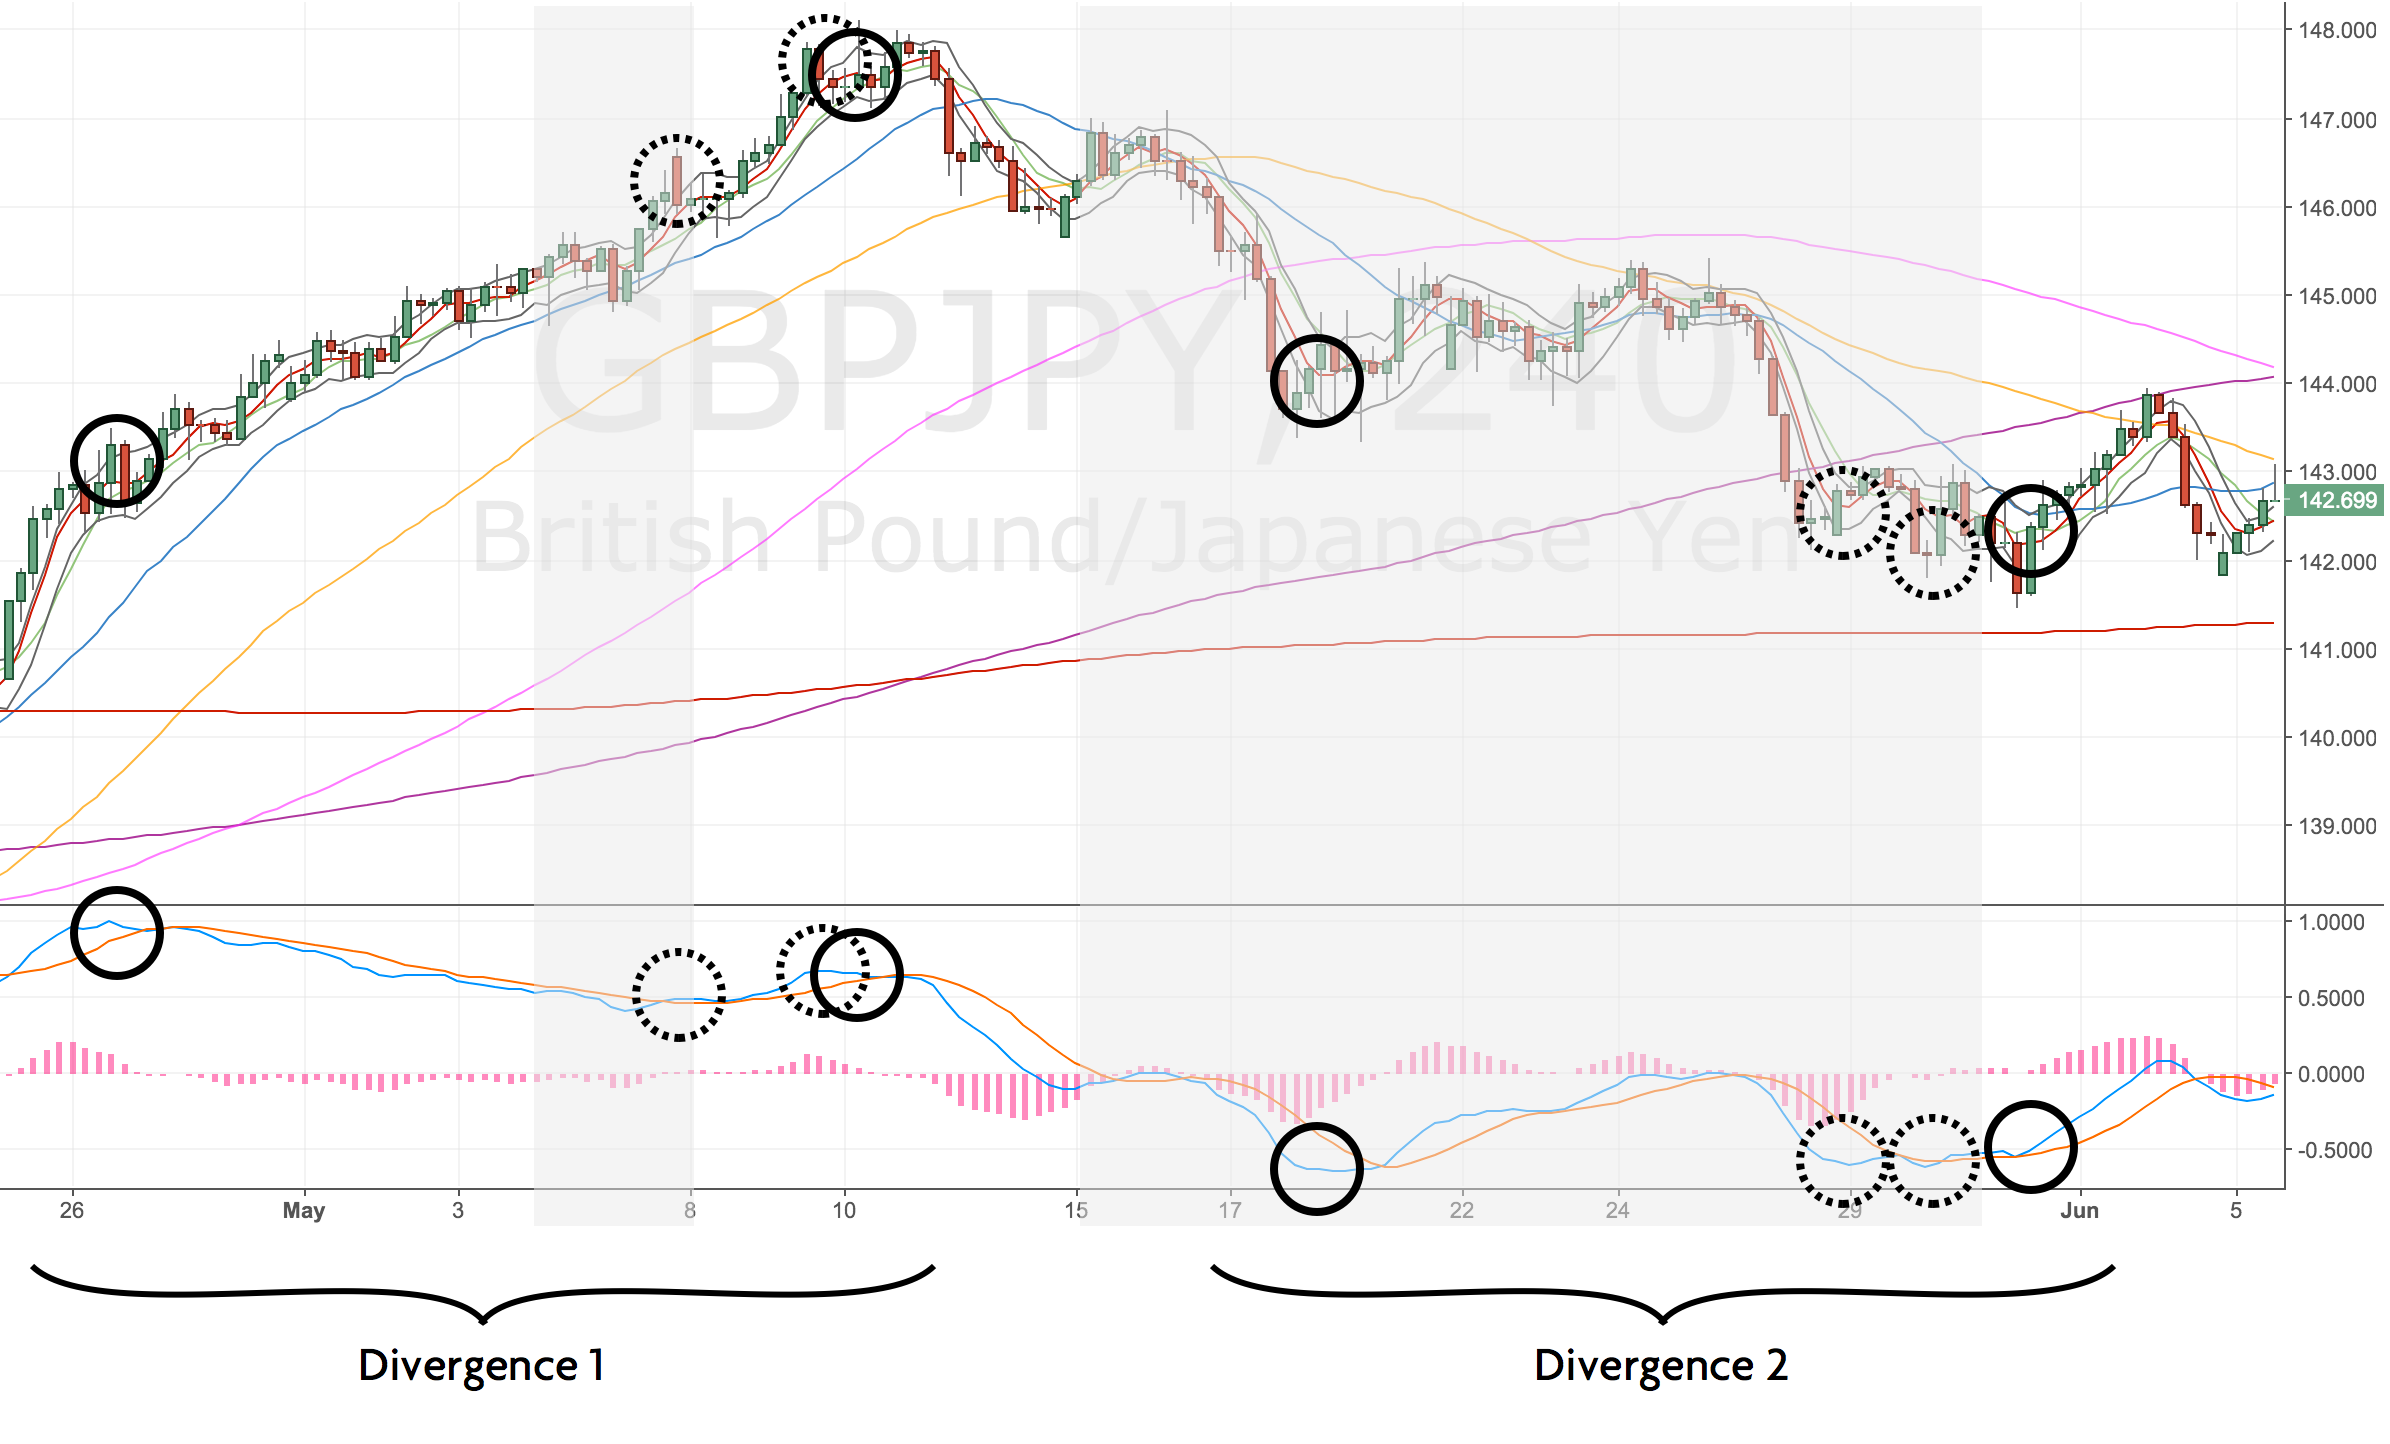
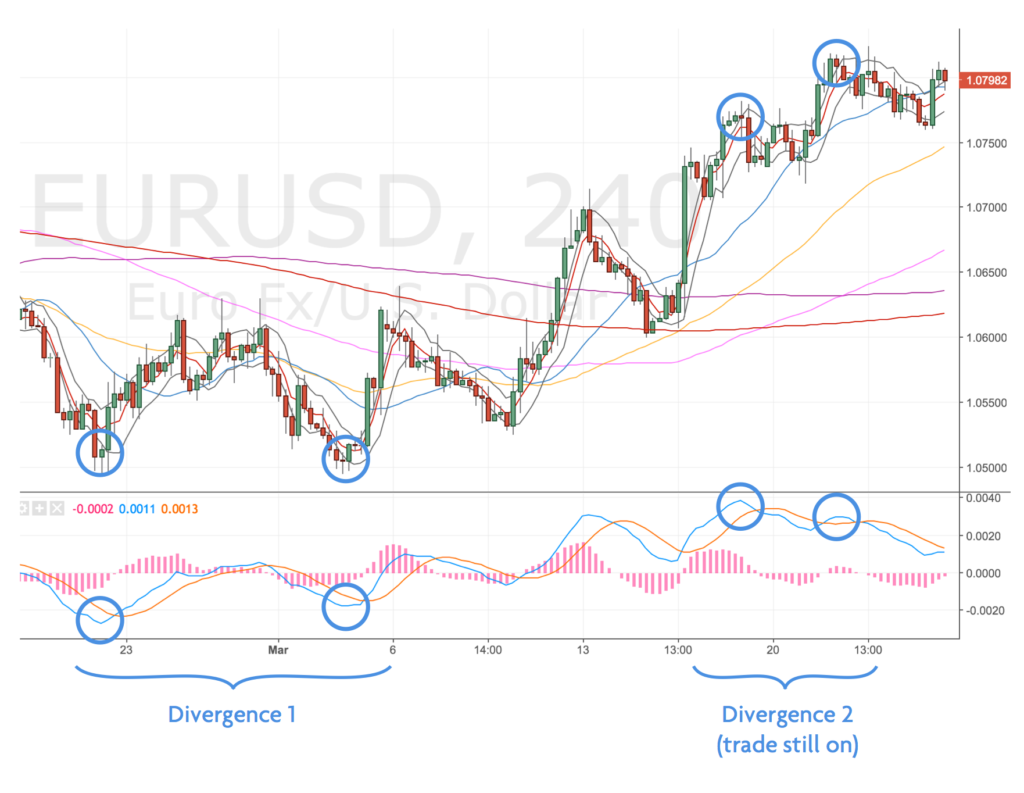
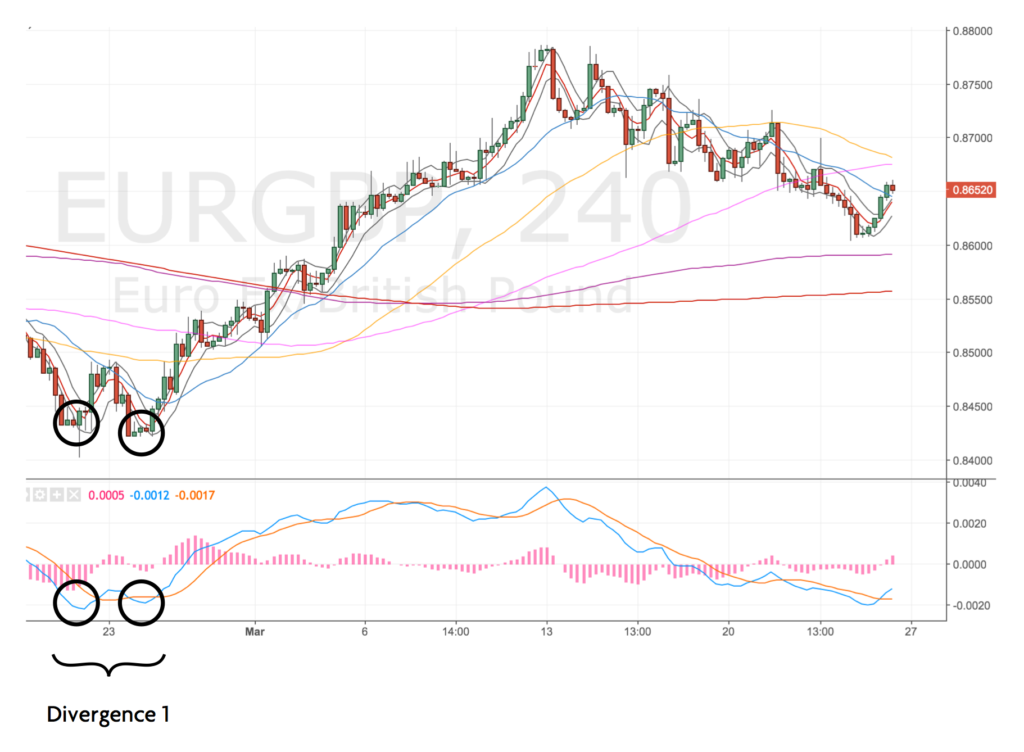
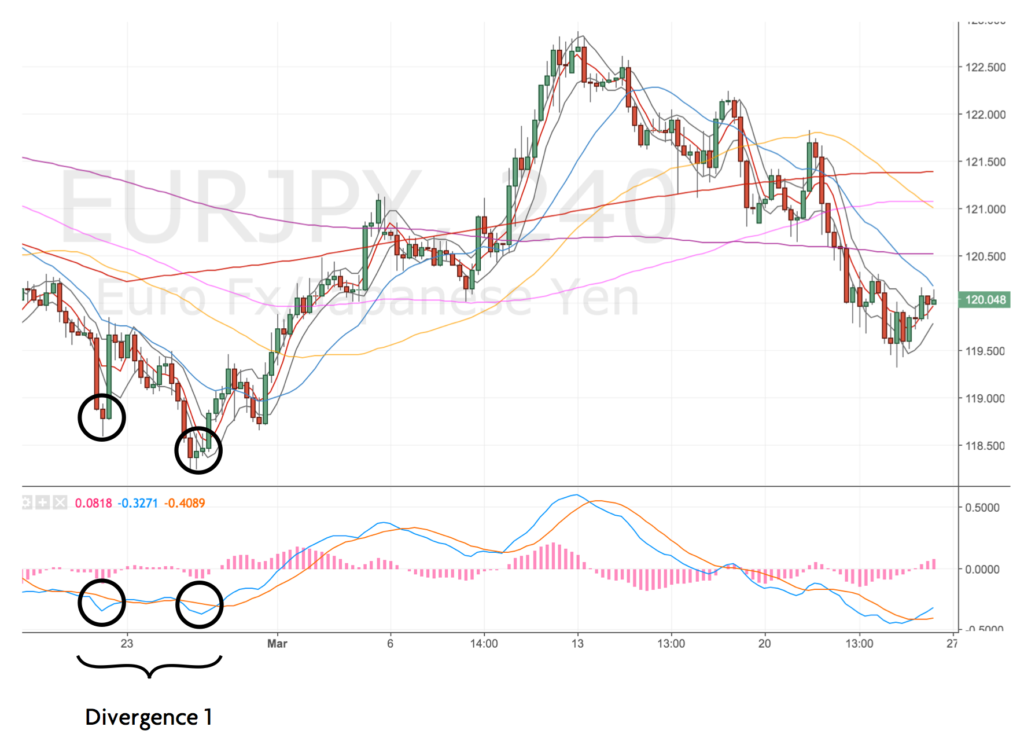
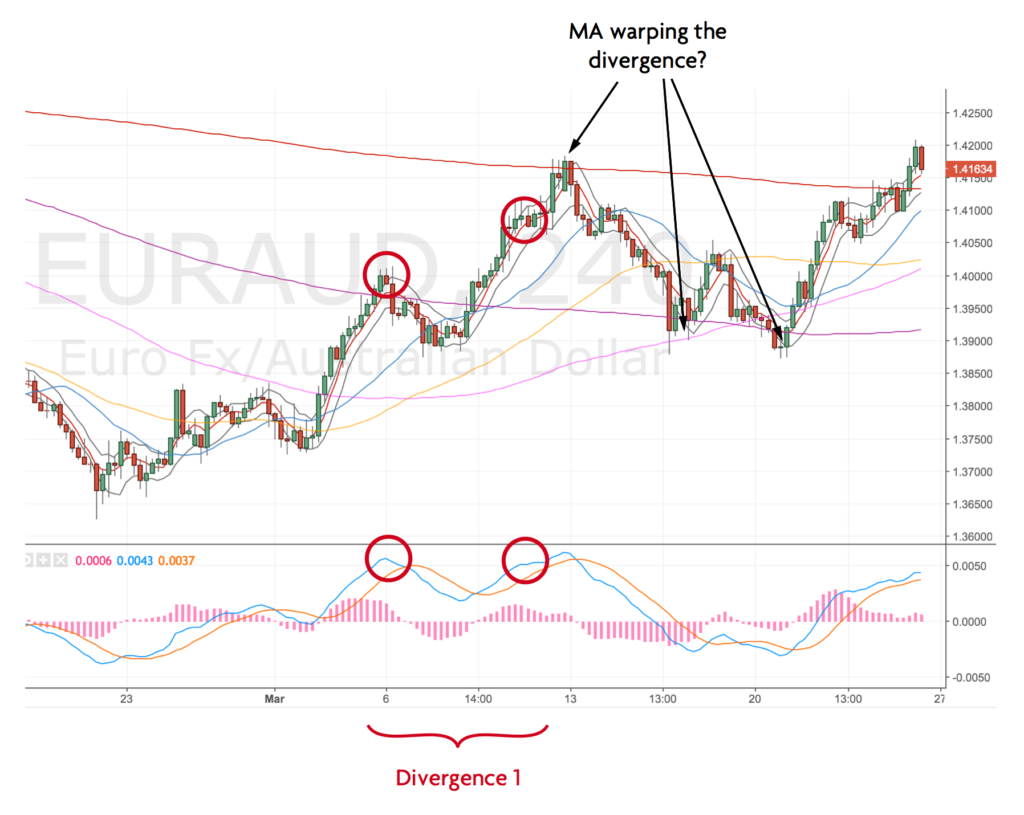
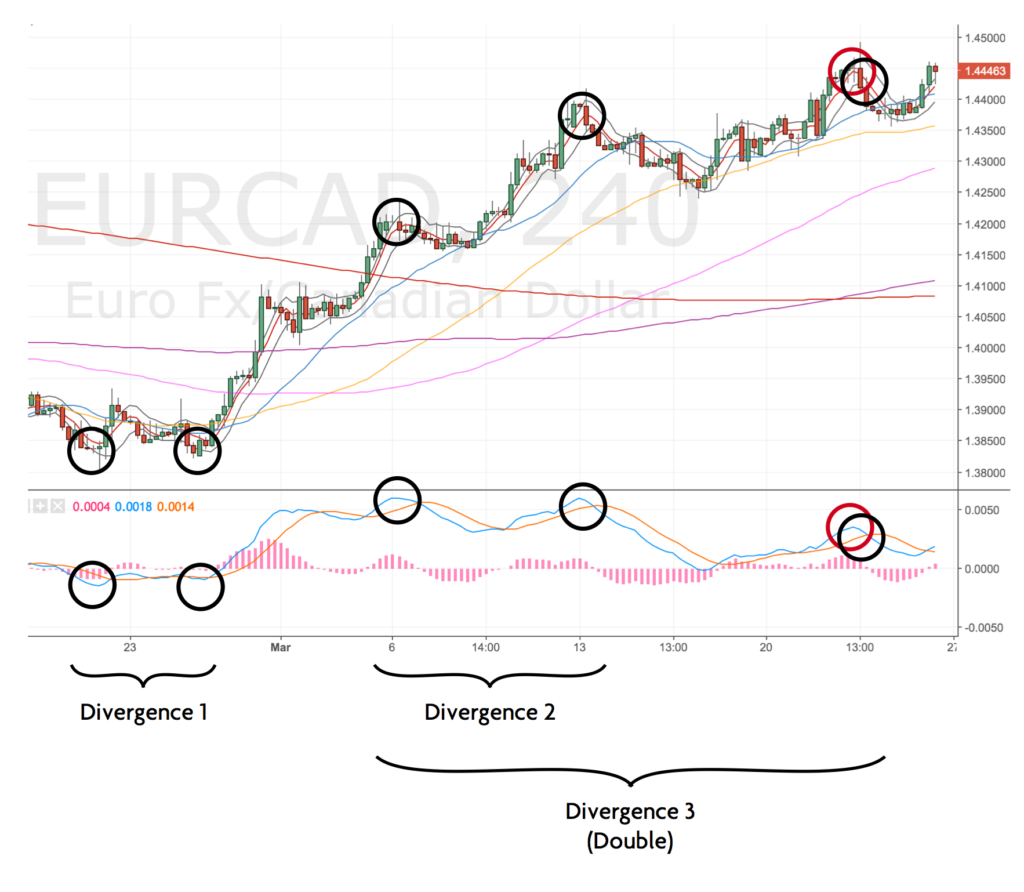
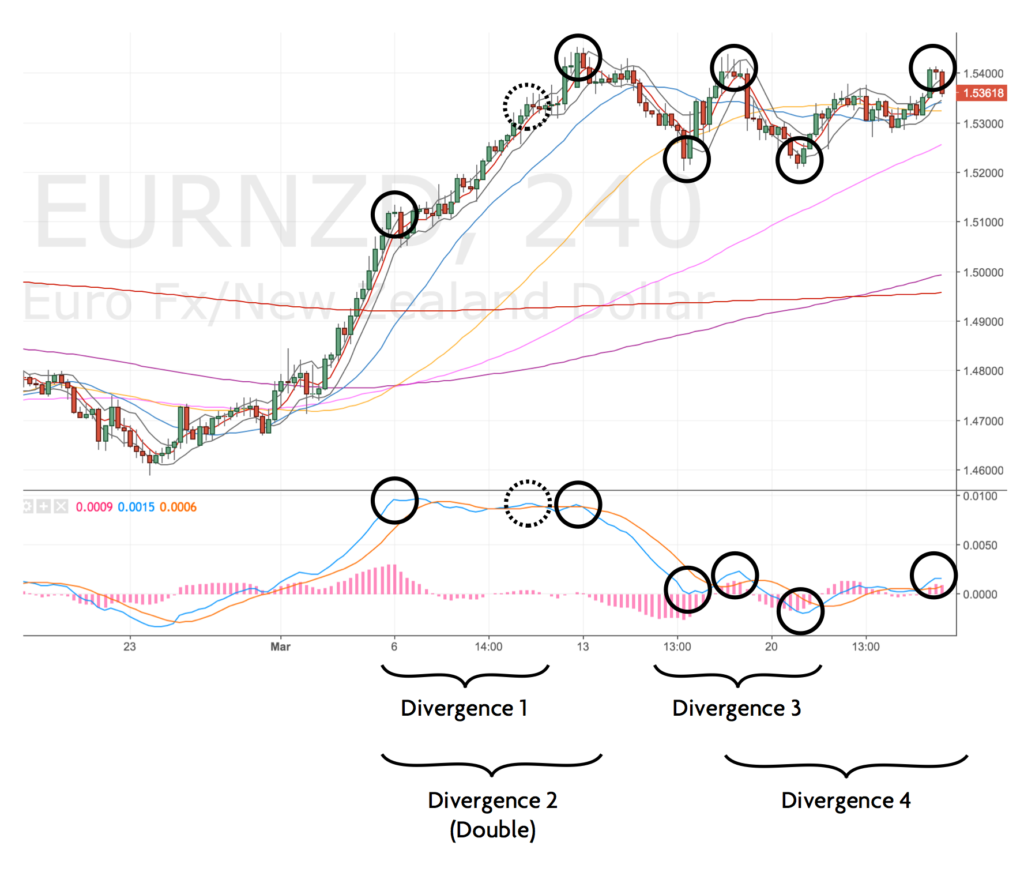
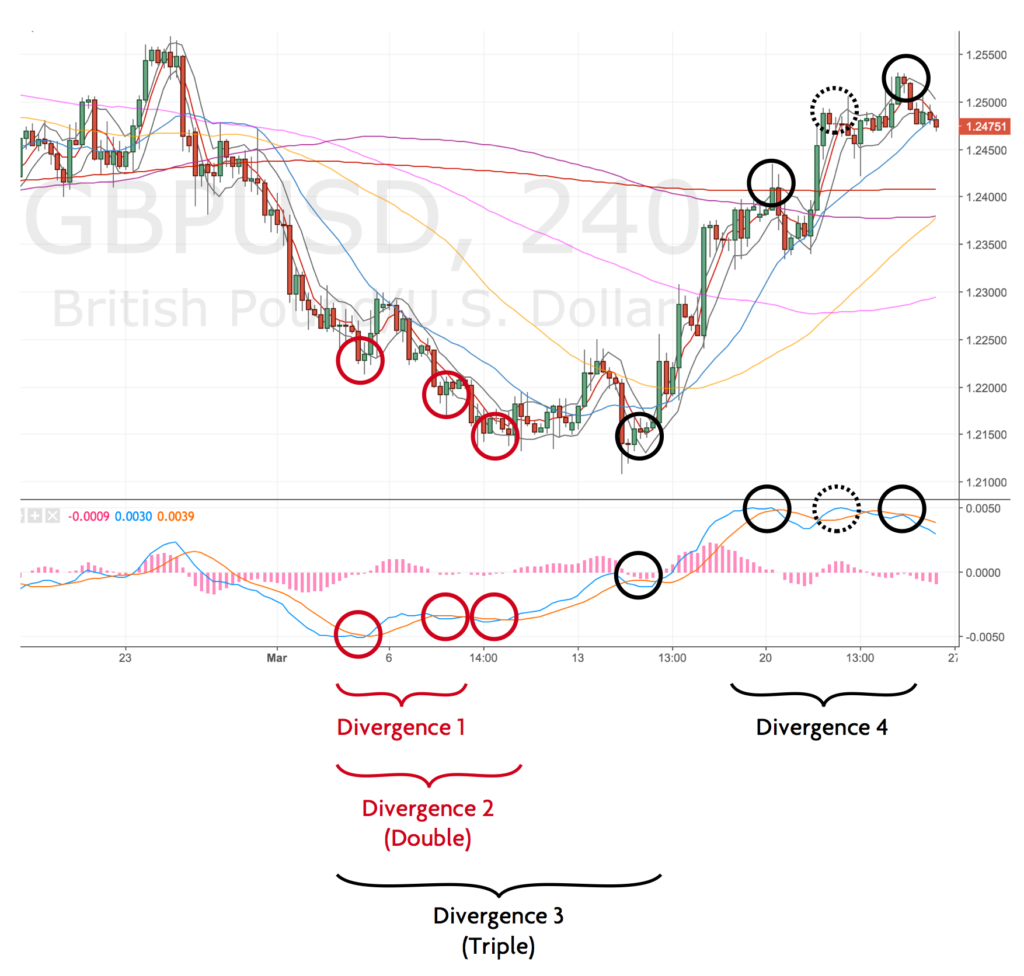
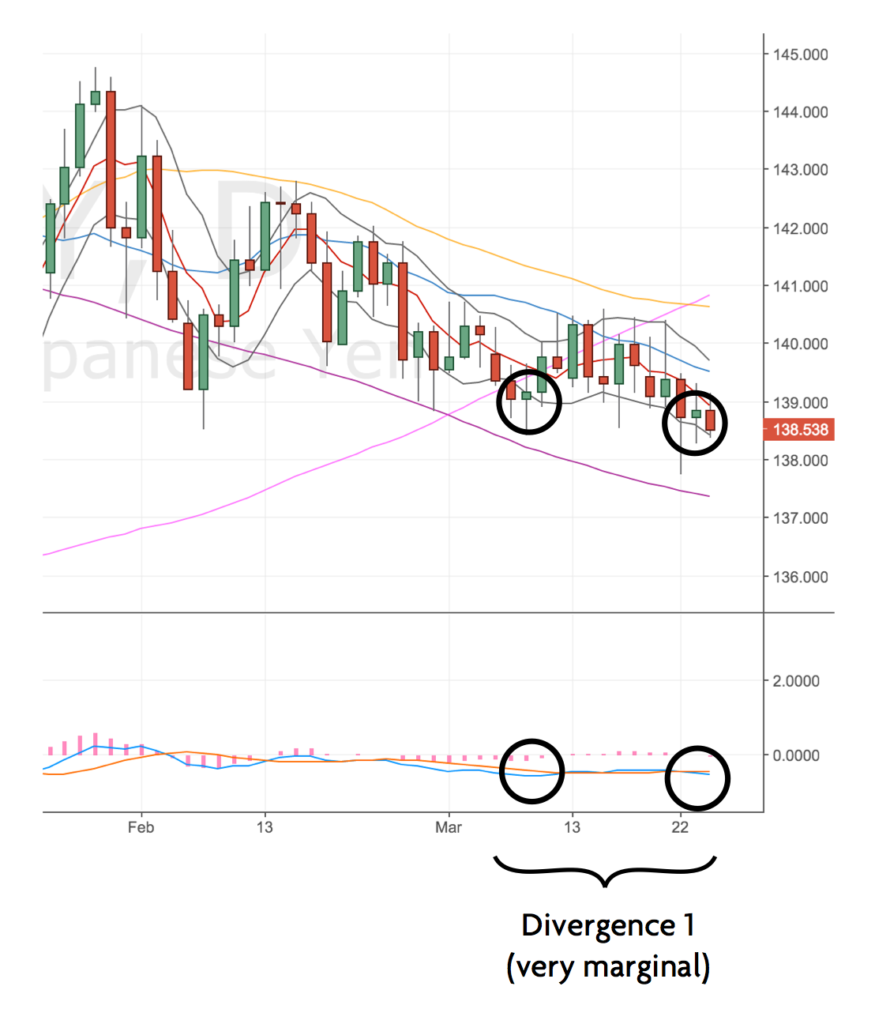
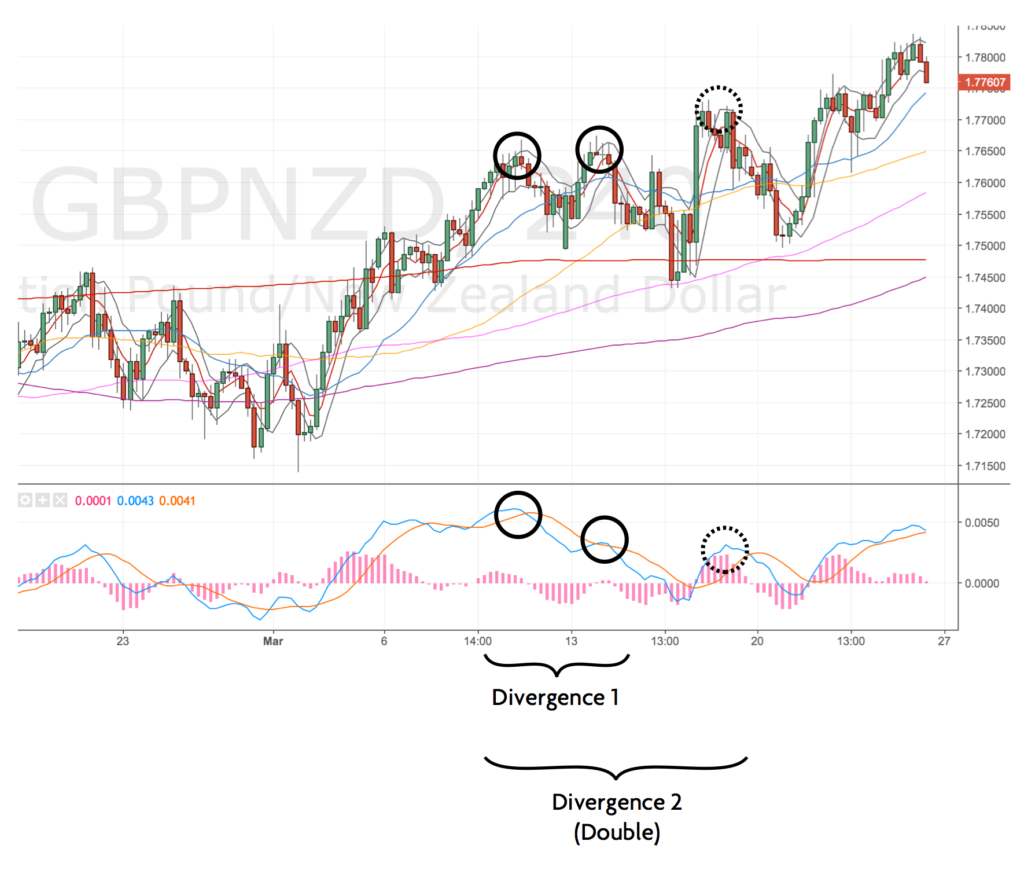
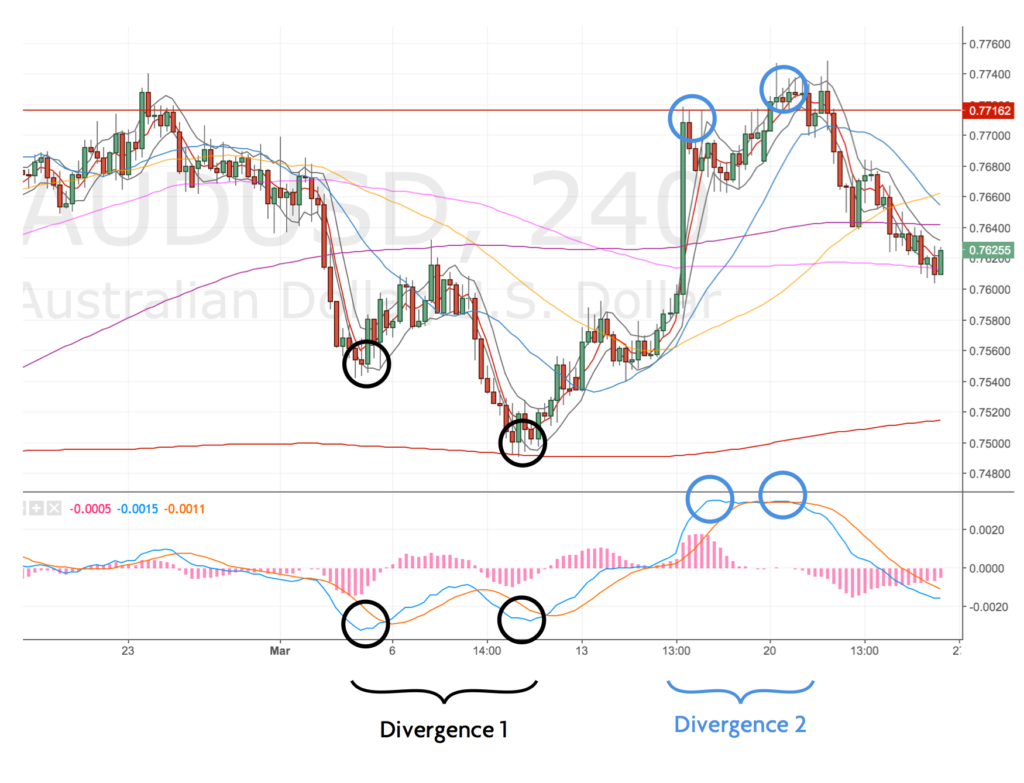
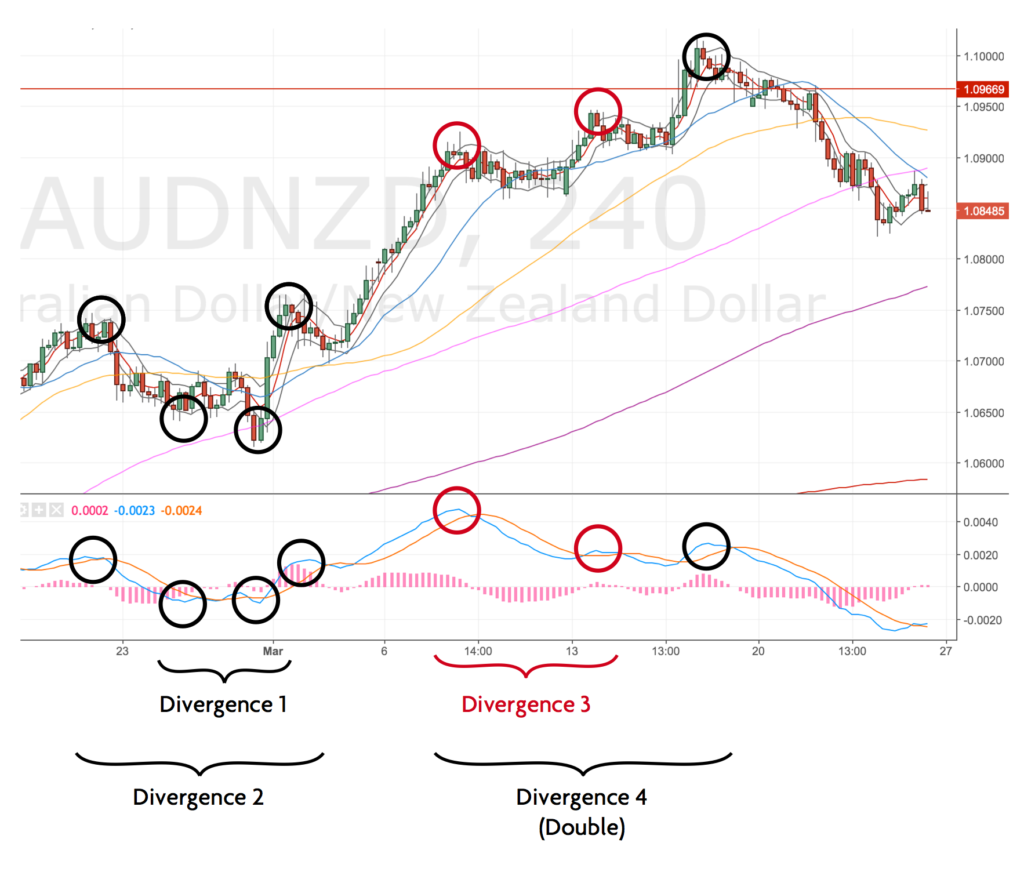
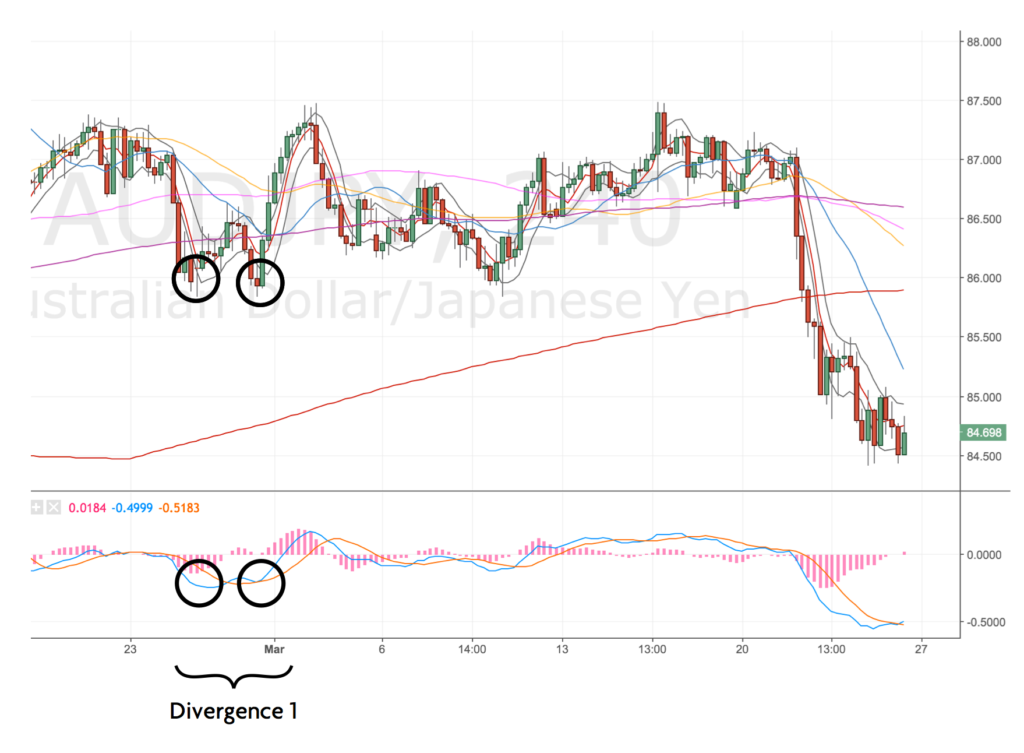
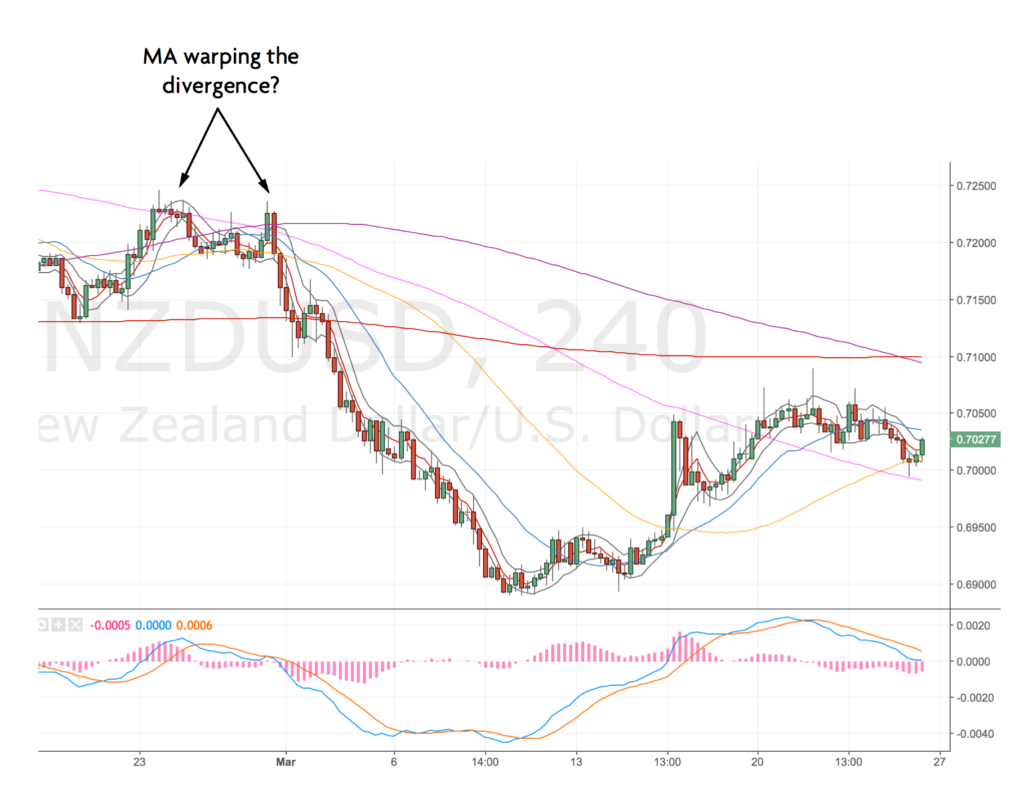
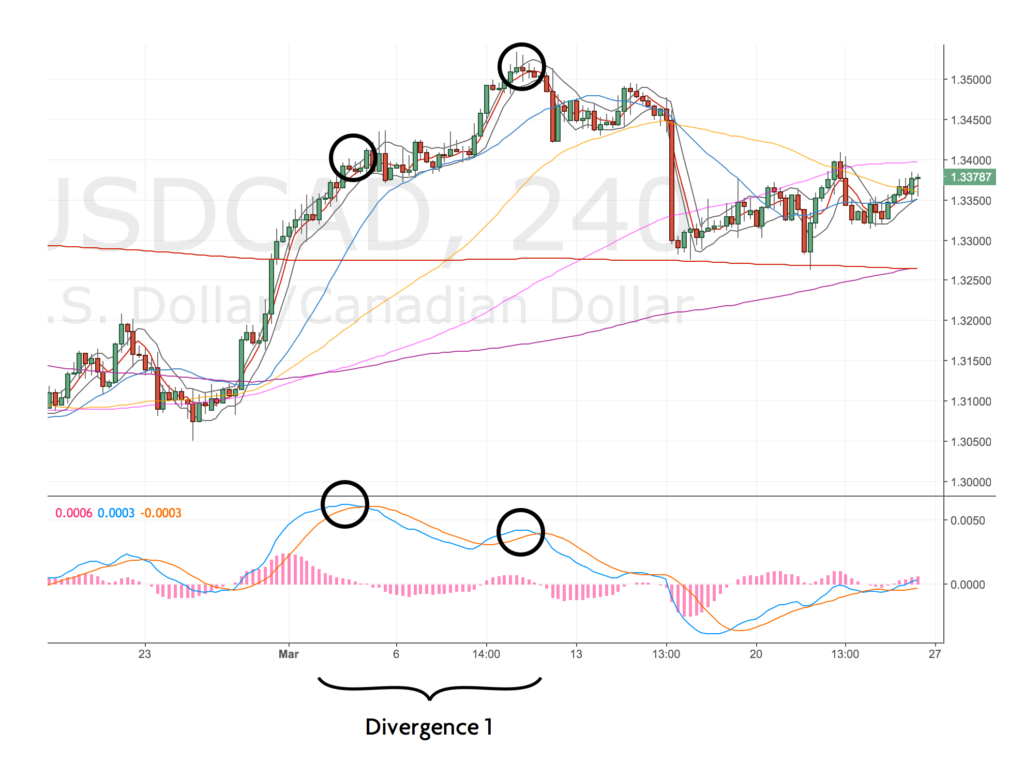
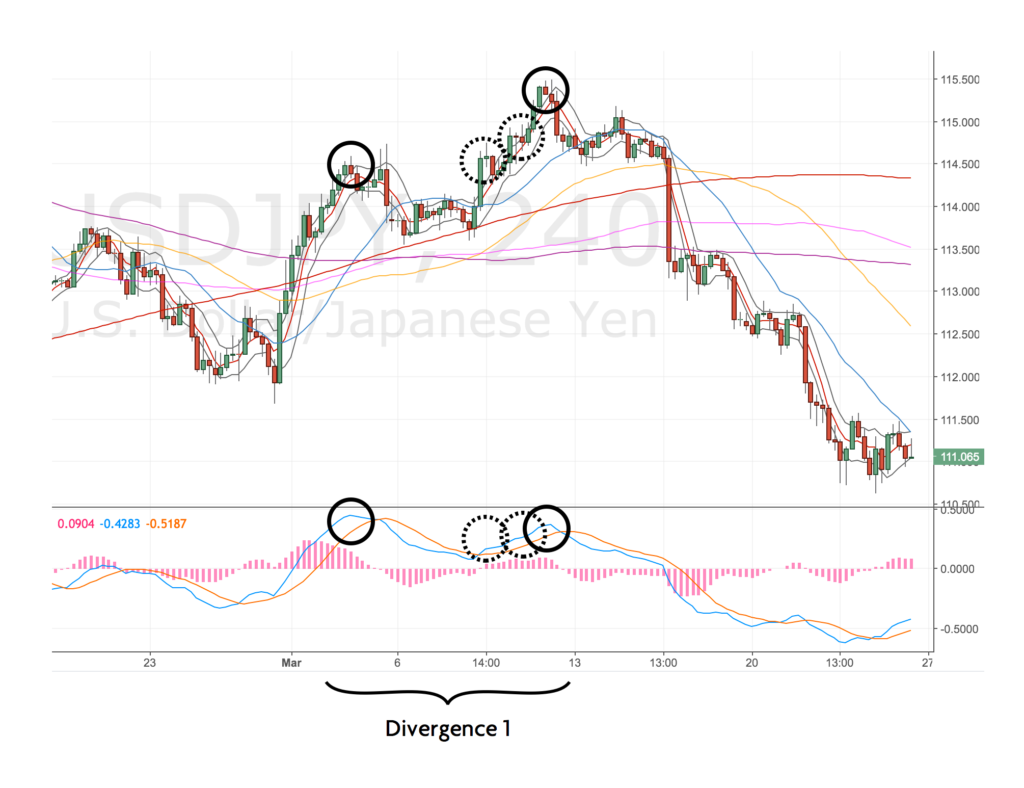
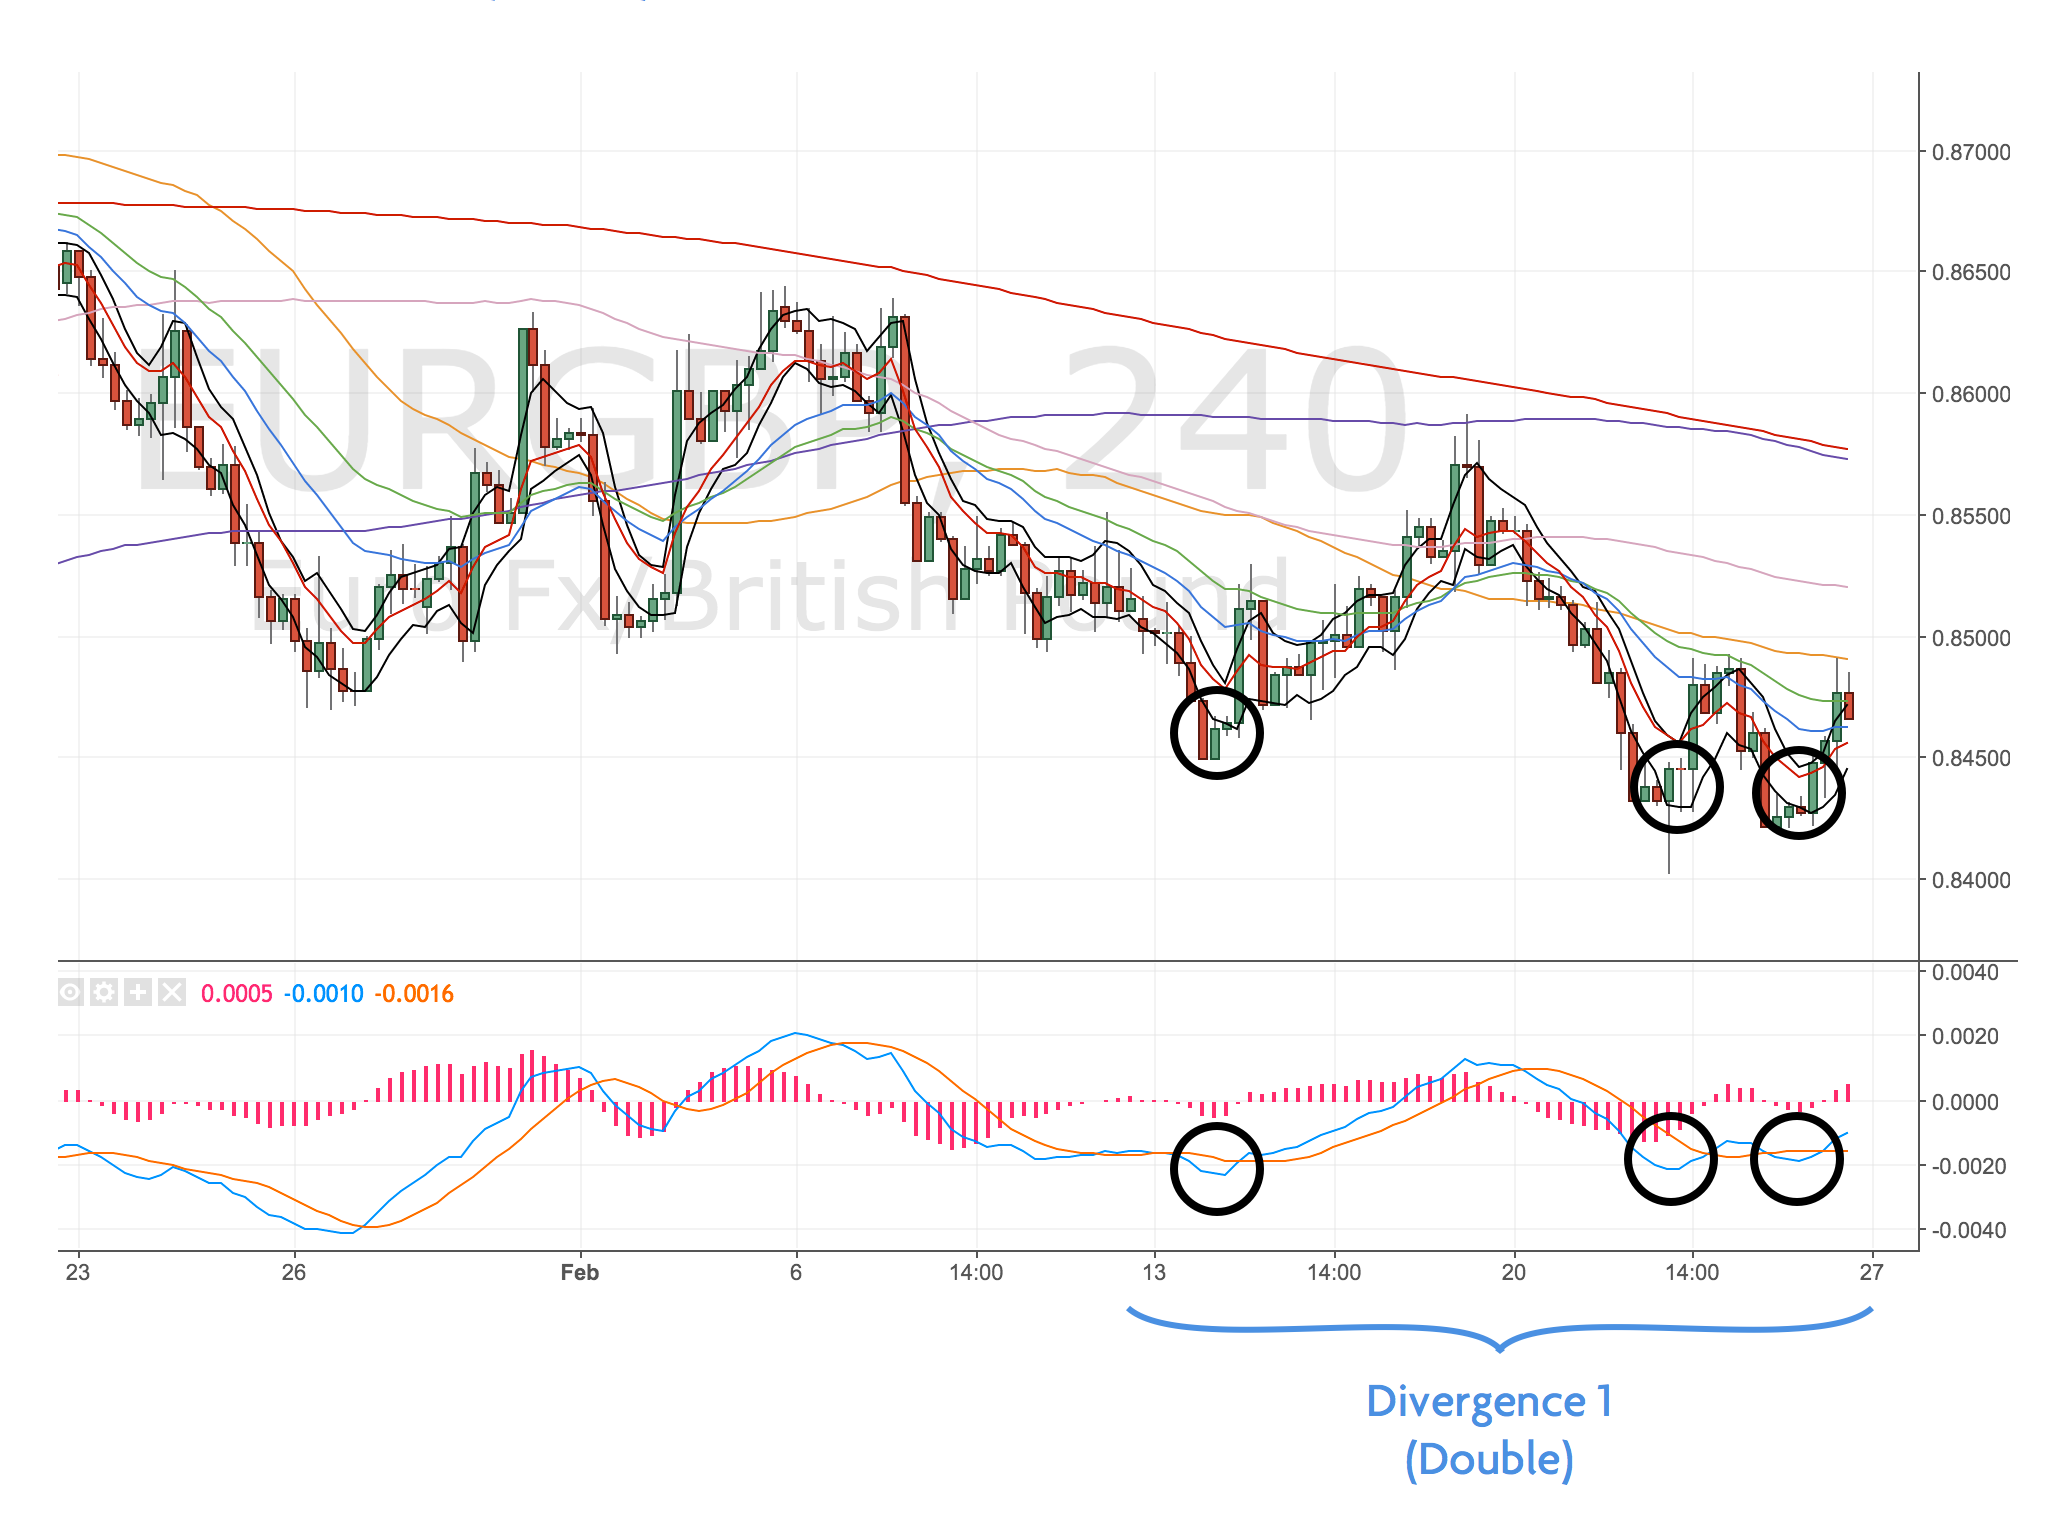
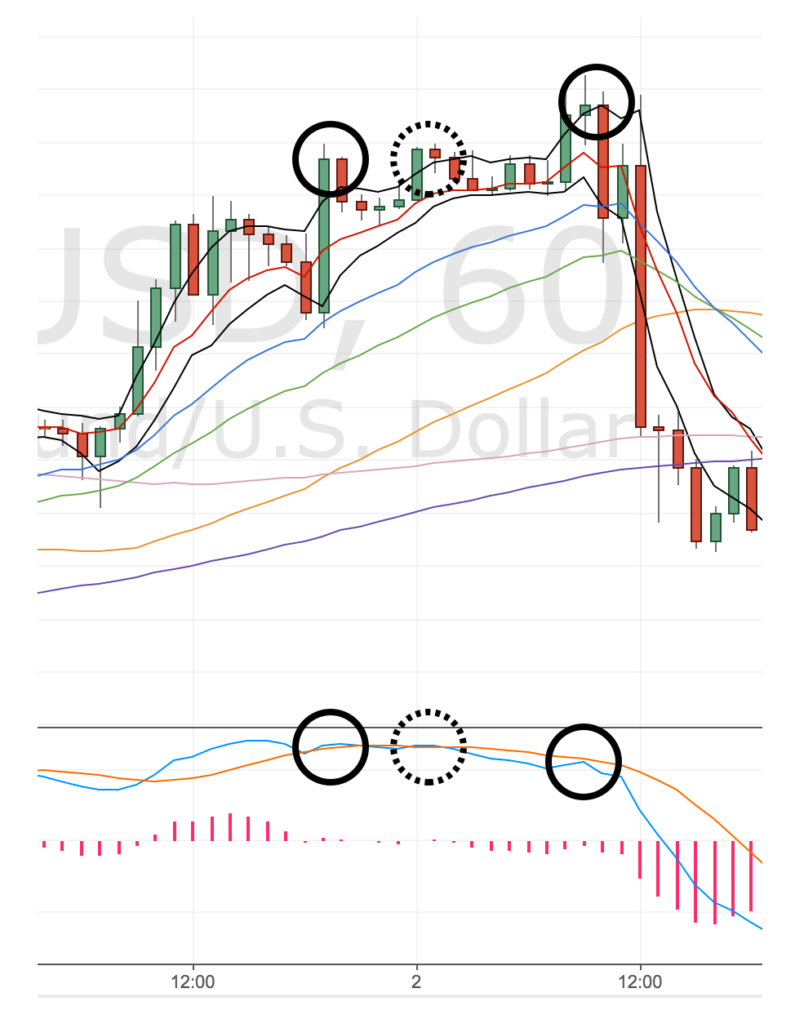
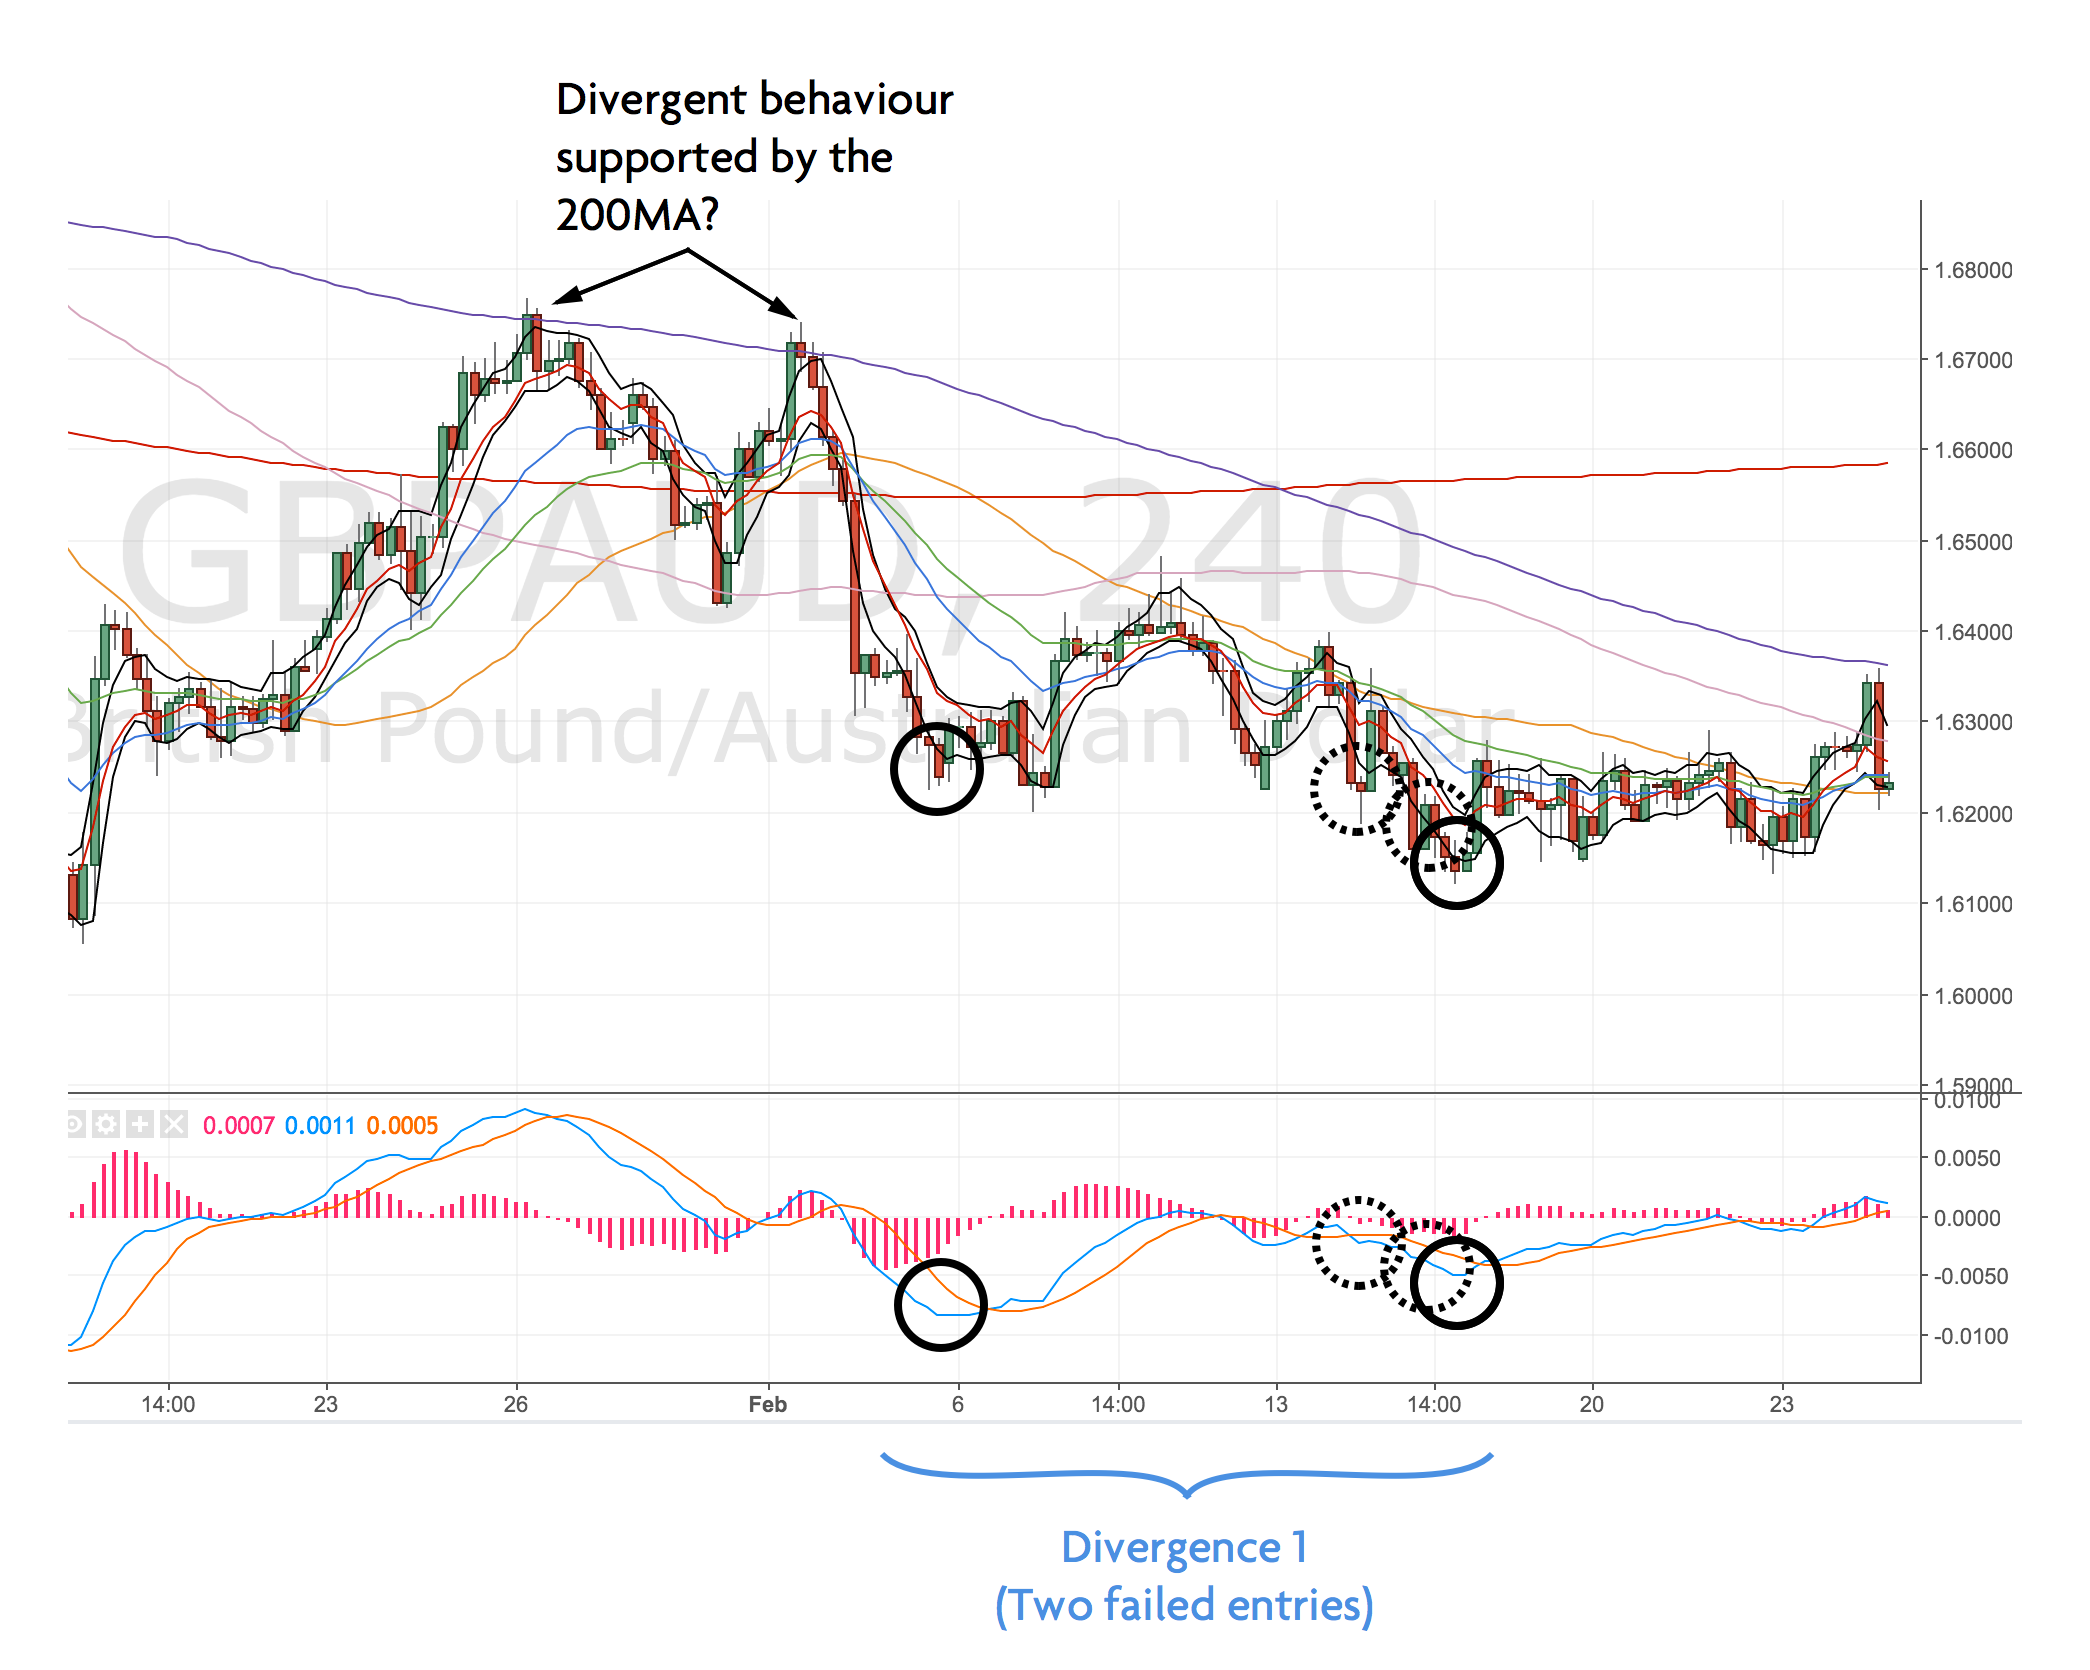
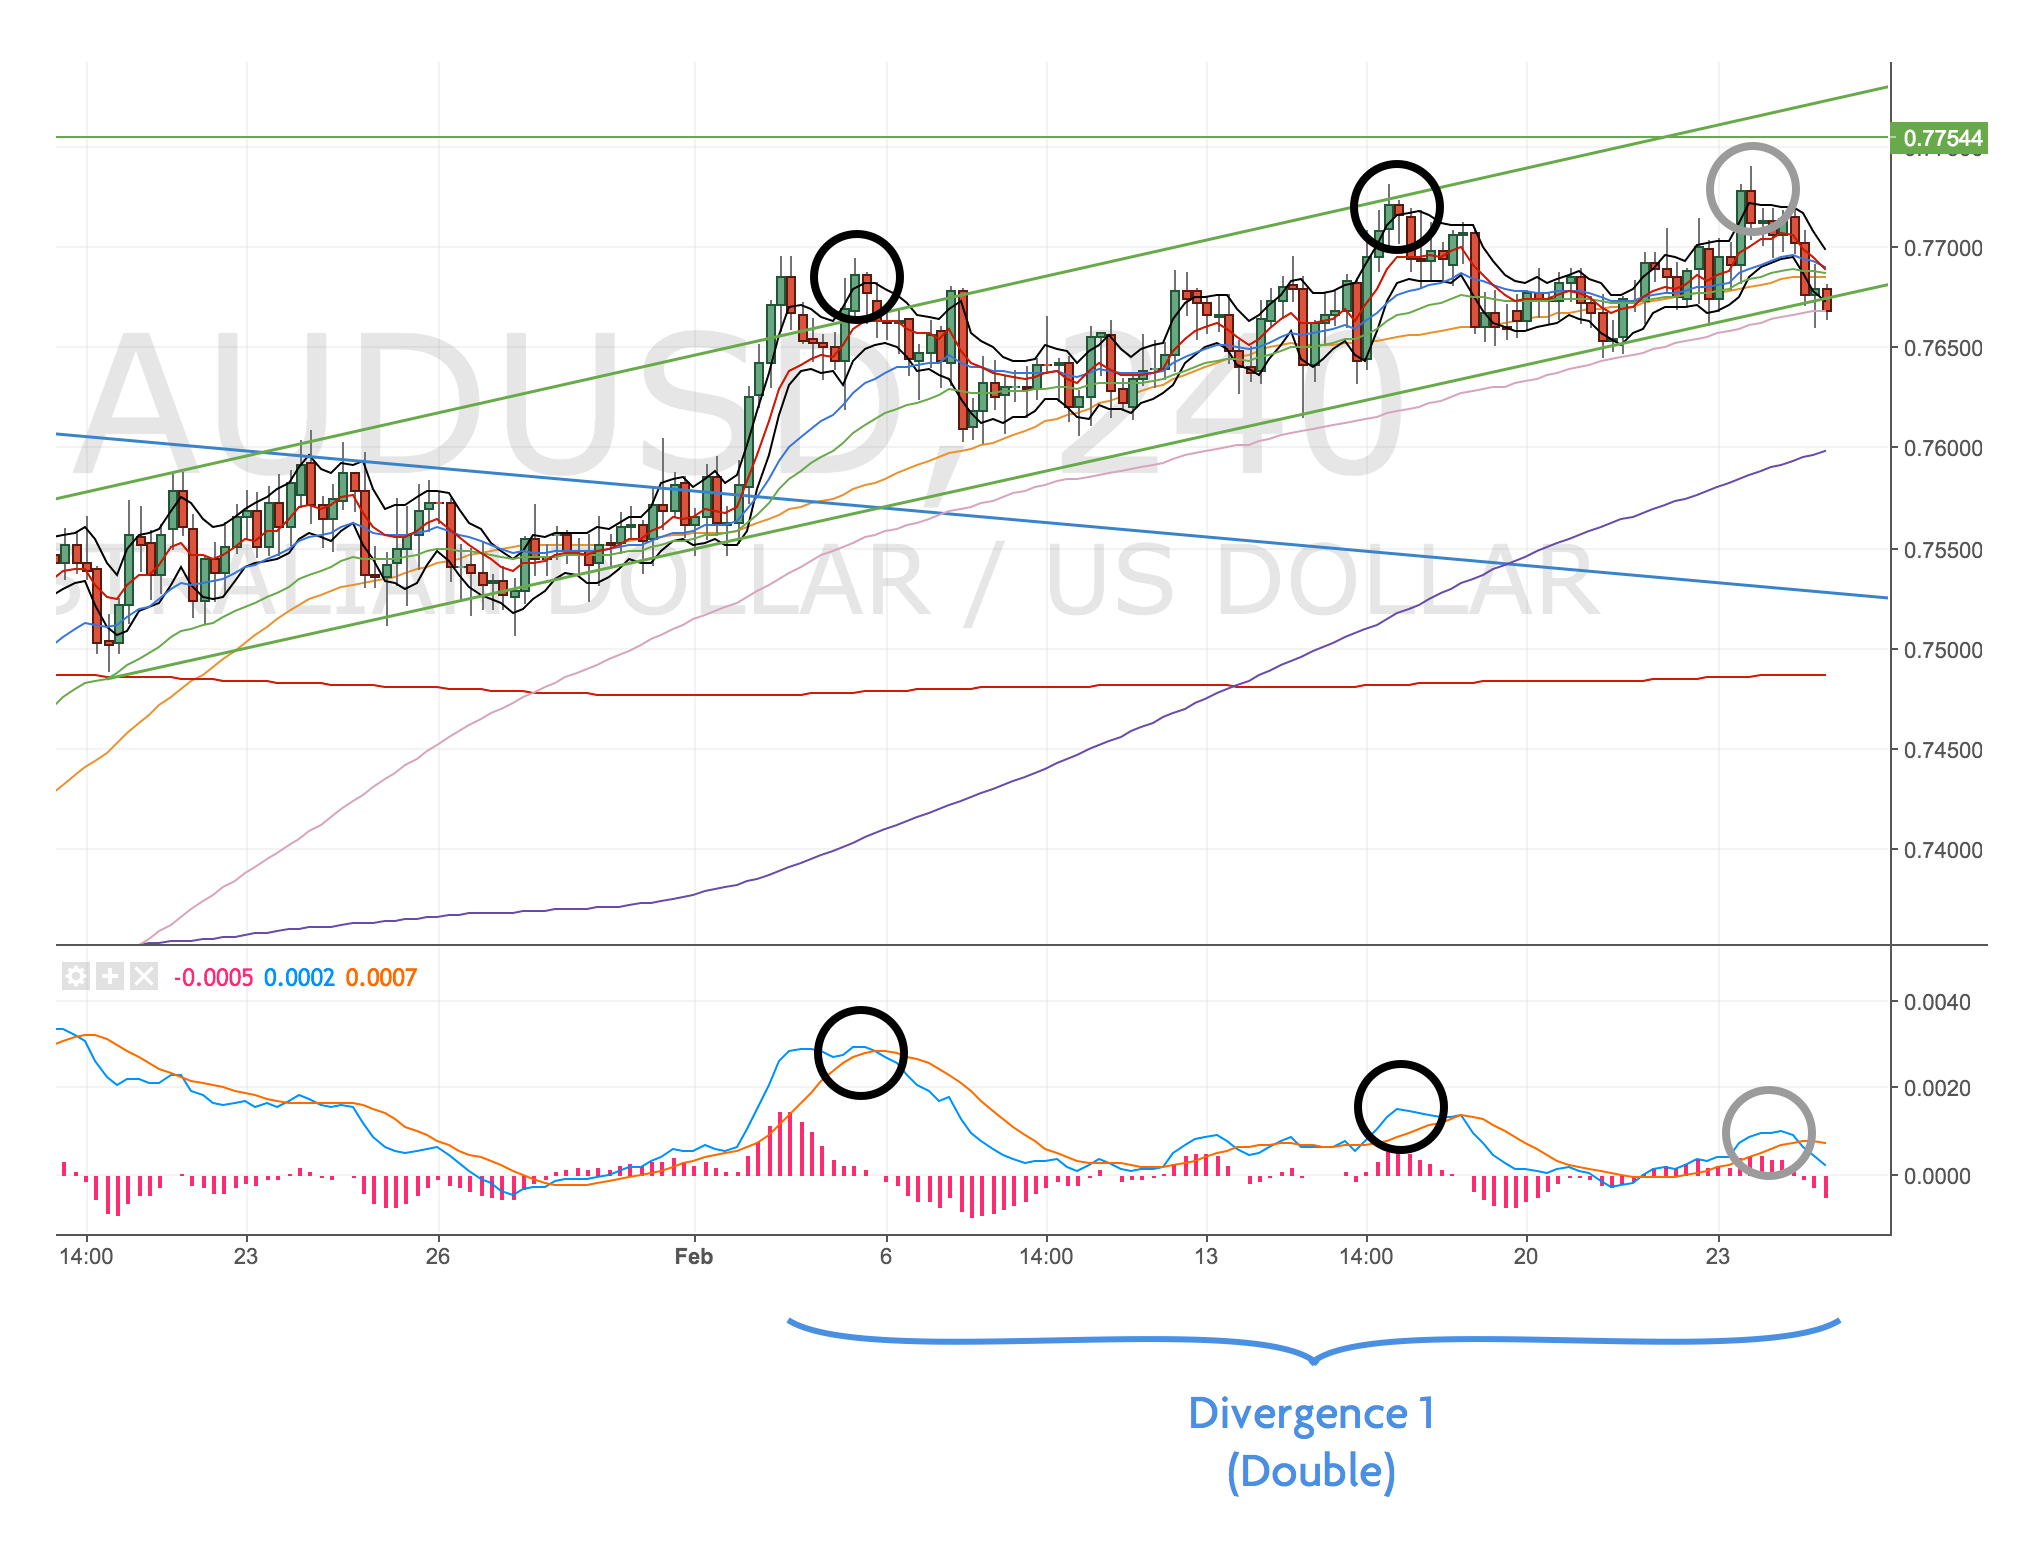
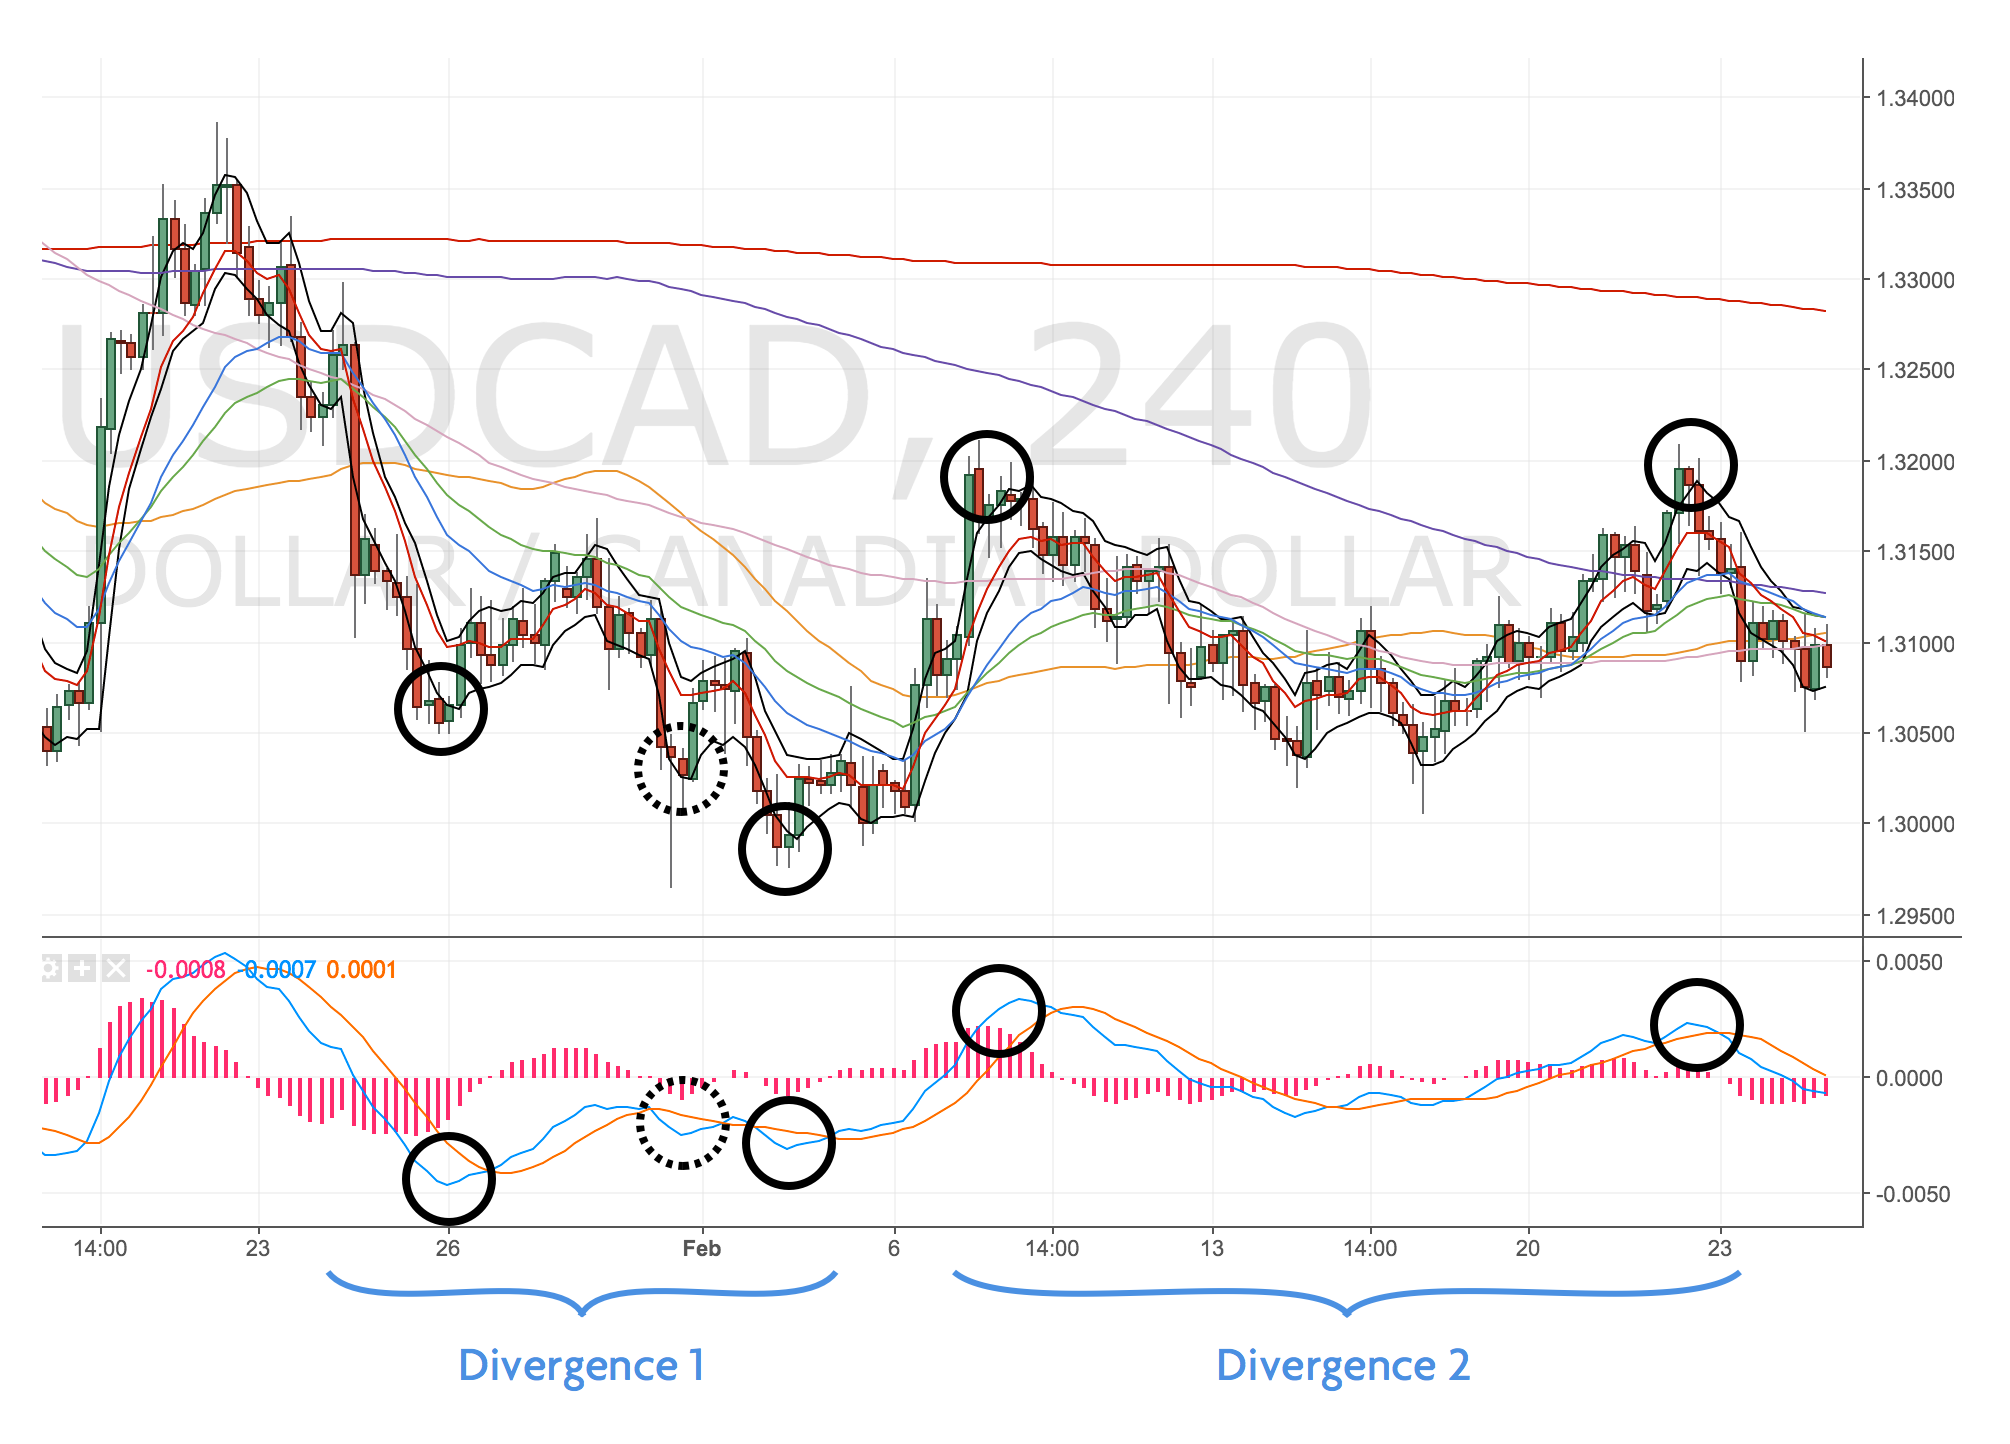
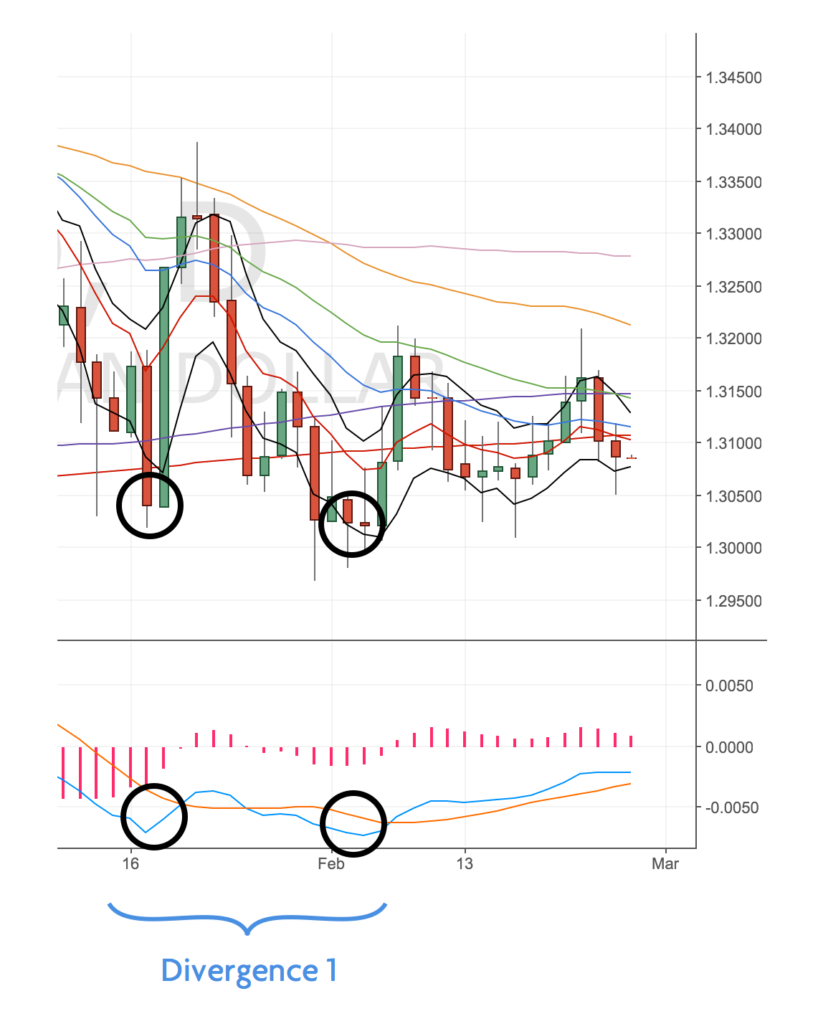
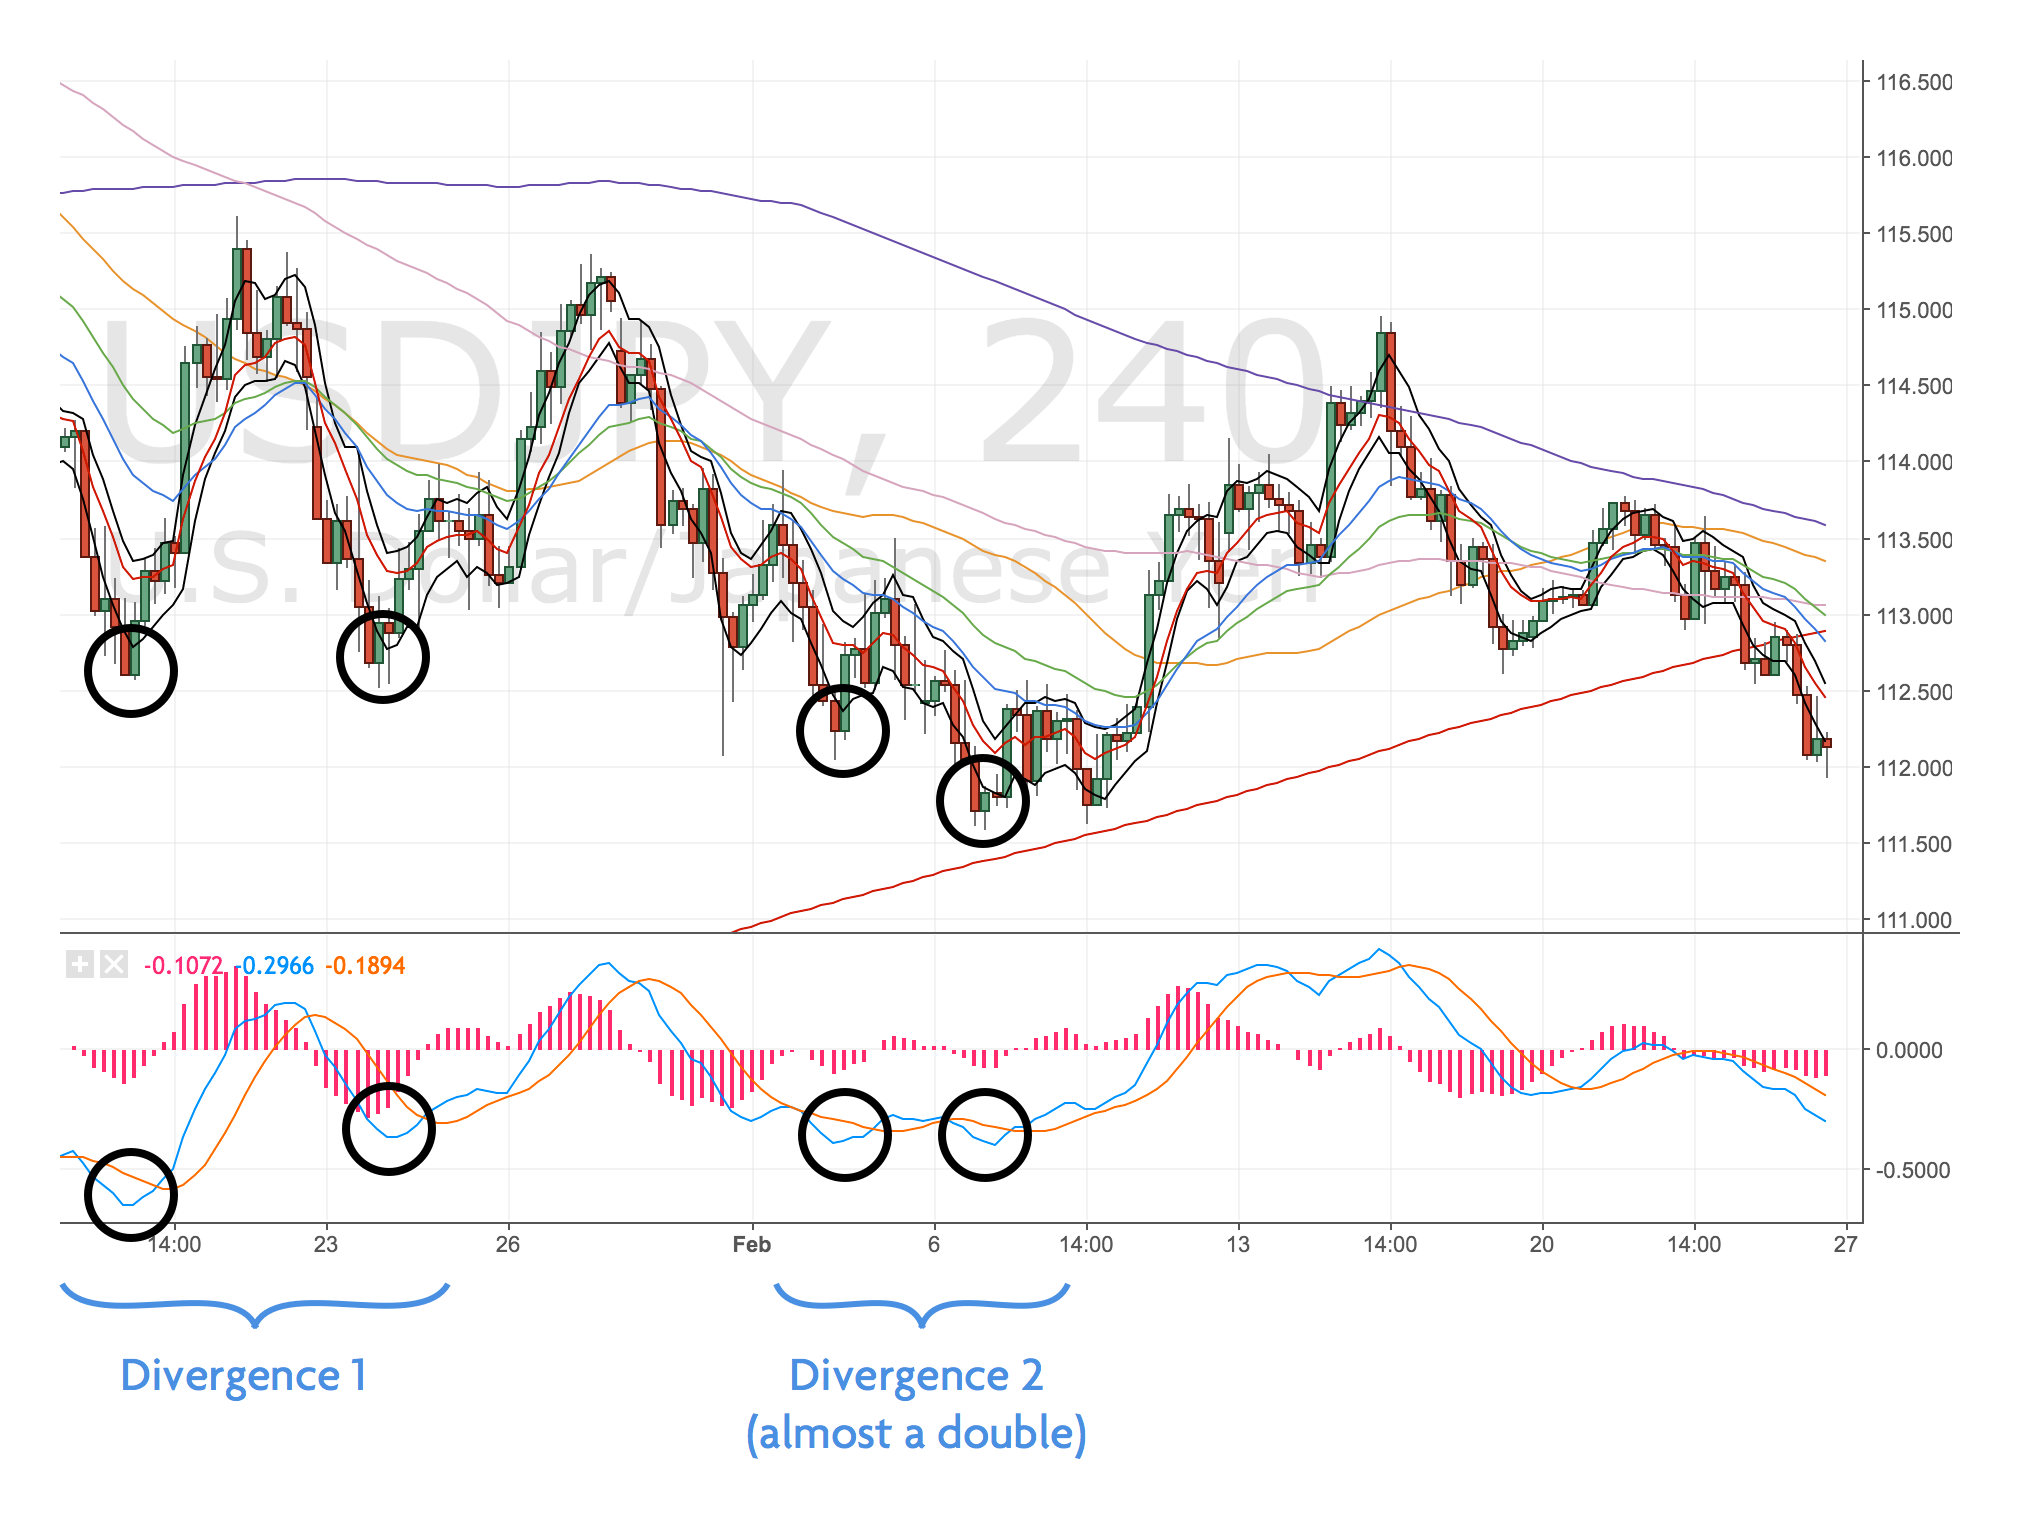
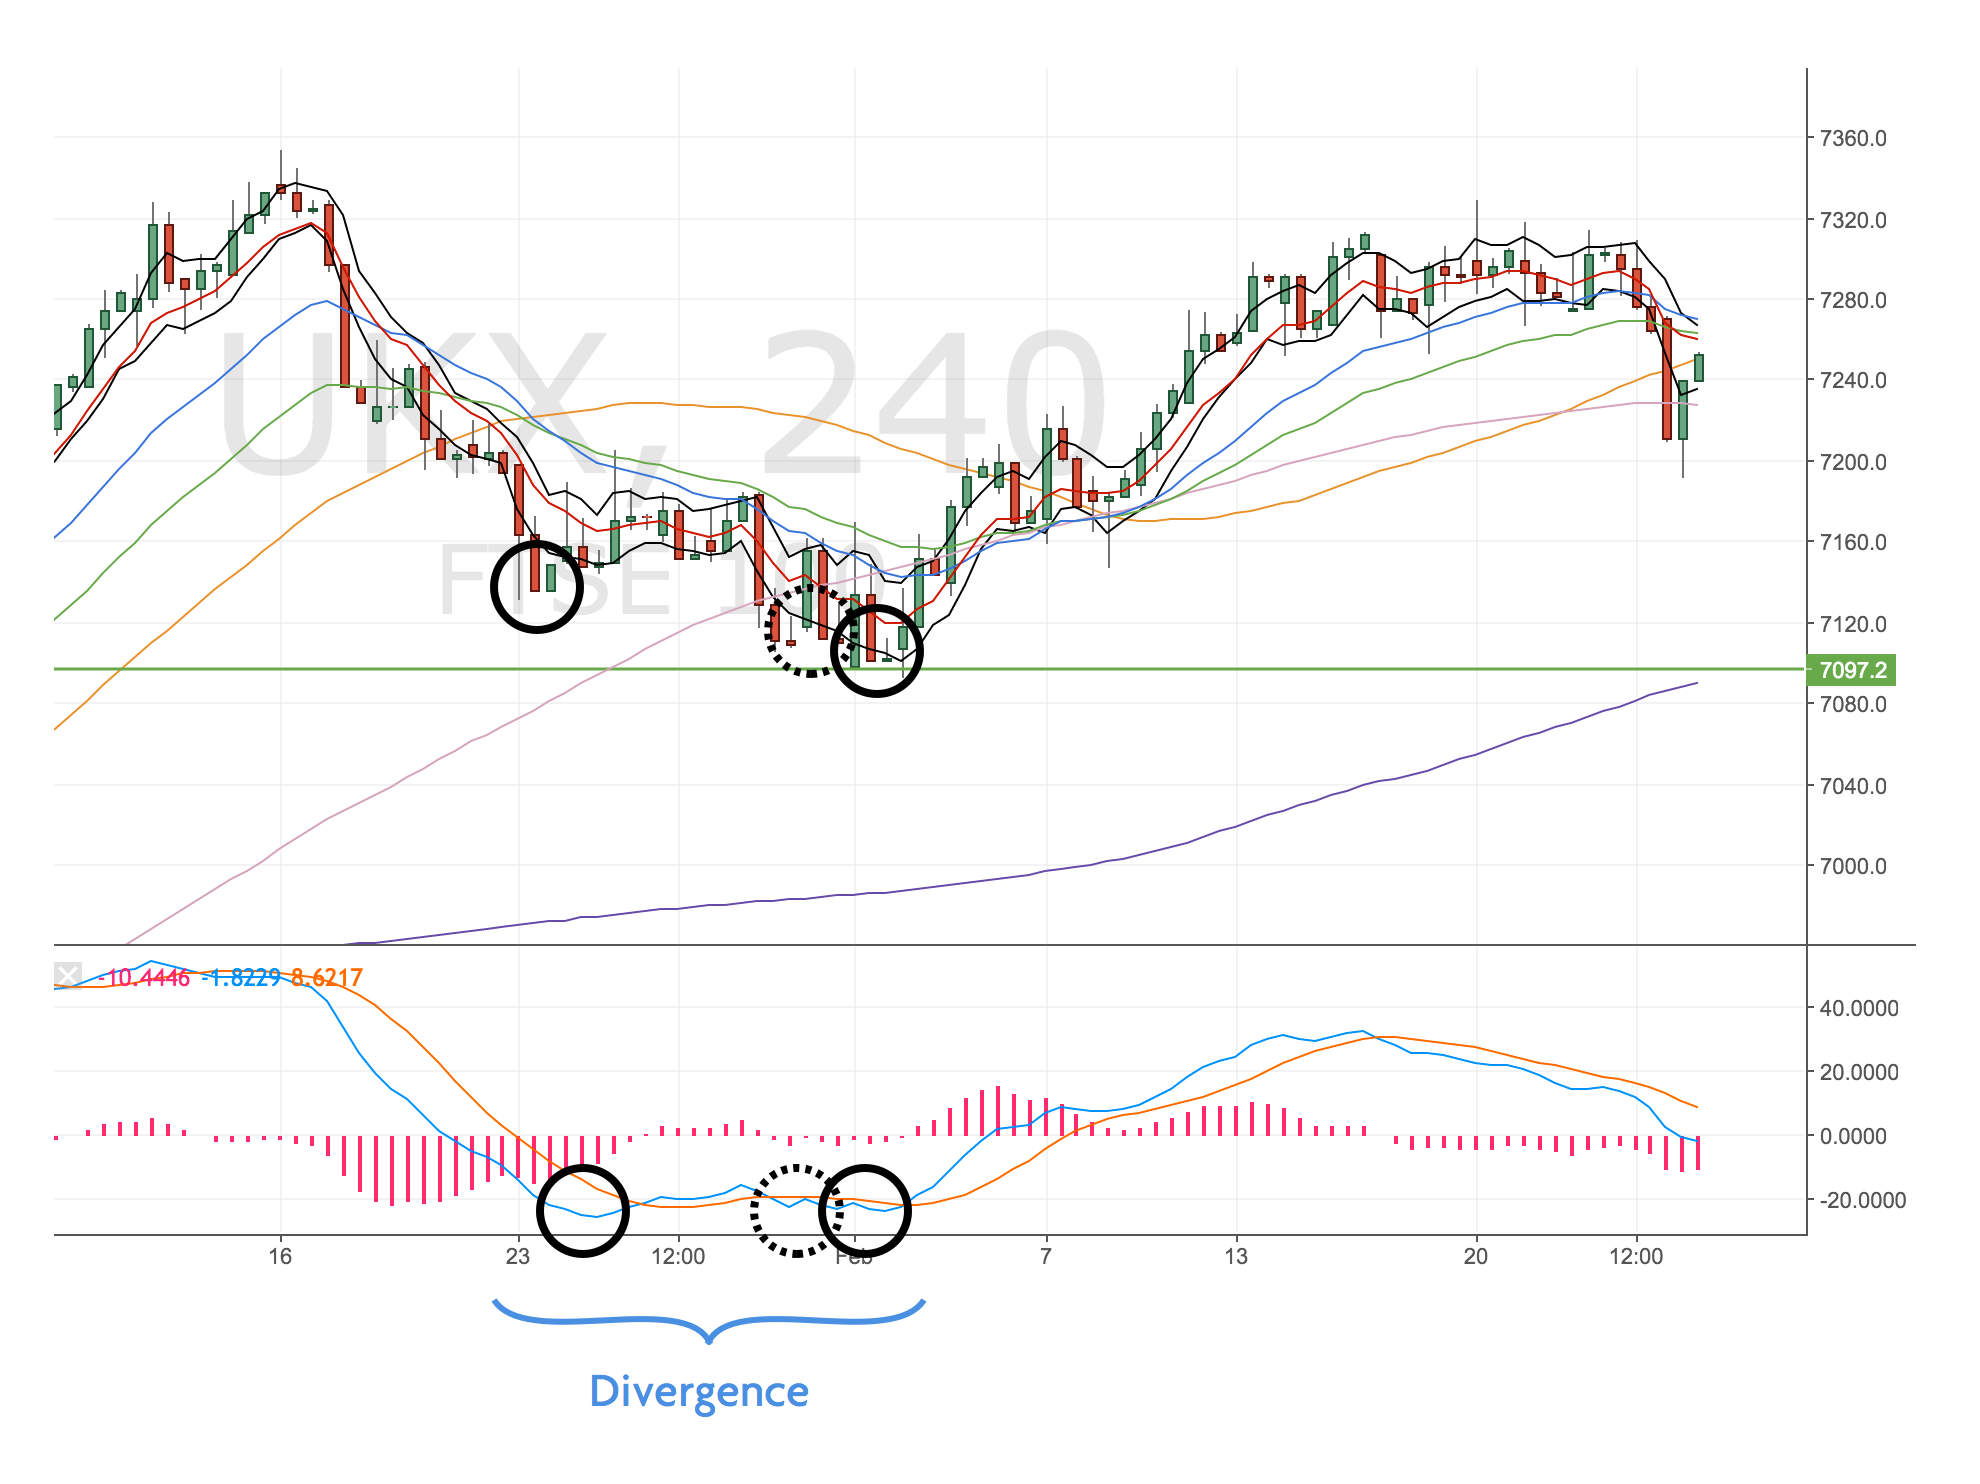
4H Divergence Chart
Double divergence into the trendline confirmed on the 1H chart.
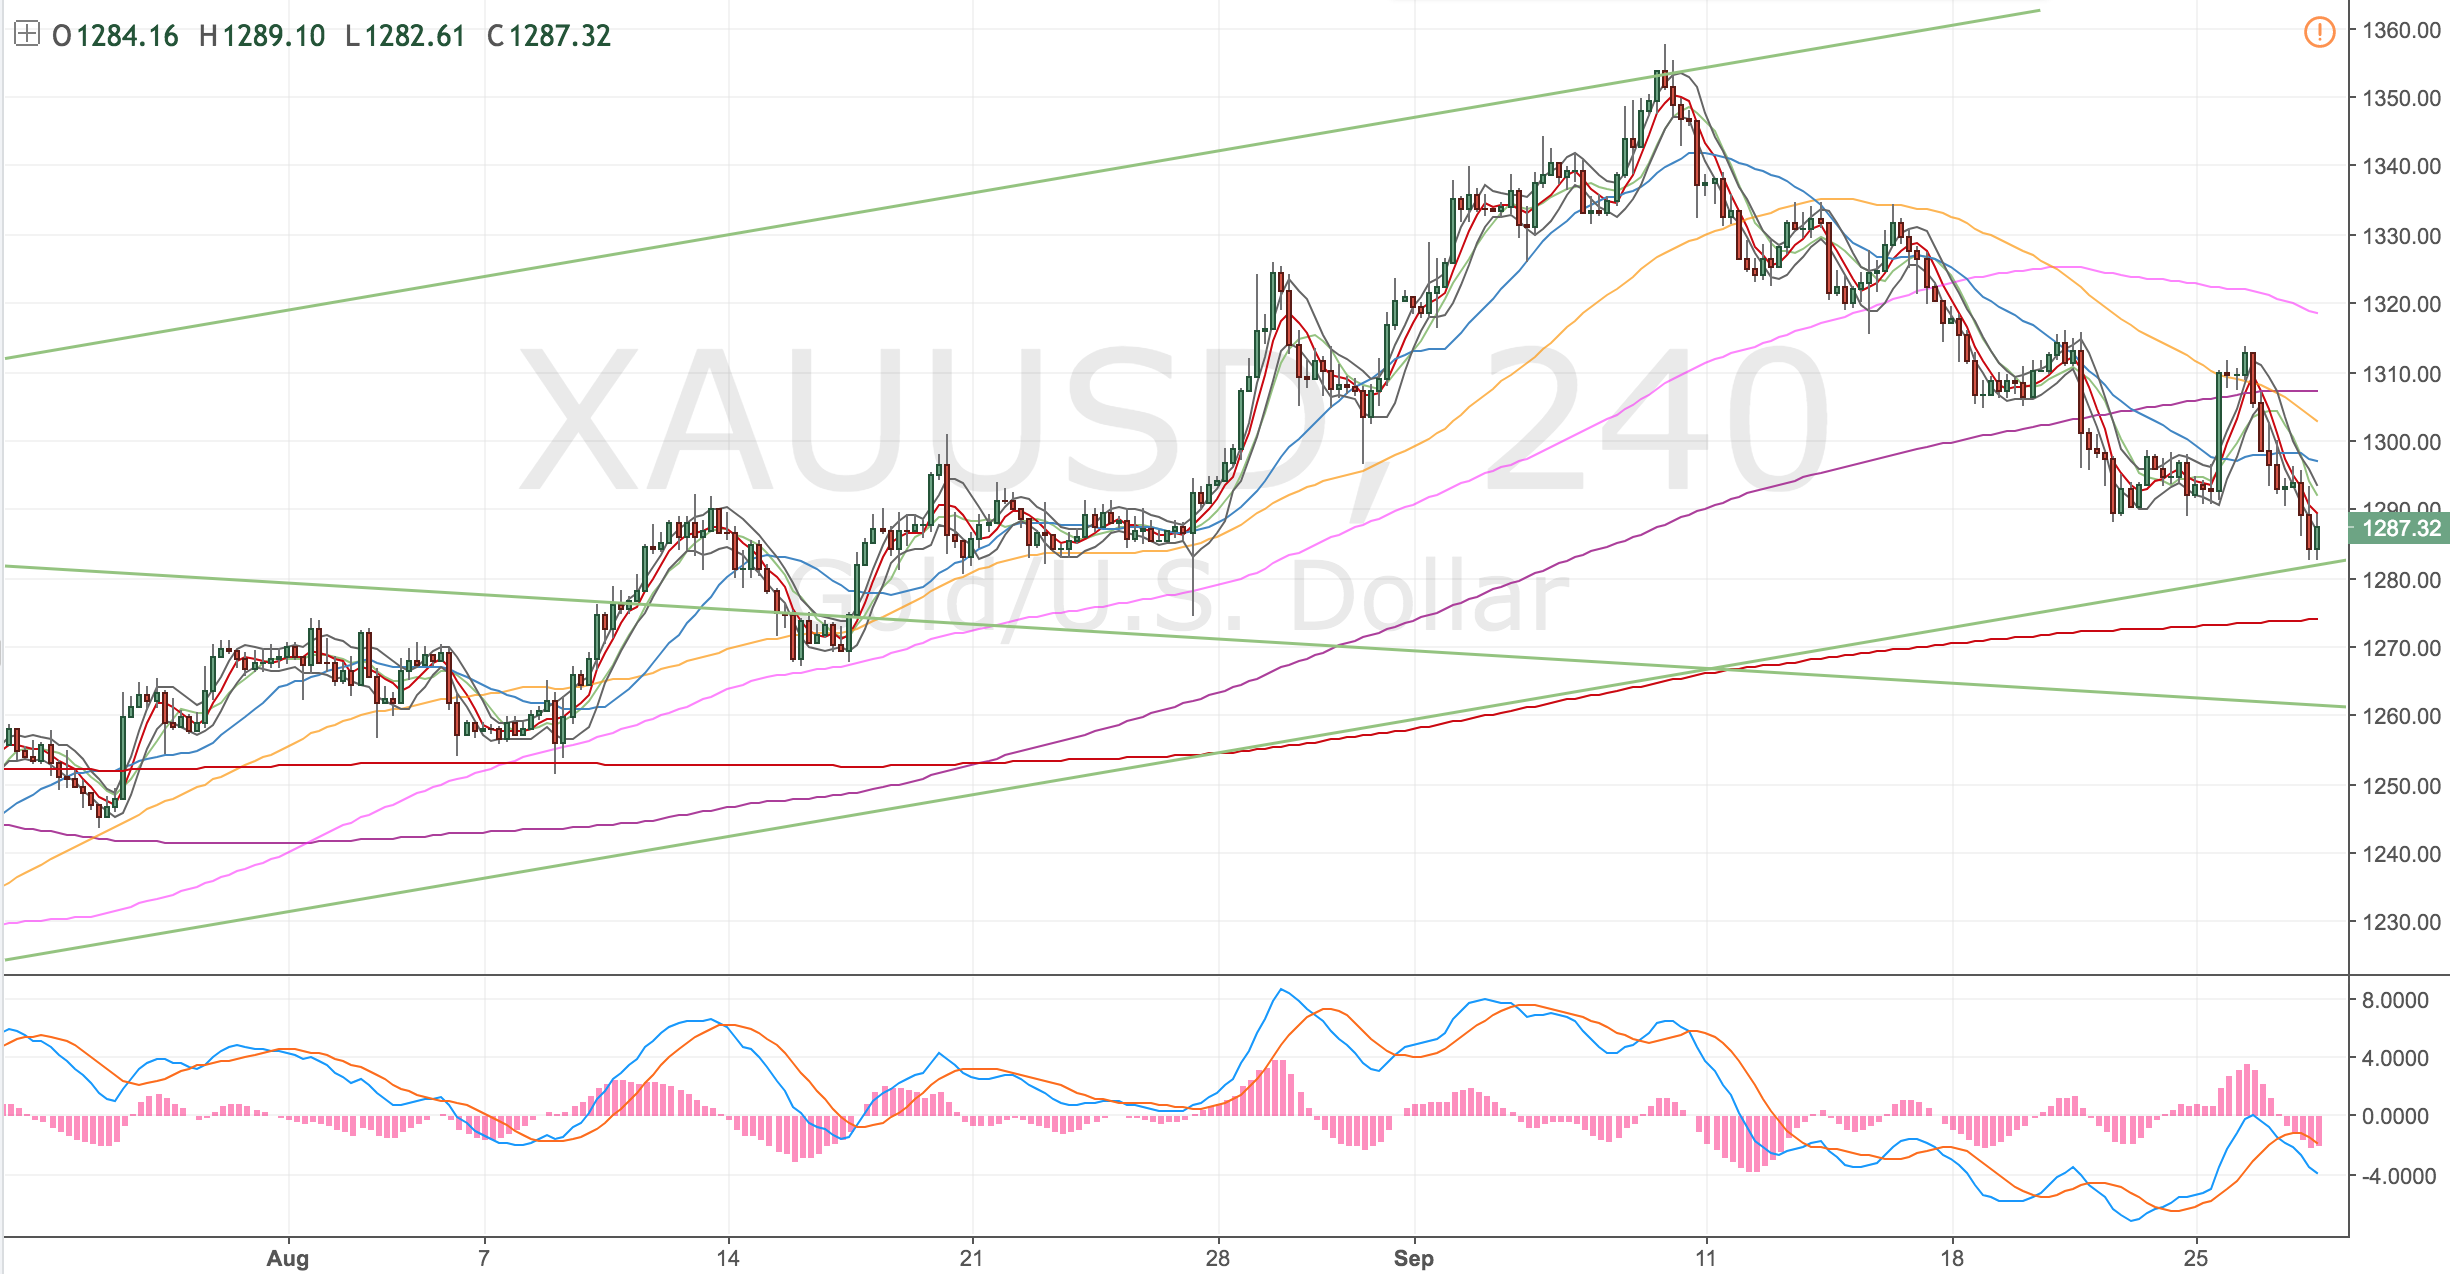
Gold 4H Chart – 27 Sep 17
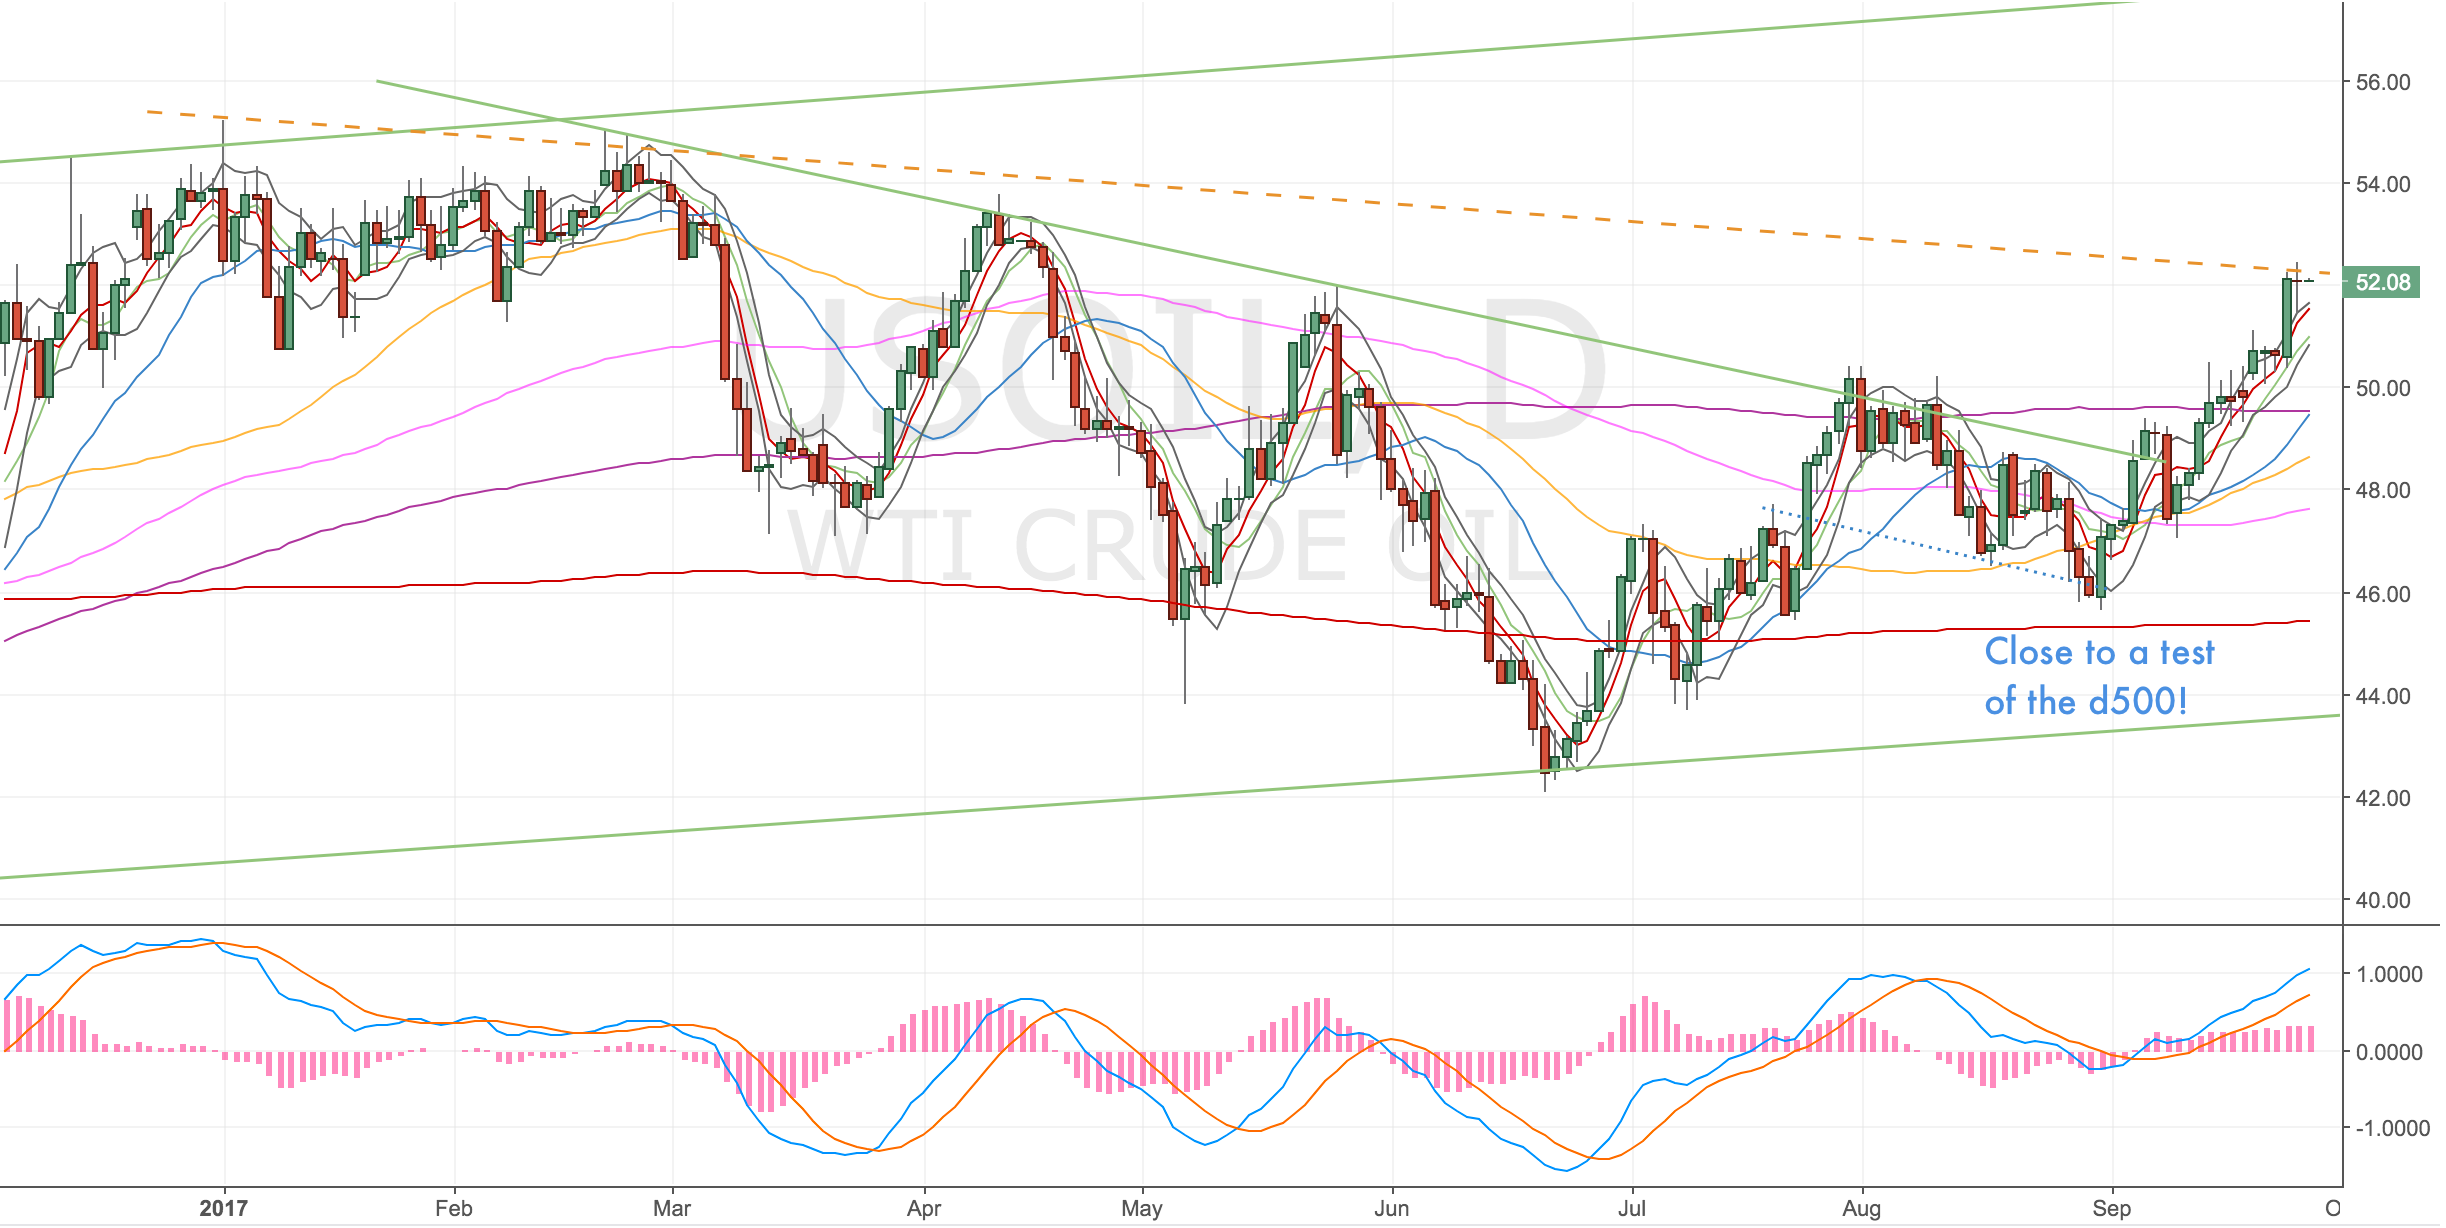
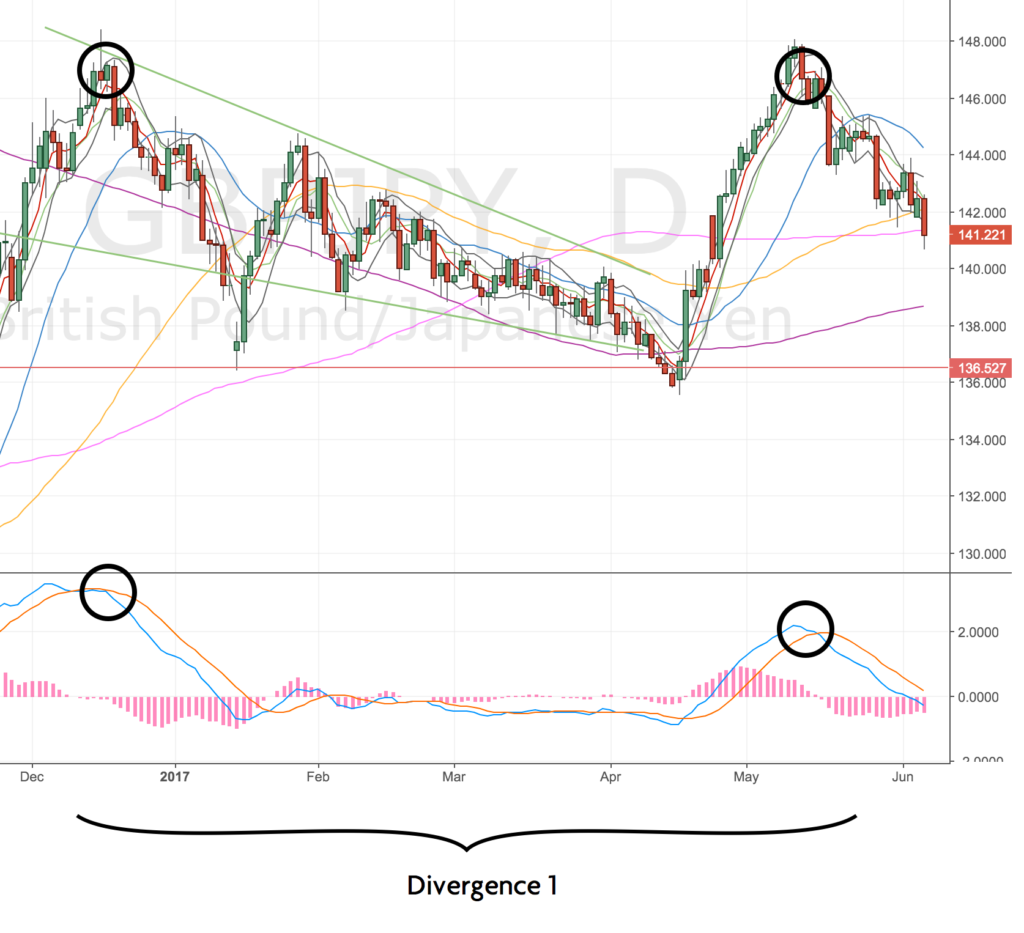
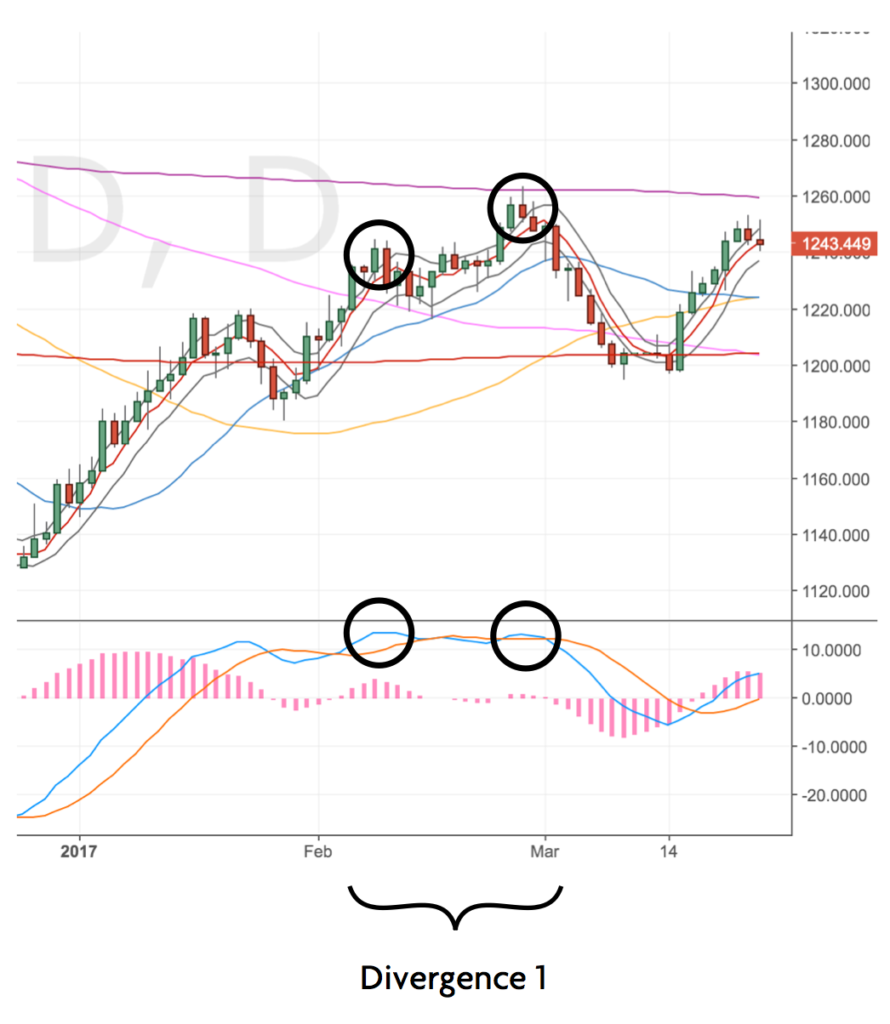
Daily Chart
Not much to report here.
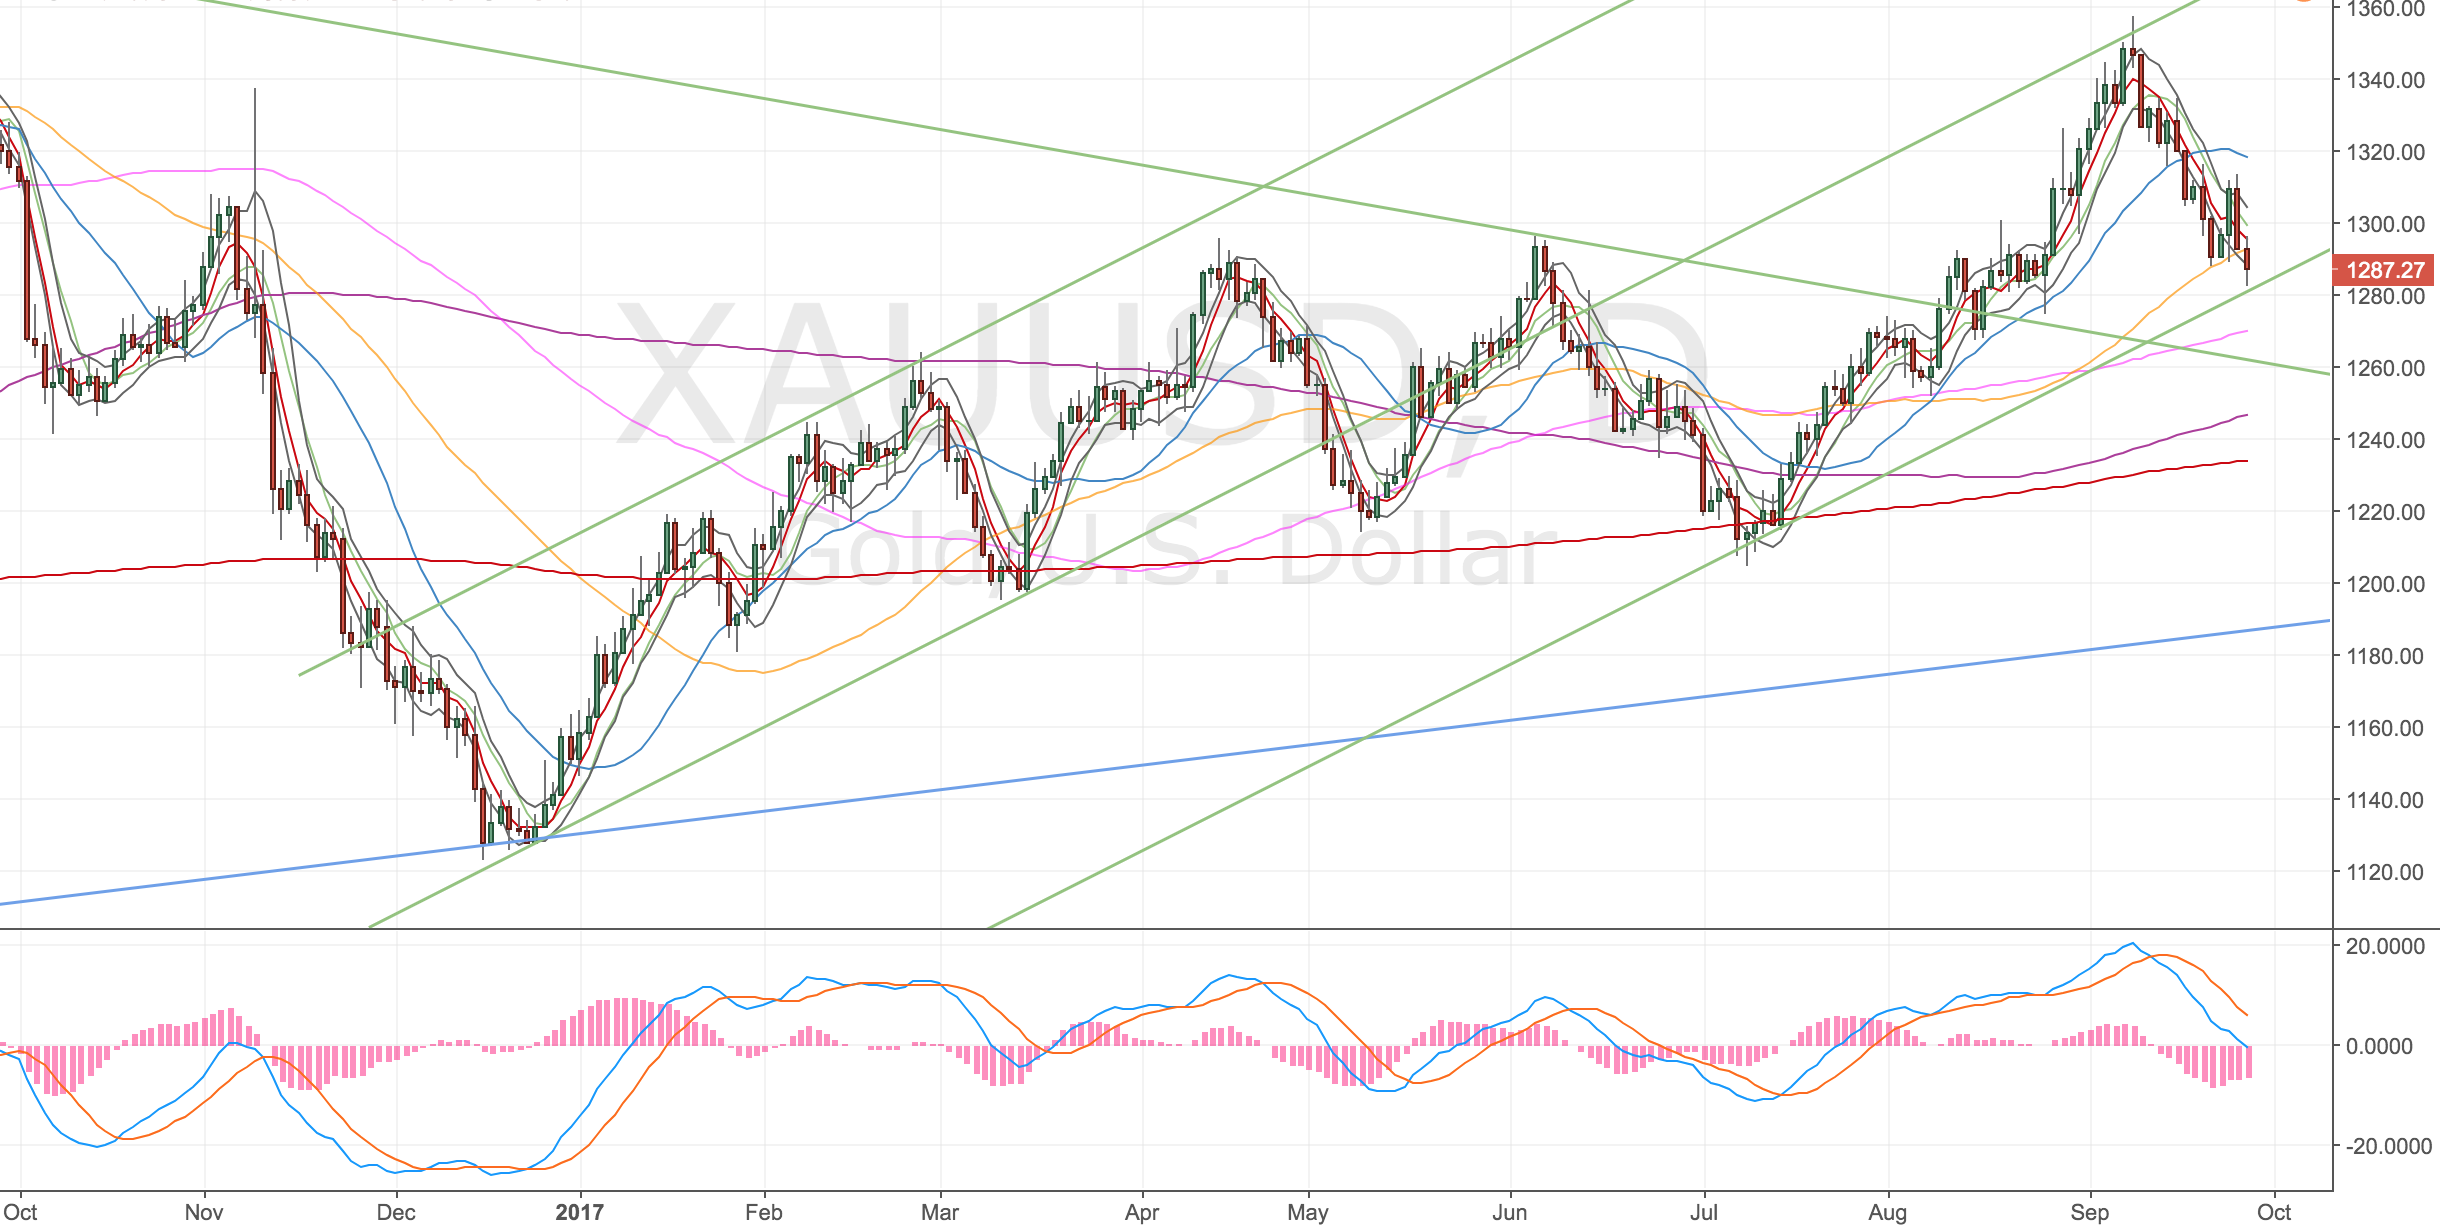
Gold Daily Chart – 27 Sep 17
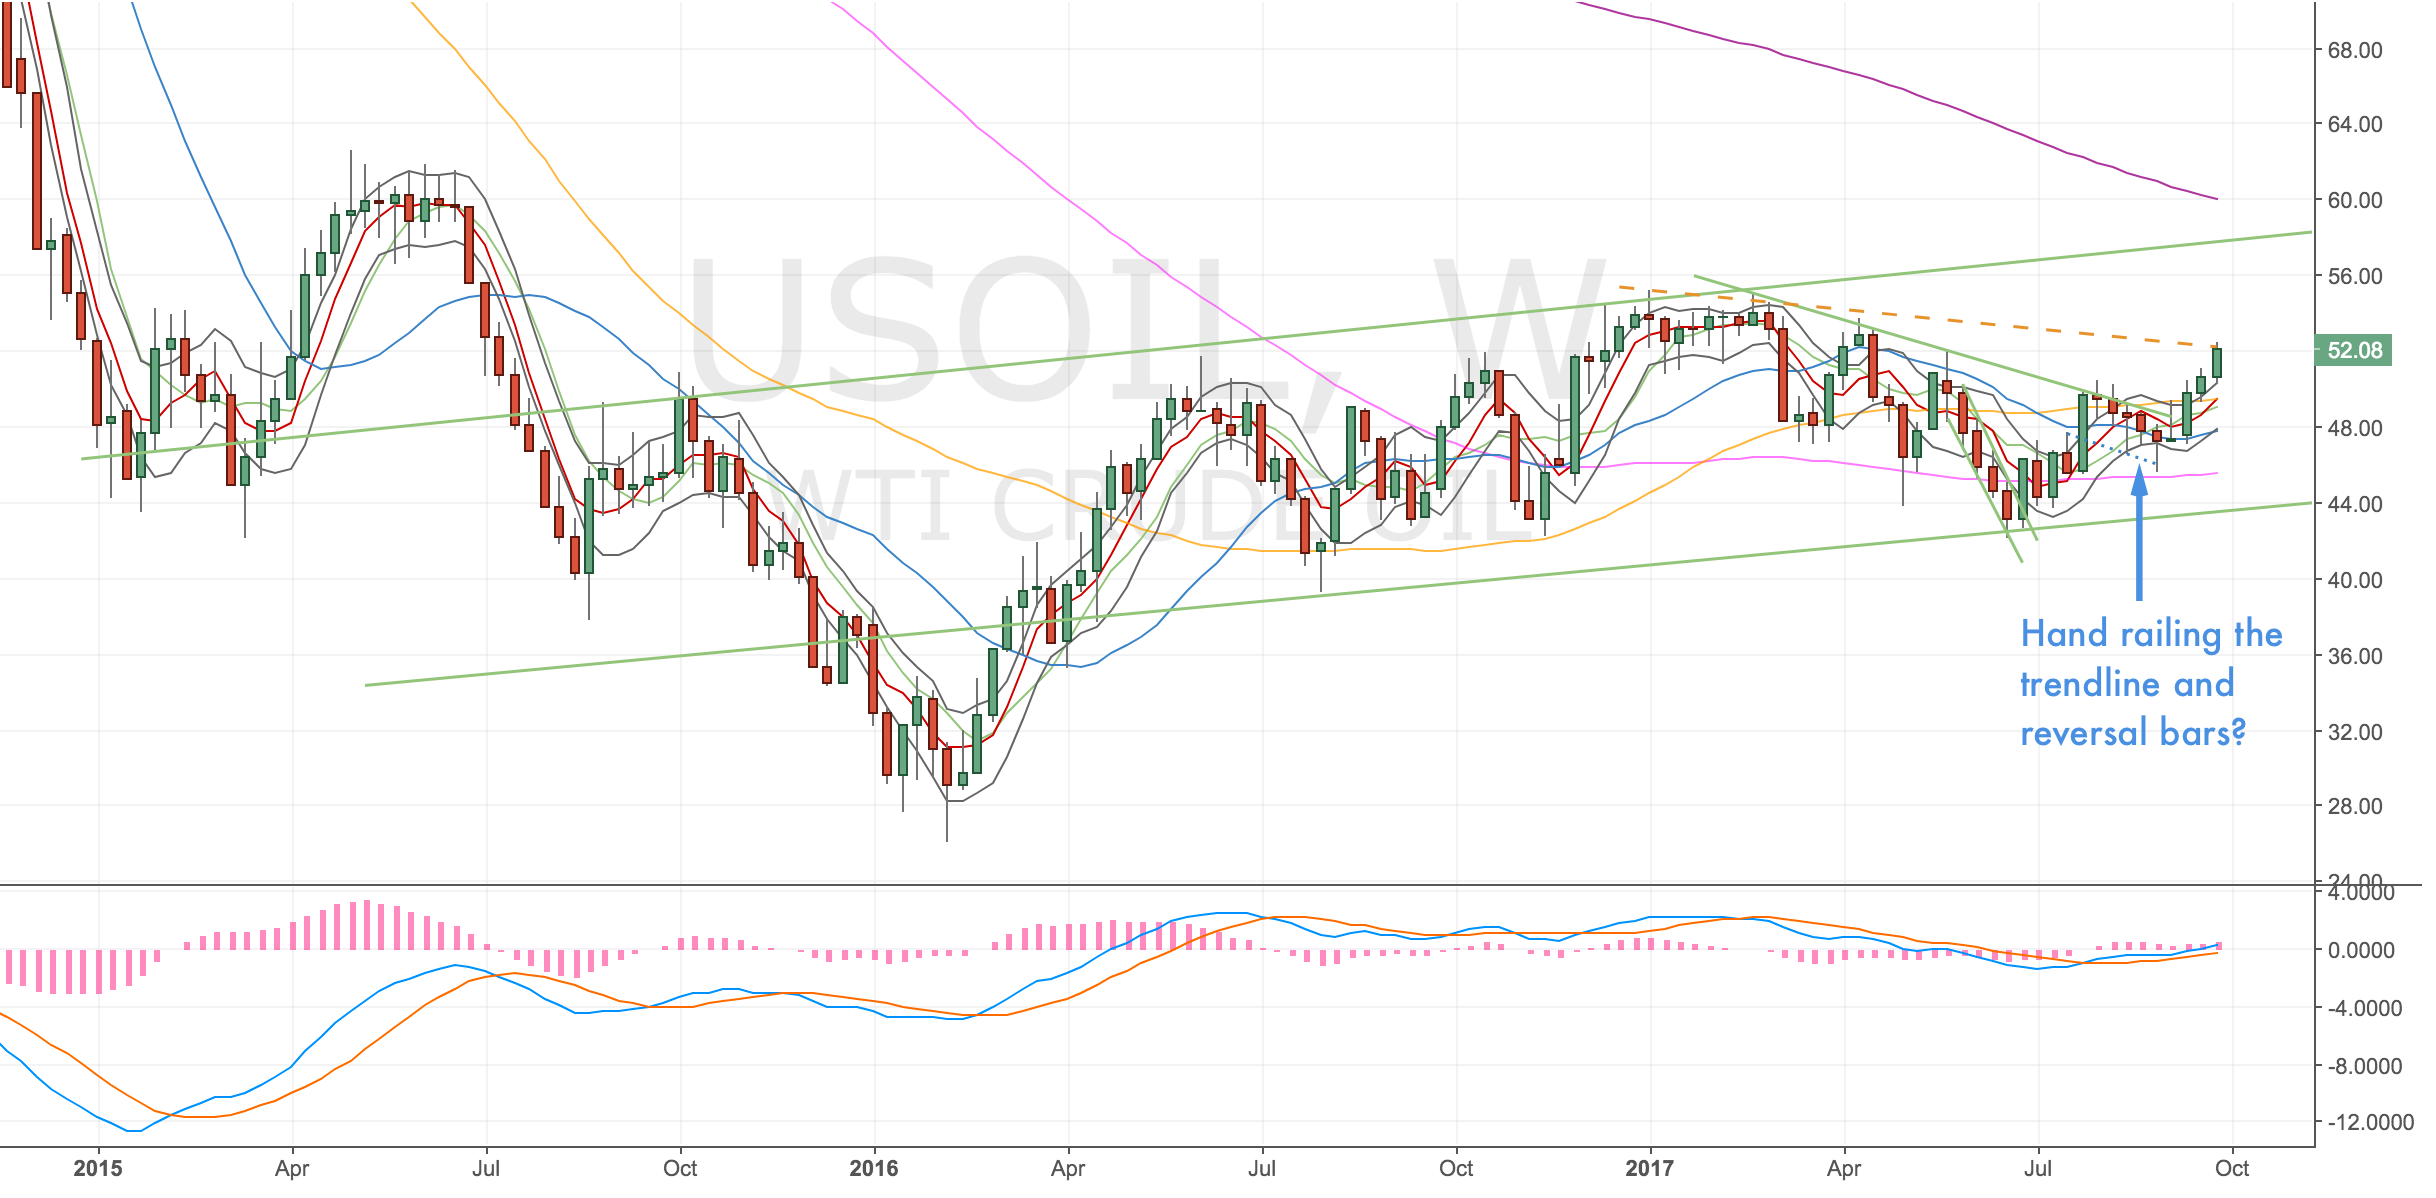
Weekly Chart
Same – not much going on.
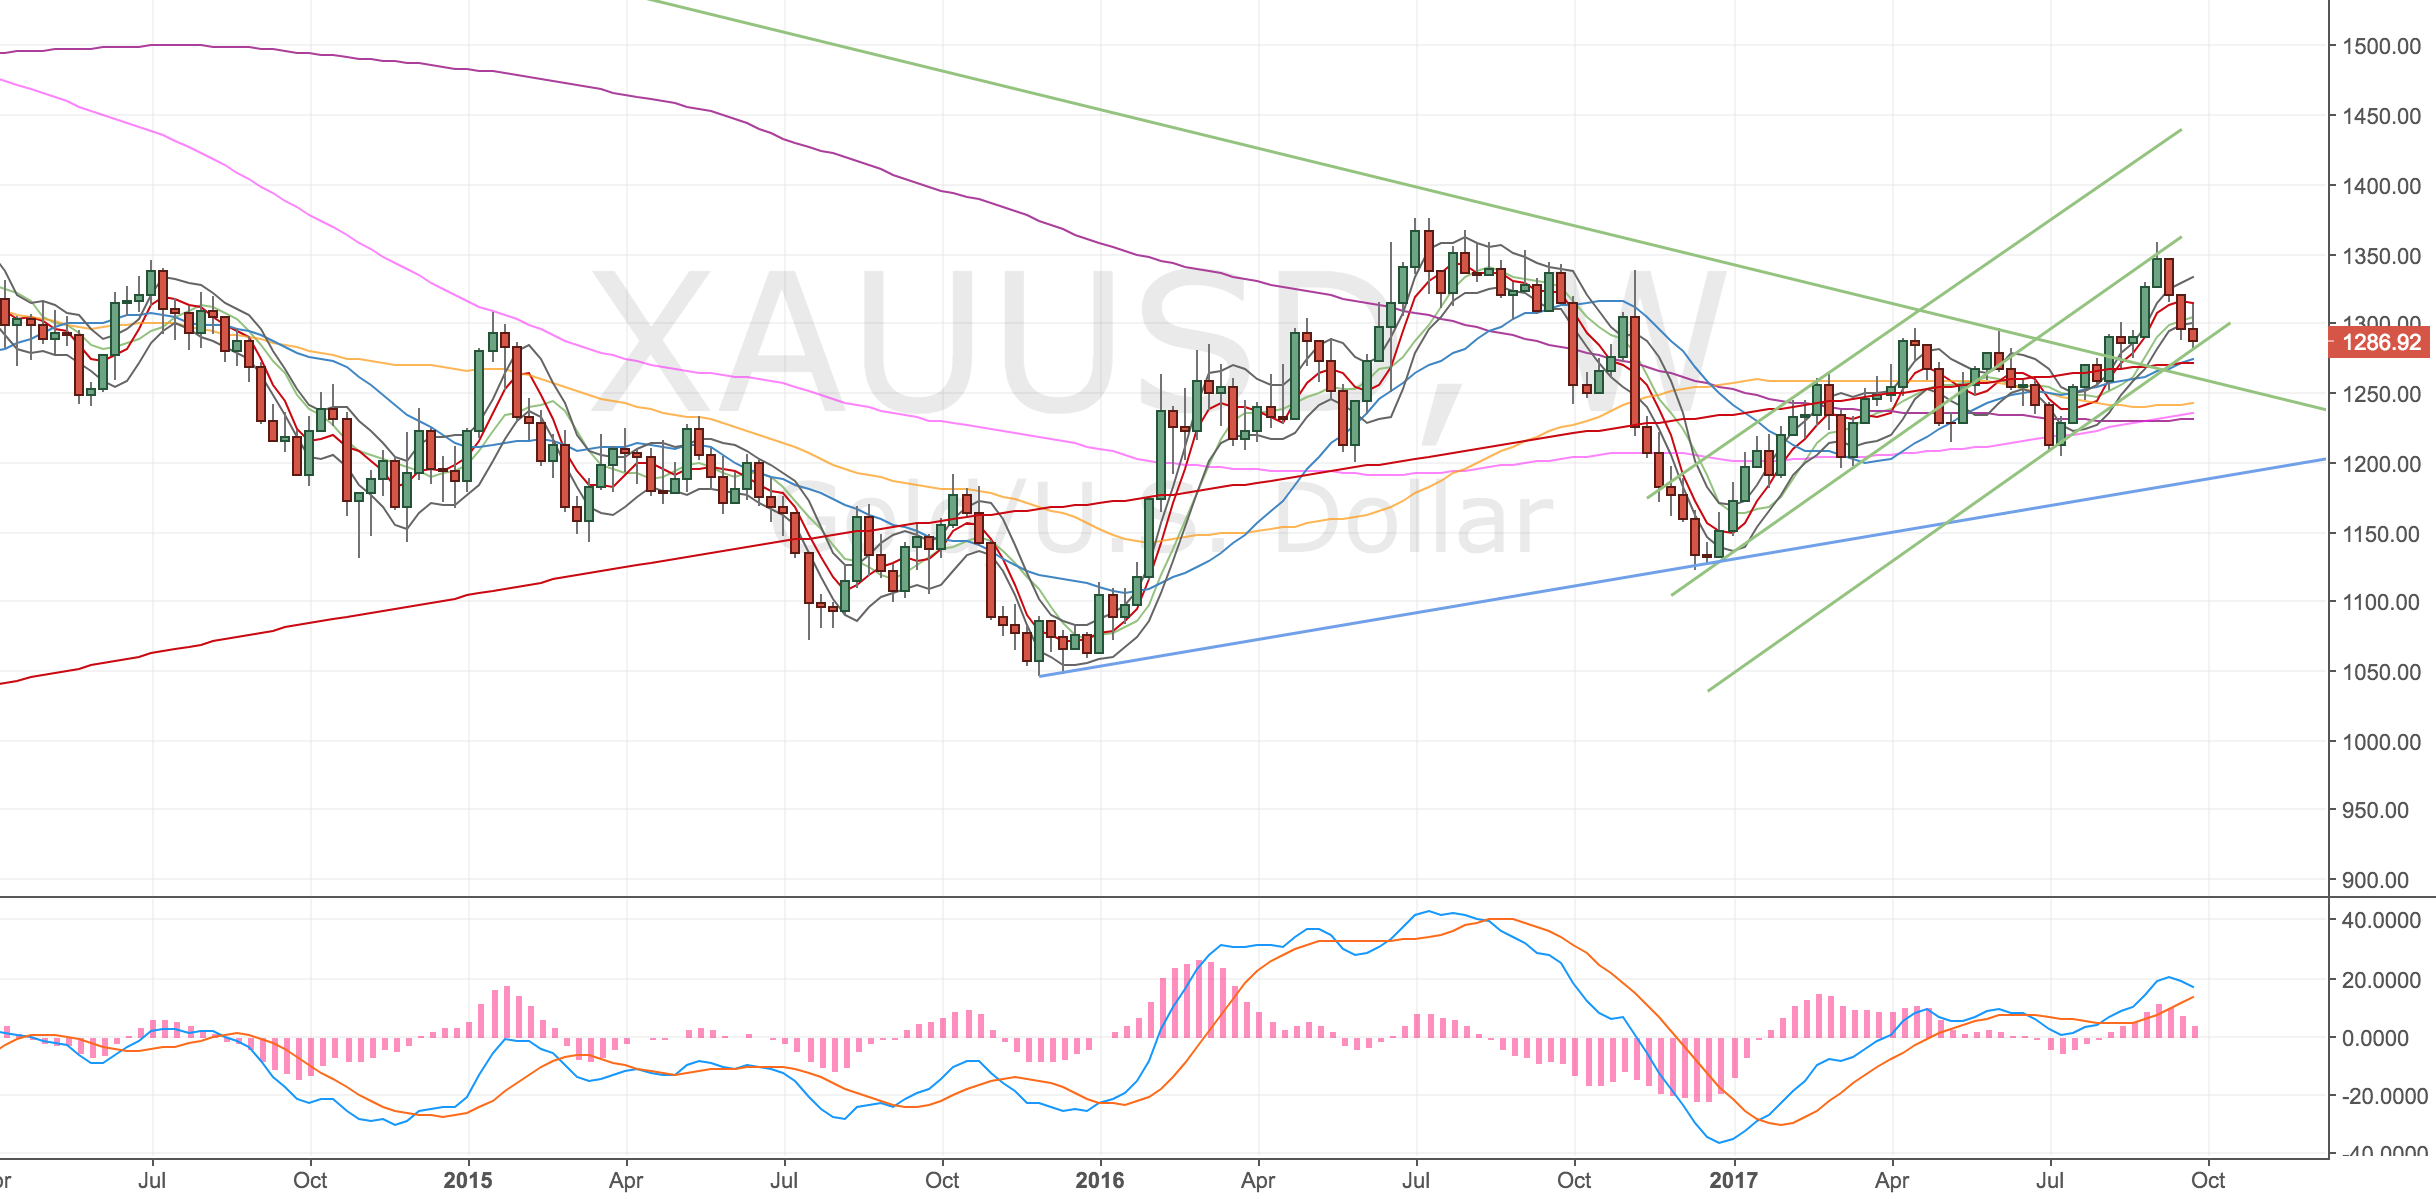
Gold Weekly Chart – 27 Sep 17
Monthly Chart
Run into w100.
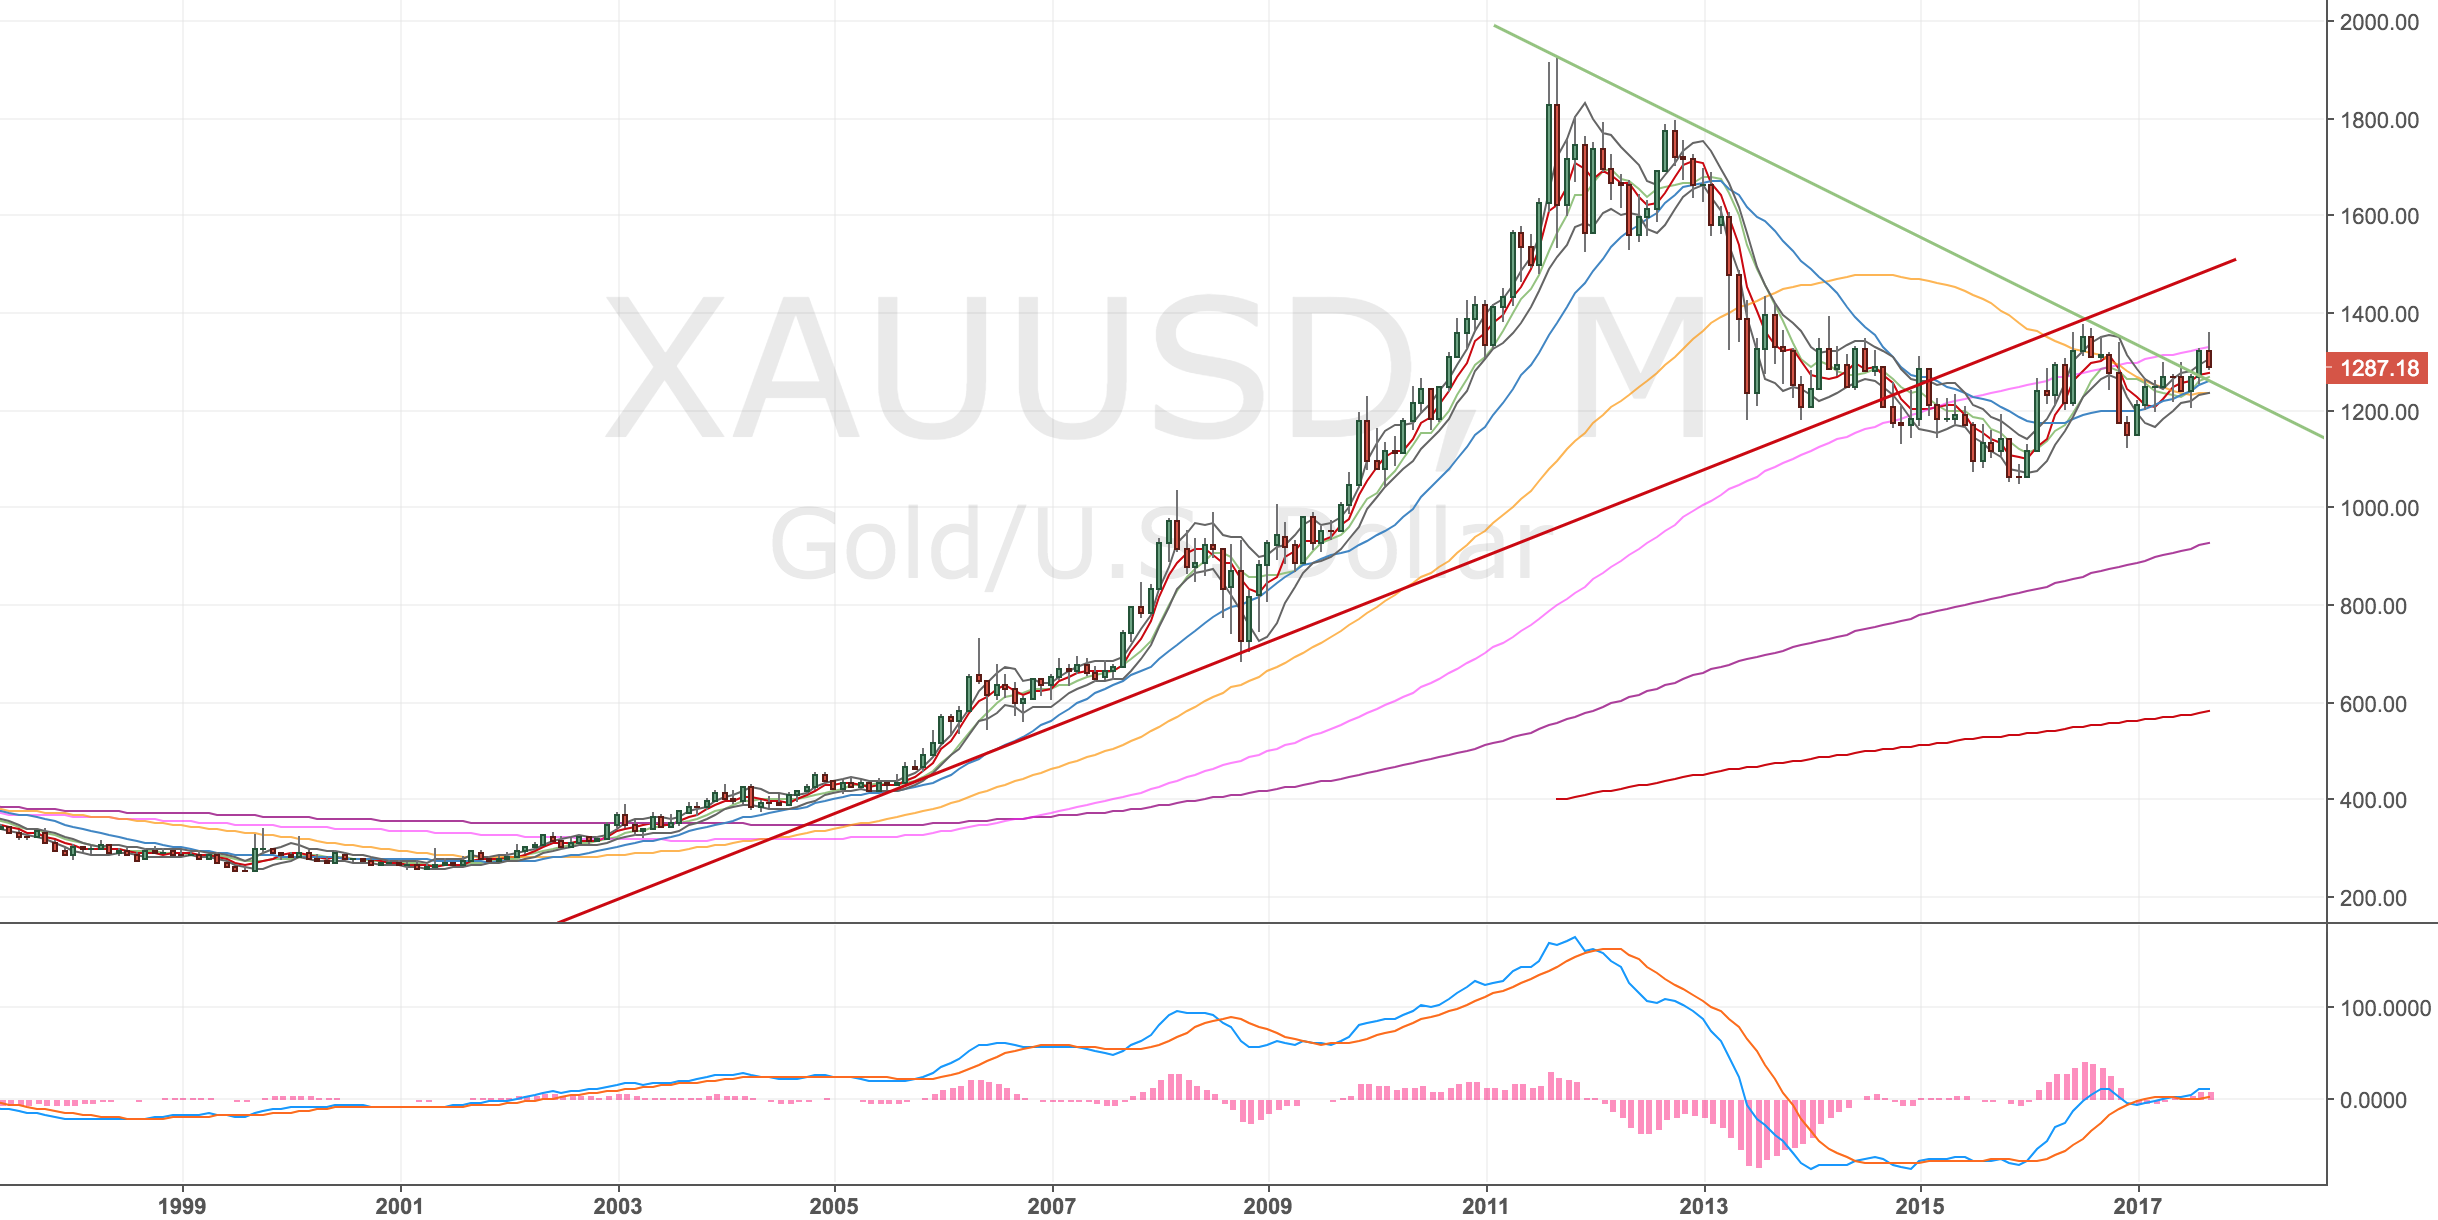
Gold Monthly Chart – 27 Sep 17
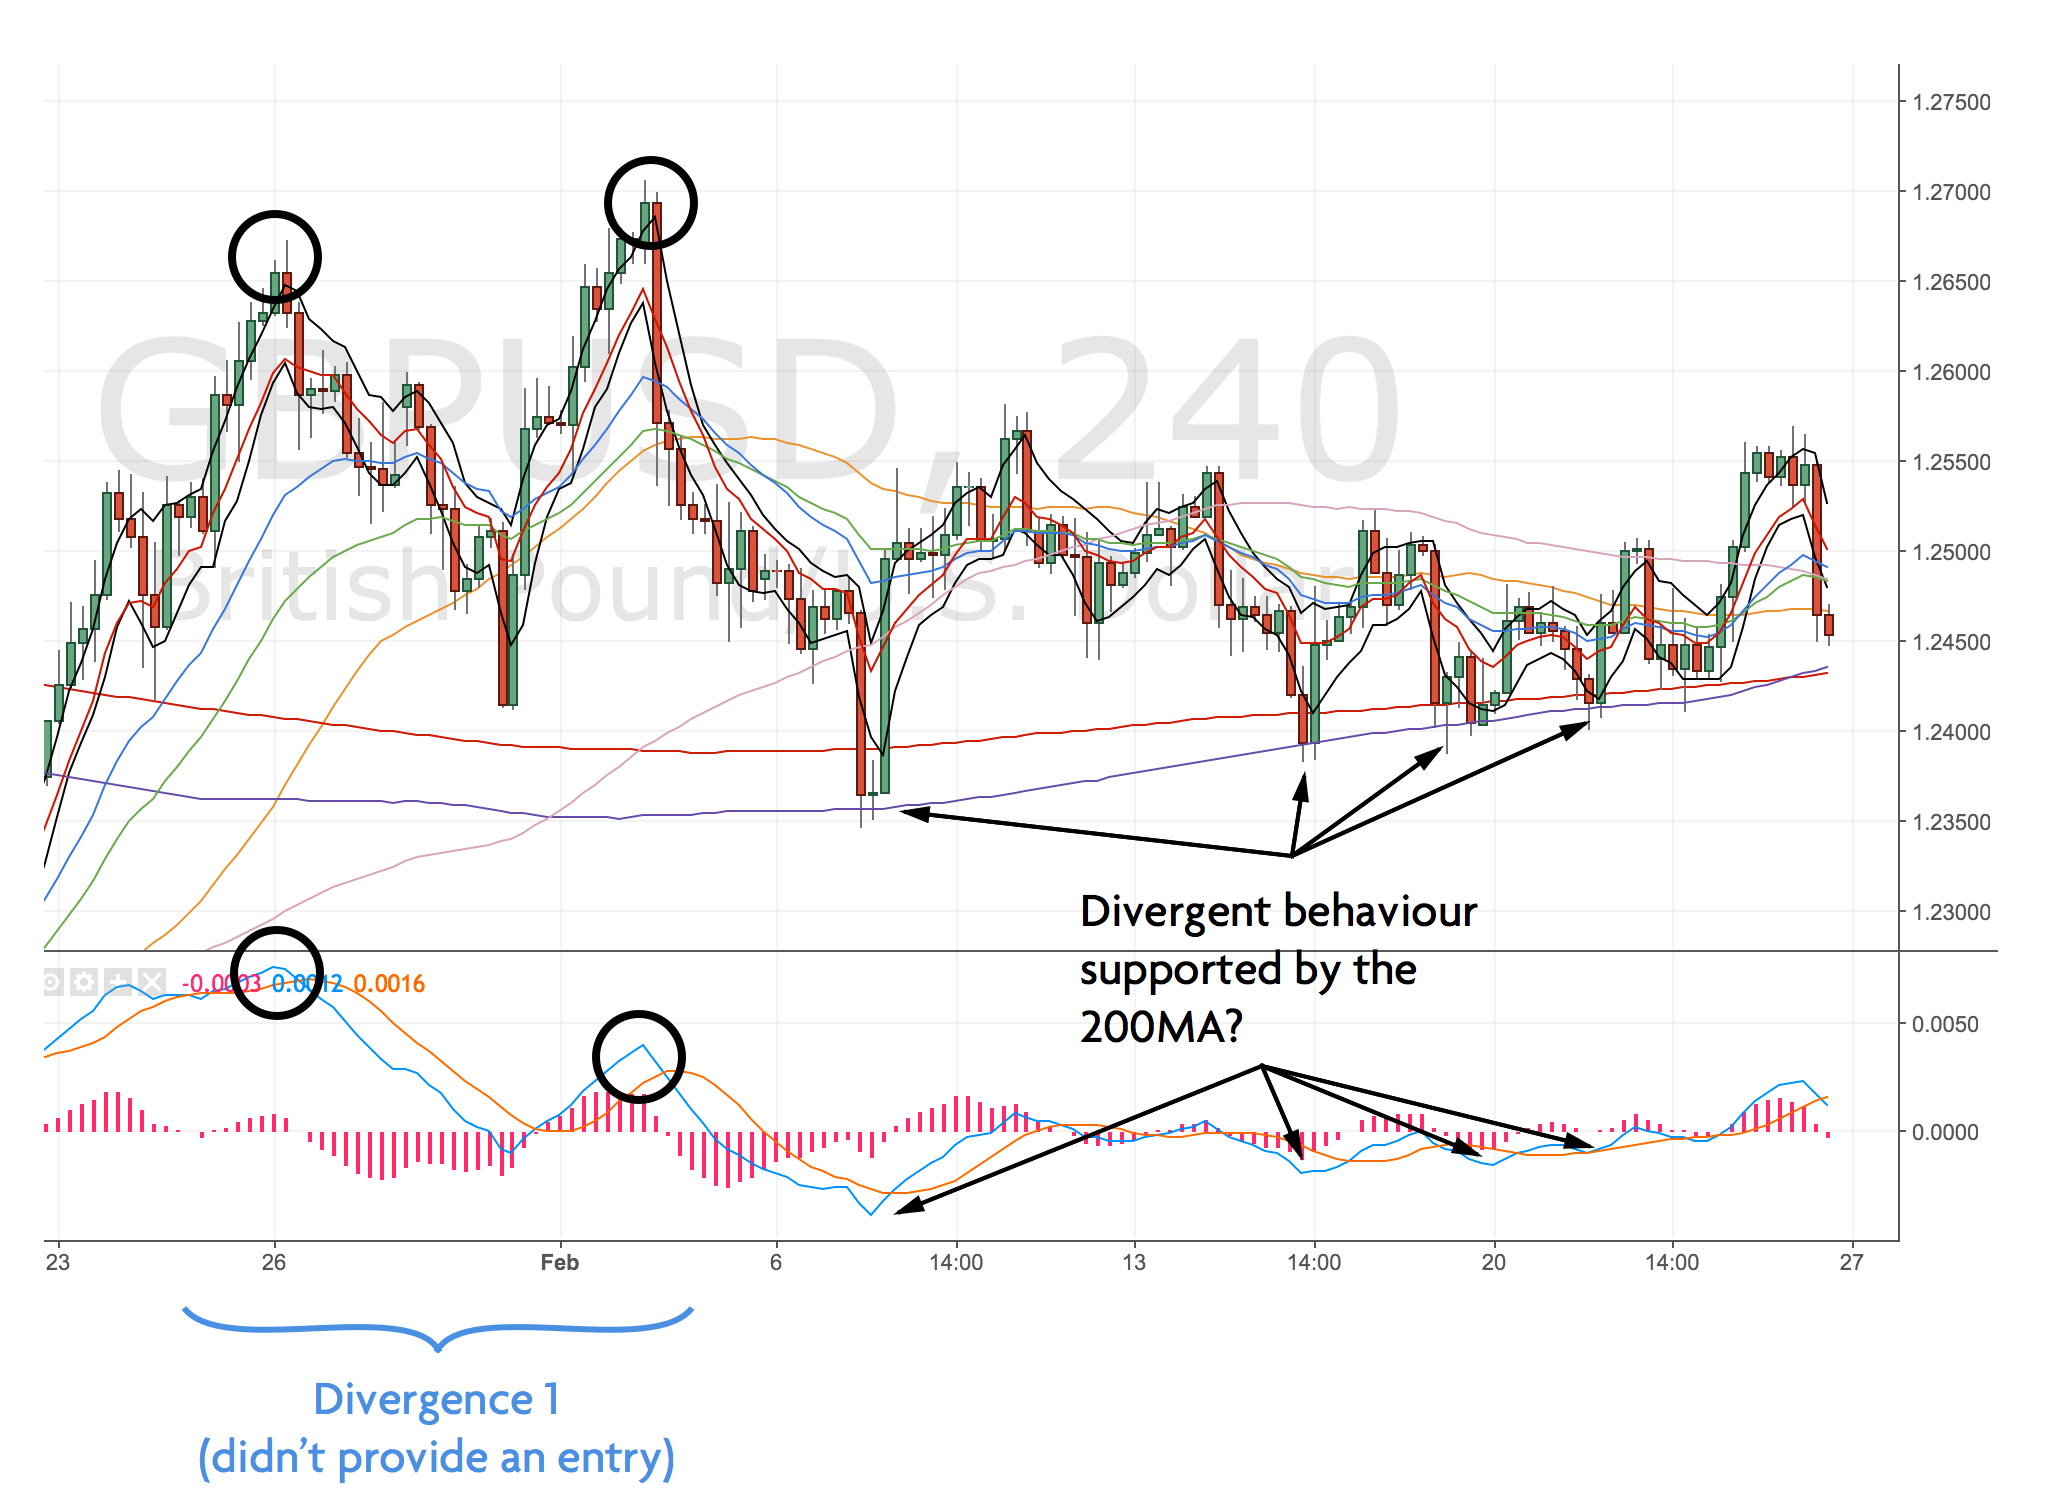
One last point – I haven’t heard anyone not being positive about the future of Gold. However my trendline in red looks fairly bad for Gold. Price has crossed it – retested it and I can see a move down to the m200 around 1000 area.
I’ll only trade the divergences I see, but I wouldn’t be surprised to see Gold head lower.
New goals
Keep them the same plus one other which is the goal I most want to complete next month.
- Trade at least 50% of the confirmed divergences I see.
- Maintain a 40% win rate
- Do at least one scan every trading day
- Log all my missed trades with reasons why I didn’t take them