Up until recently, my goals have been set pretty loosely. Currently (Feb 17) my goals are:
- This month: be consistent trading my strategy
- This year: get my account to £10k
- By 40 (5 years): get my account to £100k (this seems light years away right now. The account that is not the age 🙂 !)
If I’m ever going to make the journey to professional trader, I need to get a little more focussed about it. Given I’m swing trading I’m happy to review progress on a monthly basis but my monthly targets could do with being more specific.
Time to get compounding
Compounding returns is where it is at. Safely using leverage, limiting my risk and compounding any returns I make is the only way I believe I can achieve my goals. For now I’m just going to focus on this year’s goal. (I’ll worry about the 5 year one later.)
To get to 10k in the next 10 months (end of this year) I need to be aiming for the following targets.
| Month | Starting balance | Monthly profit | % Return | Total profit | Ending balance |
|---|---|---|---|---|---|
| March | £7,070.00 | £250.99 | 3.55% | £250.99 | £7,320.99 |
| April | £7,320.99 | £259.89 | 3.55% | £510.88 | £7,580.88 |
| May | £7,580.88 | £269.12 | 3.55% | £780.00 | £7,850.00 |
| June | £7,850.00 | £278.68 | 3.55% | £1,058.68 | £8,128.68 |
| July | £8,128.68 | £288.57 | 3.55% | £1,347.24 | £8,417.24 |
| August | £8,417.24 | £298.81 | 3.55% | £1,646.06 | £8,716.06 |
| September | £8,716.06 | £309.42 | 3.55% | £1,955.48 | £9,025.48 |
| October | £9,025.48 | £320.40 | 3.55% | £2,275.88 | £9,345.88 |
| November | £9,345.88 | £331.78 | 3.55% | £2,607.66 | £9,677.66 |
| December | £9,677.66 | £343.56 | 3.55% | £2,951.22 | £10,021.22 |
So for March (this month) I’m aiming for 3.55% return. Oooff, feels like a mountain to climb; especially with my current position sizing (0.5 – 0.7%) and some months will yield next to nothing in reality.
However, knowing the percentage is great for me because it means I can forget about the P&L and just focus on a percentage return. Some months I’ll make more, some months less.
So how much do I need to make per trade?
What I wanted to work out next was given a 0.7% risk on a trade how much RR (Reward to Risk) do I need to aim for to bring in the bacon. Here’s the crude / roundabout way I worked that out.
![\[ Exp. Rtn = Risk ((n_W * RR) - n_L) \]](http://journal.murchuza.com/wp-content/ql-cache/quicklatex.com-578be320e94961061d72c09e80f38920_l3.png "Rendered by QuickLaTeX.com")
Where:
 = Expected month end profit (in £s)
 = Position size (in £s), equivalent to 0.7% of the account balance
 = Number of winners
 = Number of losers
 = Reward to Risk ratio
I know the return I am aiming for (£255); so I need to calculate what RR I need to aim for on each trade to achieve this return. So rejigging the equation.
![\[ RR = (\frac{1}{n_W}\))(\frac{Exp. Rtn}{Risk}\ + n_L)\ \]](http://journal.murchuza.com/wp-content/ql-cache/quicklatex.com-baa11afee623837ed9ebd1e0578dc094_l3.png "Rendered by QuickLaTeX.com")
Last month there were 24 DST set ups. Assume we average around 20 set ups per month, of which, we can catch 12 of them (around 2/3rds) and my win rate is around 50%. Then my expected return for the month would be …
![\[ 1.85 = RR = (\frac{1}{6}\))(\frac{255}{50}\ + 6)\ \]](http://journal.murchuza.com/wp-content/ql-cache/quicklatex.com-c046b4e2eeebf1d25c6877e35a438214_l3.png "Rendered by QuickLaTeX.com")
Therefore I need to aim for 1.85 RR for each trade – averaging £92.50 on each winner and losing no more than £50 on each loser.
1.85 RR seems more manageable a target to focus on than £255 for the month.
What’s my theoretical maximum position size
In theory, if I’m trading 17 markets (the major crosses which I can scan each day) and from my back-testing the biggest run of losers is around 6 or 7; then I could have a losing streak of 119 trades! However, not all of those 17 markets are correlated together – most are traded against the dollar though, so let’s assume 2/3rds are correlated. So in theory of those 17 markets, 11 might all experience a losing streak in one go.
To avoid wiping out my account, the maximum position size I could safely trade would be:
![\[ Max Pos = \frac{Acc. Size}{(No. Mrkts * Losing Streak)}\ \]](http://journal.murchuza.com/wp-content/ql-cache/quicklatex.com-abb311b5a55741fd956102651a4b5d54_l3.png "Rendered by QuickLaTeX.com")
Where:
 = Current account size (£7070)
 = Maximum position size per trade (of all units) in £s
 = Number of correlated markets that I could be trading
 = Average market losing streak from back-testing
![\[ \£92 = Max Pos = \frac{\£7070}{(11 * 7)}\ \]](http://journal.murchuza.com/wp-content/ql-cache/quicklatex.com-f4a57a25f68826dcfb9bc2e8e2e4e3c3_l3.png "Rendered by QuickLaTeX.com")
The cost of taking money from your account
As an aside I saw this chart on the effects of taking income out of your trading account over time.
The chart shows a profitable trading account with a +/- 20% P&L swing year on year (I don’t recall the total timeframe.)
The x axis shows trades taken on the account, y axis shows total return. The assumption is that the trader takes a fixed percentage out of their account every 6 months.
Each line shows what would happen to the final account balance if you take money out of the trading account.
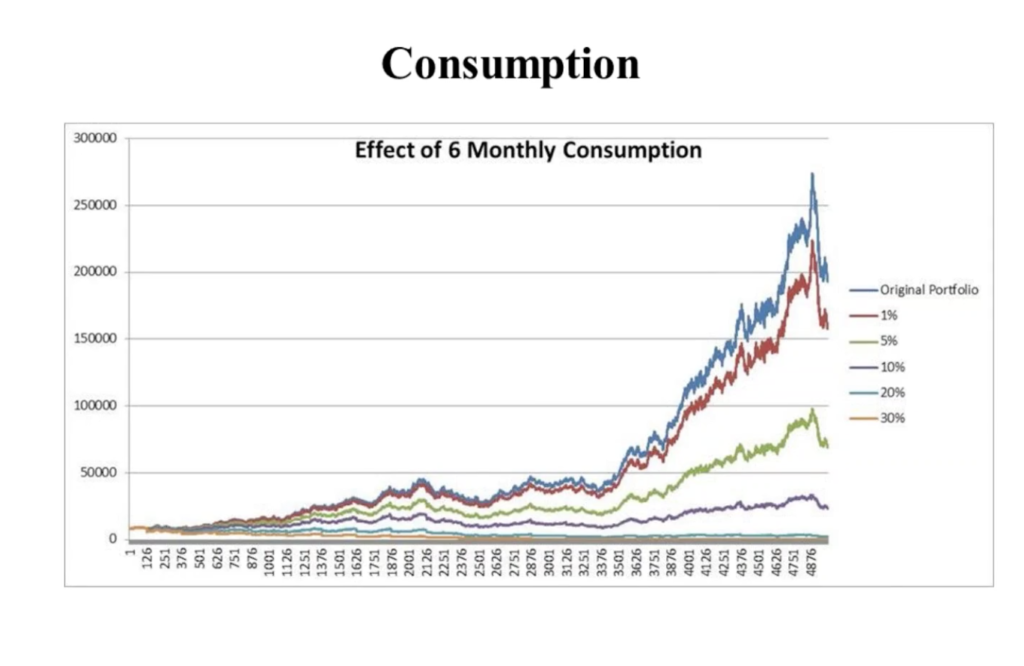
Consumption of a trading account over time
Update: Comments from Charlie
Went through this with mentor Charlie and he had a few comments for me.
- The compounding period is too short. Need to allow time to get comfortable with the new position size, before compounding again. He suggested once per quarter or 6 months
- Agreed it was best to focus on the RR and % return rather than the P&L of each trade