Acc Risk: 0.6%
Short: 2501.5
Stop: 2506.5 (50 pips)
Target: 2348 (w50, 1535 pips!, 30x RR)
Mindset: The low volatility concerns me. I can’t ignore the many divergences I see across different timeframes
Updates
Stopped out on low volatility – 19 Sep
Haven’t traded this market before, and I know it’s an expensive market to trade, a 1 point move is a 10 pips move, so what looks like small price changes can impact me a lot. Regardless, I can’t ignore the number of divergences I see across the different timeframes. Whilst I can see this heading higher, especially with such low volatility, the market looks ripe for shorting.
Monthly Chart
Divergence forming on the monthly chart?
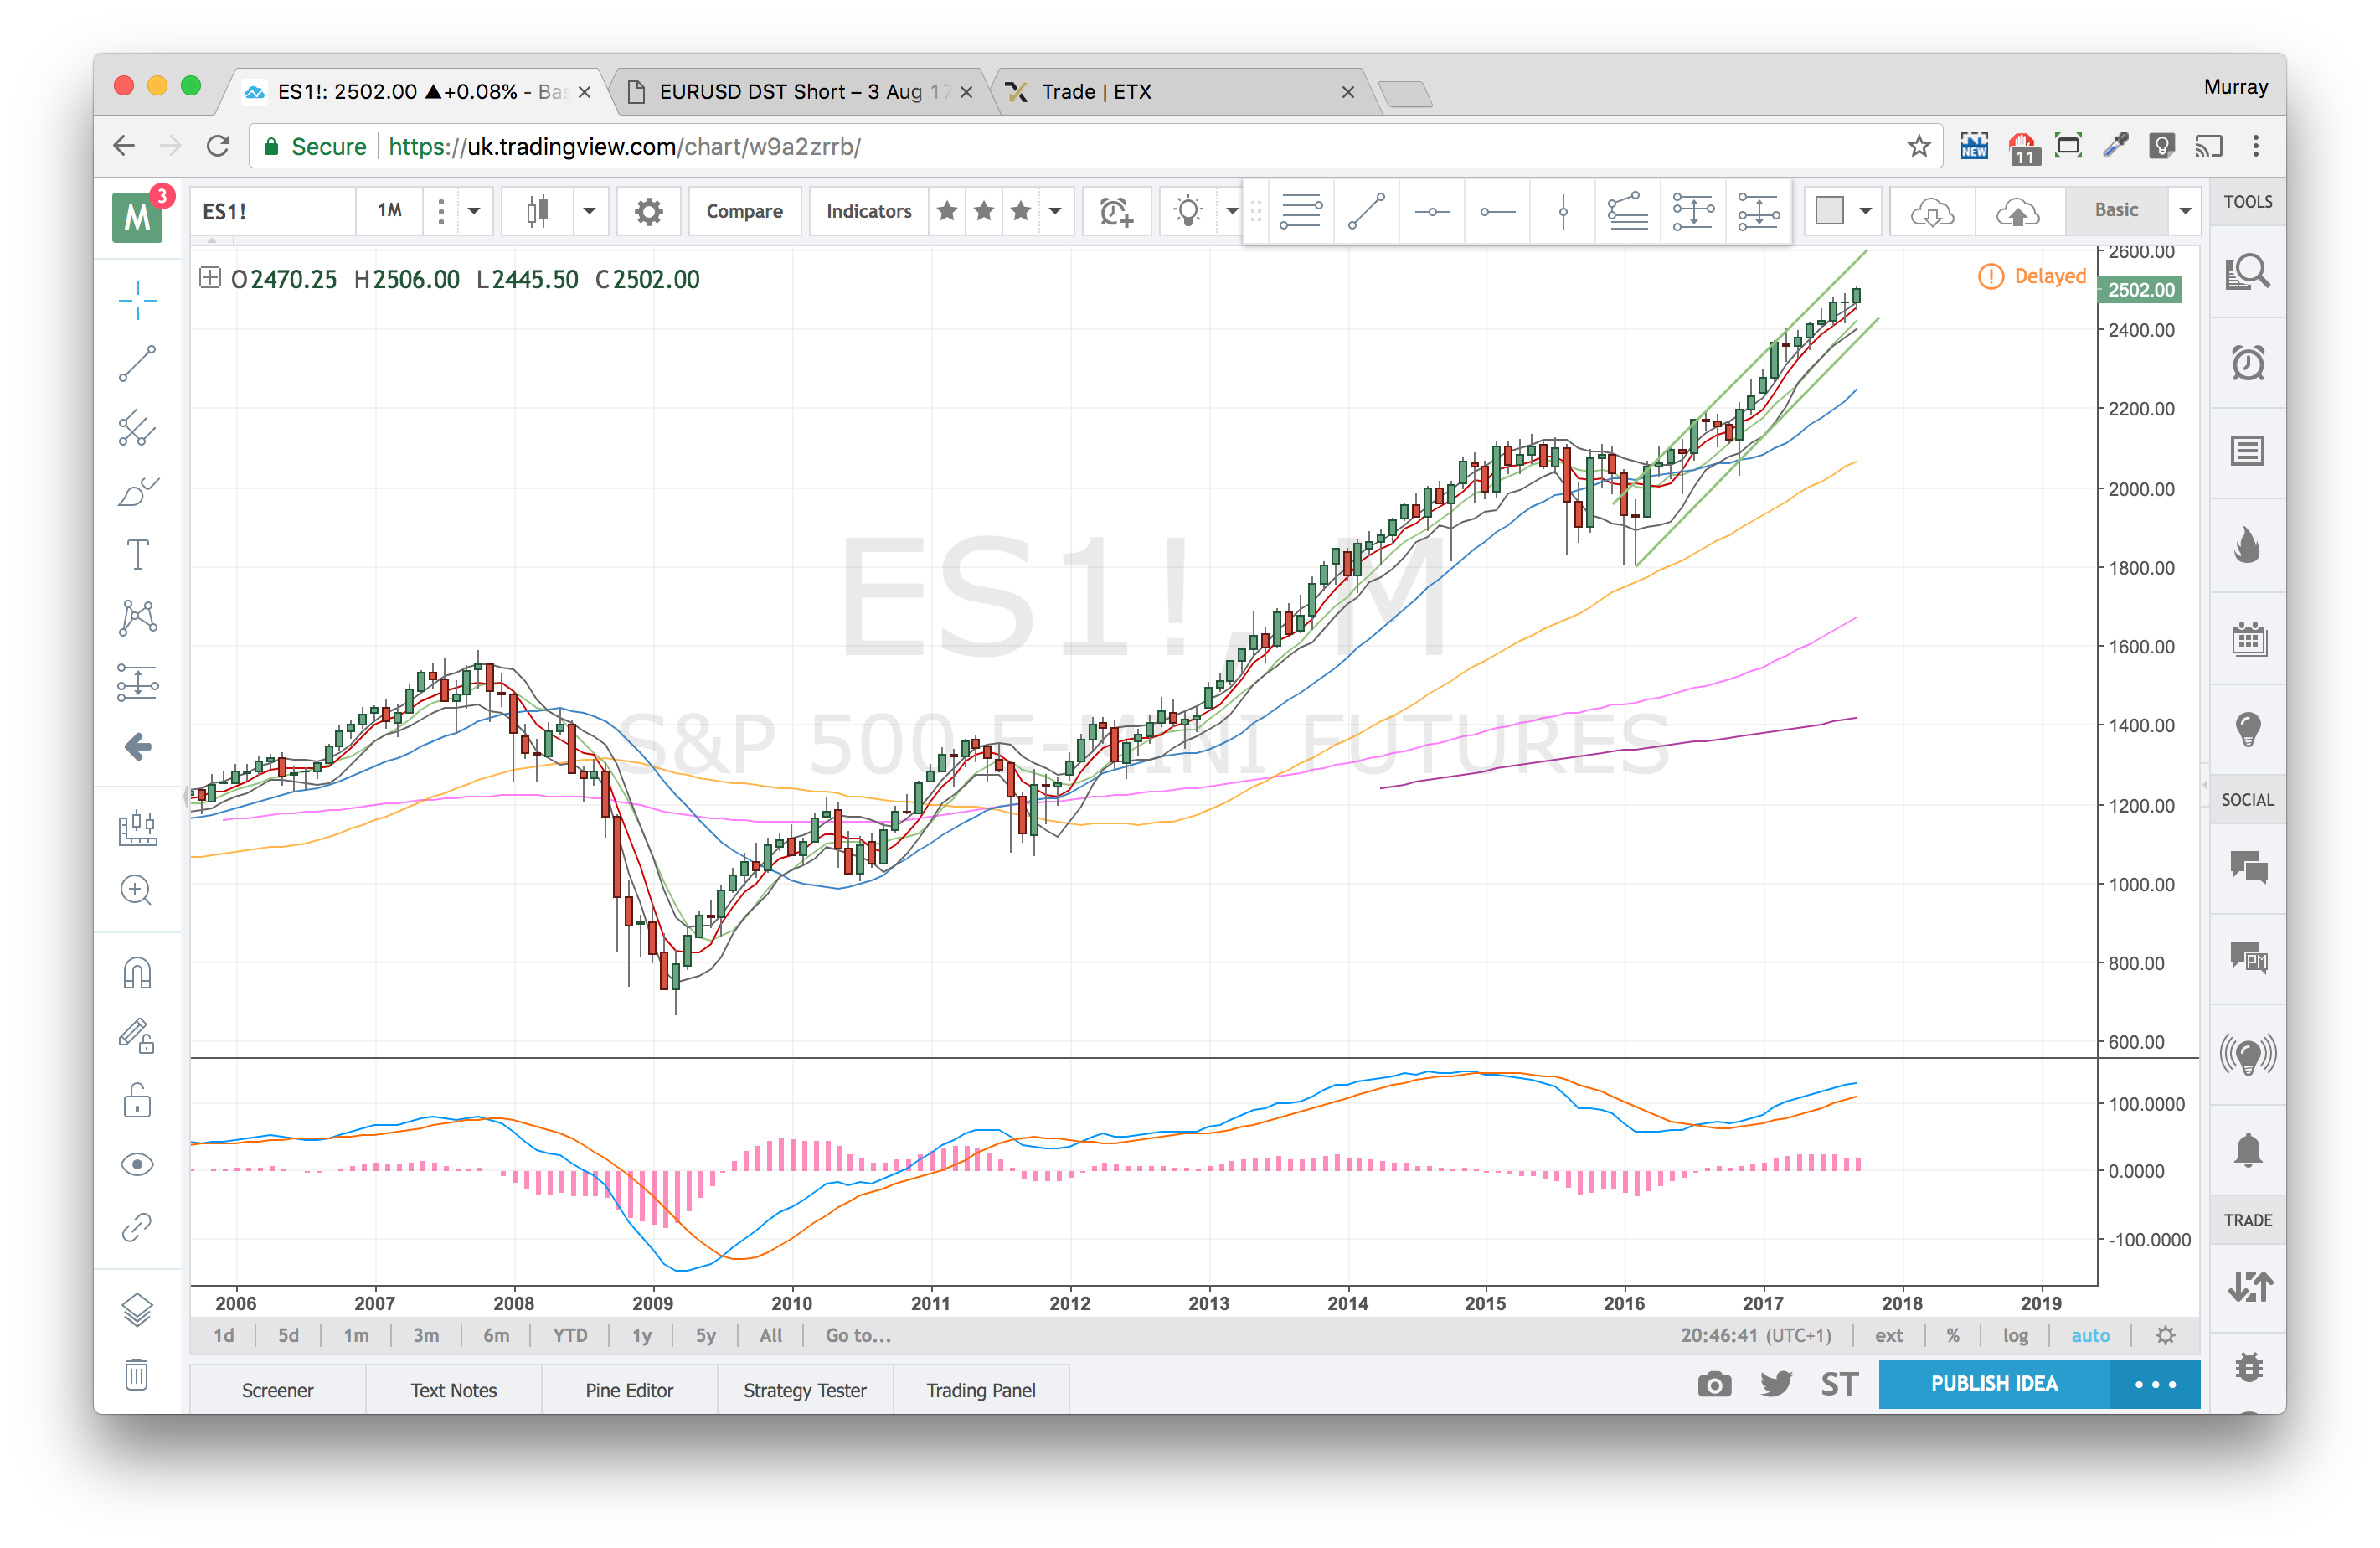
S&P Monthly Chart – 18 Sep 17
Weekly Chart
Weekly divergences in play – another one forming this week?
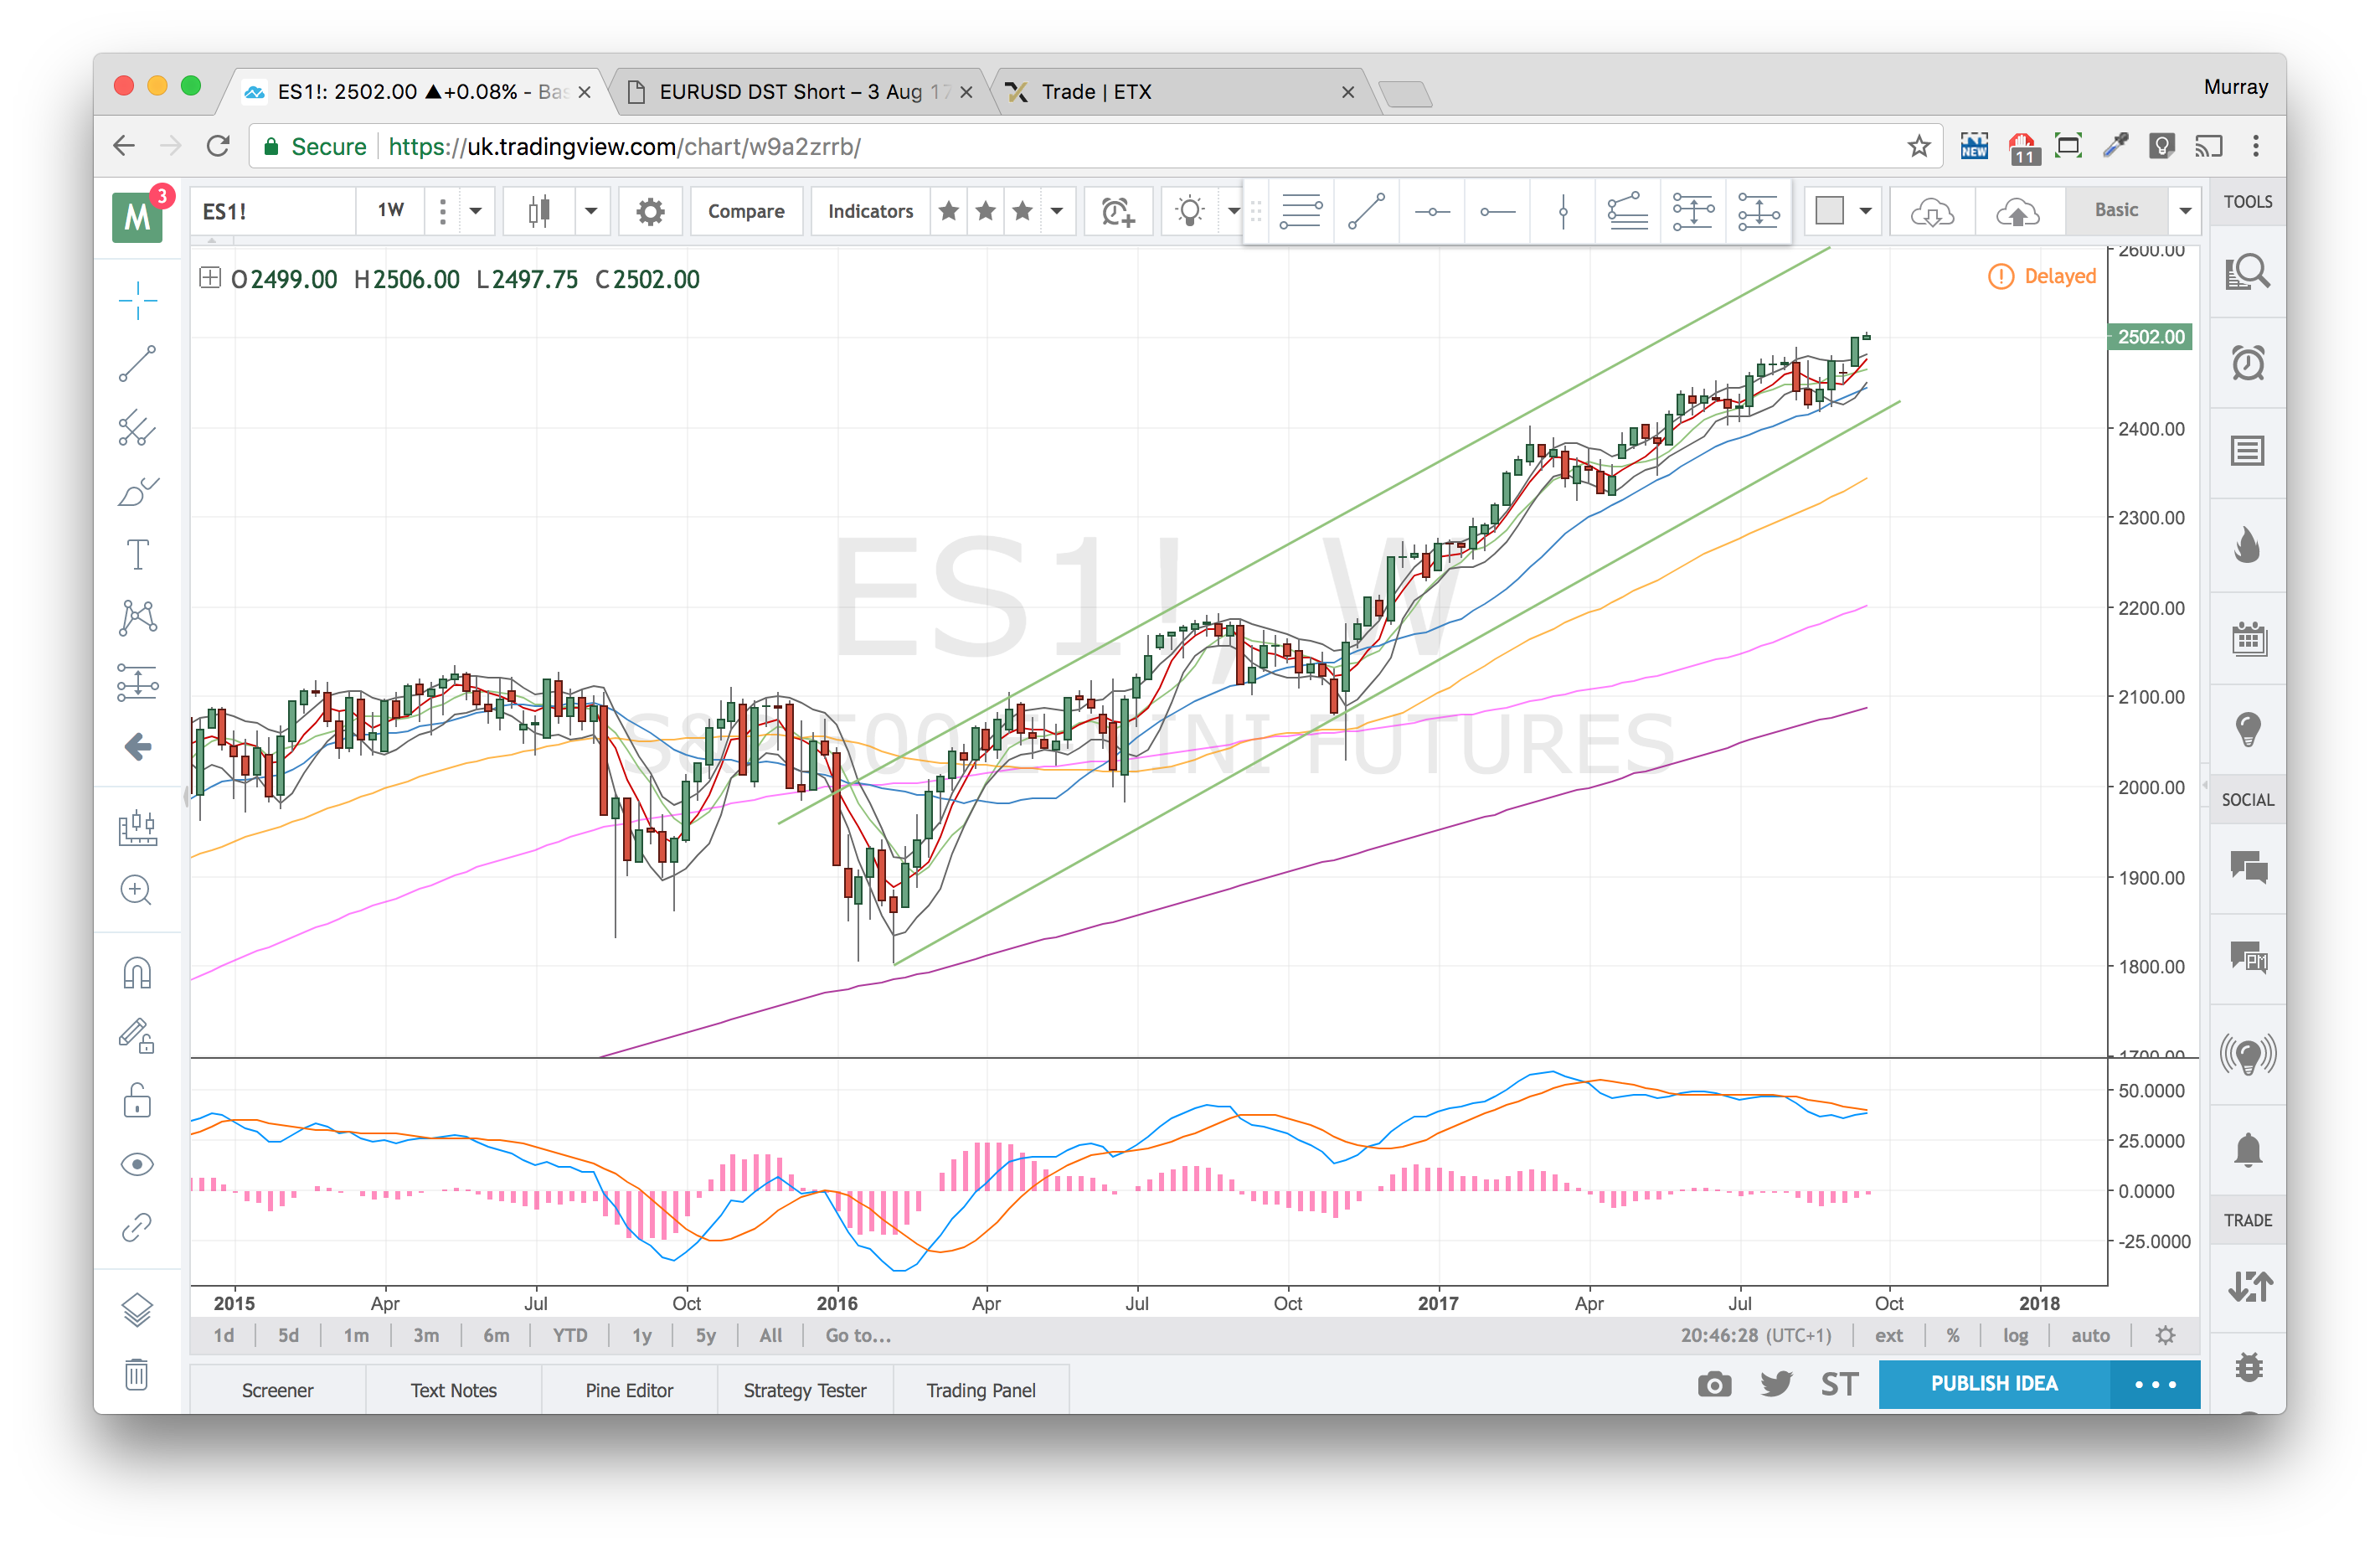
S&P Weekly Chart – 18 Sep 17
Daily Chart
Double/triple divergence in play on the daily chart.
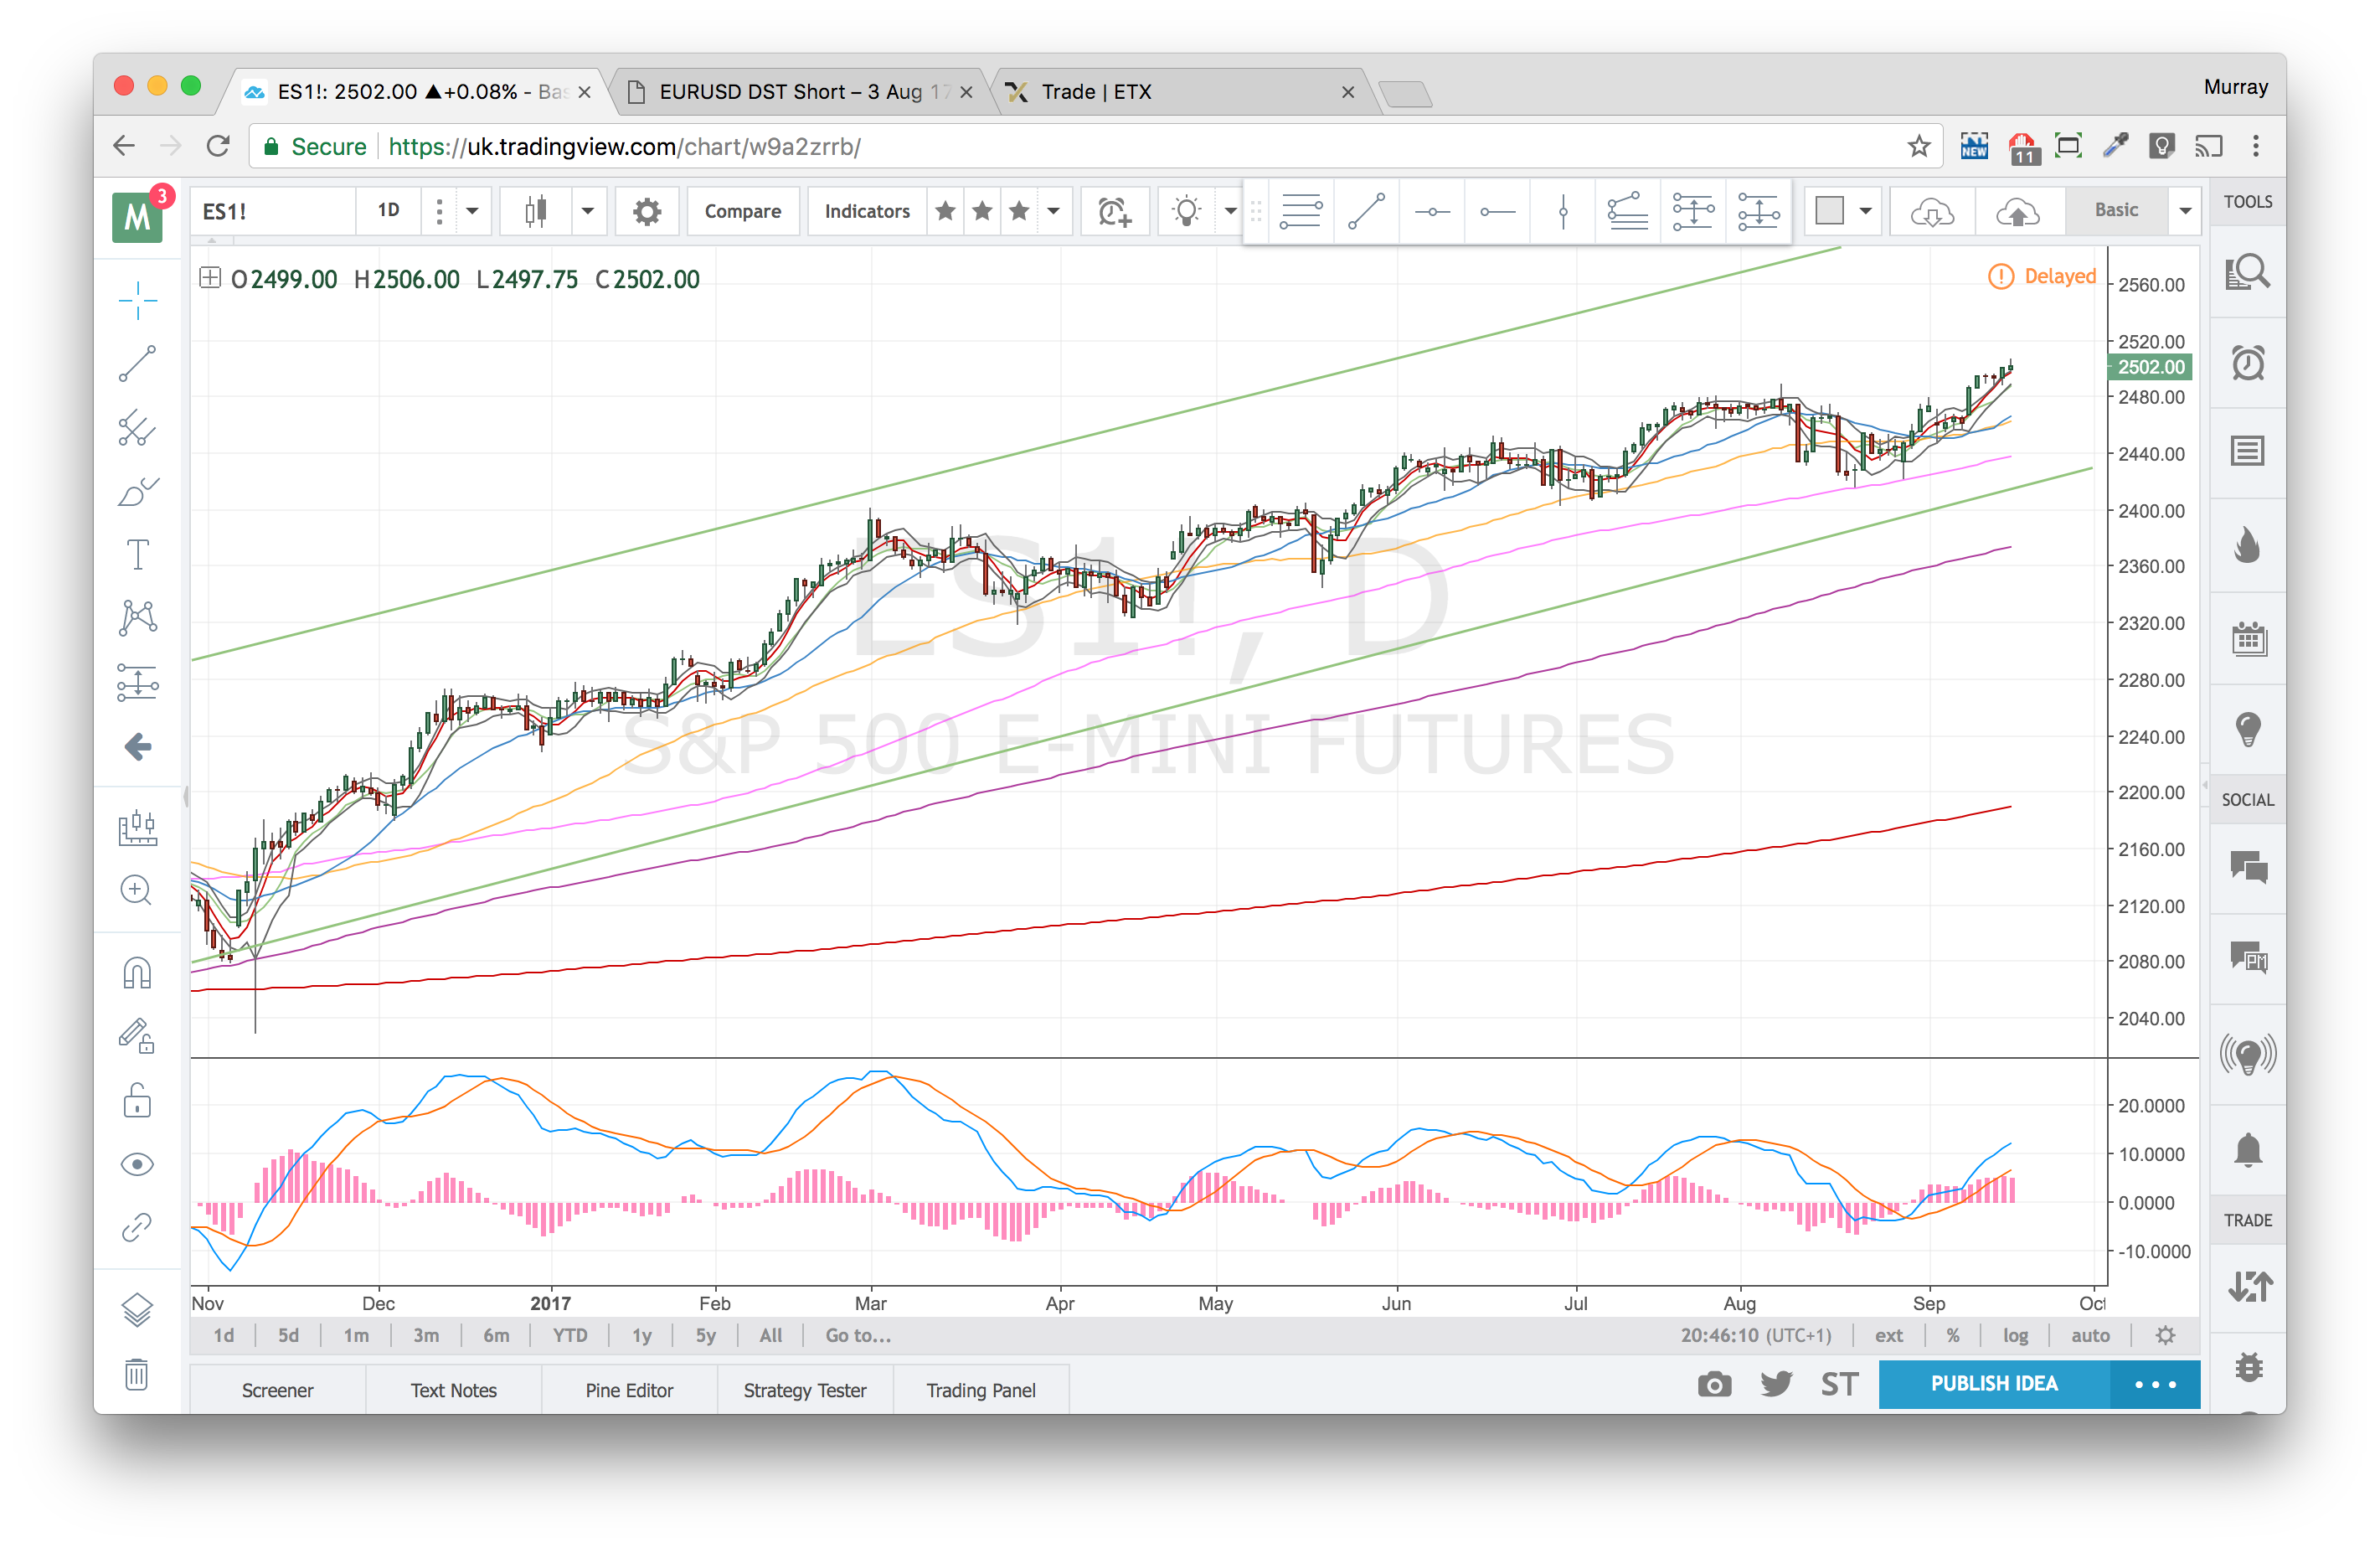
S&P Daily Chart – 18 Sep 17
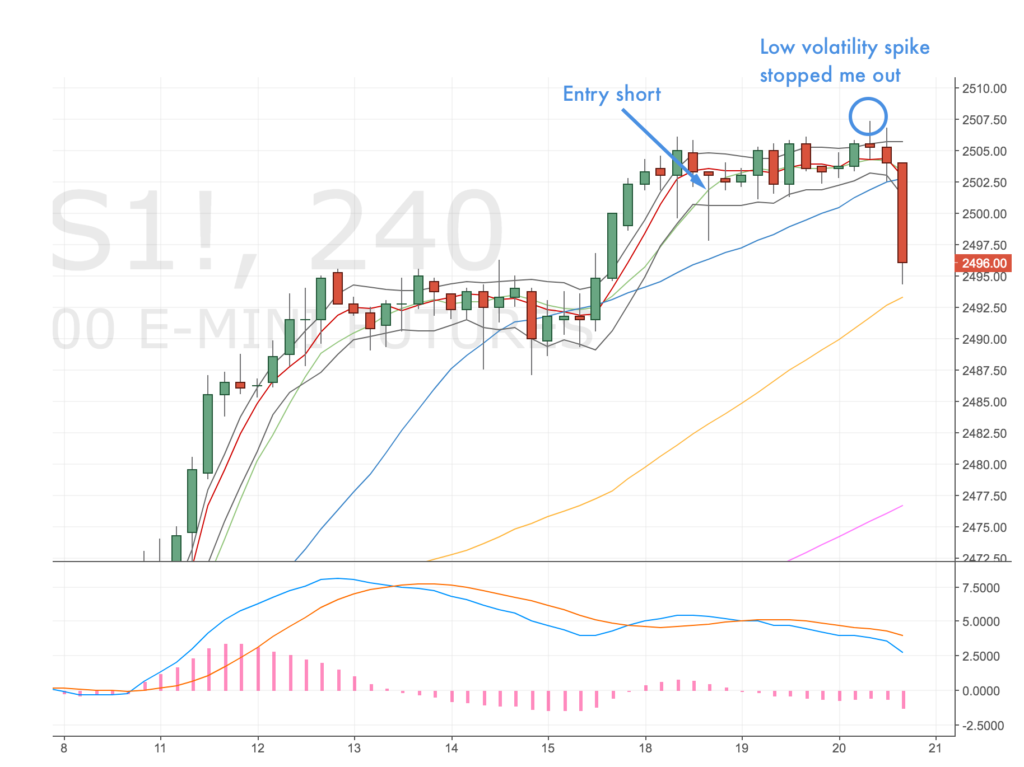
4H Chart – Set up
Double divergence on the 4H Chart. However very low volatility makes me nervous, great to have a tight stop but on low volatility it seems pretty stupid.
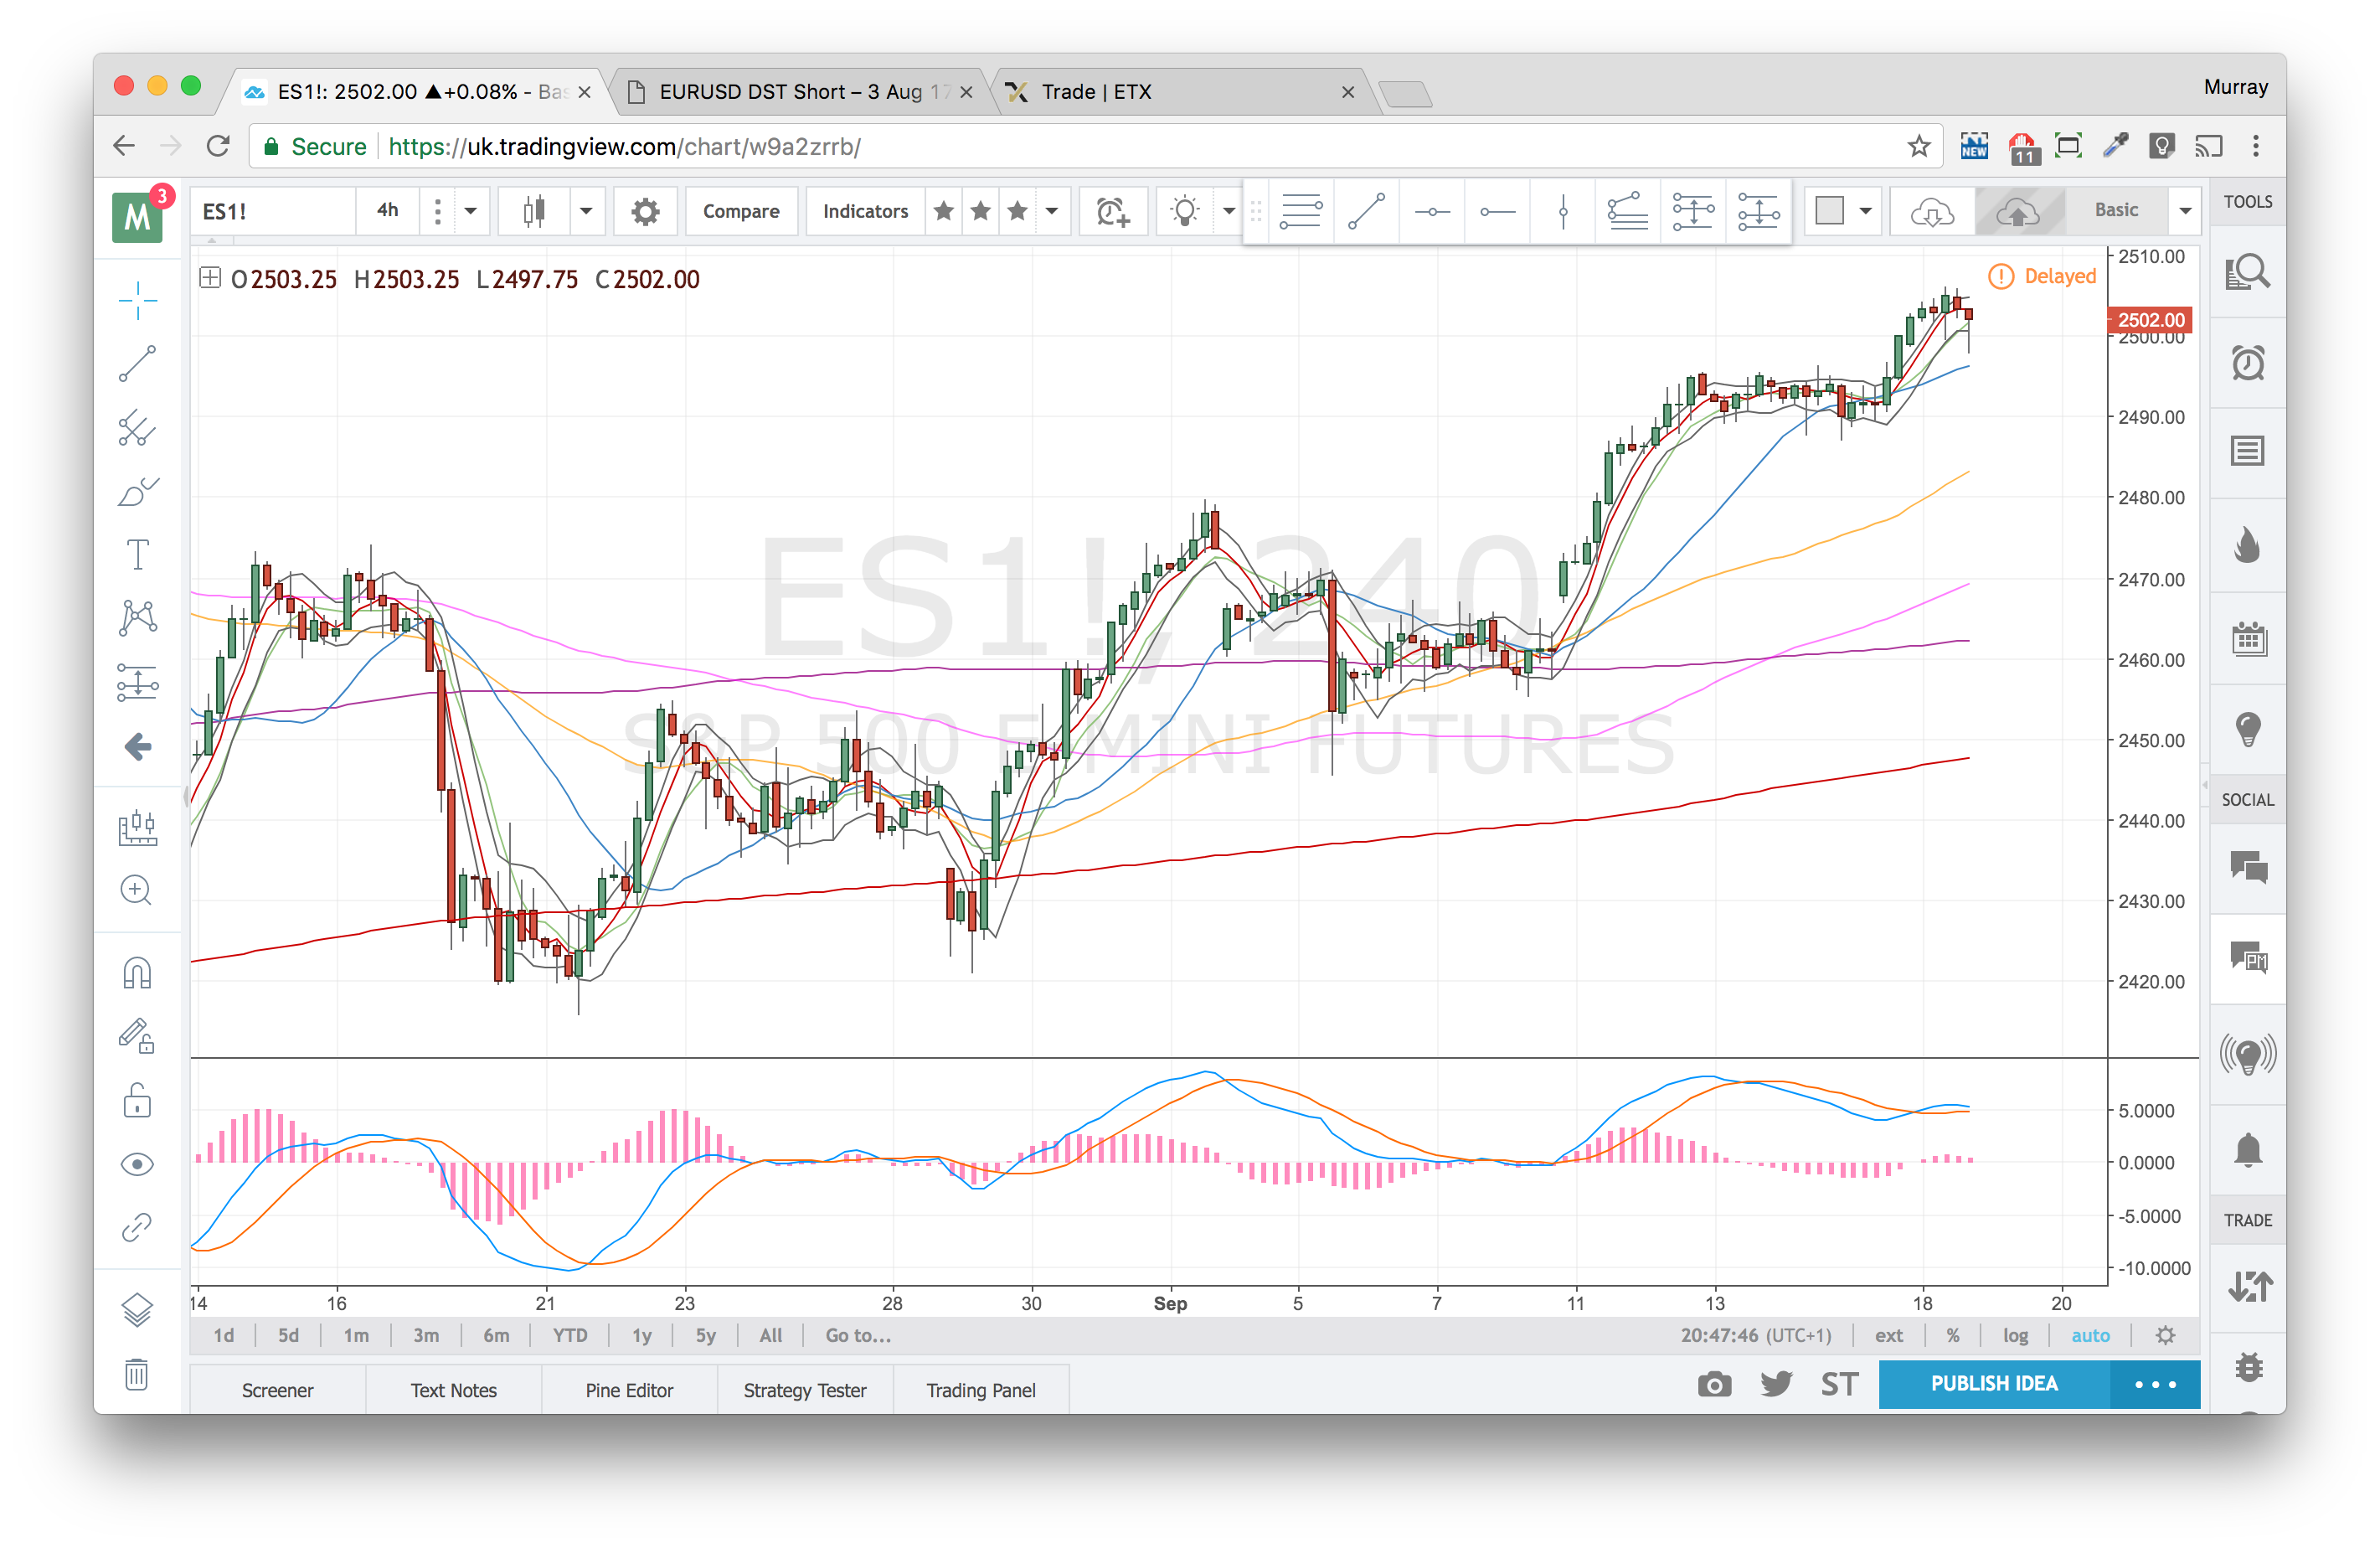
S&P 4H Chart – 18 Sep 17
1H Chart – Confirmation
Divergence confirming the trade.
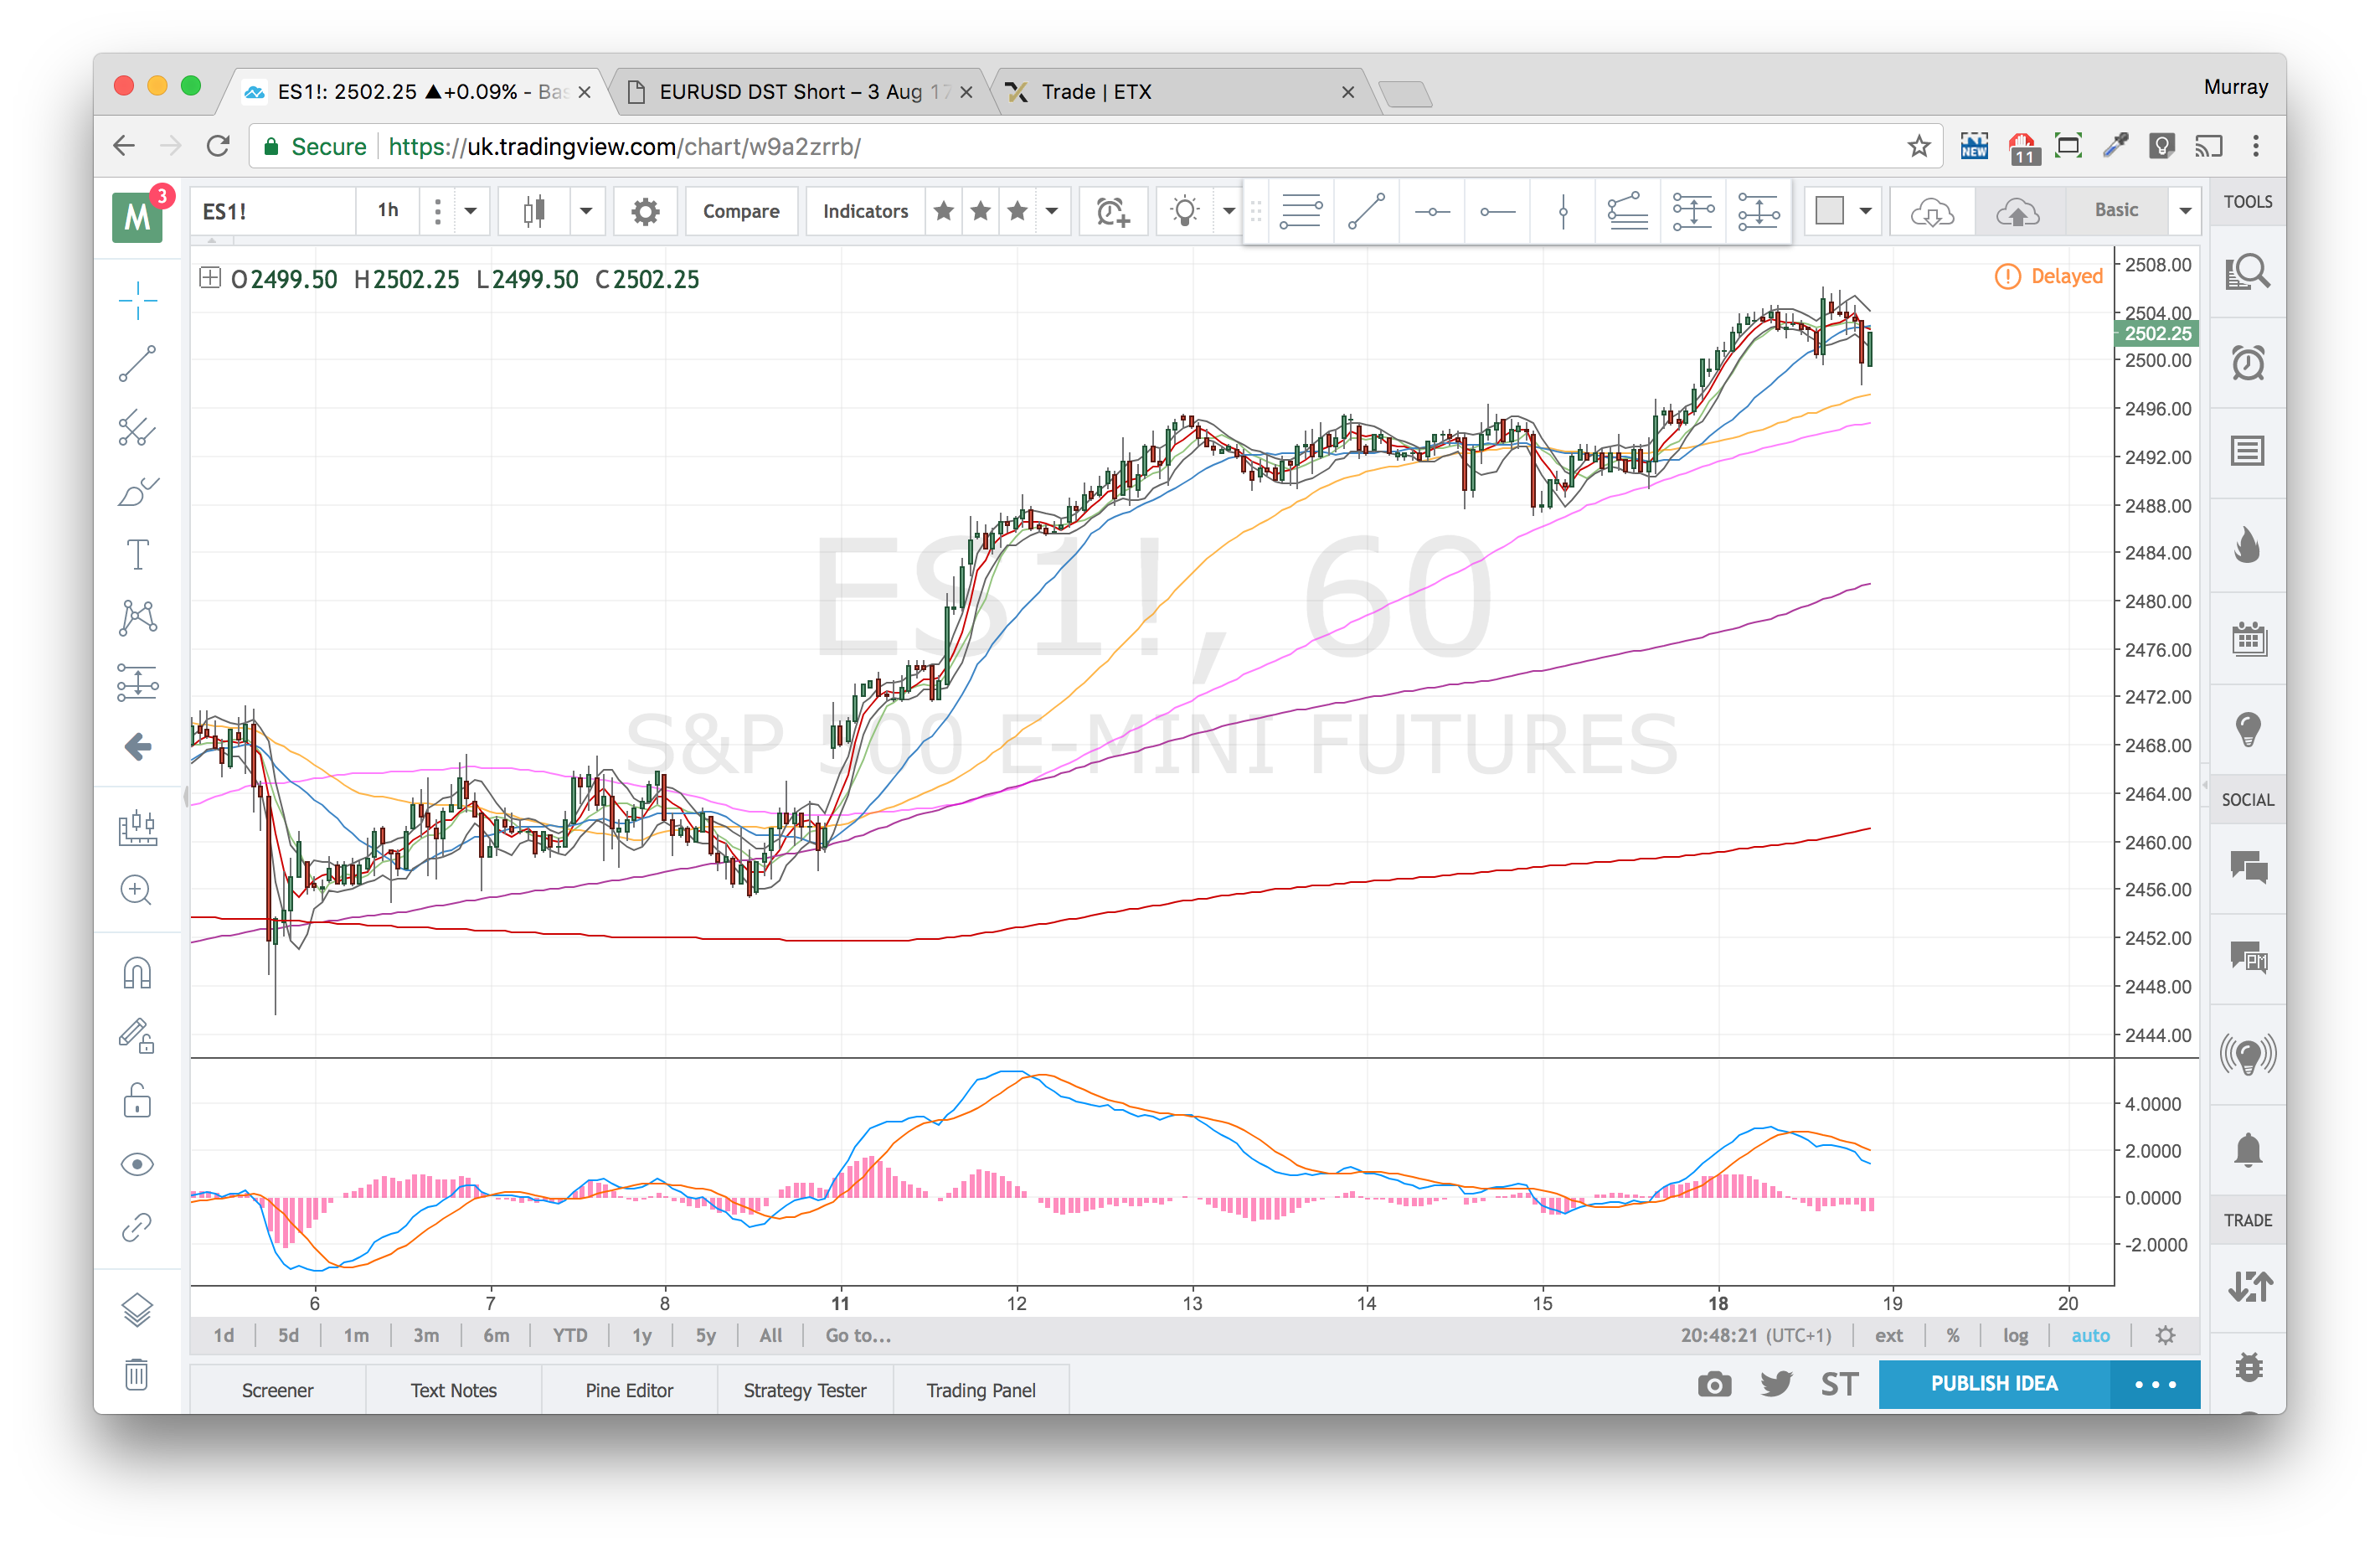
S&P 1H Chart – 18 Sep 17
Stopped out on low volatility – 19 Sep
Well I’m not surprised that (a) a double divergence has played out on the 4H chart and (b) I got stopped out on a tight stop. Will need to speak to Charlie about this price action. Seems kind of dumb to set such a tight stop and then get stopped out on expected/minimal price action.
I’ve set an alert for price to form another high @ 2508 – I think it might – seasonally we might get lower prices before the traditional Christmas rally.