Acc Risk: 0.5%
Short: 1340.0
Stop: 1344.7 (47 pips)
Target: 1319.0 (210 pips, 4h50, 4.46x RR)
Updates
A slightly smaller position size, wanted to keep my positions to £40 or under, had previously been £30. (I’m thinking I should probably increase this to £50 otherwise I’ll never progress much further.) I quite like this divergence on the 4h chart, but we’re near a trendline I had previously drawn on the daily chart.
Try not to put too much emphasis on trendlines though!
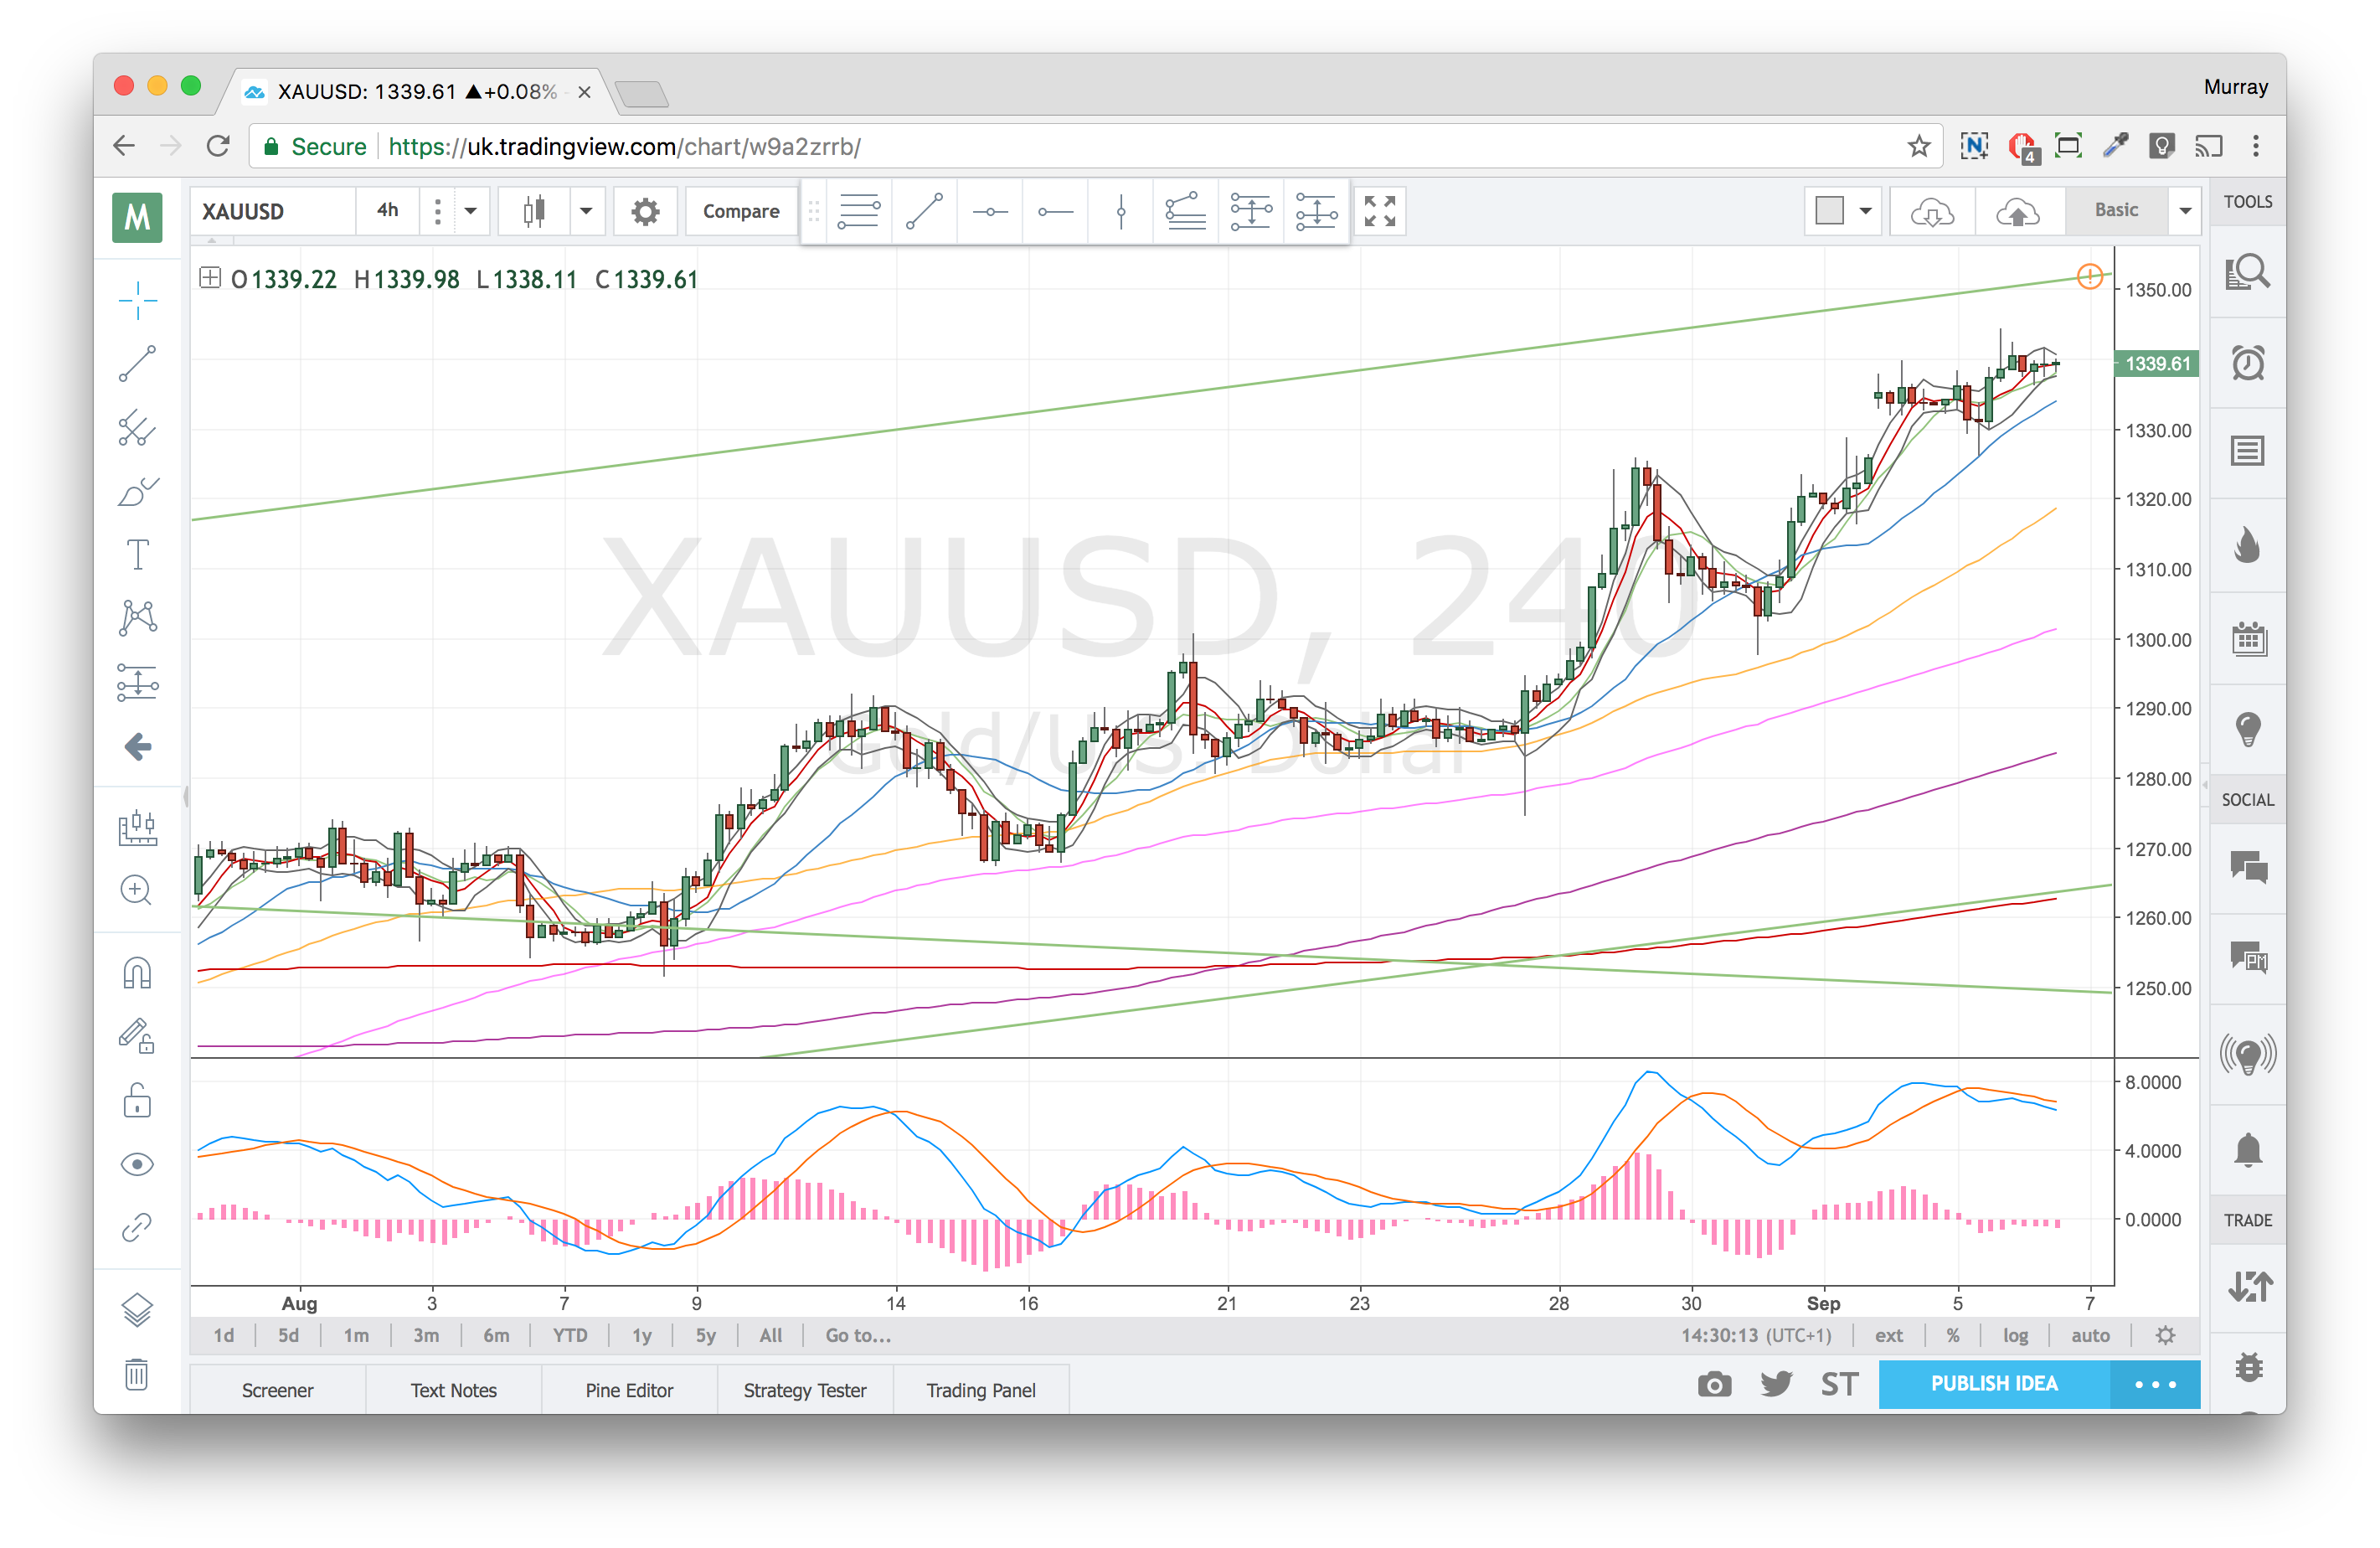
4H Chart – set up
A relatively late stage divergence which looks promising.

Gold 4H Chart – 6 Sep 17
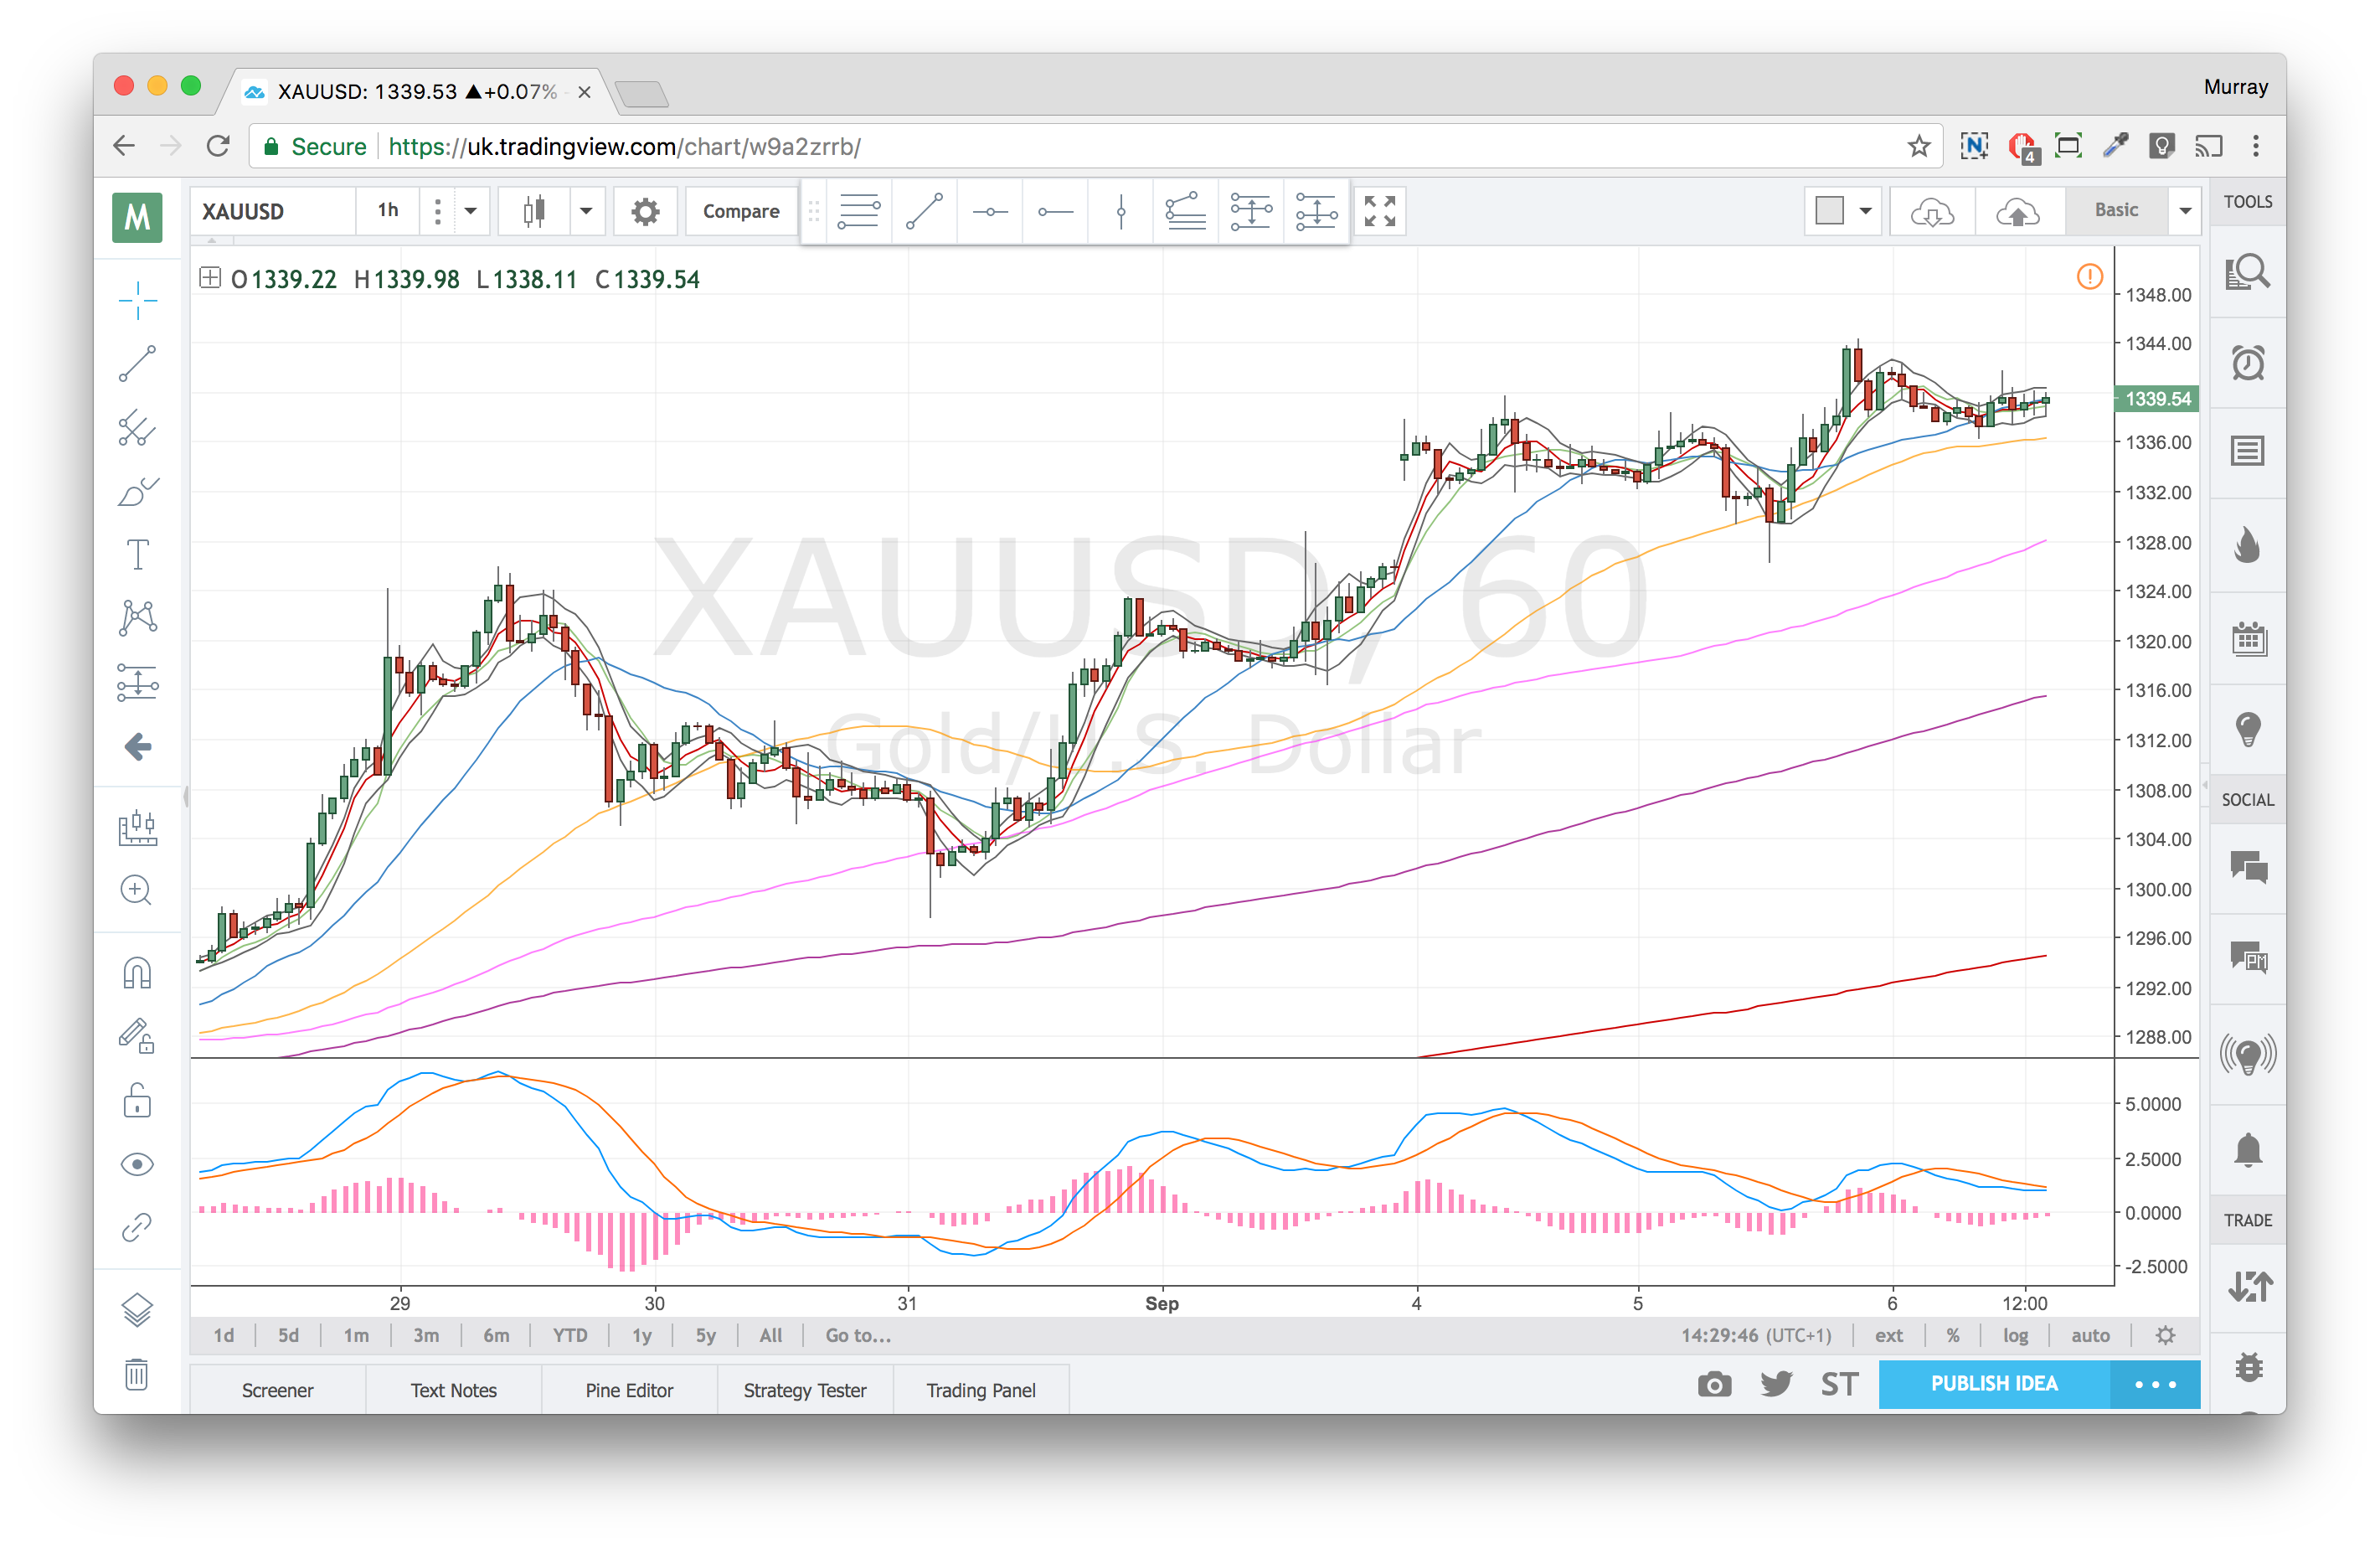
1H Chart – confirmation
A double divergence? Would need to see further back to confirm … one sec … yep it’s a double!

Gold 1H Chart – 6 Sep 17
Daily Chart
Close to my trendline but not putting too much emphasis on it. The gap has already been filled.

Gold Daily Chart – 6 Sep 17
Weekly Chart
Nothing of note really.

Gold Weekly Chart – 6 Sep 17
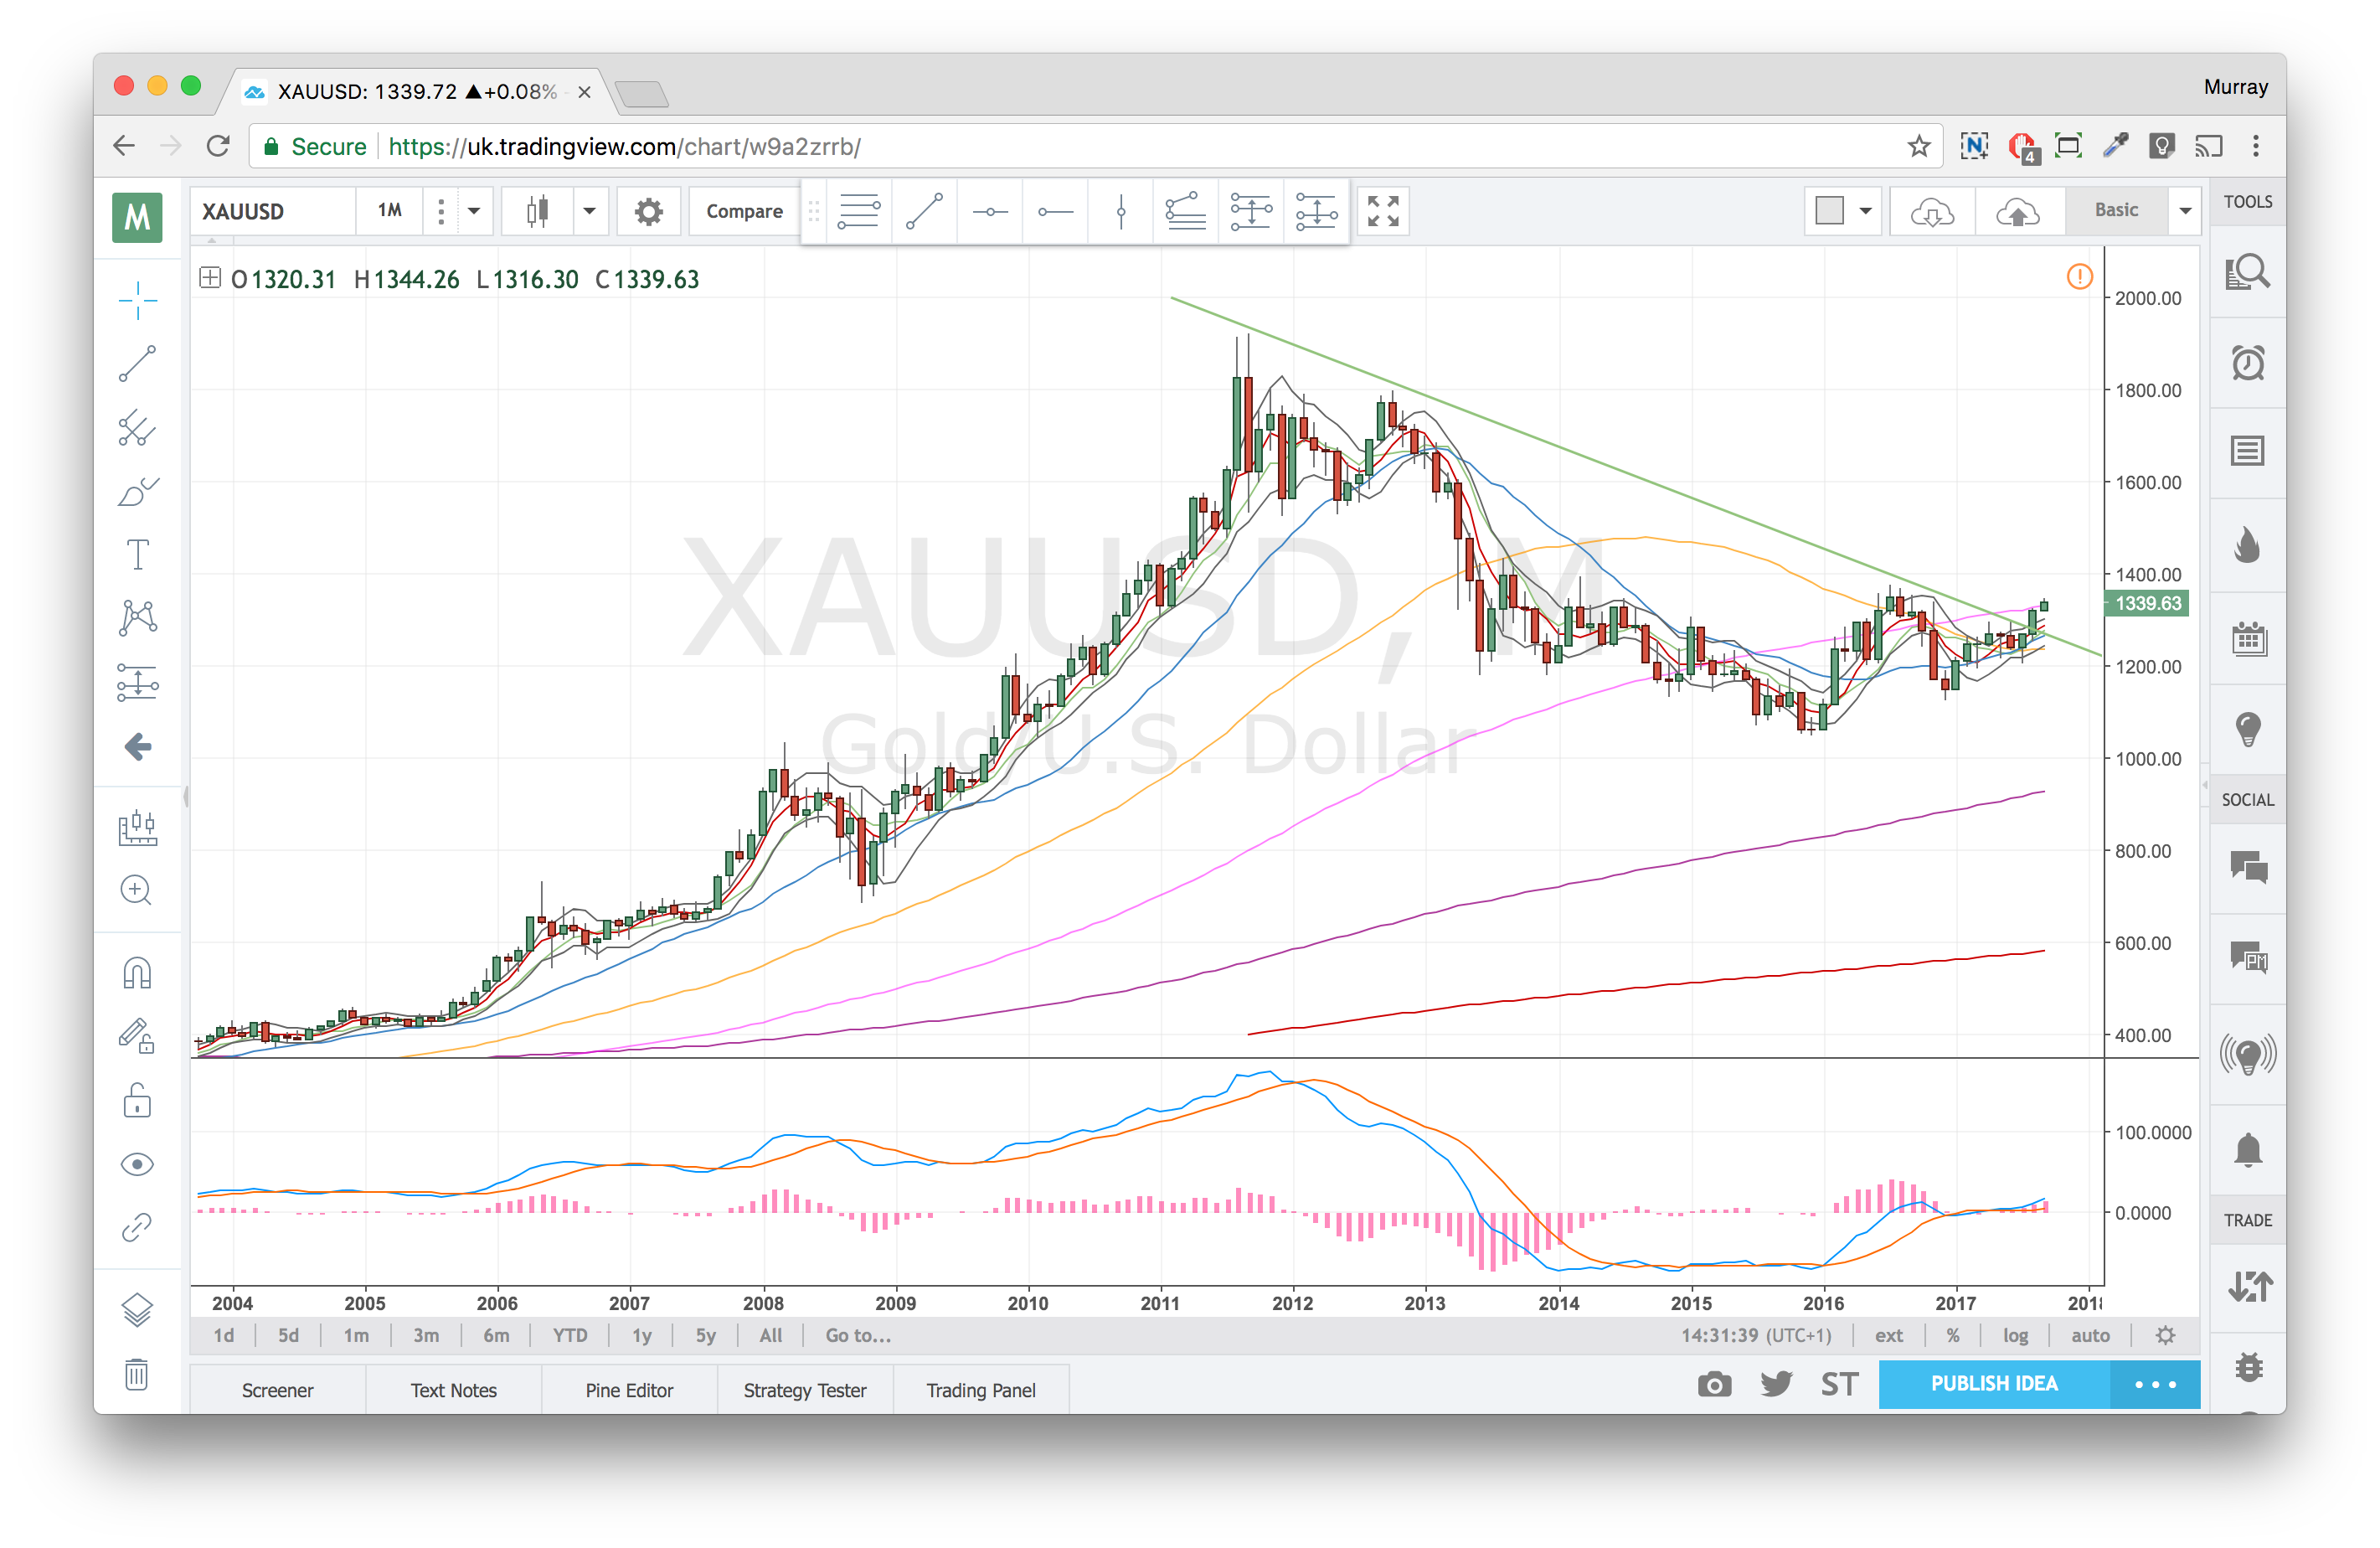
Monthly Chart
Into the m100. Might get a bit of ping pong between it and the m50?

Gold Monthly Chart – 6 Sep 17
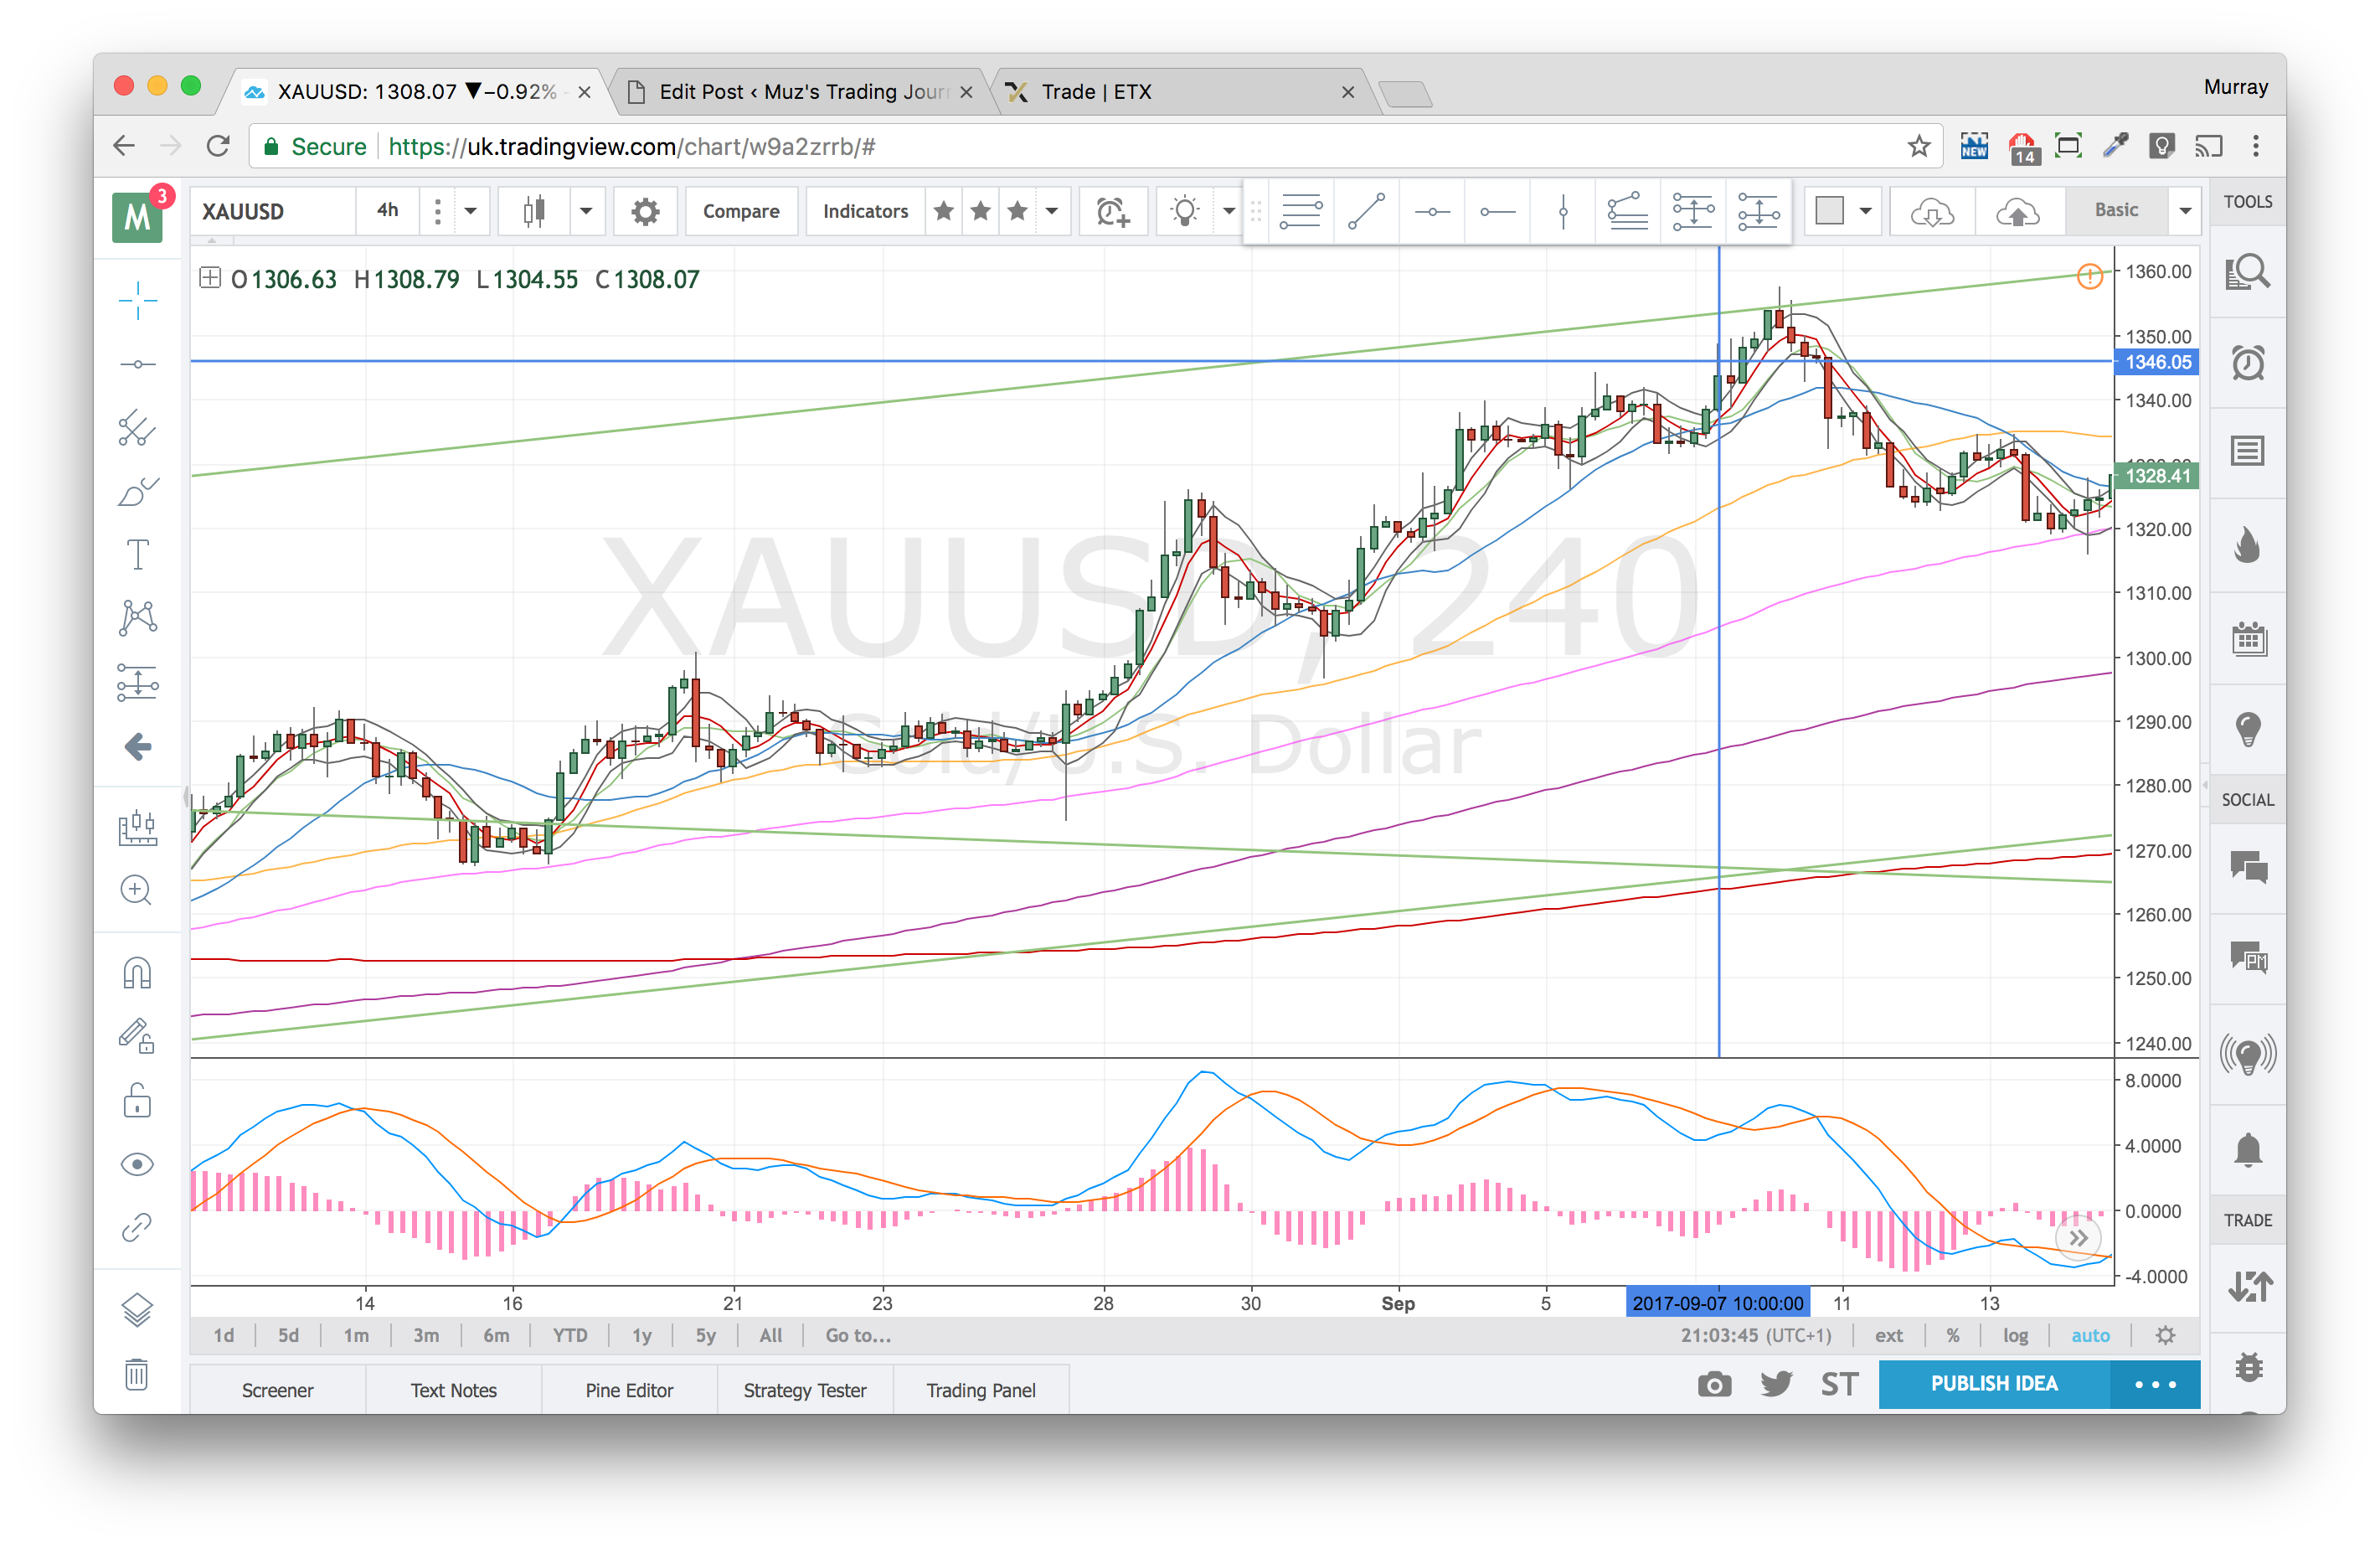
Stopped out – 7 Sep 17
Not surprised to get stopped out, but I was surprised to get slipped on this trade. I don’t think I should’ve been, reviewed the price action on MT4 and the slippage didn’t look justified. I checked with Charlie and on his chart the slippage was there, so I’ve left it, but I got slipped 20 pips and took an additional loss of £10.
Not much money, but it’s still a 20% addition to the original amount risked.

XAUUSD 4h Chart – 7 Sep 17
Here’s the video replay of that slippage – original stop was 1344.7 actual stop was 1346.6.
What’s worse is the next divergence that came in I missed the set up – on holiday – so I didn’t get to trade it and run it down to the 4h100. I did set an order hoping to get triggered end of the day but cancelled it over the weekend (worried about gaps – probably shouldn’t have). Either way, the move went without me.