Long @ 1313.00, SL: 1290.00 (230 pips), TP: 1350 (370 pips), Risk:Reward: 1.6, acc risk: 1.9%
Thought I’d do an update on gold, my last post had some long term technical analysis which seemed bearish to me on the monthly timeframe, but definitely at a decision point, so thought I’d keep tabs.
Monthly Chart
On the monthly chart we are retesting two trendlines, long-term in blue (was support now resistance) and the trend channel down in green. This is a point of decision for the market whether to break-through or fall away. So far the green trend channel has held up ok.
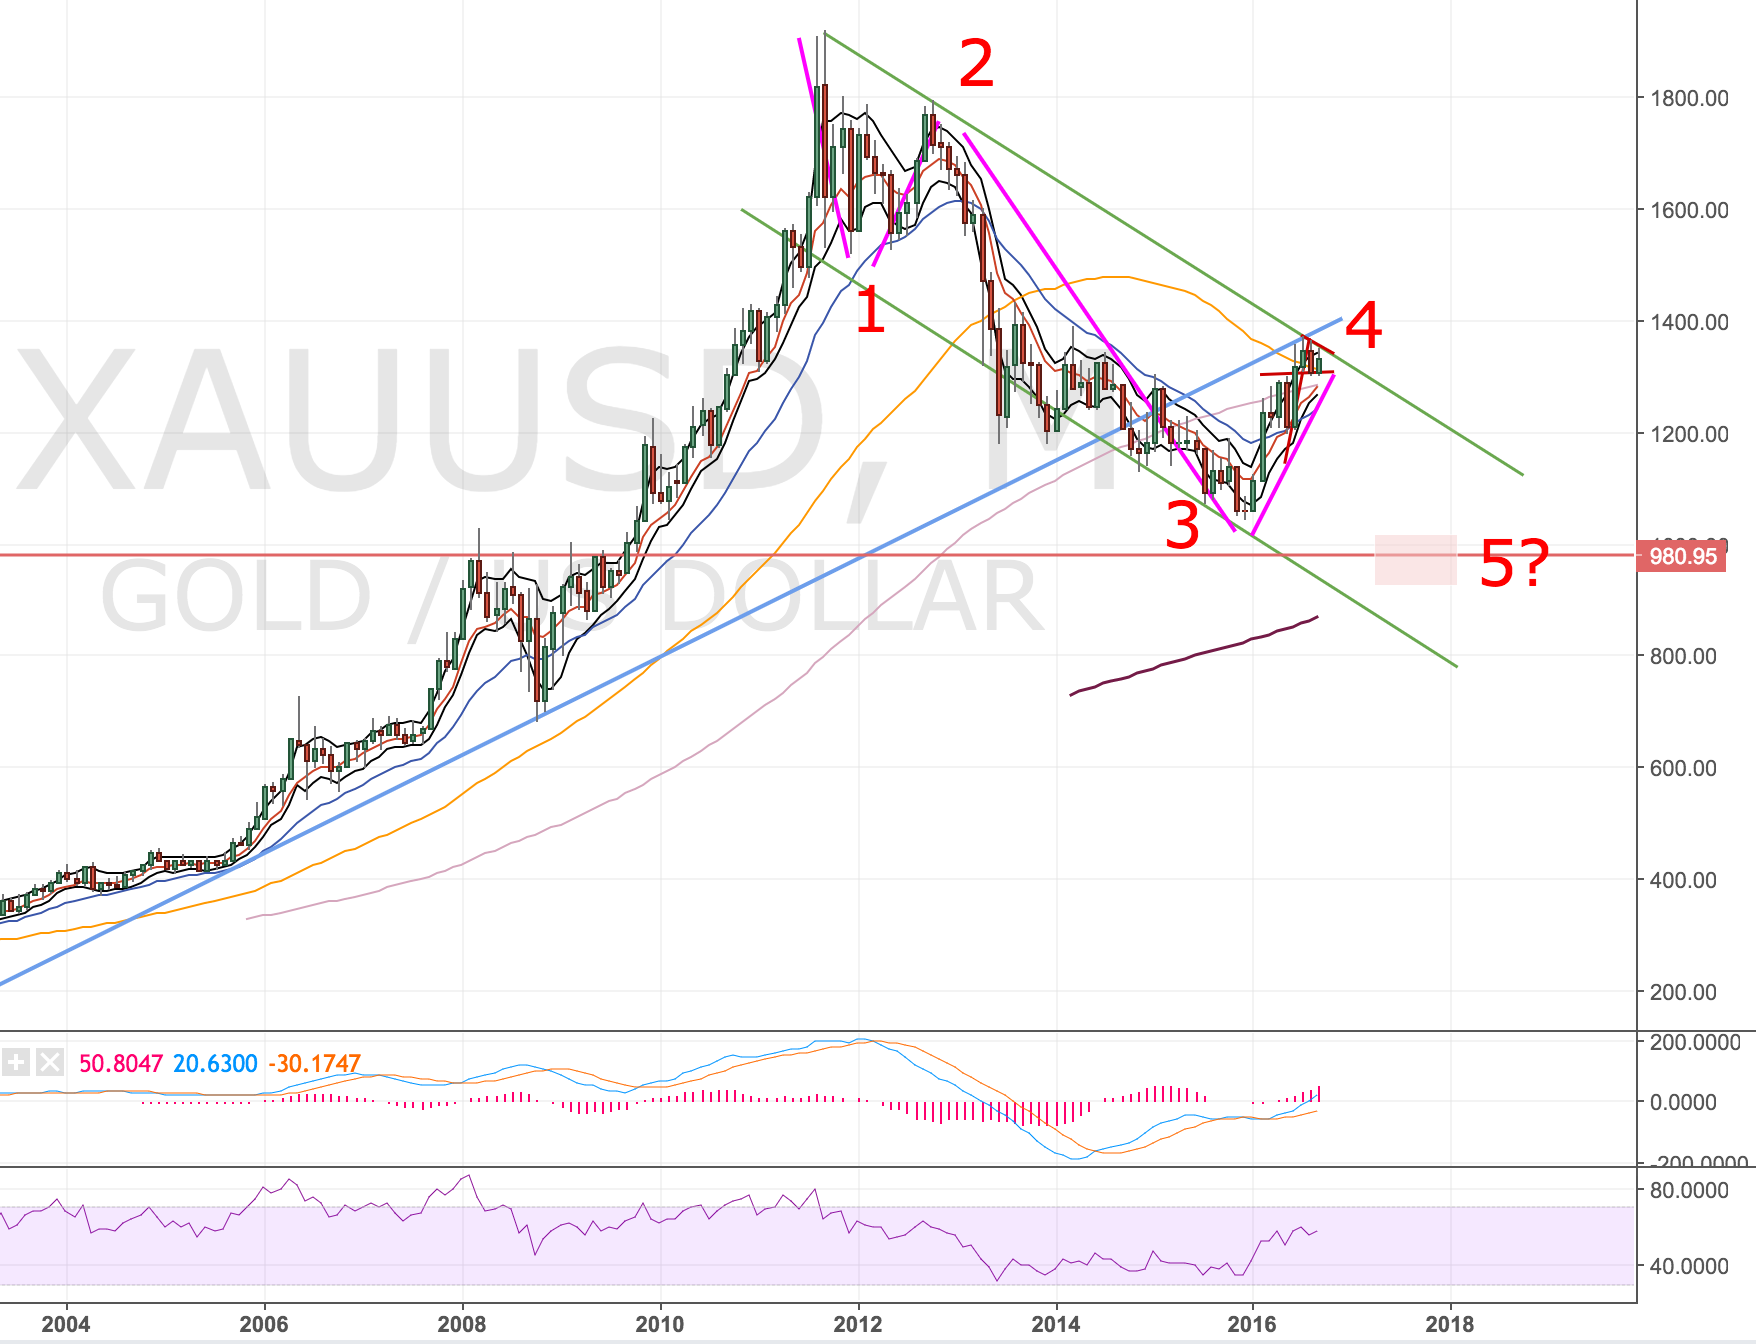
Potentially another leg down to come.
I’m not a confident on elliot waves but I think I can count a fairly realistic 4 of 5 waves down. Based on this I’ve marked a potential target area at 980 for the final wave 5. There is also prior resistance from 2008/2009 but might also nicely coincide with the rising 200MA coming into view. I can see price getting to my target zone by mid to late 2017 into early 2018.
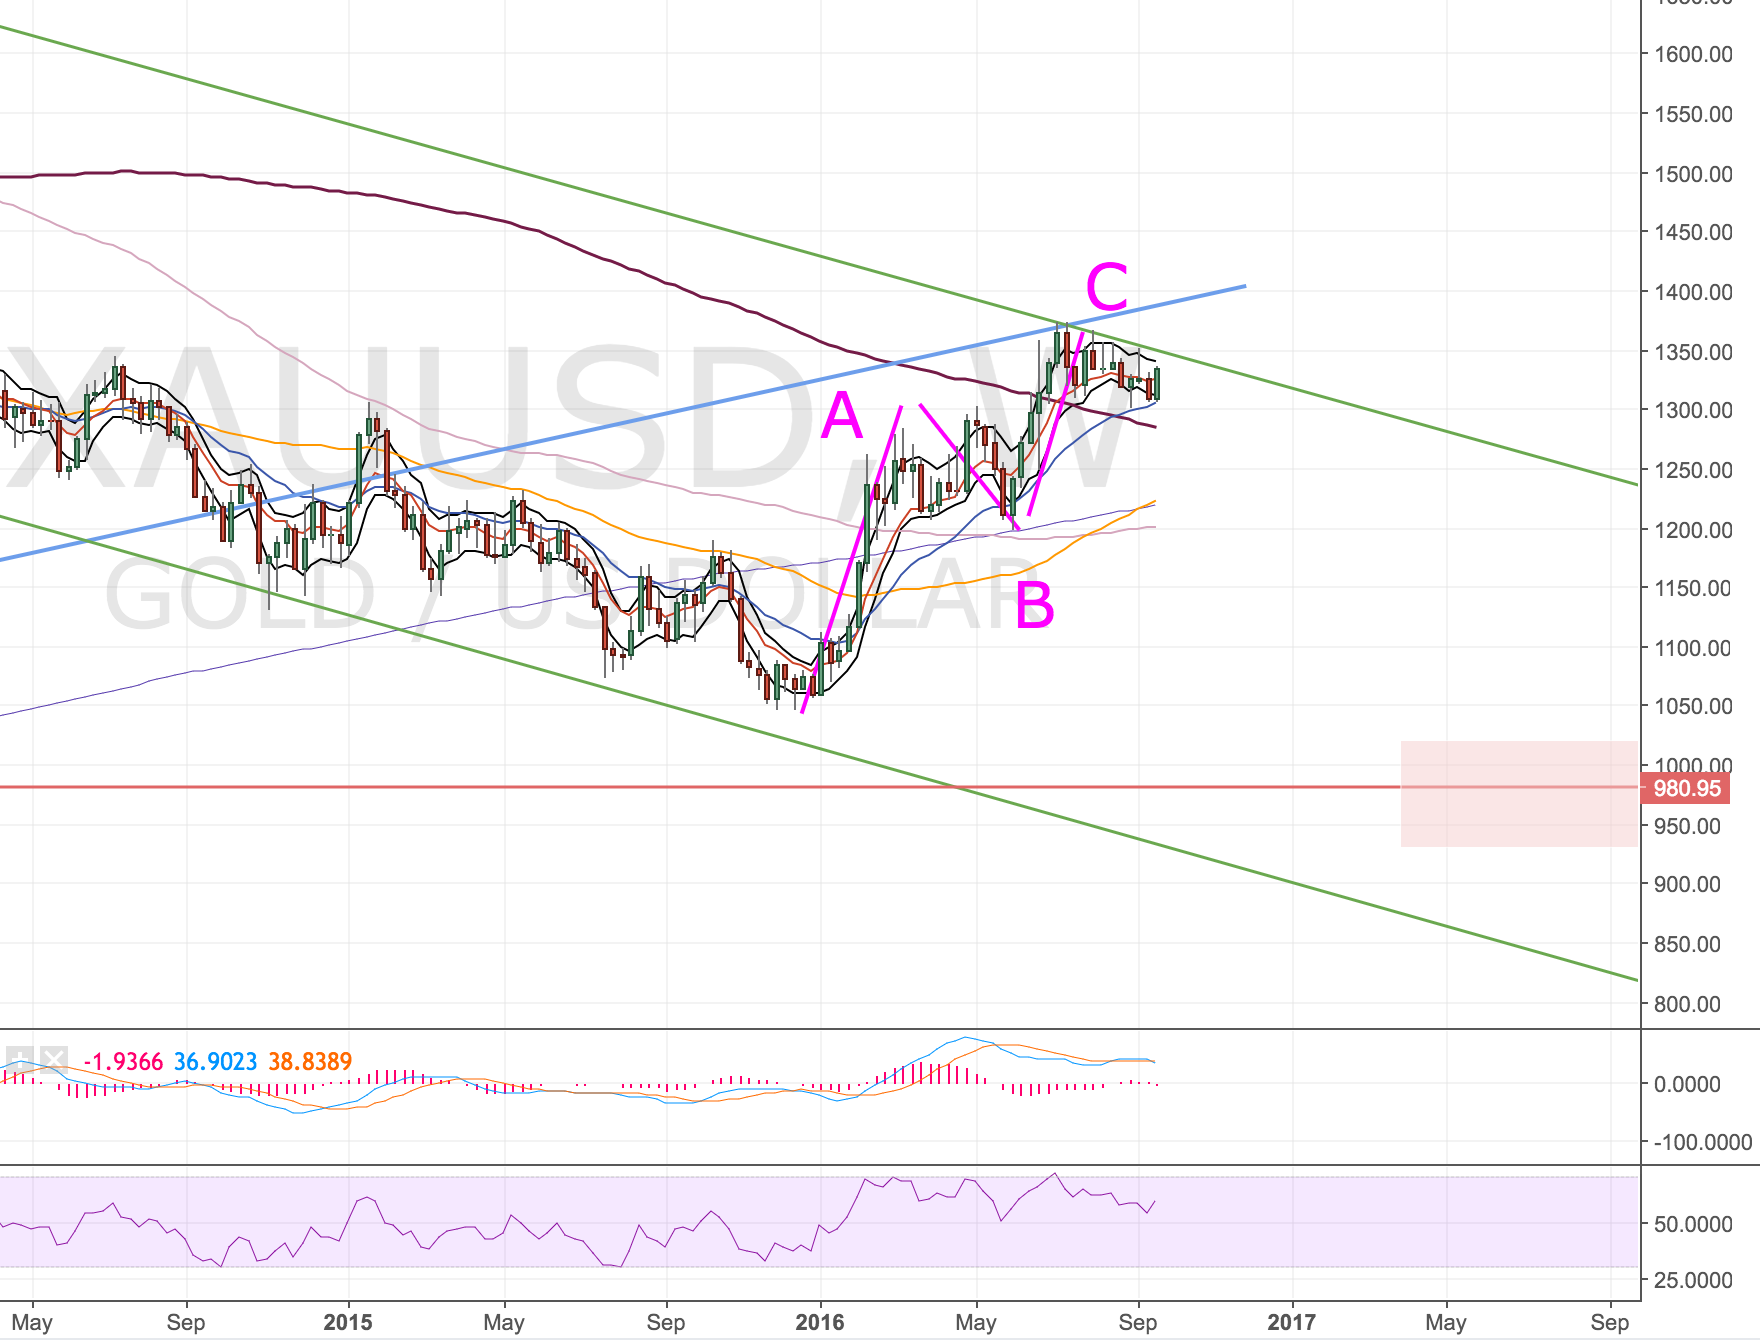
Weekly Chart
This move down might be in the early stages now. I can also see an ok A-B-C retracement to the upper trendline on the weekly chart. However there’s a couple of points of caution that point to more up-side:
- Crossed above the weekly 200MA
- MAs are pointing up
- Hand-railing of the upper trendline
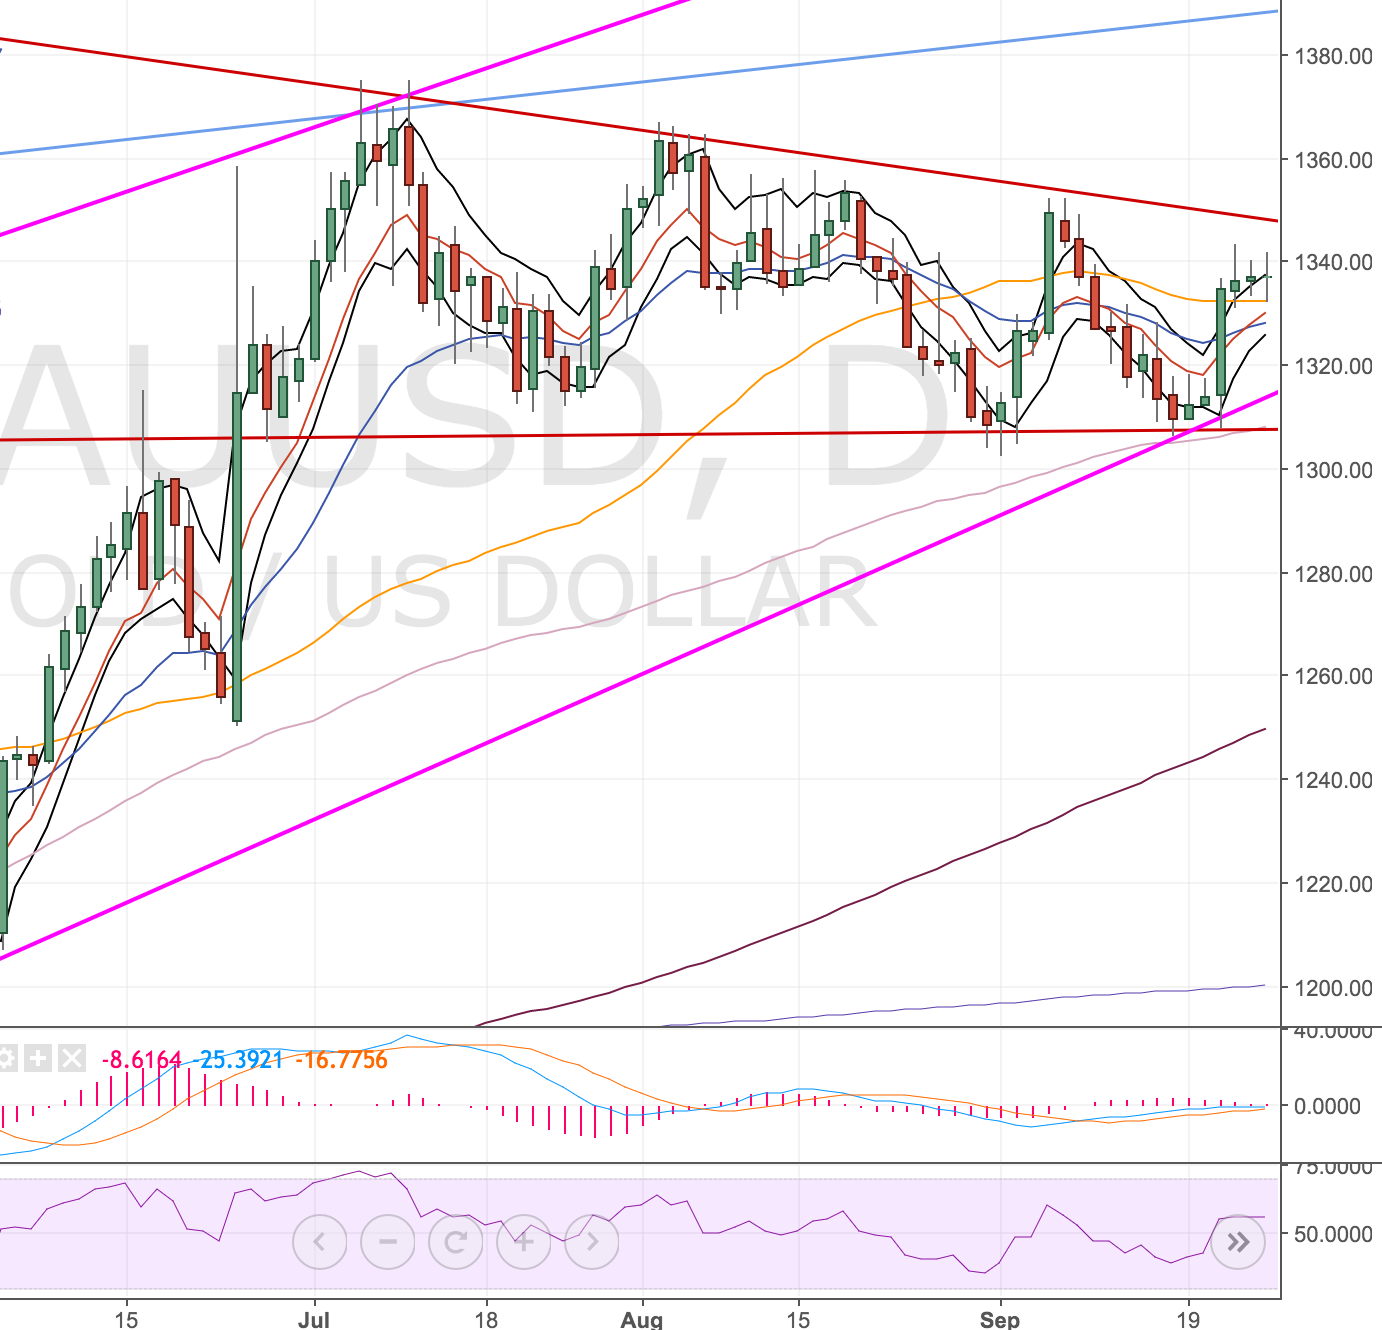
Daily Chart
So this is probably questionable trading but I actually saw a long trade that I’ve taken into resistance @ 1350.
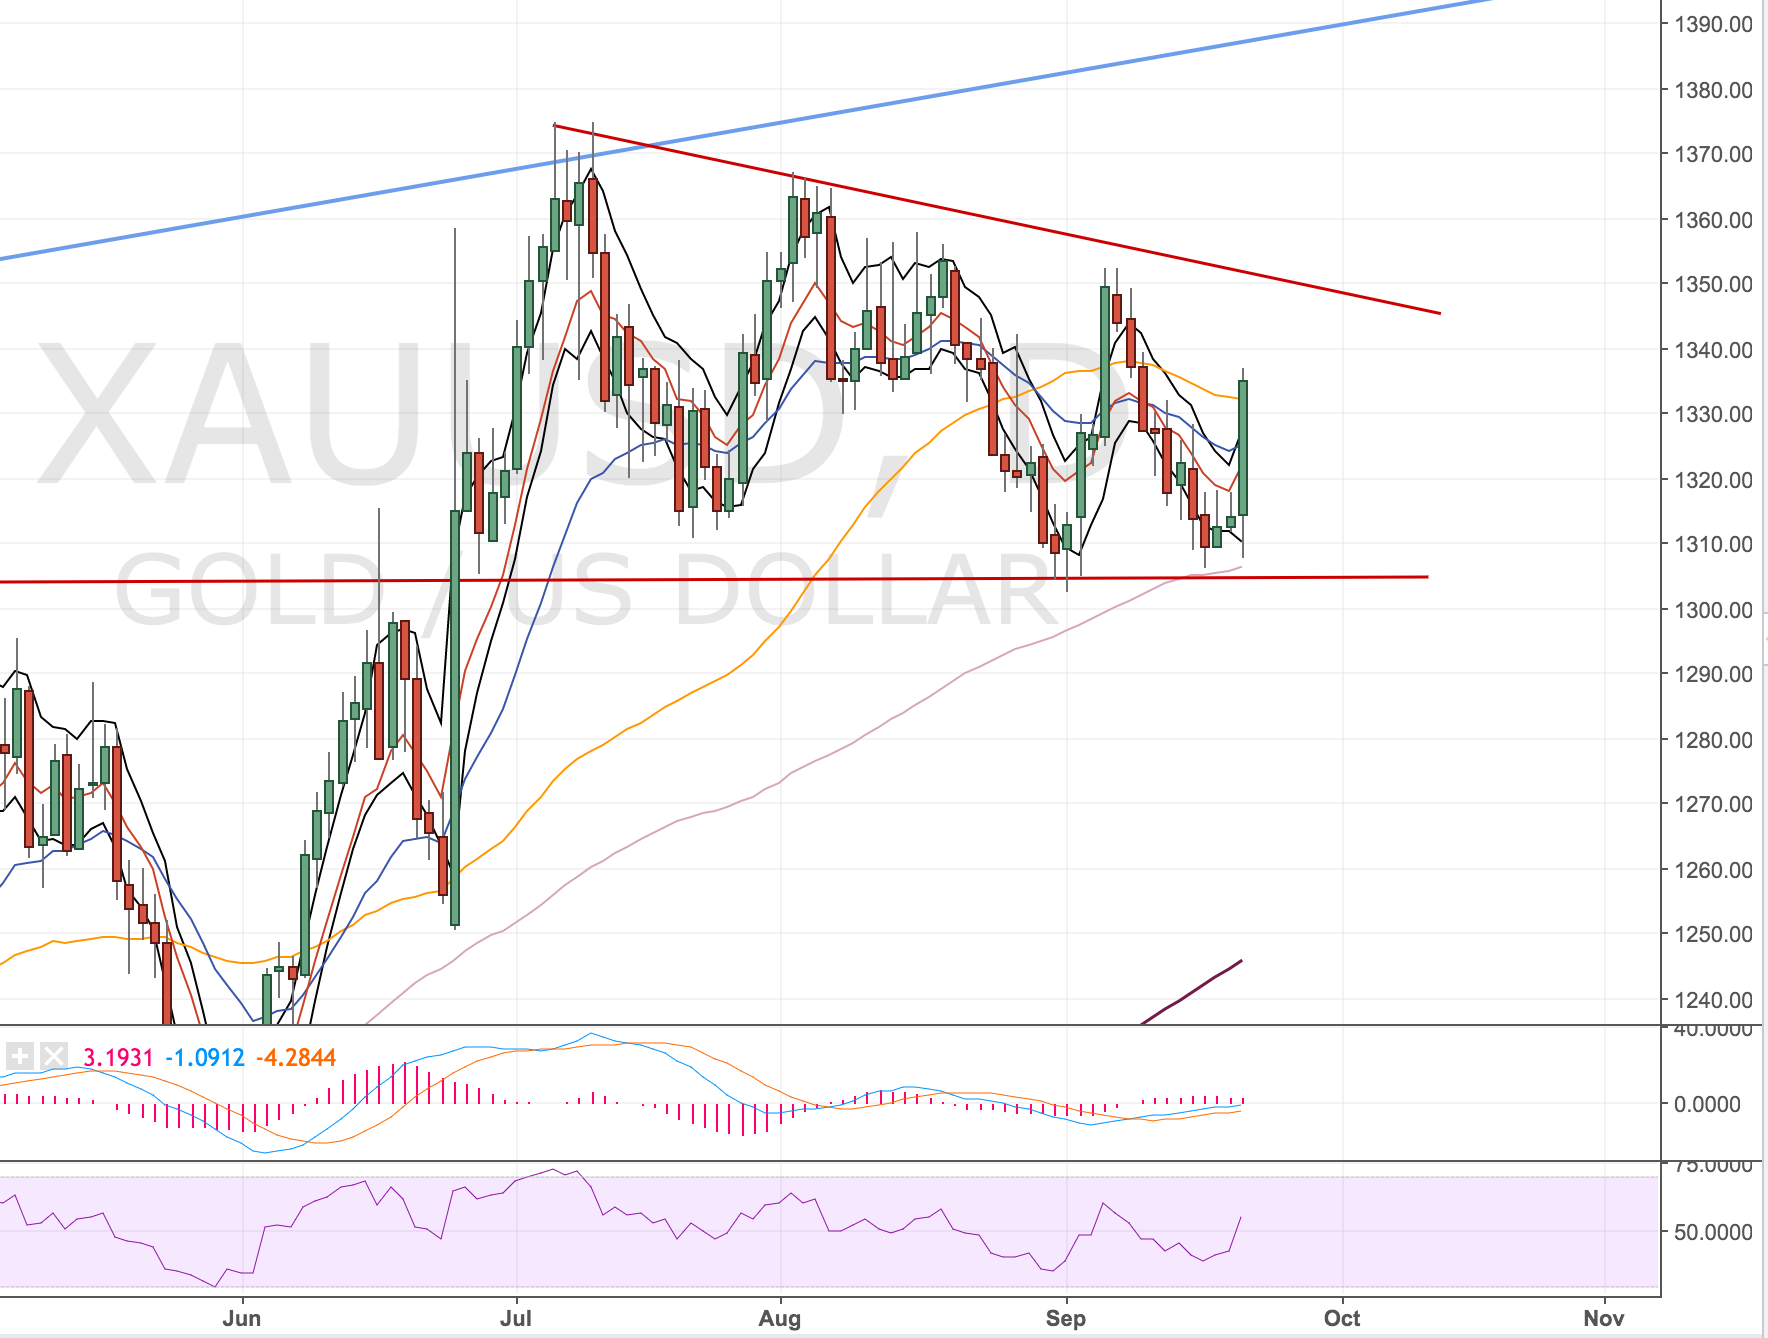
The test of the lower line of this wedge came with rising RSI which indicated to me it wants to go higher. This entry lined up nicely with the lower band being tested and the 100MA. So I took the trade long @1313 with a stop @1290 just below prior resistance.
It’s worth noting, this trade was the day before FOMC (which is the most recent up bar for today) which may have been a stupid trade. However, I felt with pretty mediocre data lately it wasn’t too stupid. Not sure if this is classed as gambling? It’s hard to know what is sensible when swing trading – there always seems to be a news event that could scupper you. For now it is in my favour but sure it’ll take a few days to work up to 1350 if it does get there.
Update 27 September 2016
Price seems to have faltered to me so I closed my trade on the retest of the recent highs at 1340. What got me nervous was the series of daily spinning top candles into the bands hugging the 50 MA.
I often wonder whether I should always let stops take me out rather than arbitrary decisions? Probably yes, you never really know which way the market will go.
On the 4H chart, which I didn’t check at the time (why? I don’t know), the price action is showing divergence so maybe that wasn’t such a bad call.
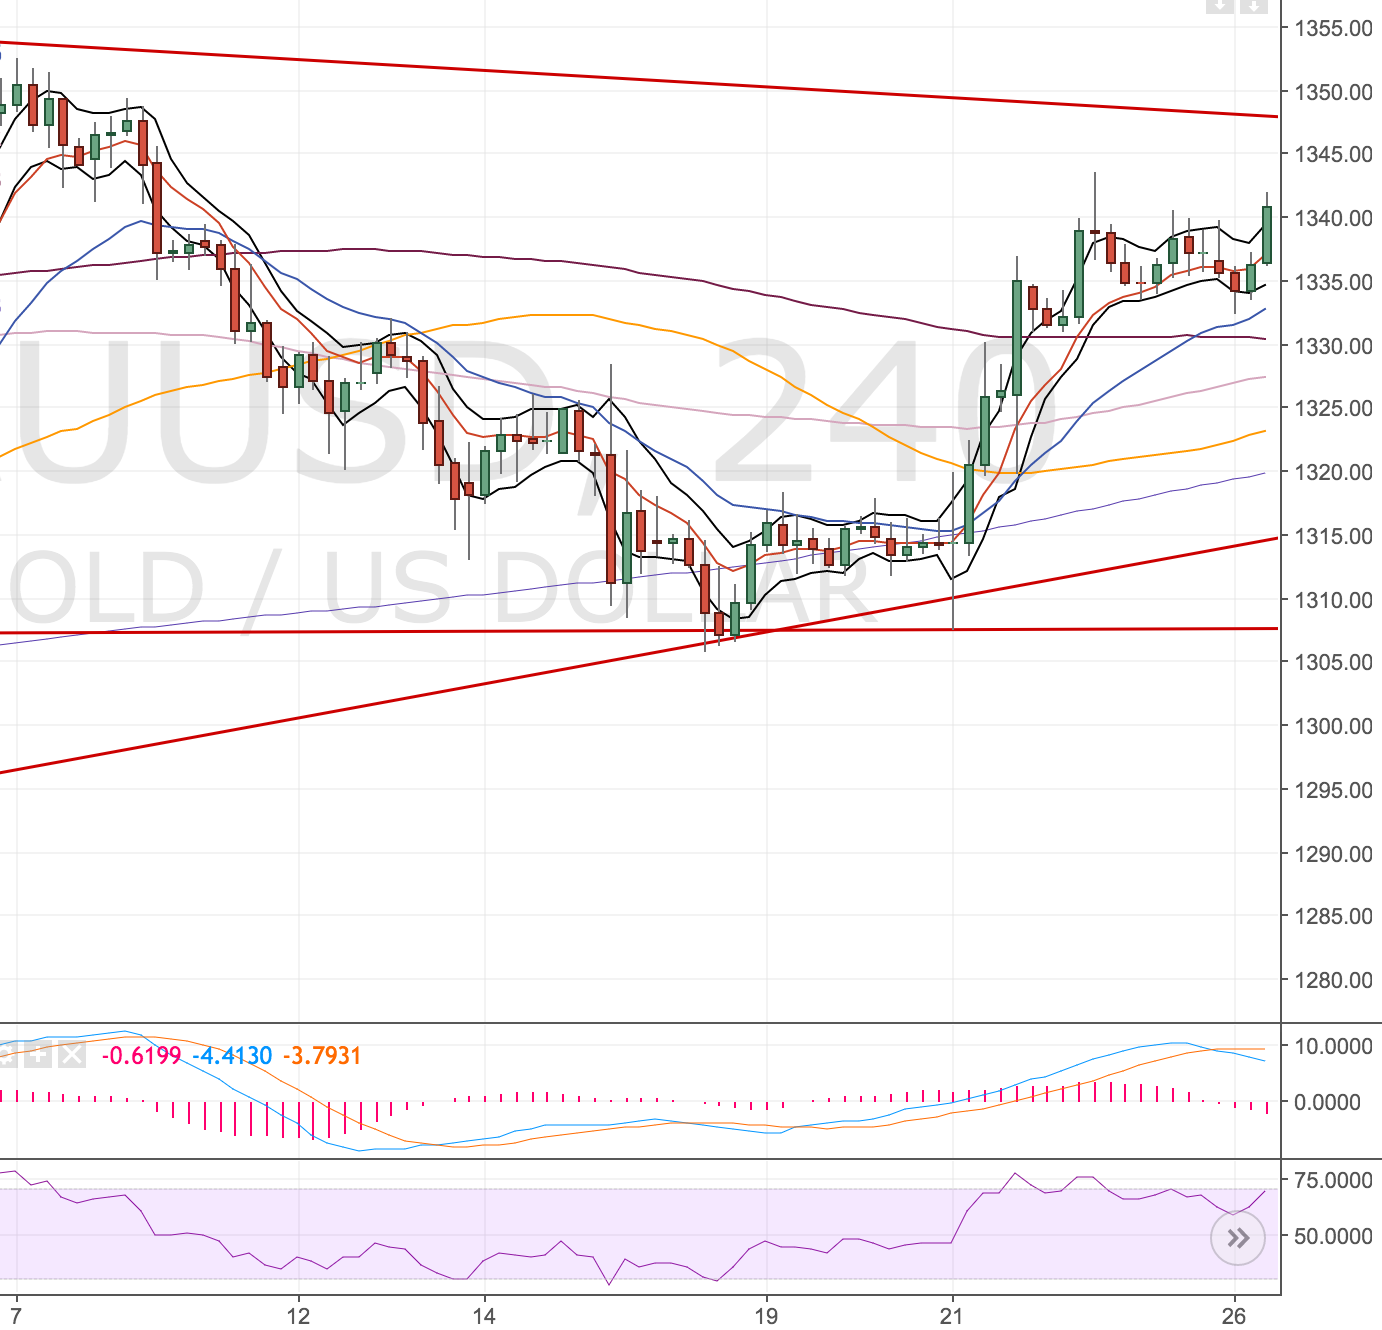
Some profit banked which is good.
In summary, this is how I feel about the trade:
Good
- Entry on a trendline support coinciding with the bands
- Rising momentum on the trendline support
Not so great
- Long term analysis pointed to the downside
- Overhead resistance at the 50MA