Last updated 10:00, 17 Dec 18
Review
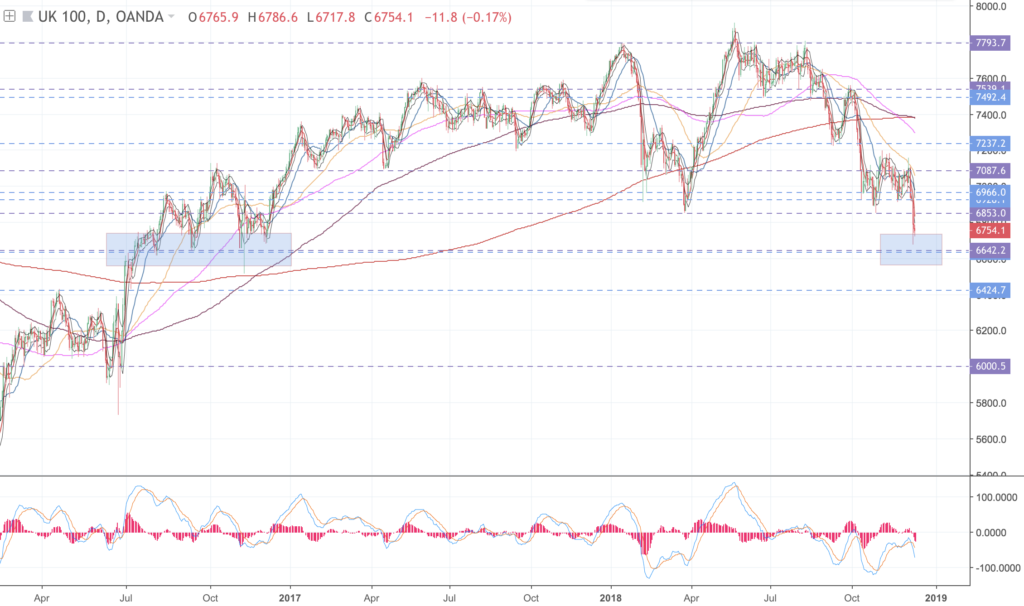
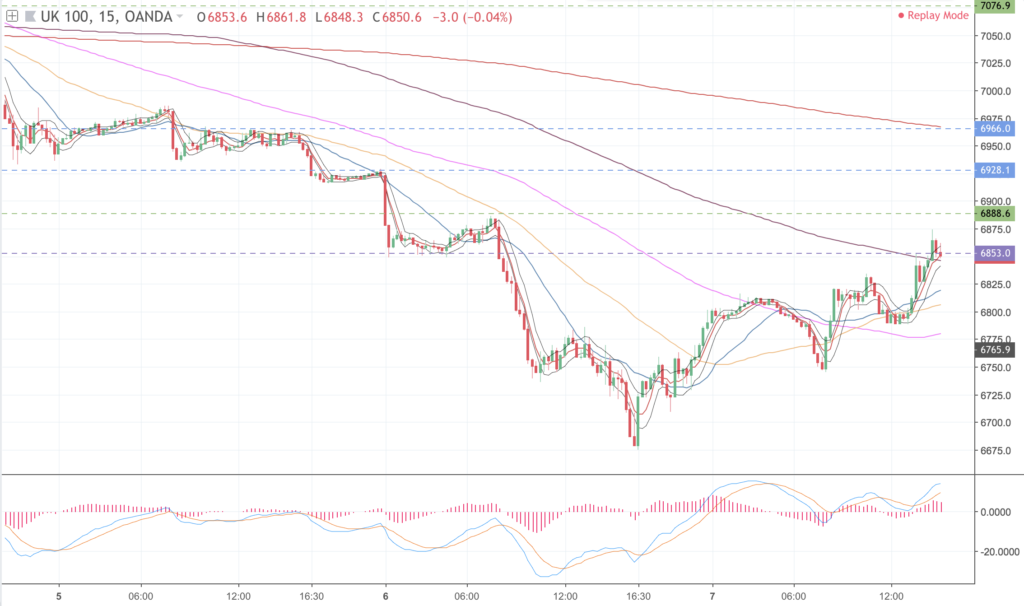
Two trades last week, nothing too exciting. A FTSE short and a USDJPY short.
FTSE 15M Short @ 6876.3, risk 0.75%, result -£56.10
Strayed off plan, was at home and saw the FTSE running up to a key level of prior support. Took a 15min divergence at that level. Looks like I took the trade early we moved up another level before ultimately rolling over.
I was tempted to hit the set up again but didn’t because I don’t trade 15min timeframes. I shouldn’t have taken the trade, would’ve been micromanaging, didn’t have a clear exit.
We’re just shy of a key weekly level 6640. So looking for a retest lower.
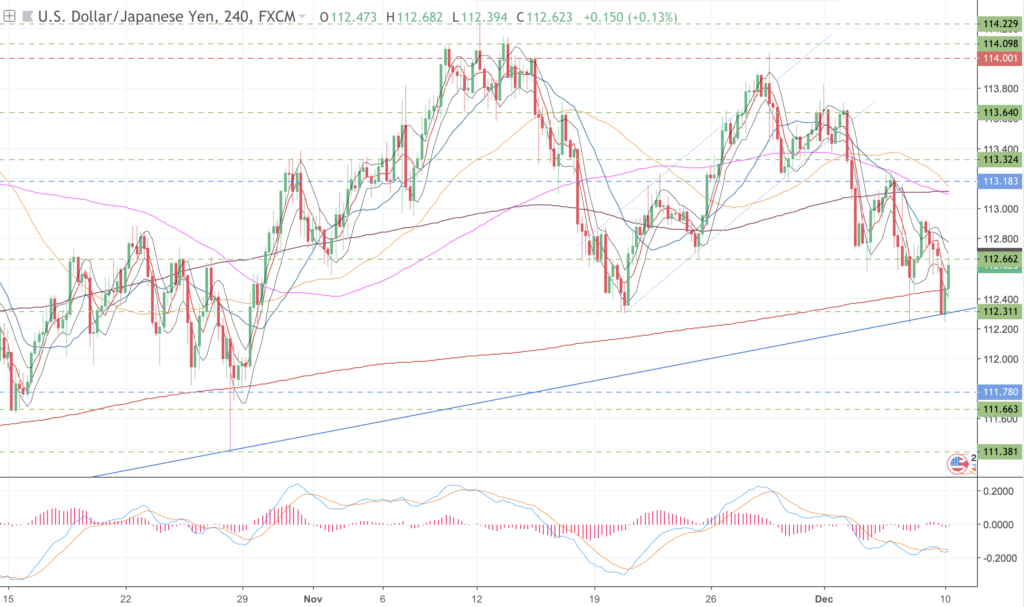
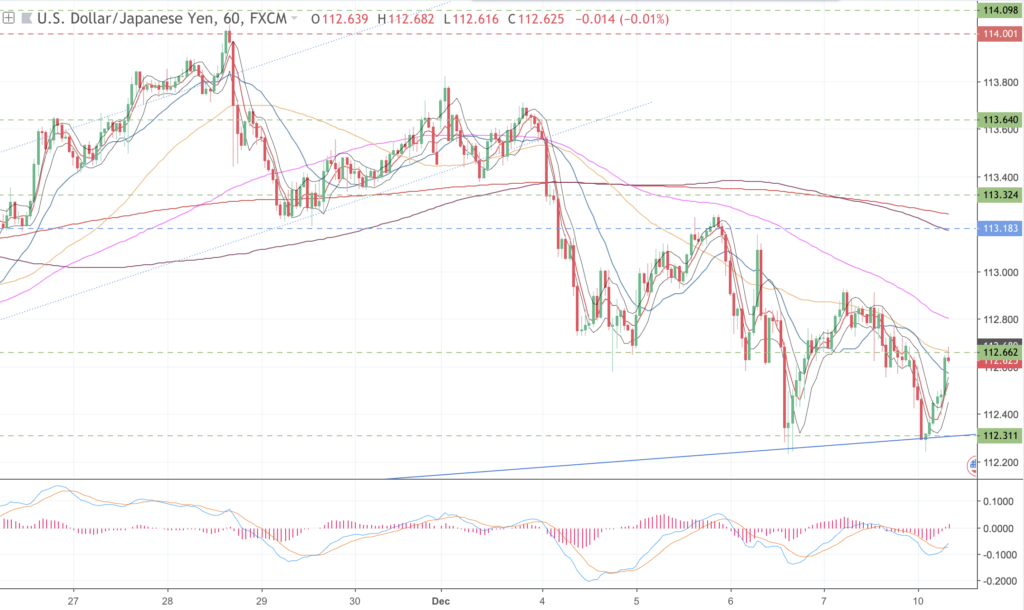
USDJPY 1H Short @ 113.321, risk 0.85% result £28.32
Short took ages to breakdown, but did break to target. Ran it slightly longer than DST target, spotted a nice prior swing point a little lower down. Ultimately wanted to run this much lower but didn’t see any downside targets that would’ve made it worthwhile.
Outlook
EXY
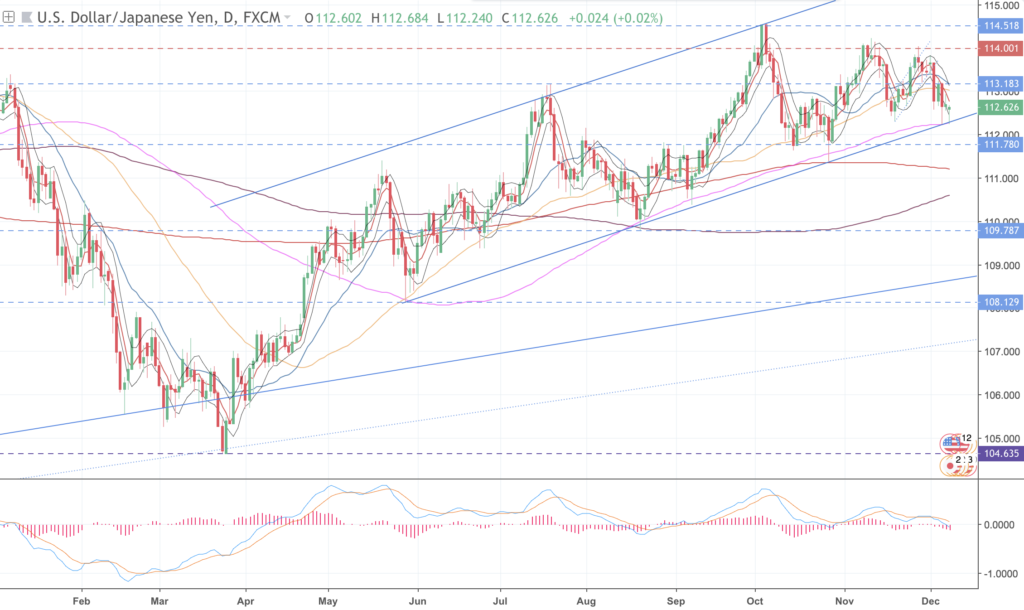
Same as last two weeks, looks bullish in the long-term, will need to watch for buy set ups from support. I think a 111 test is on the cards. This is getting long in the tooth now, so it better set up soon or I’ll need another divergence long.
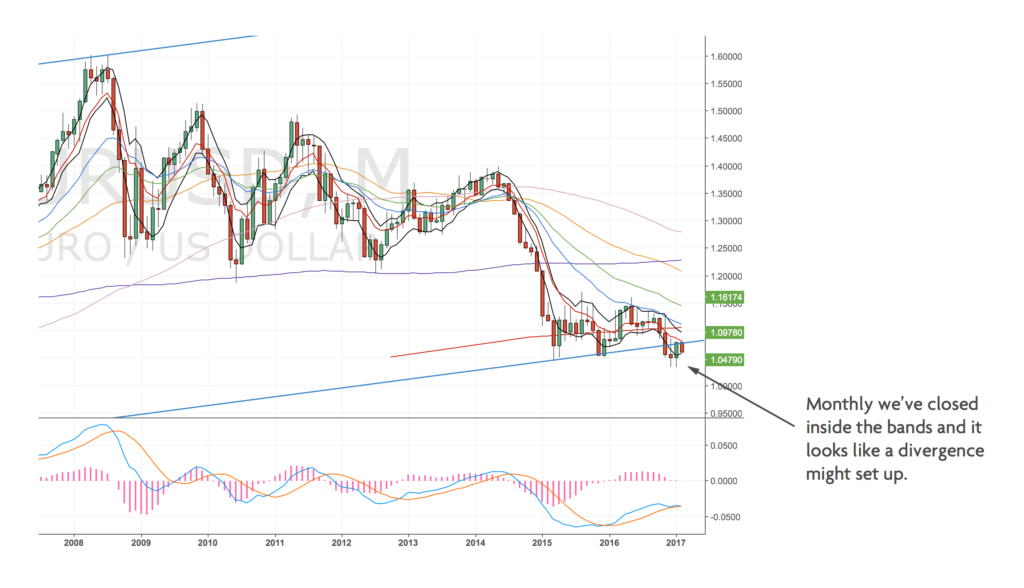
Monthly – Looks like it’ll want to head higher to the TL, pebble on a pond
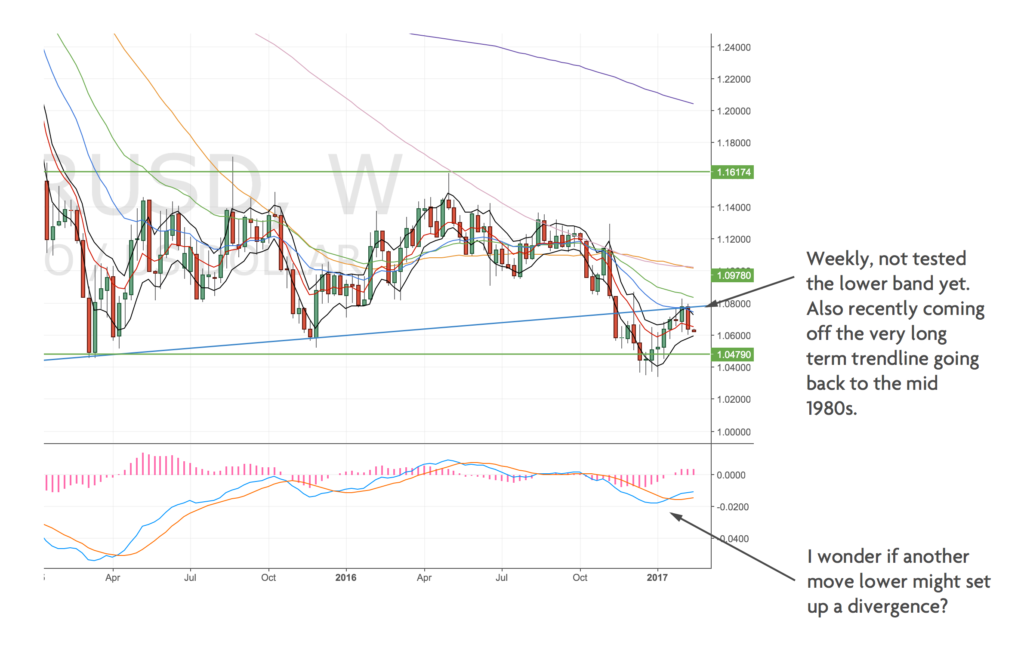
Weekly – Still looking for the 111s
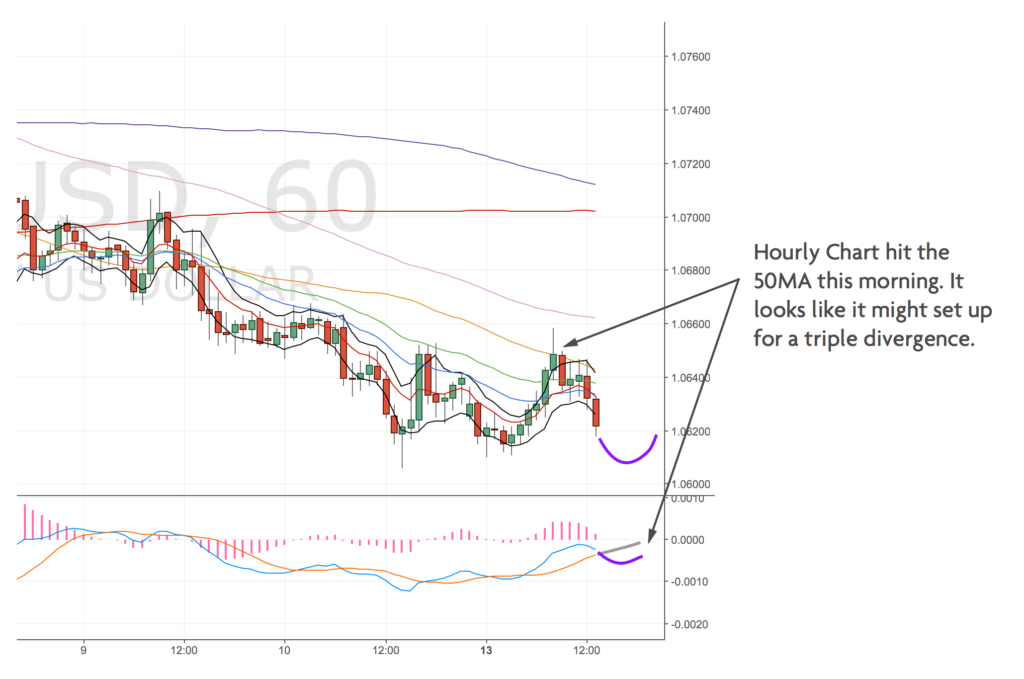
Daily – Double divergence in play. Any moves down to the 111s would be a solid buy if the divergence is intact.
DXY
Looking bearish to me, lower TL tested many times diverging at the highs. The 100s don’t look likely until mid to late next year. Double daily divergence in play, hence why I’ve reduced my target on USDJPY. Any tests of the 97.5s would be shorts for sure.
Monthly – Looking for DXY to hit 100 – prior resistance and TL touch (could take months/years)
Weekly – Similar pattern – forming a head and shoulders at around 100
Daily – We have a double divergence in play, any moves to the 97.5s are shorts.
4h – Upside looks to be short lived right now. Low 97s would be a result.
JXY
Right now expecting Yen to either diverge at the lows and move higher or continue down. This needs monitoring. Longer term lower (much lower – 84s), still look for shorts in to the 90s, longs into divergence @ 87s
Monthly – Looks bearish. Retesting the m50 but rallies have been limited and price is struggling to move higher. Any move to the 90s would be shortable (other side of the trendline).
Weekly – Have retested the lower trendline but could see some MA ping pong and another retest into the 90s.
Daily – Looks like we’re heading lower. Might diverge at the 87s and then retest the highs at 89. Expect this to ultimately roll over.
BXY
BXY has broken the double divergence, it now looks bearish and set up for my downside to 124s for a small bounce and the a retest of the 121 Brexit lows. Look to short set ups.
Monthly – Prior TL that will probably get tested at some point in 2019-2020. If May loses the vote look for 121s otherwise a move to test the TL.
Weekly – Broke the 127s now looks likely for a test of the 121s.
Daily – 124s for a bounce, then a retest of the 121s. DXY looks bearish to me so would need an alternate pair for this trade.
CXY
CXY looks bearish to me, broken the TL and looks like we’re set for more downside.
Monthly – Hand-railing the m50 would expect it to clear and head to 82 – 86s
Weekly – Checking the TL this looks bearish to me. There’s a couple of closes below, no divergence in sight.
Daily – Looks bearish, I’d favour sticking with the dollar for now at least that is holding pattern.
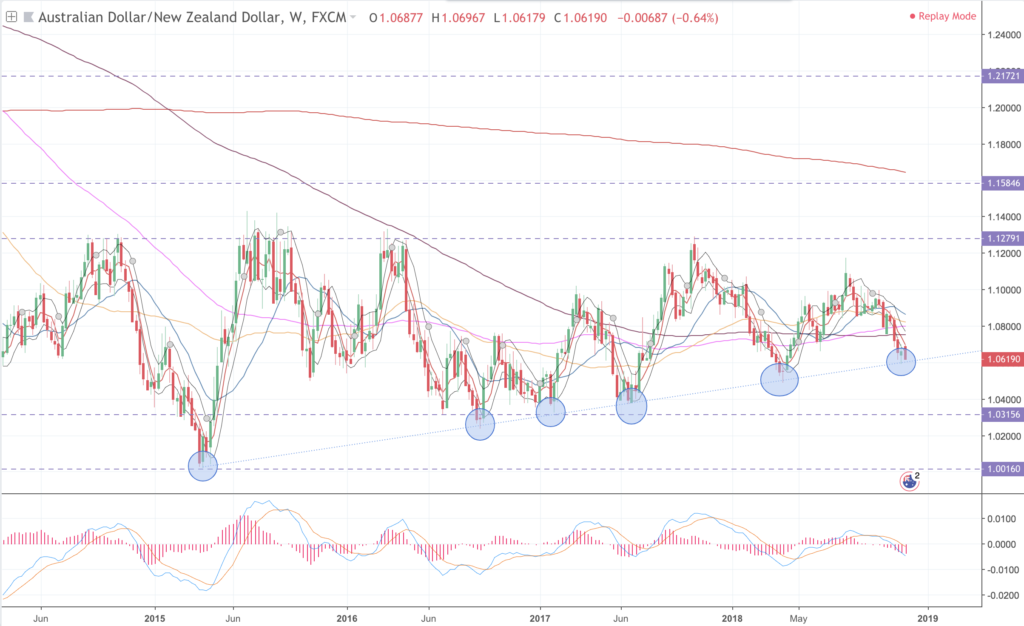
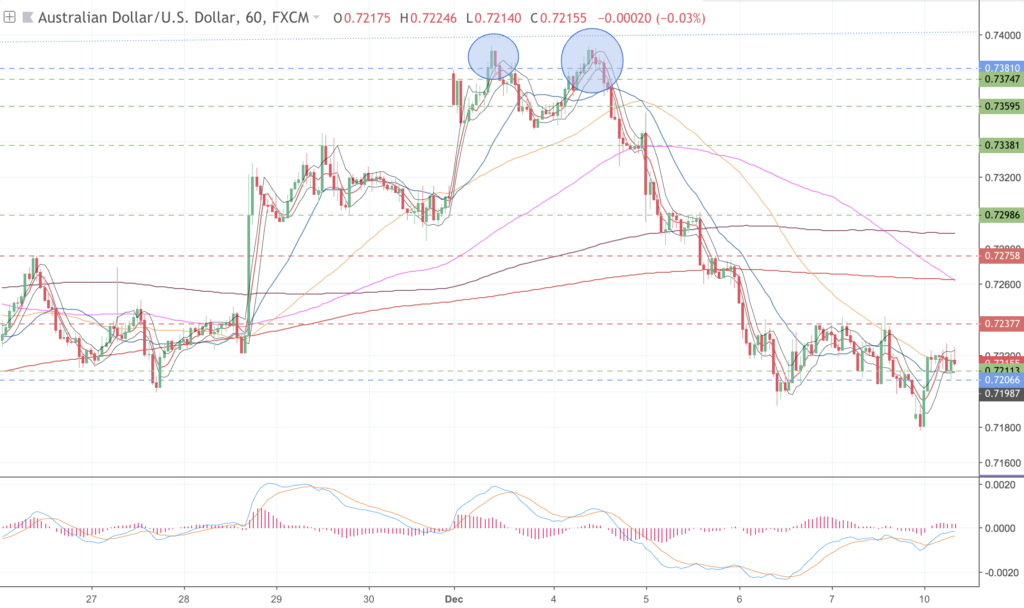
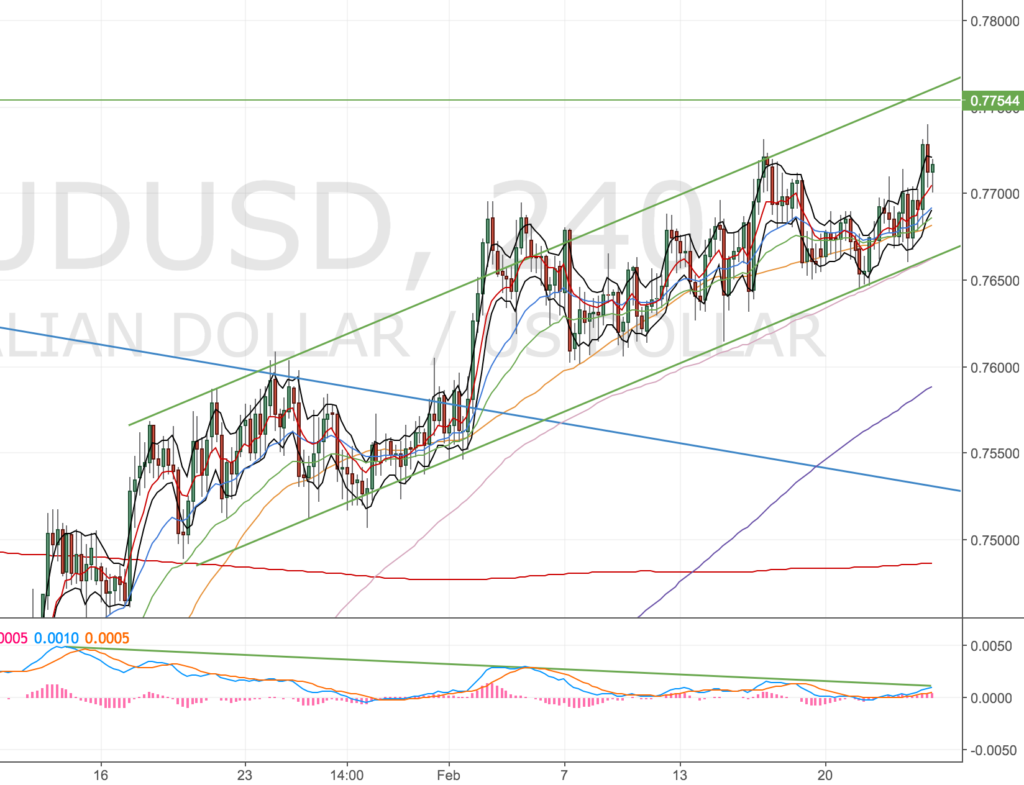
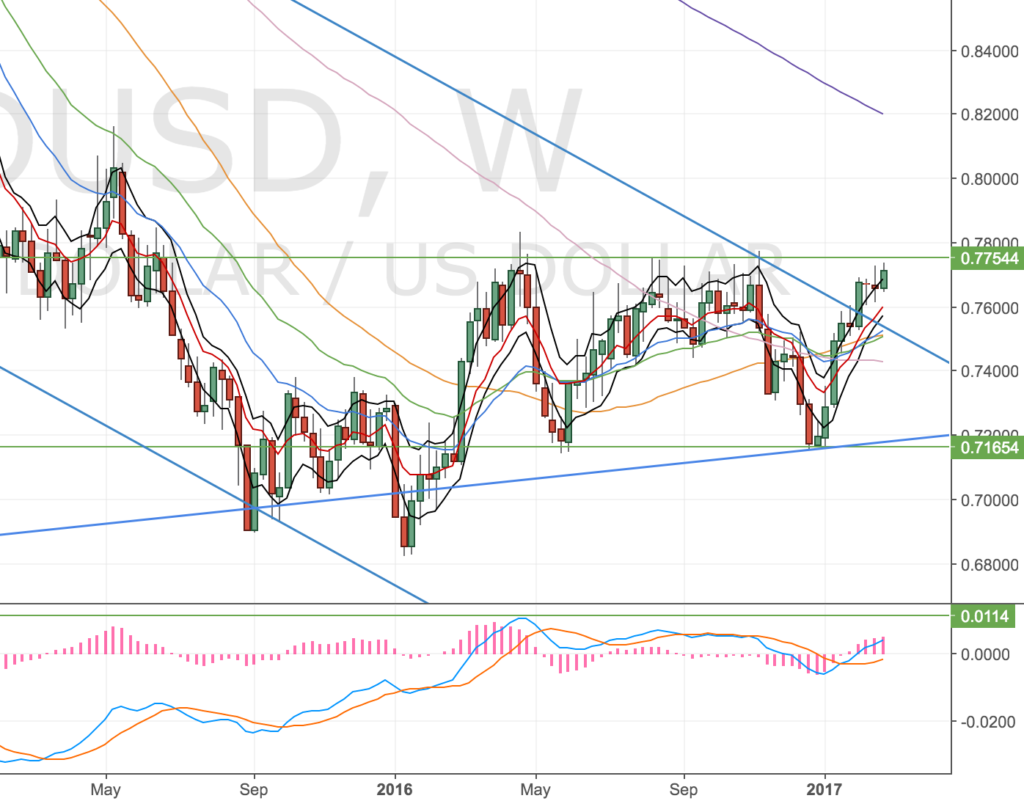
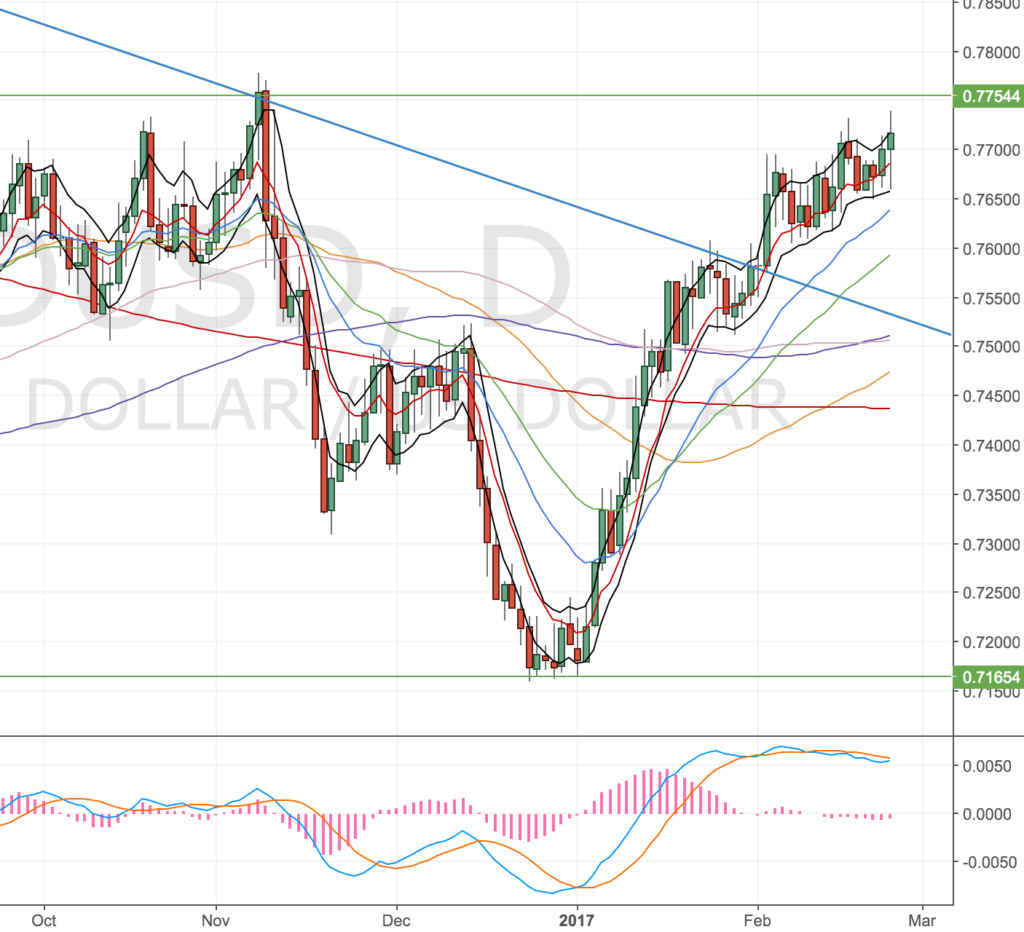
AXY
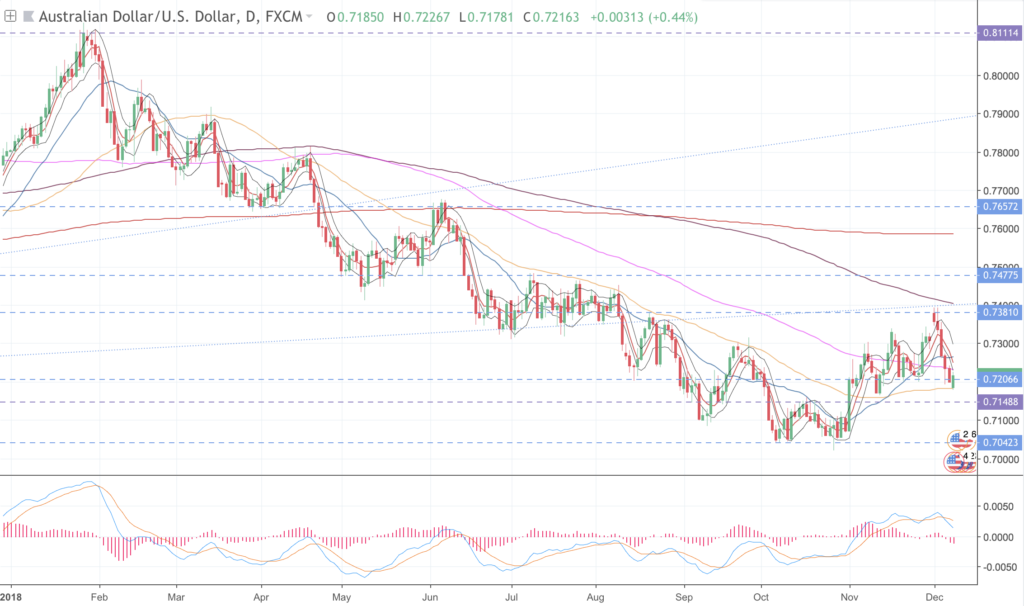
Might get a bounce this week, don’t get too excited about it.
Monthly – Looks bearish for now. I think it could set up a decent divergence long at some point. Look at 69s and 63s.
Weekly – Look out belowwwwww! Maybe a bounce at the 69s.
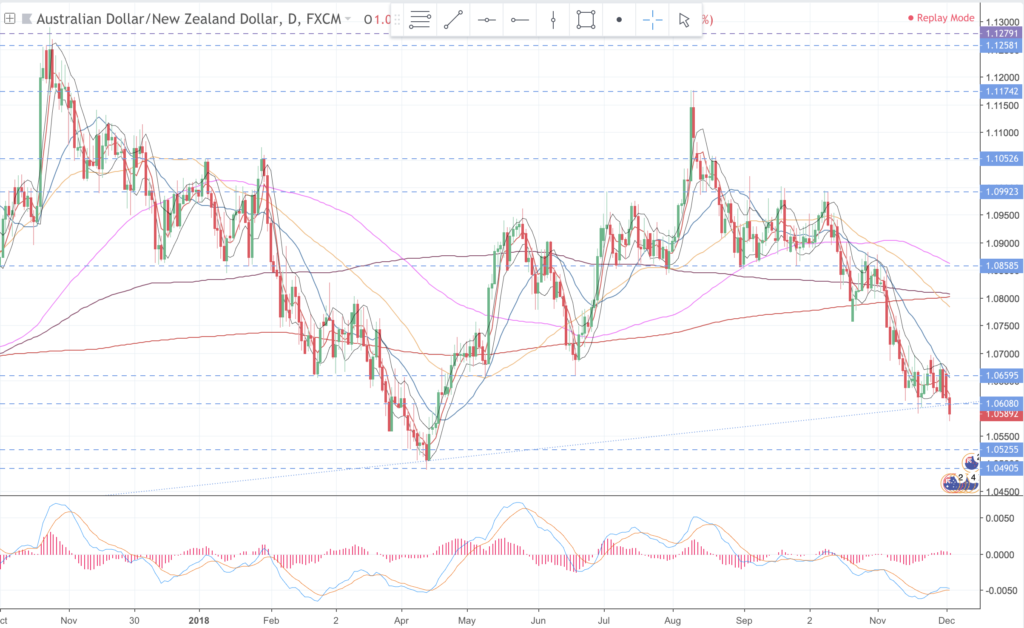
Daily – MIght get a bounce to 72s, look for a short set up from there.
ZXY
Looking for a bounce on the kiwi
Monthly –
Weekly –
Daily –