Risk: 0.55%
Short: 7547.8
Stop: 7591.3 (44 pips)
Target: 7465.5 (4h100, 82 pips, 1.87 RR)
Mindset: Nice set up. Divergences on multiple timeframes
Updates
Stopped out, but still looks good – 2 June
Missed a second entry by 3 pips! 🙁 – 2 June
Sometime later – 9 June
I’ve been watching the FTSE for a while, I’ve had a number of opportunities to get short and haven’t done very well getting my entries. There’s such a big difference between seeing a trade (especially in retrospect) and actually making money out of it. (E.g. Spikes taking you out and you not being around to get back into the trade, waiting for a better entry that doesn’t get triggered, trading the wrong market, etc etc.)
The FTSE has been looking great on a number of timeframes for a short and I’ve missed the boat on one of these trades already. So I was pleased to get another set up come along. We had a divergence (double) forming on the weekly (not in yet), another double on the daily (currently active) and a 4H & hourly divergence! Set ups don’t really come better than that, right?
I’ve been losing quite a bit lately so I’m trading tighter now (only taking a divergence when confirmed on another timeframe) and looking for correlation on other markets.
FTSE Monthly Chart
A marginal divergence might form this month?
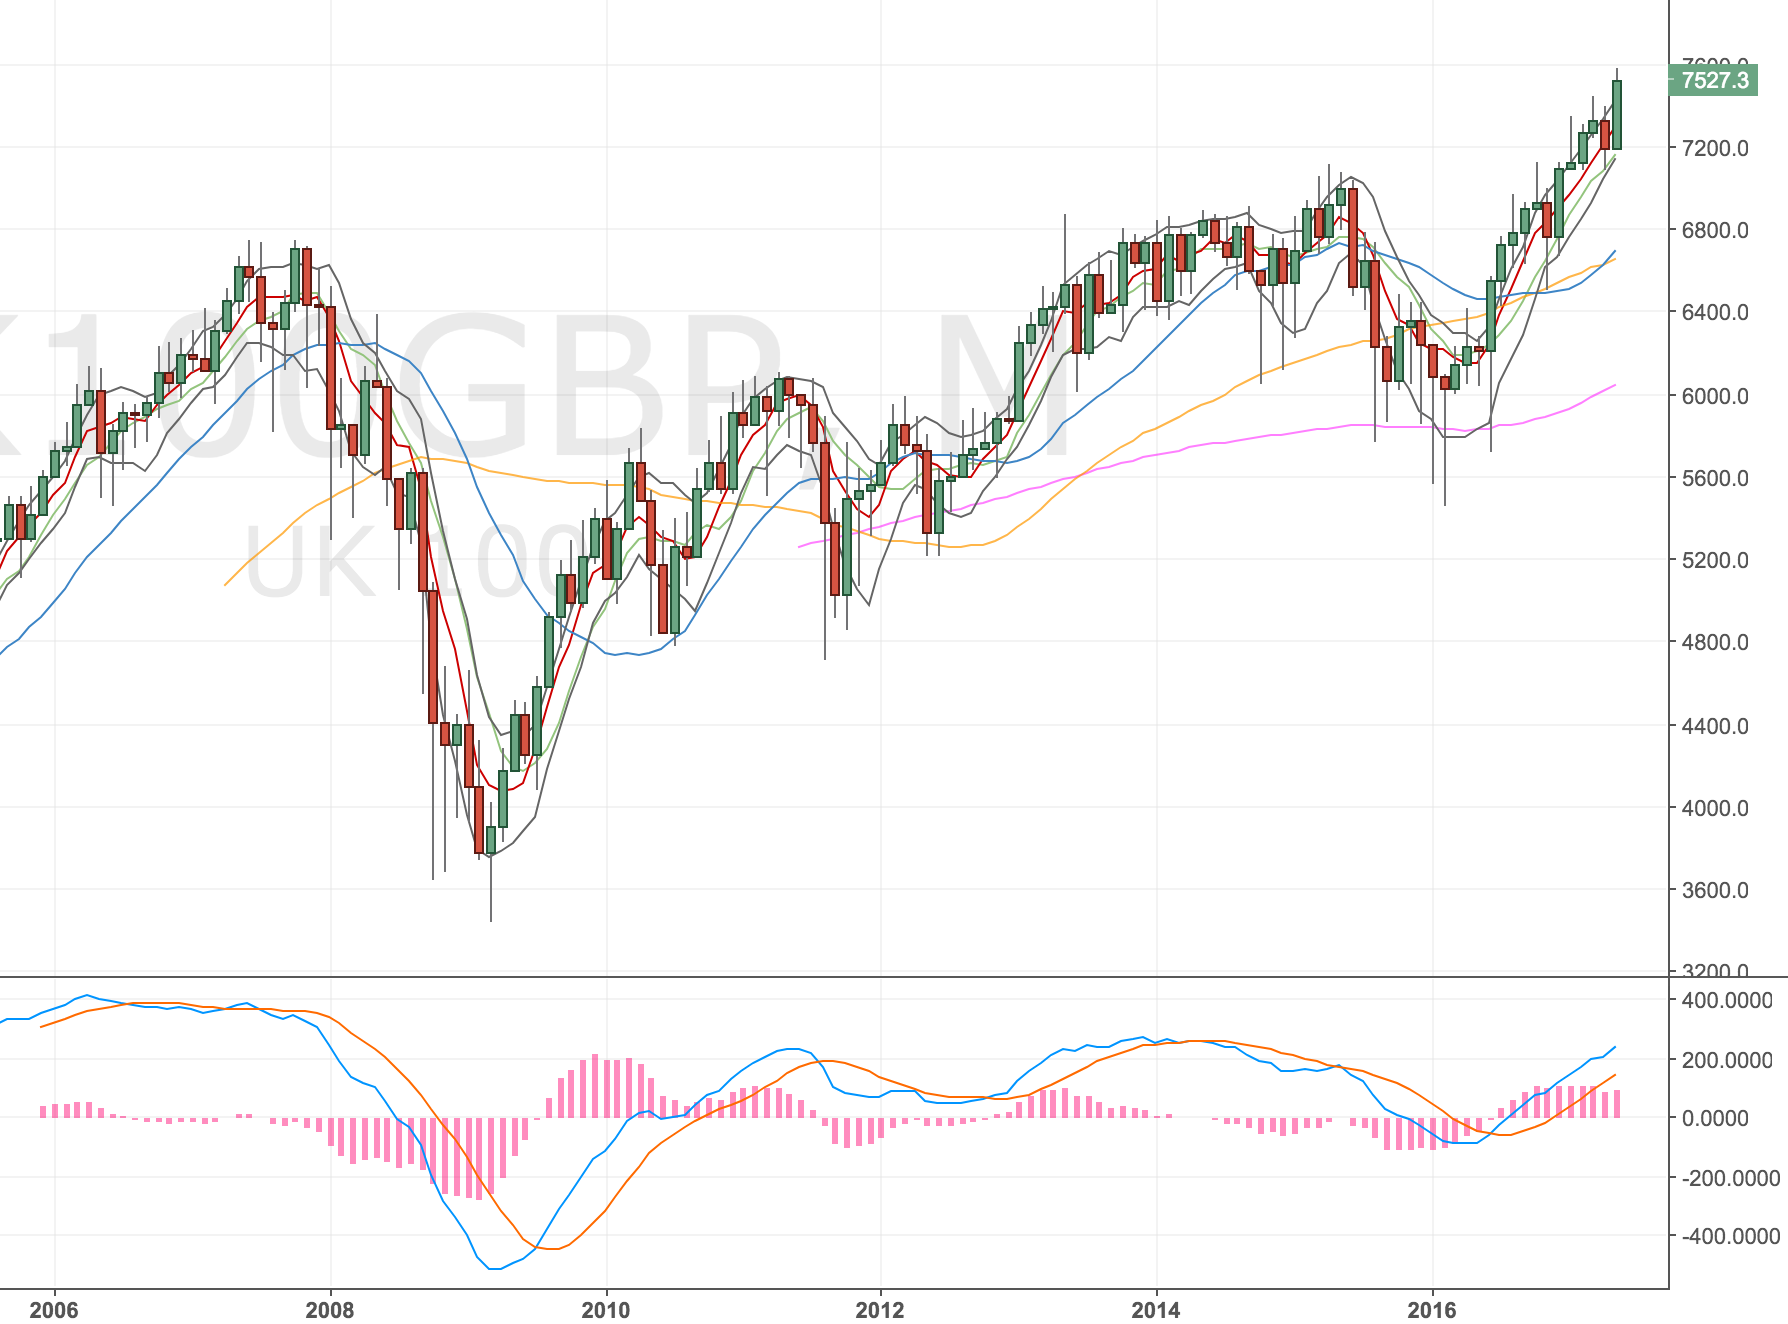
FTSE Monthly Chart – 1 Jun 17
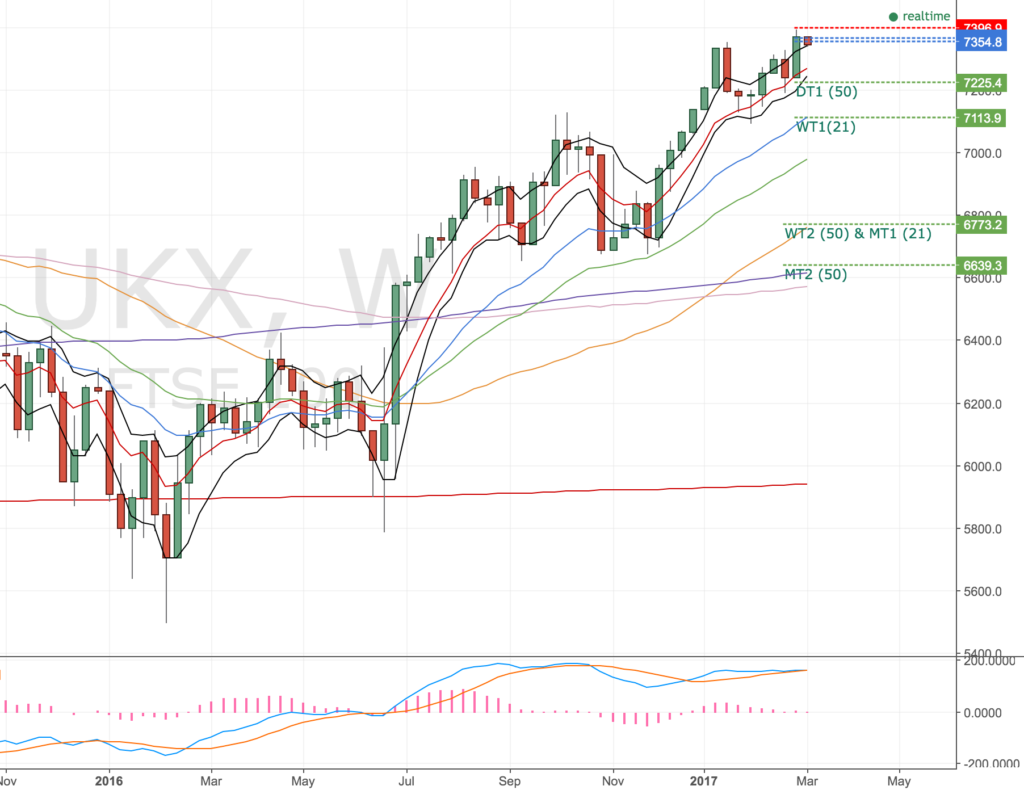
FTSE Weekly Chart
A double divergence may form here.
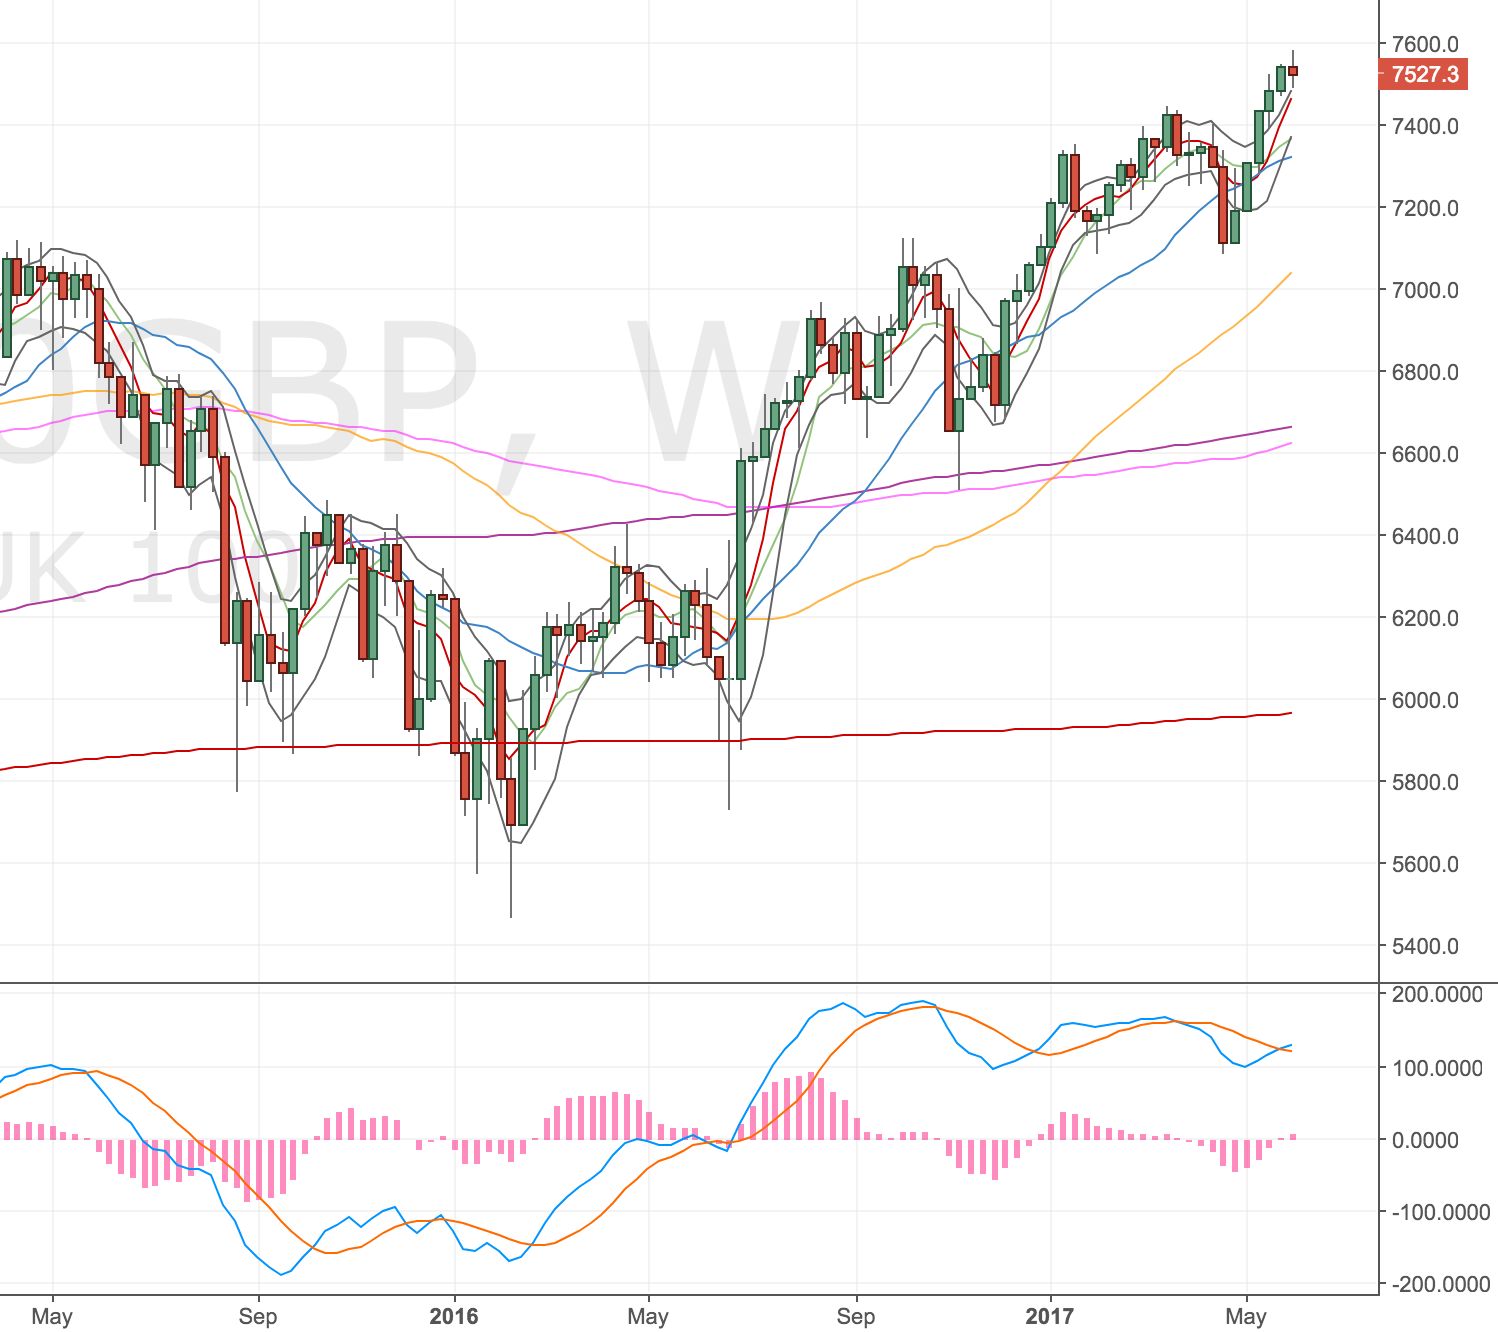
FTSE Weekly Chart – 1 Jun 17
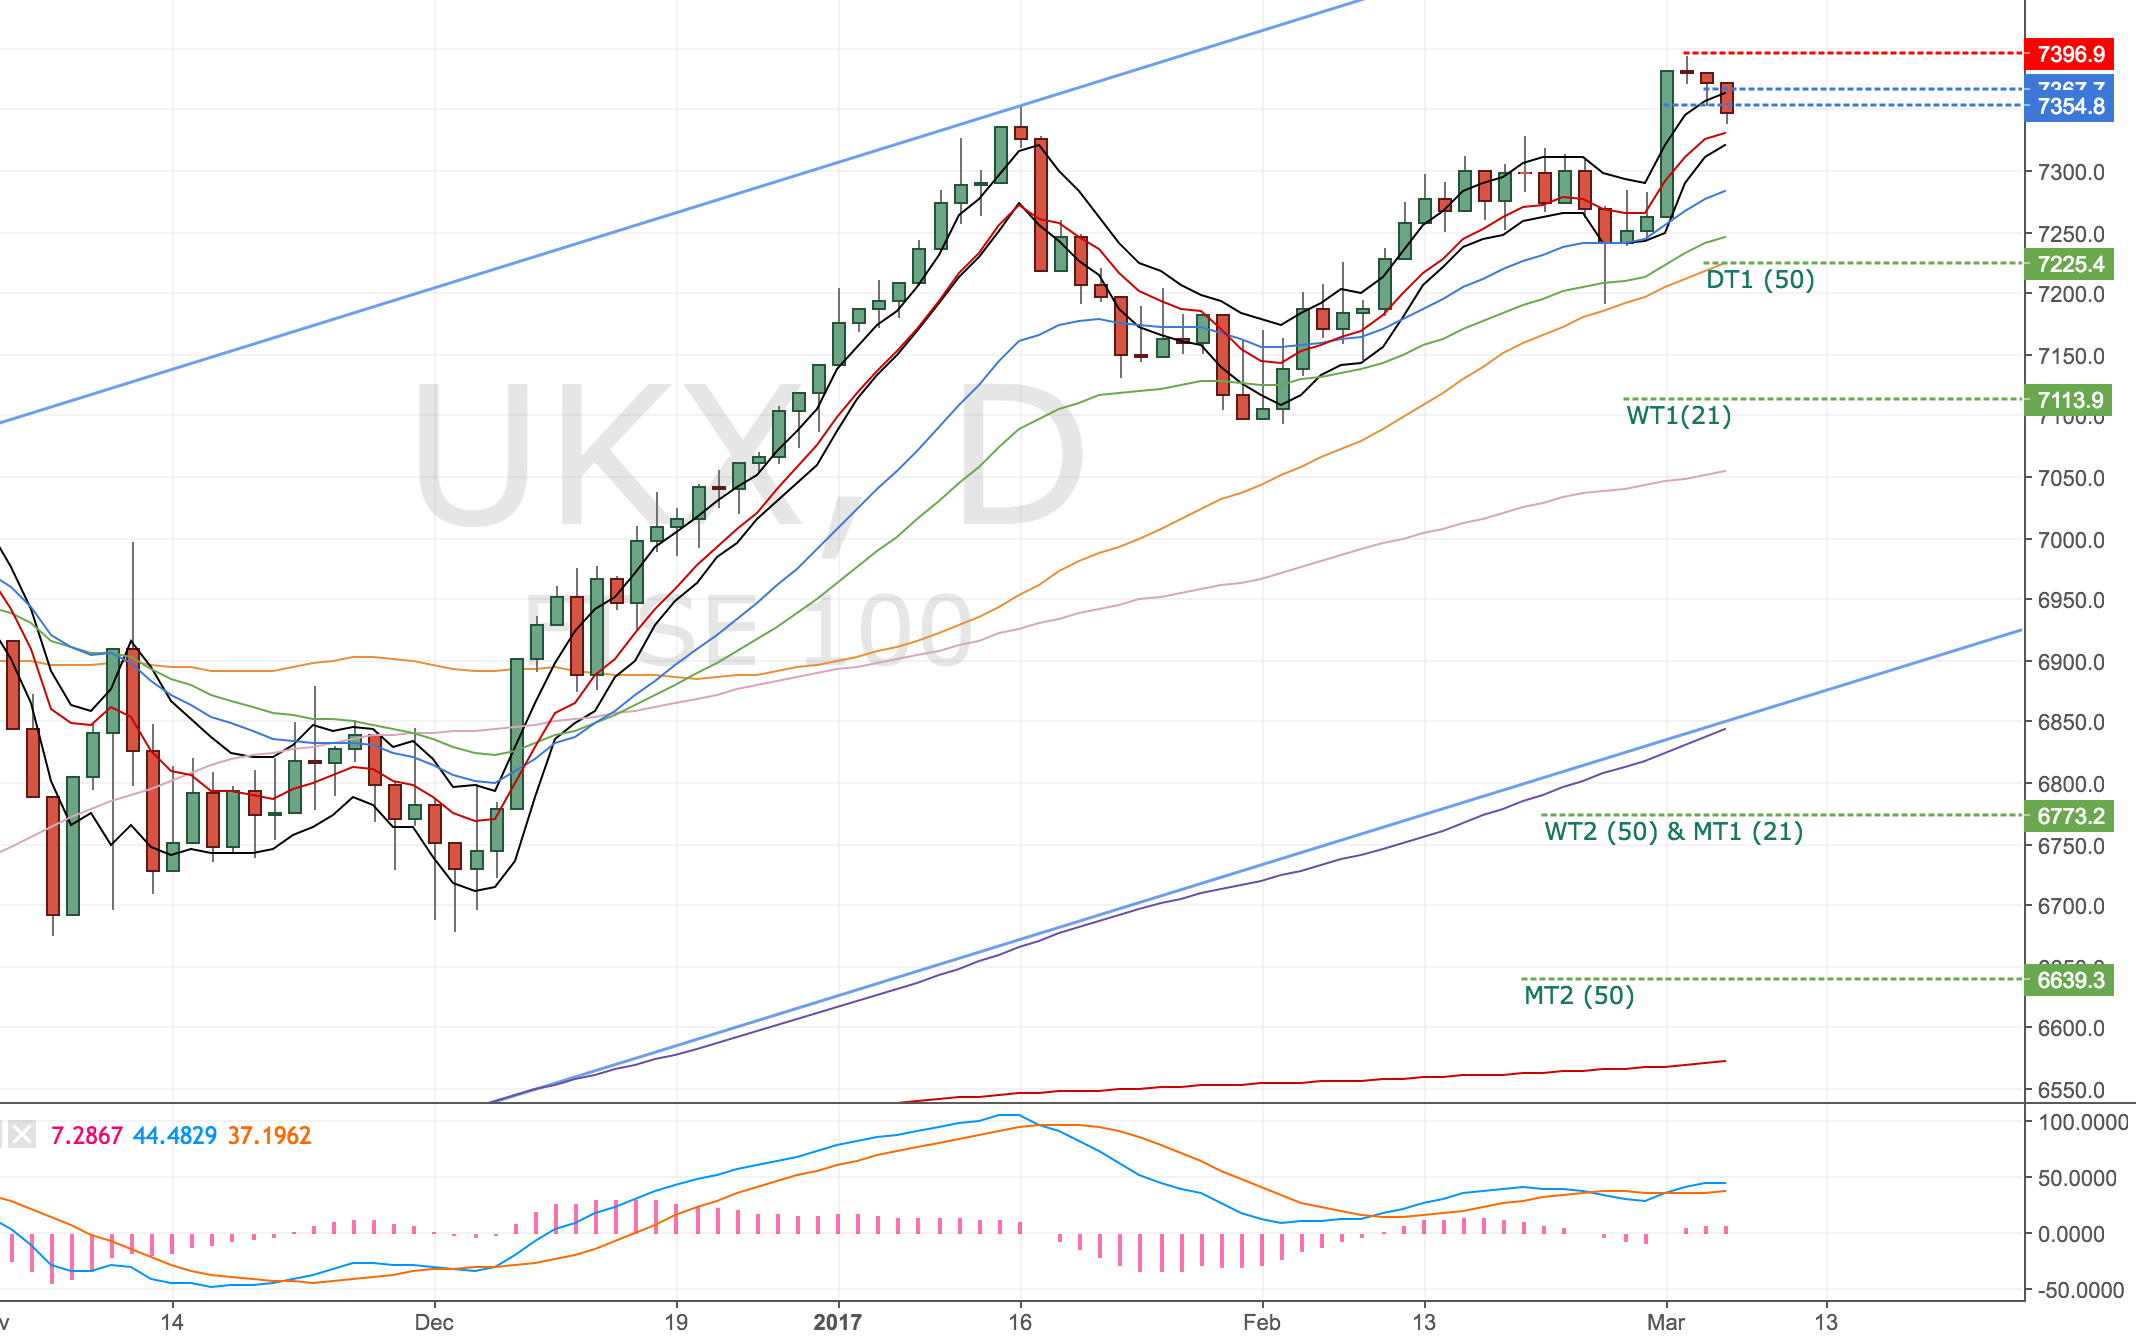
FTSE Daily Chart
The rise in prices have a diverging trend on the MACD
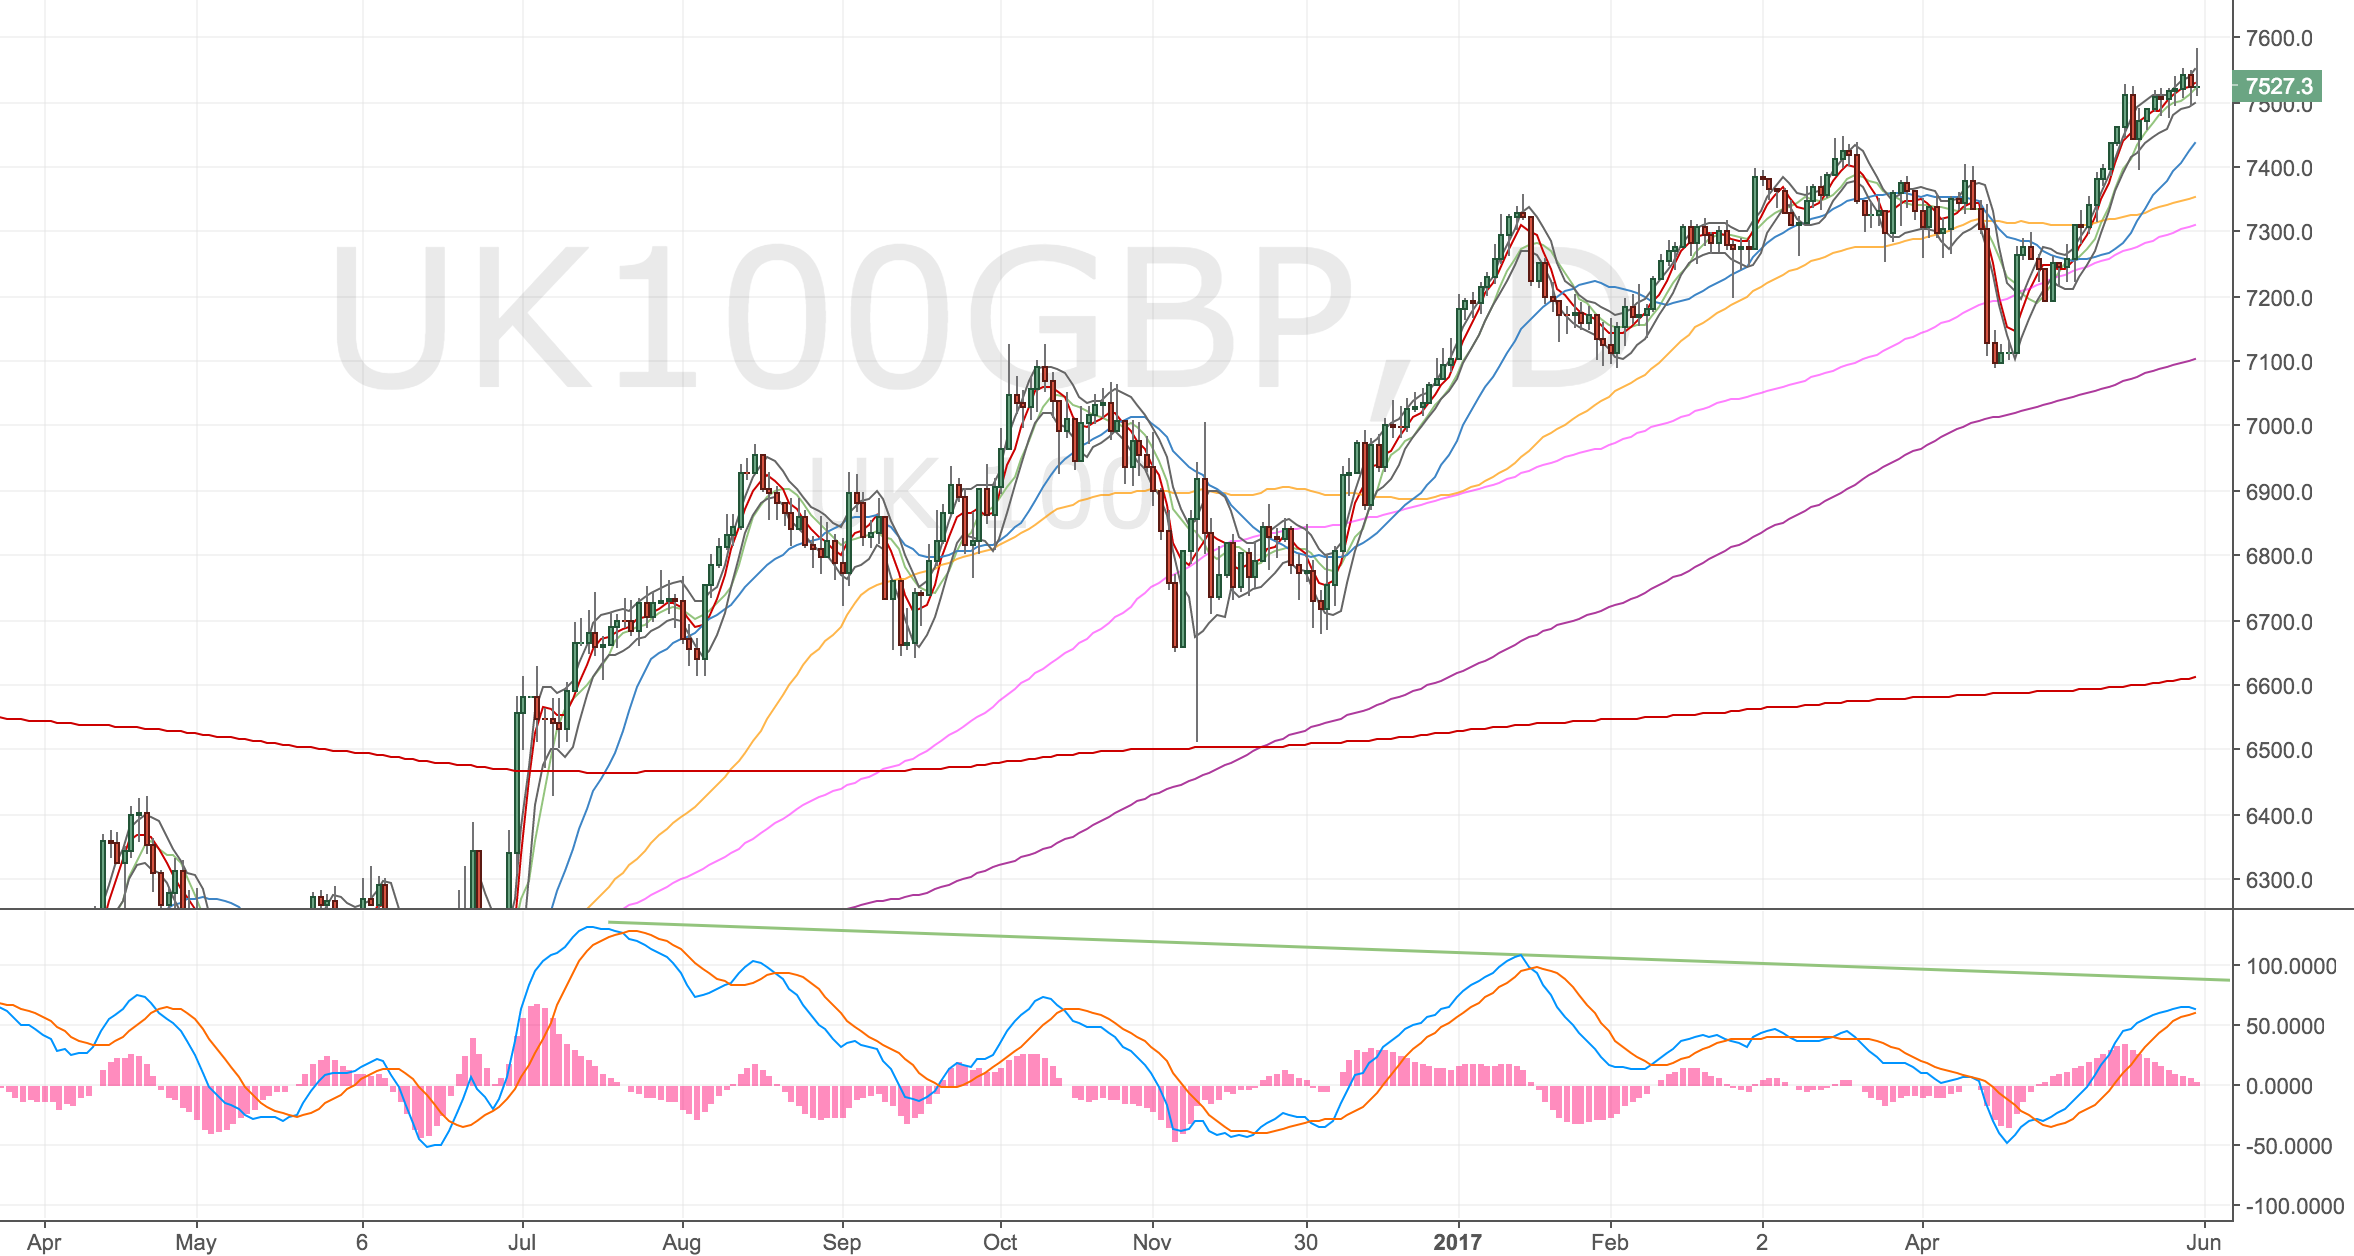
FTSE Daily Chart – 1 Jun 17
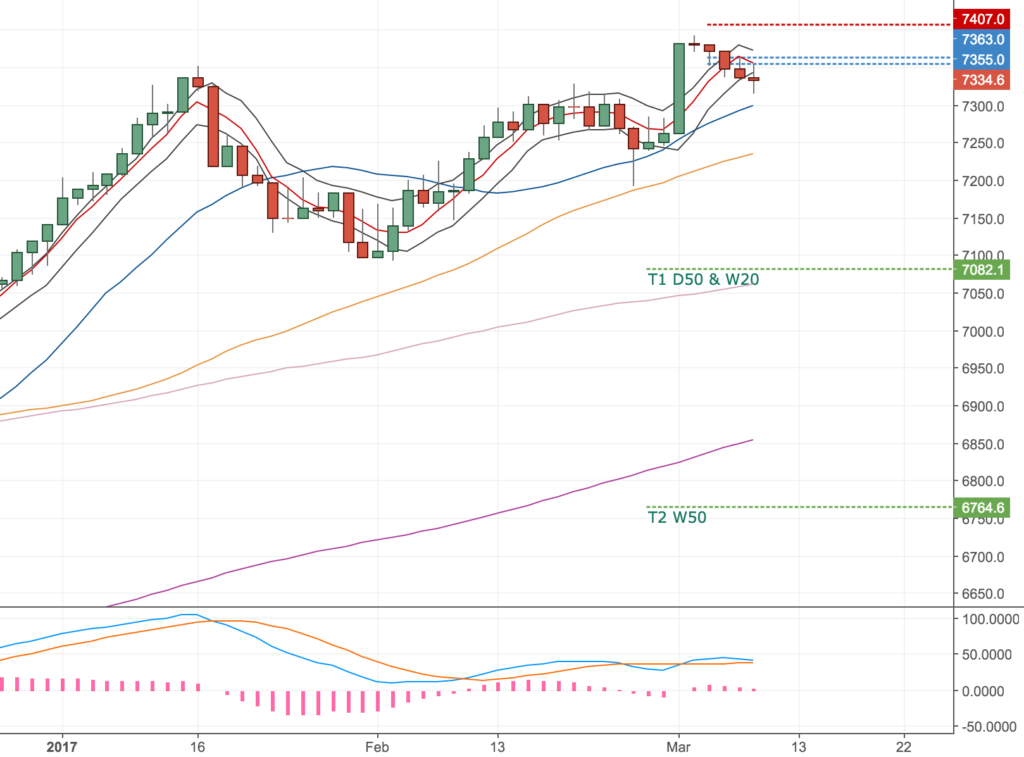
FTSE 4H Chart – the setup
Price rises haven’t been coupled with a strong MACD. The MACD is very flat so it’s hard to pick an entry from this chart.
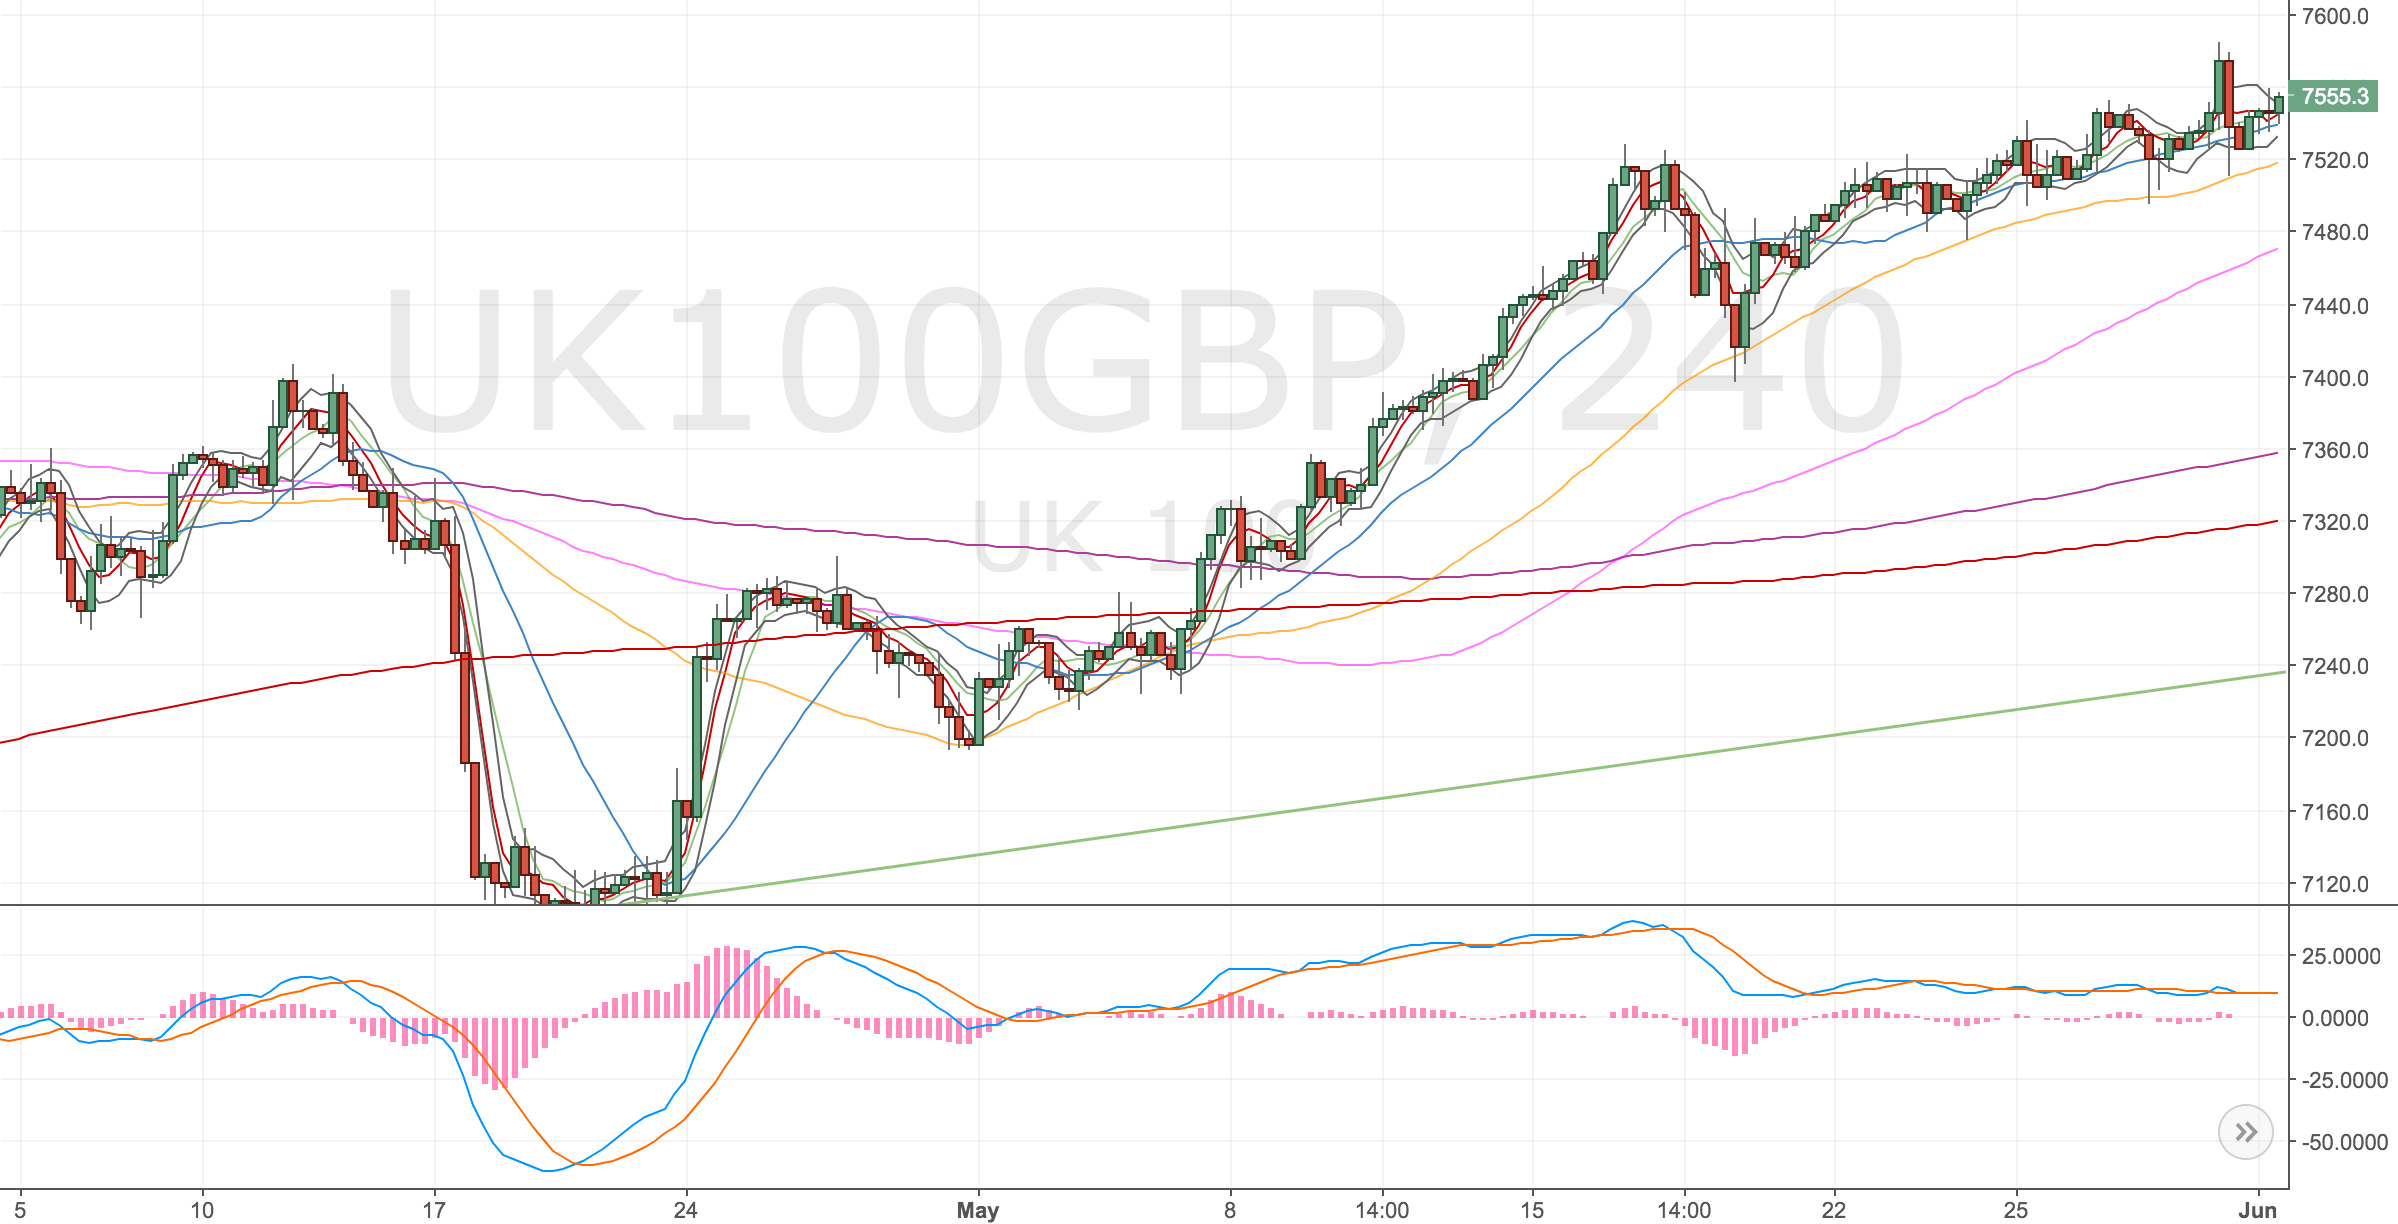
FTSE 4H Chart – 1 Jun 17
I’ve taken the most recent spike high as a place to get long. The entry is on the 8ma. I think this trade is a good set up and could run if the weekly divergence comes in. If it does, this will need stop management. Not something I have been in the position to worry about. I can also see this getting stopped out so I will need to be ready to get back in.
Stopped out, but still looks good – 2 June
Prices have continued the trend higher. Not surprising really. If the move that stopped me out immediately reverses, I will try another entry immediately.
Missed a second entry by 3 pips! 🙁 – 2 June
Doh, I set a couple of price level alerts to see how price behaved following my stop out, both alerts were hit quickly so I felt a reversal could be happening soon; it did. I’ve been keeping an eye on the price all morning, waiting for my time to get short following a retracement. I was looking for an upper band test at 7580 but it only made it to 7577 (3 pips short).
I took this screenshot in preparation for the trade log but it never got there.
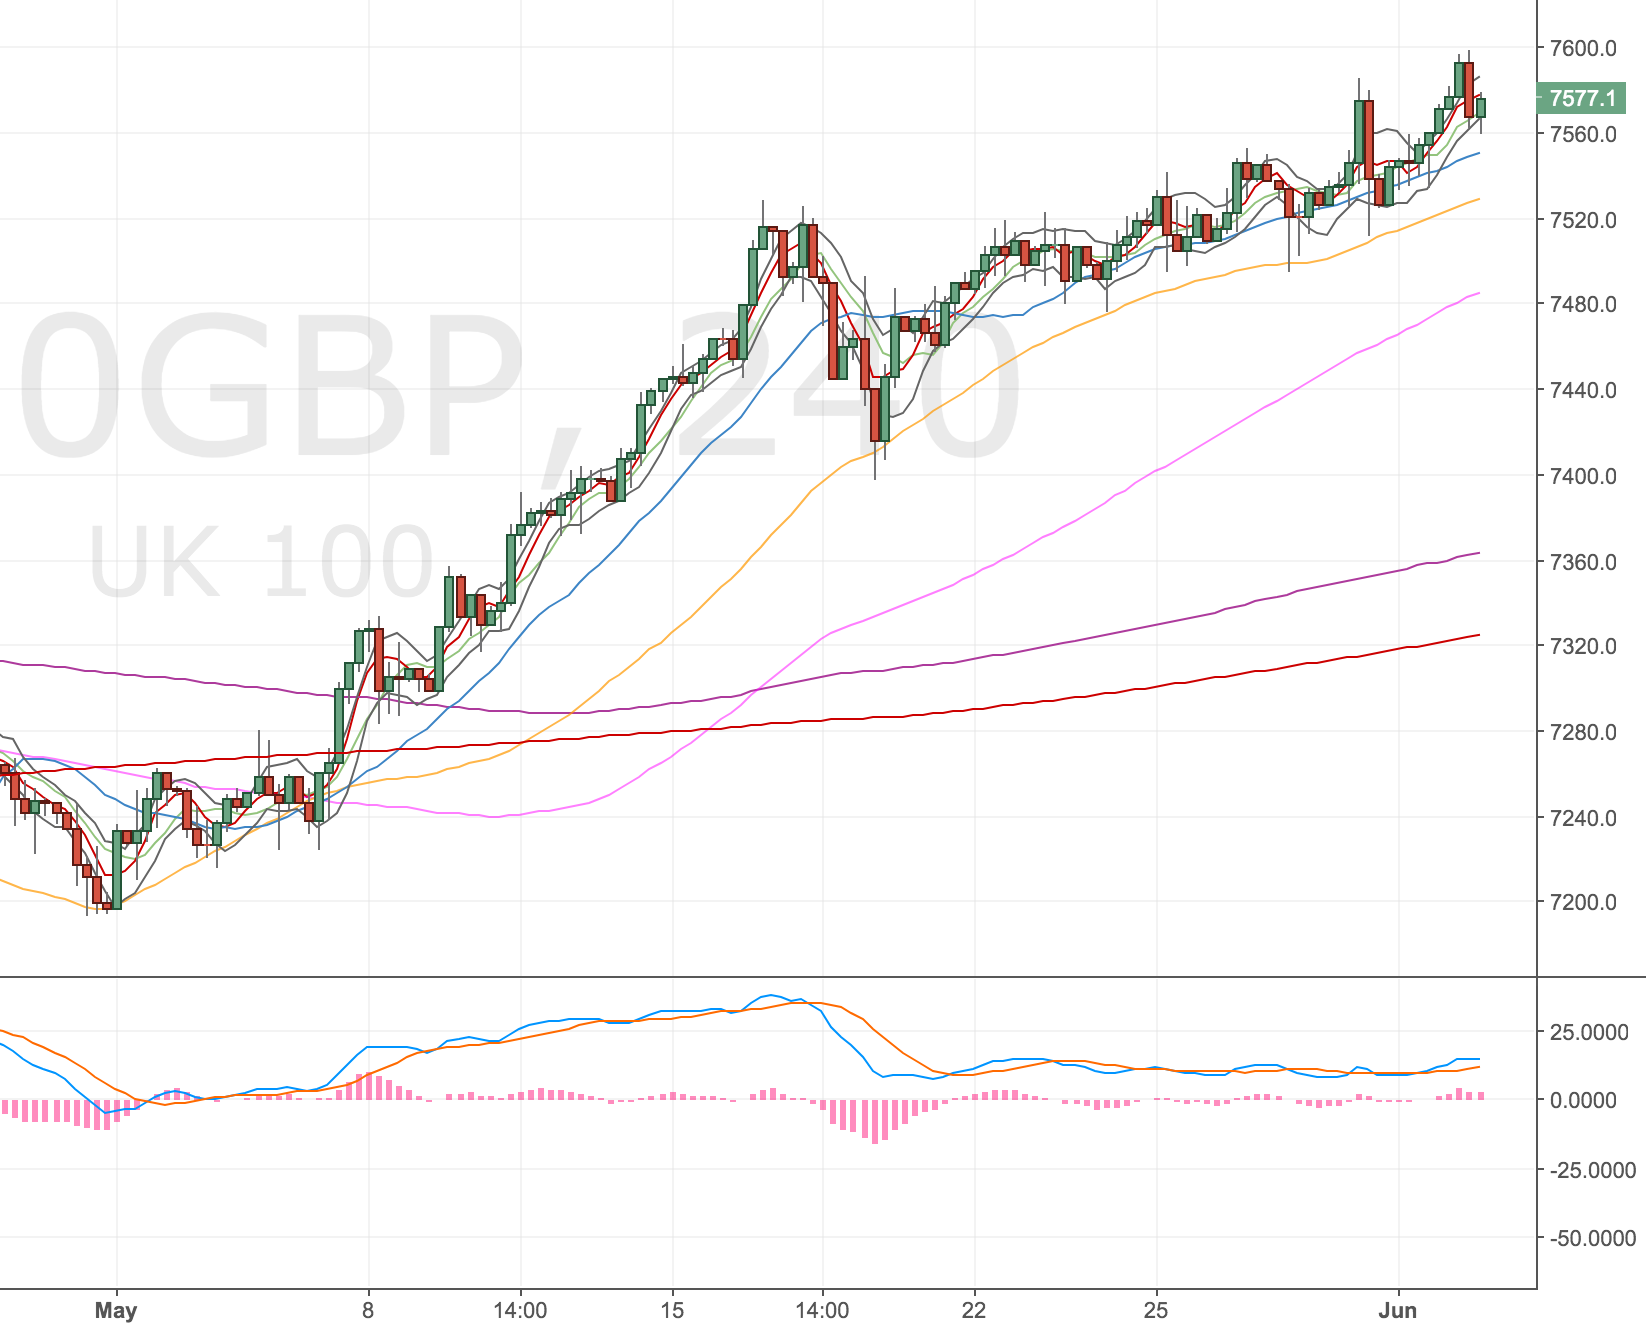
FTSE 4H Chart – 2 Jun 17
NFT was this afternoon and price has fallen away since. Pretty annoying to see, but we haven’t broken the higher timeframe trend yet so I am hopefully that I might get another entry to go short again.
The hourly chart might set up a divergence and the 4 hourly, daily and weekly would still be diverging. So that would make another nice entry.
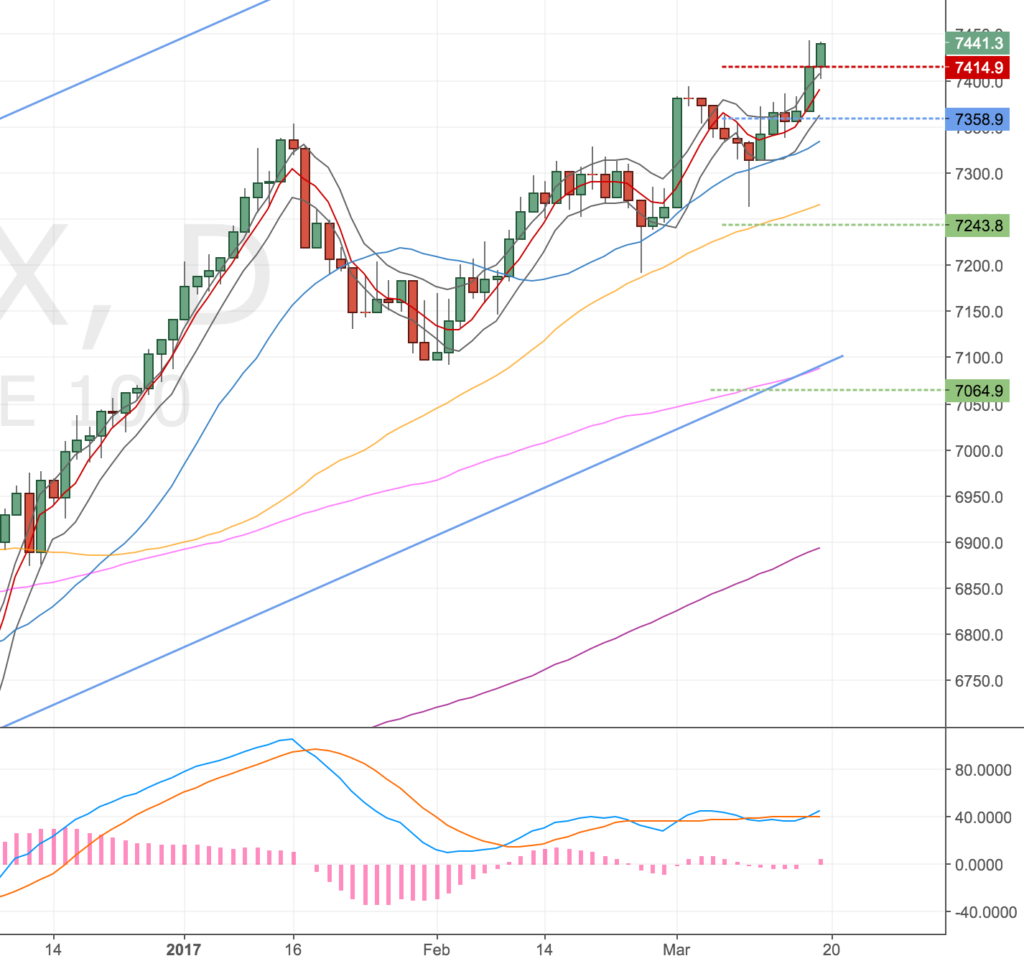
Sometime later – 9 June
Thought I should start monitoring how markets play out following my trades (win or lose). Here’s the FTSE. Would’ve been a great trade had I got in, but I didn’t and that’s trading, sometimes you get lucky.
Maybe a shouldn’t be too precious on my entries?
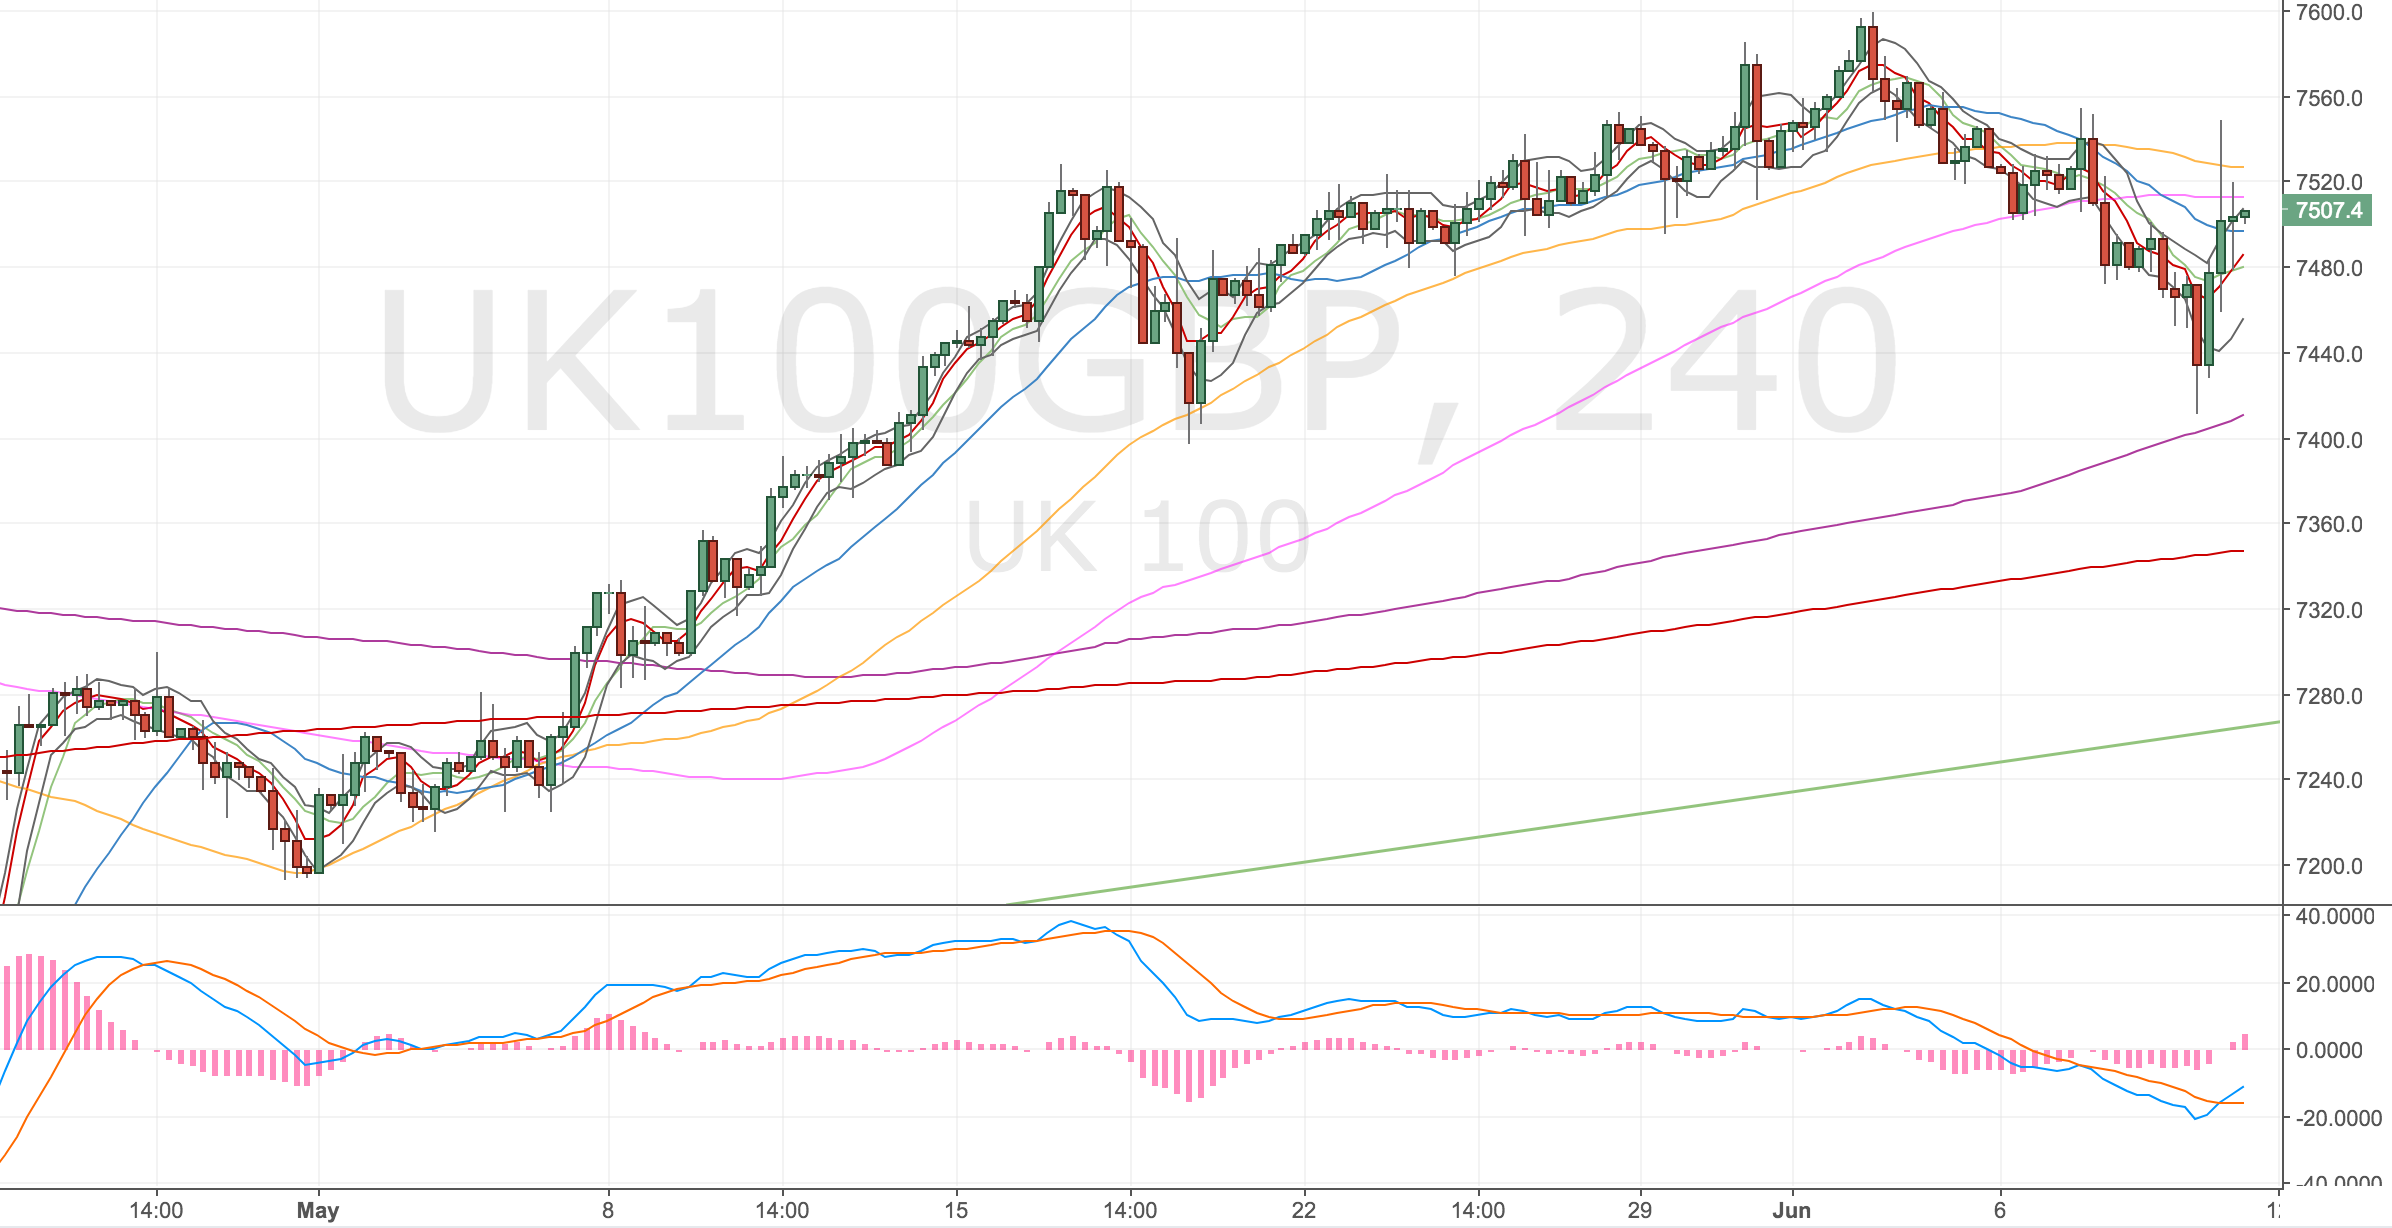
FTSE 4H Chart – 9 Jun