Account Risk: 0.3% (looking to increase leverage to 1%)
Short: 1x 7355 & 2x 7362 (order)
Stop: 7408 (1x 53 pips & 2x 46 pips)
Tgt 1: 7225, D 50MA (130 pips 2.4 RR)
Tgt 2: 7113, W 21MA (242 pips 4.5 RR)
Tgt 3: 6773, W 50MA & M 21MA (582 pips 10.9 RR)
Mindset: A little uneasy – worried about missing out on the full position.
Update #1 – Second part of my position has triggered – 6 Mar
Update #2 – Stopped out – 16 Mar
This trade has been in the making for a while! The FTSE has broken to new highs and we’ve got a divergence showing on the 4H, Daily and almost the Weekly (Not sure about the monthly yet). There are so many juicy targets as well, I just can’t wait to see how this plays out. I’ve got the feeling this might be one of the better trades of the year for me (just got to play it right!)
The set up is on the daily chart (I’ve entered a little early on the 4H chart)
Daily chart set up
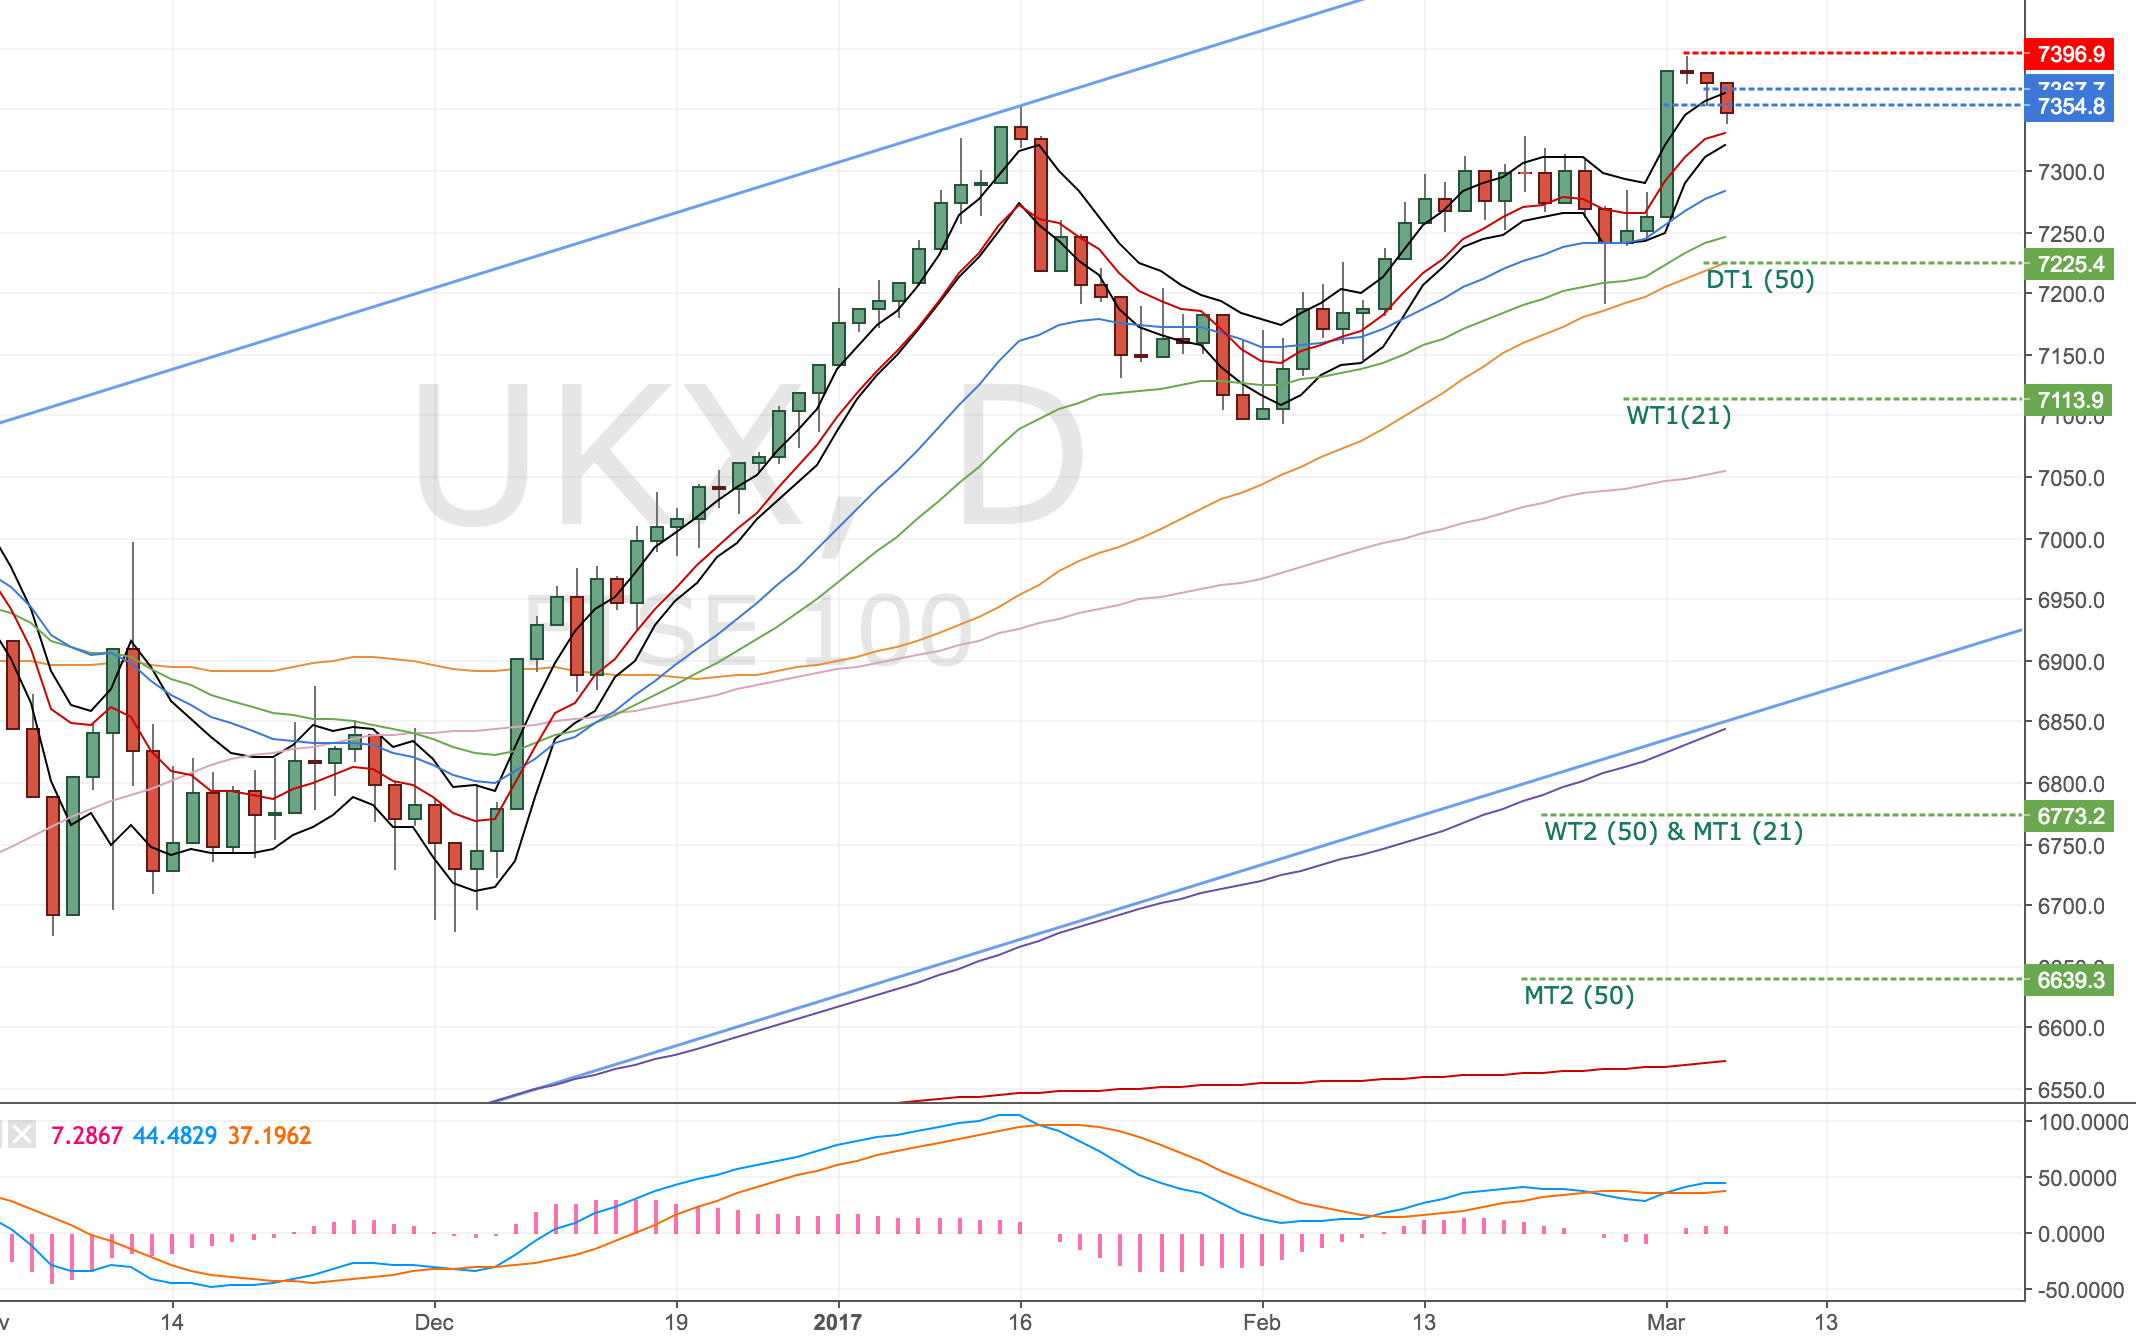
FTSE 100 Daily Chart – 6 Mar
I’ve entered the first portion of my trade at 7355 manually from the 4 hour chart. The remainder will be entered at the upper band. I’d like to be trading more than 3 units but I’m already on the smallest position size with ETX I don’t want to risk more than 1% on this trade right now. Maybe if we had a double or triple divergence I’d feel different.
Weekly chart
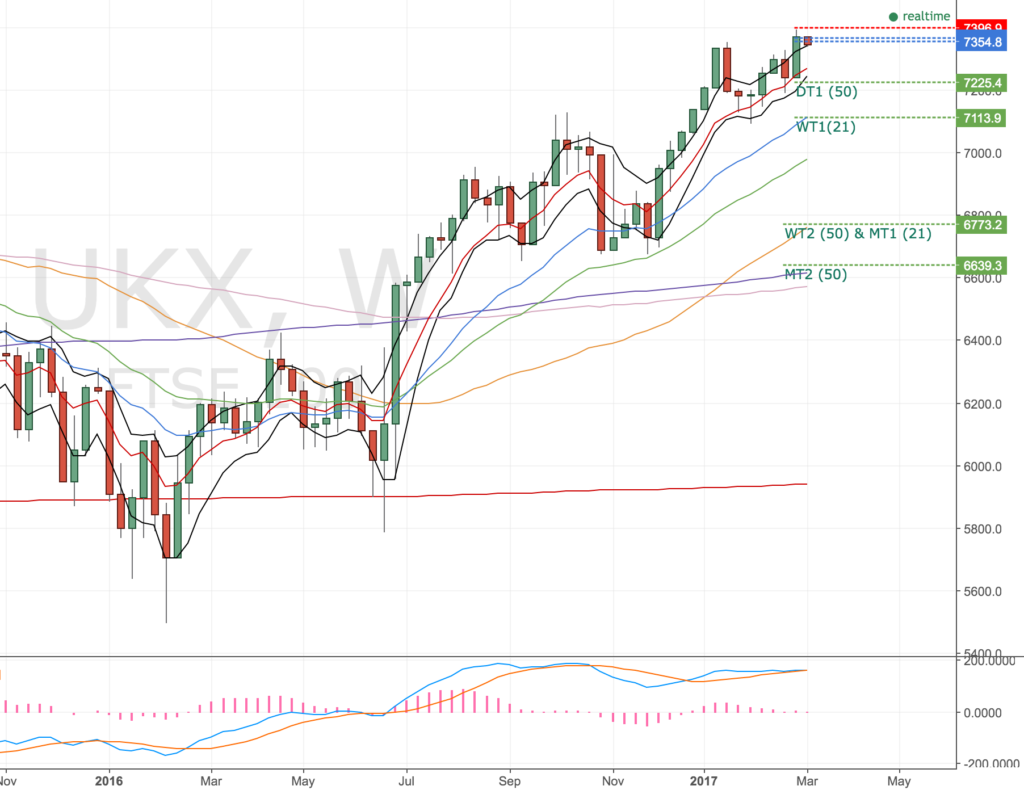
FTSE 100 Weekly Chart – 6 Mar
Not quite confirmed but price has moved inside the bands, a decent close under 7340 would confirm the weekly divergence. Monthly chart would set up if we closed under 7255.
This one is a big time wait and see job. It could take weeks to work its way down to my target.
Update 1 – Second part of my position has triggered – 6 Mar
Date: 06 Mar 17
Account Risk: 0.6%
Short: 1x 7355 & 1x 7362
Stop: 7408 (1x 53 pips & 1x 46 pips)
Tgt 1: 7113, W 21MA (242 pips 4.5 RR)
Tgt 2: 6773, W 50MA & M 21MA (582 pips 10.9 RR)
Mindset: Ok for now – waiting for a decent break-down. Not sure about adding to my position now.
The second part of my trade has been triggered now, so my average entry is 7359. I originally wanted to go up to add 2 units to increase the trade size to 1% but if I’m being honest with myself I’m not ready for it. Just not used to it and I’d like to build up some trading mileage and a bigger margin before I up my position size.
So I’m happy to risk £50 per trade for now.
Here’s the set up I’m trading.
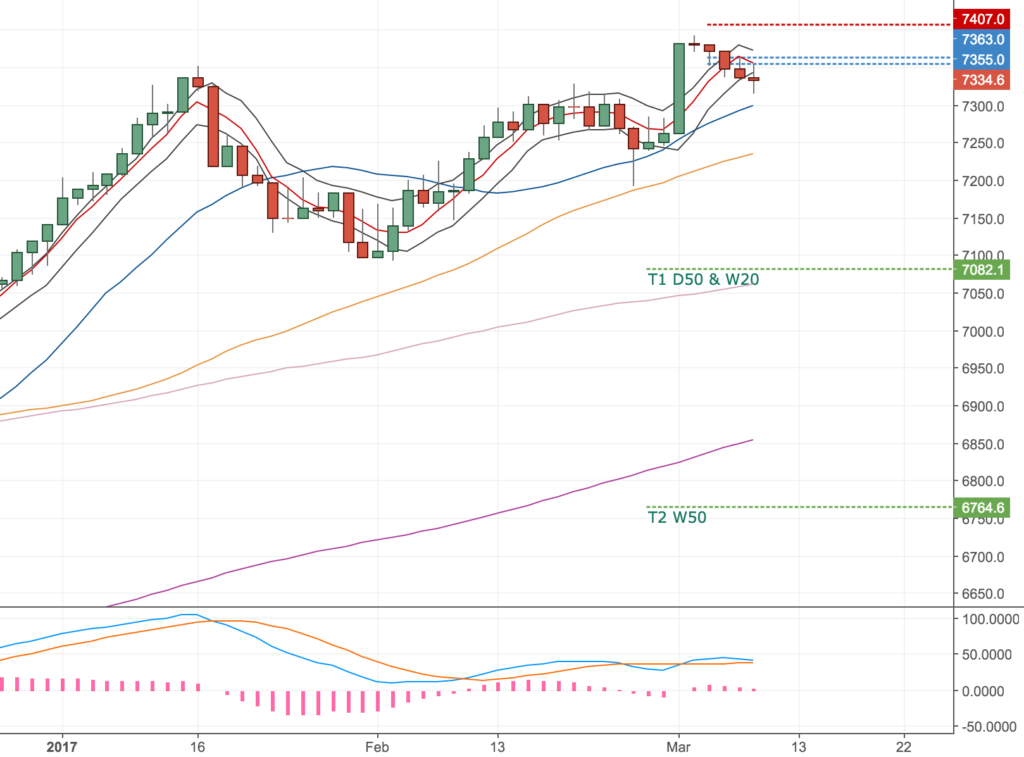
FTSE Daily Chart – 6 Mar
I’ve noticed people at work talking about buying shares, I don’t get the impression people are greedy though, just that getting into equities is on their radar – so I can imagine a scenario where price goes higher yet.
The opposite to that though, I can easily see price on the weekly & monthly charts closing inside the bands. If the monthly chart sets up, I may have to move my targets to the monthly 21. At the moment the weekly divergence is in play so my targets are set for the 21 and 50 weekly MA.
Update 2 – Stopped out – 16 Mar
Got stopped out of the trade. Two things surprised me about this:
- When the fed raised rates, prices went higher. Higher interest rates are usually bad for equities – debt is more expensive and there’s less money for people to spend on stuff.
- How long this trade took to decide anything. Just not been used to that much waiting around!
I have to be honest and say I was disappointed about this stop out. Bruce Lee sums it up pretty well for me.

Down on my luck again
I know I shouldn’t be, but I’ve had a few losers lately, trading costs are adding up and I was hoping this trade would cover those losses. I’m not used to this – probably the first time I’ve experienced it – although I’m covering many markets now and these losers are spread around, so it’s to be expected but it wasn’t what I was planning for March.
Here’s the final chart.
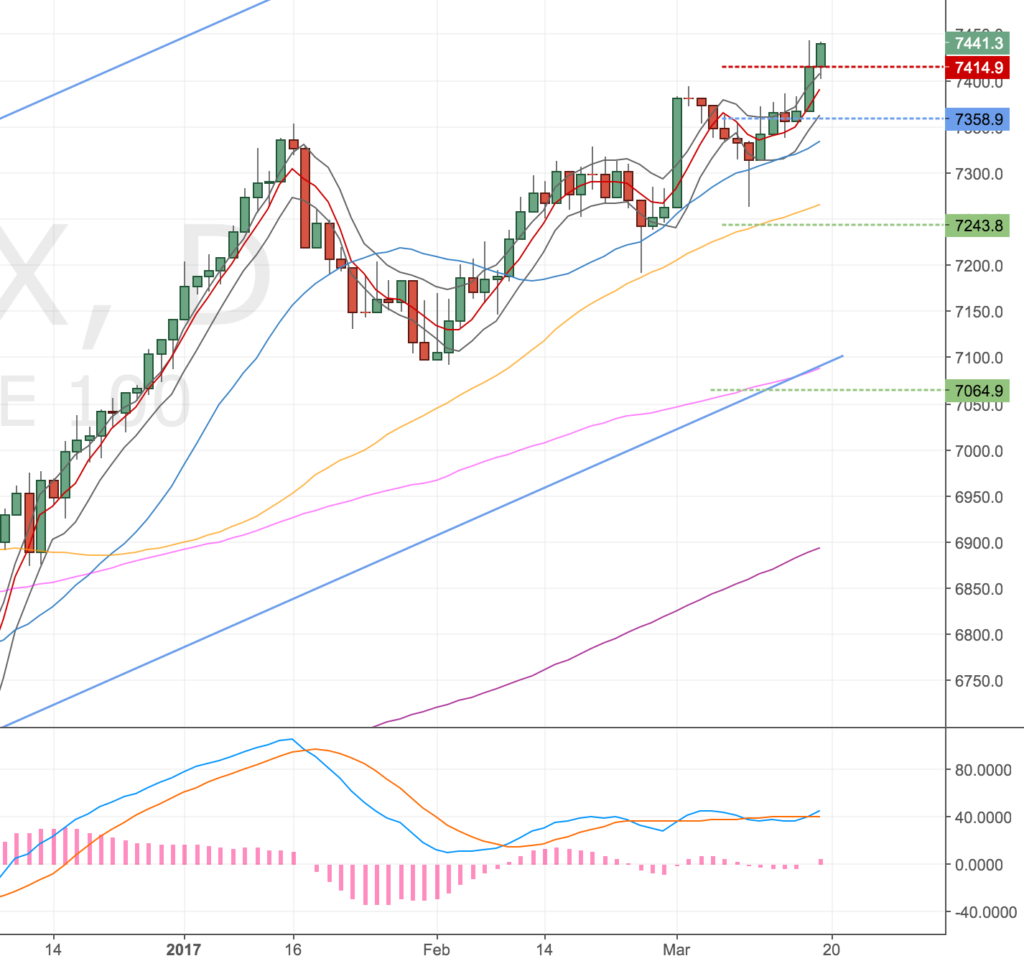
FTSE 100 D Chart – 17 Mar
Looks like we still might get other set ups coming. Gotta keep plugging away. I’m sure I’ll look back on this one day and shake my head in disbelief at how easily up set I was.