Last updated 10:00, 10 Dec 18
Review
Two trades last week, nothing too exciting. An AUDNZD long and a USDJPY long.
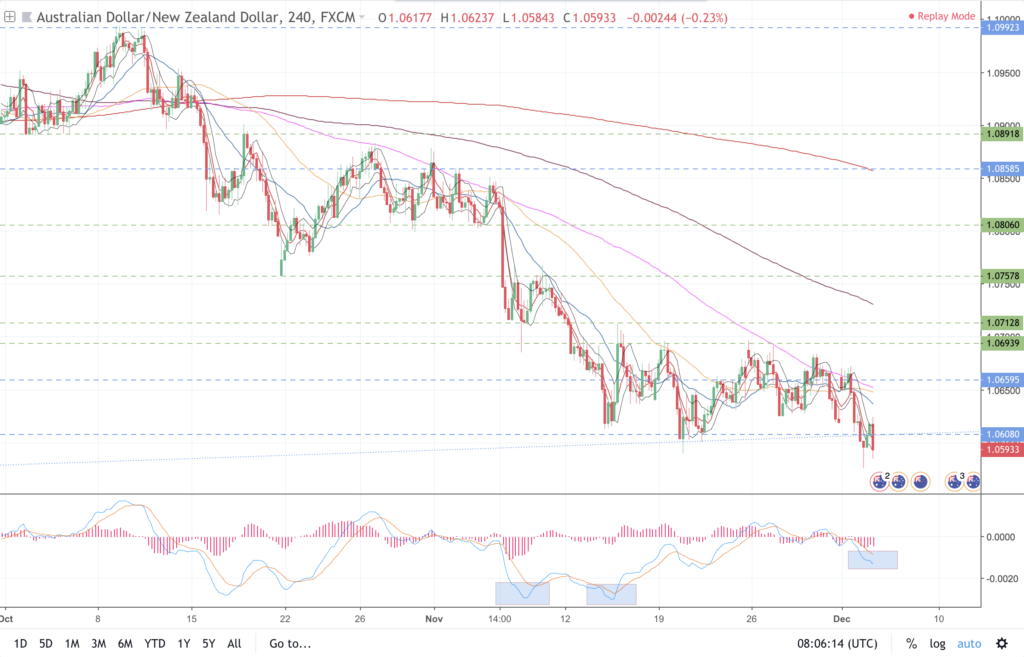
AUDNZD 4H Long @ 1.06094, risk 0.85%, result -£54.48
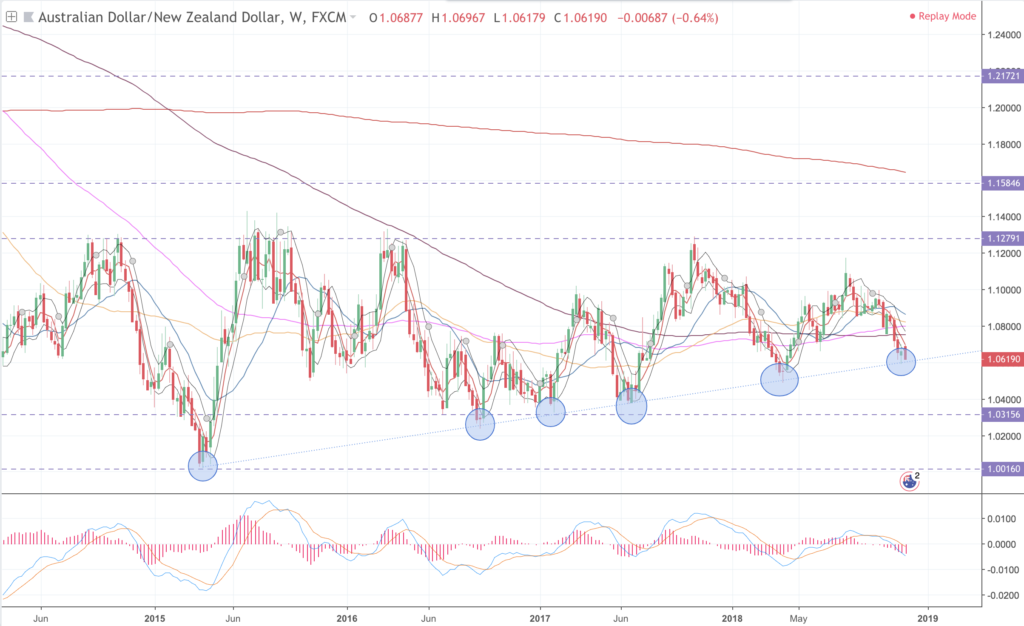
Took this long based on the divergence on the 1H timeframe, into a weekly trendline and prior support on the daily timeframe. Looking for a decent run up. The mistake here was not focussing on the case against, given it was the obvious trade to take. There were two factors against this trade.
- The weekly trendline was being tested for the 6th time! Pebble on a pond! Didn’t notice this.
- The divergences I was looking at were probably not related. There was too much price action between them.
AUDNZD Weekly Chart
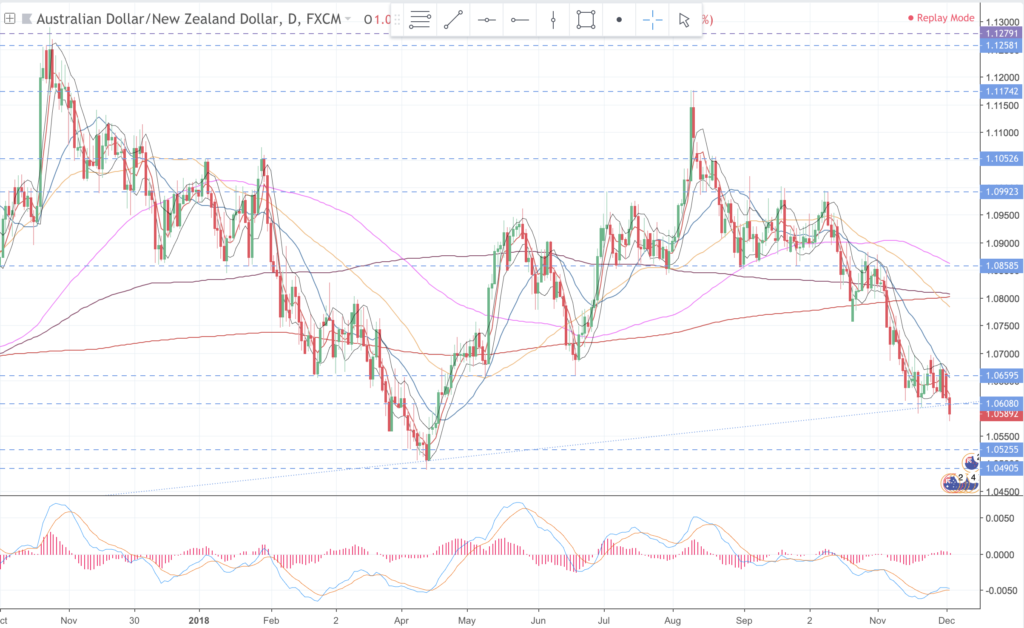
AUDNZD Daily Chart
AUDNZD 4H Chart
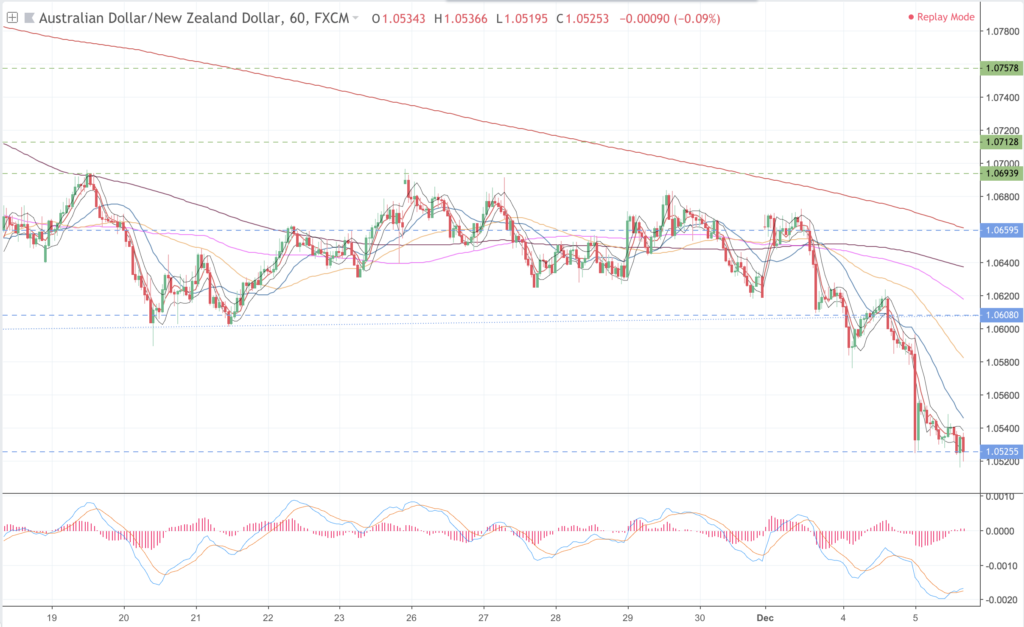
AUDNZD 1H Chart
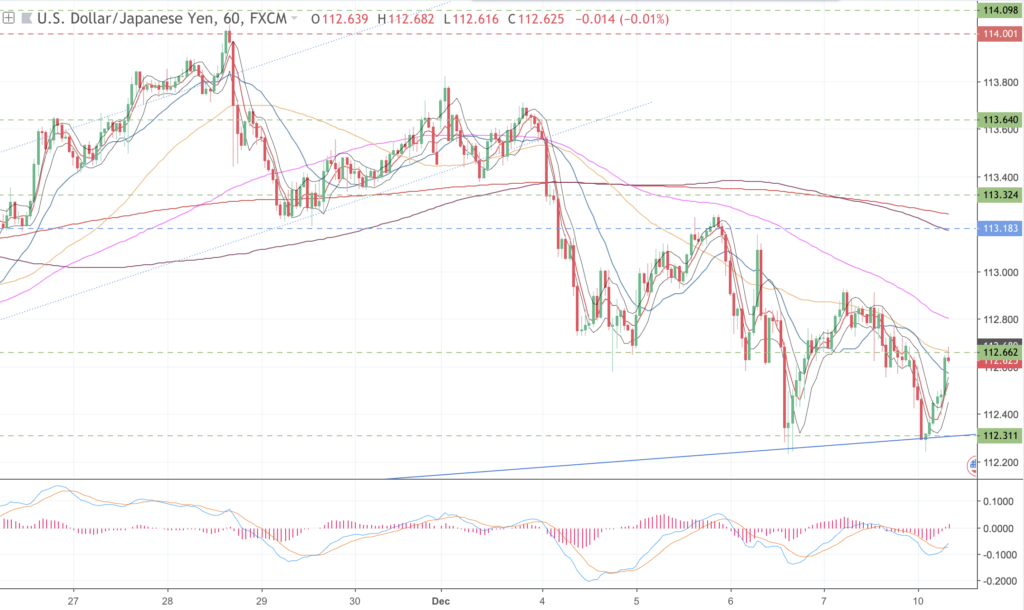
USDJPY 1H Long @ 112.468, risk 0.85%, partial closed 112.809
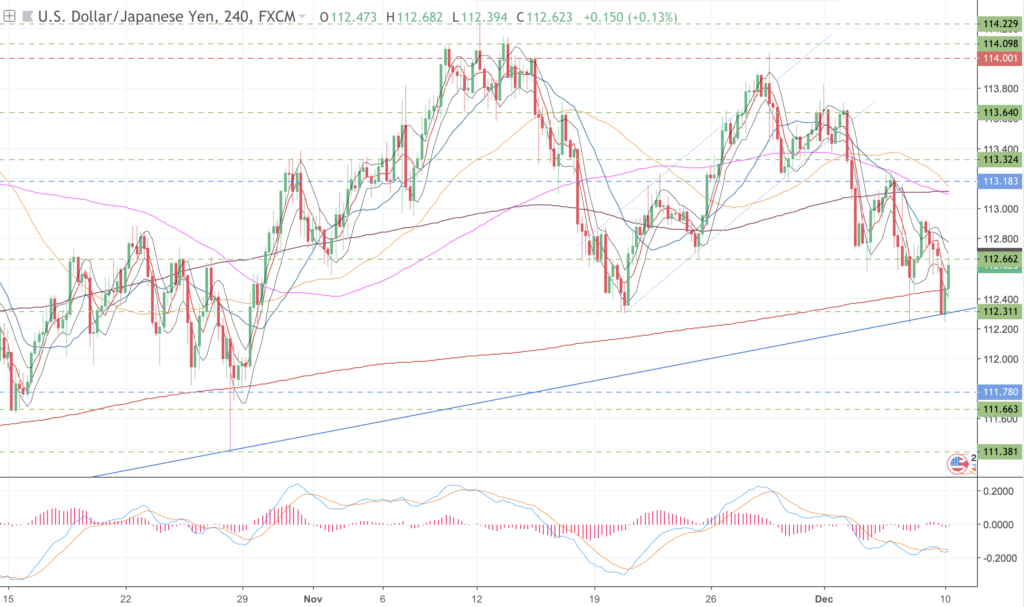
Took this long at the trendline and 1H SFP into prior support on the 4H chart. Closed part of the trade at the 1h50 according to plan but can see more upside so looking to hold the bulk until a retest of the prior highs.
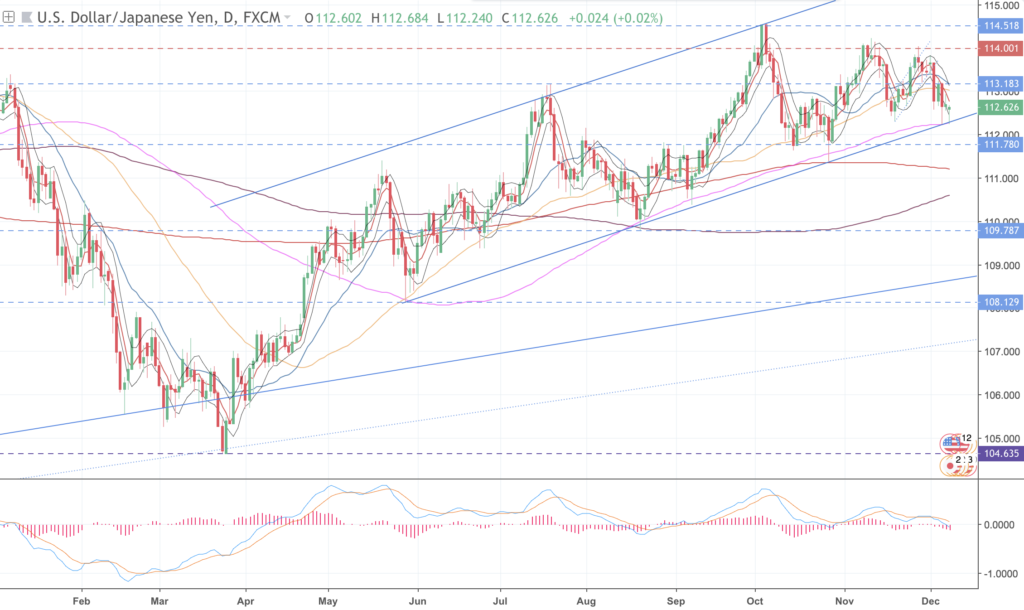
Overnight we’ve retested the lows and made a double 1H divergence and a slight 4H divergence, however there’s overhead MAs coming into play so I run up above 113 will probably be short lived. We’ve also tested the lower trendline 5 times now! Again didn’t notice this until just now!
Was originally looking for 114.00 now revised down to 113.10 based on the current charts.
USDJPY Daily Chart
USDJPY 4H Chart
USDJPY 1H Chart
Other Trades …
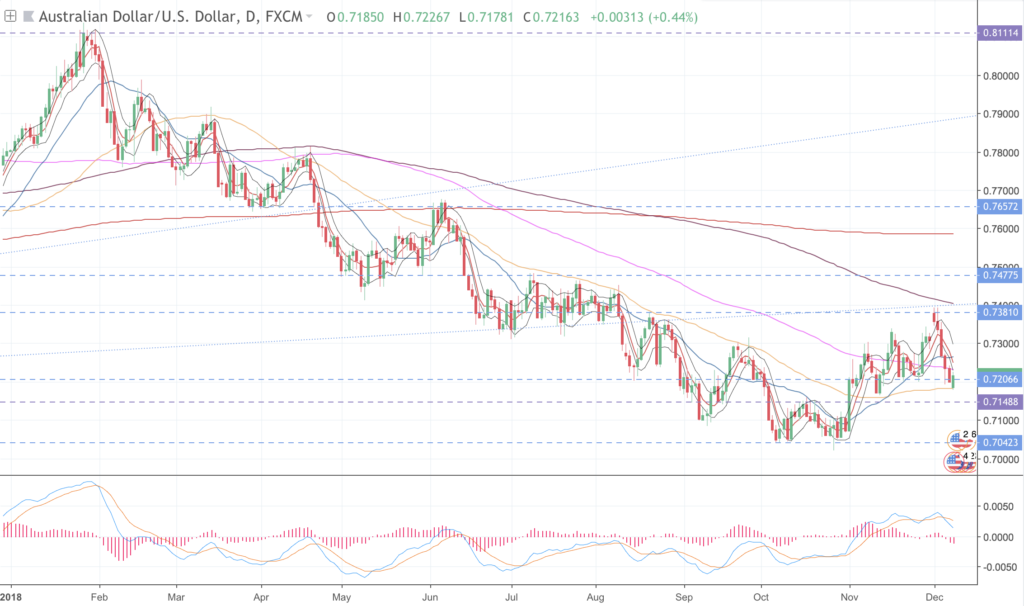
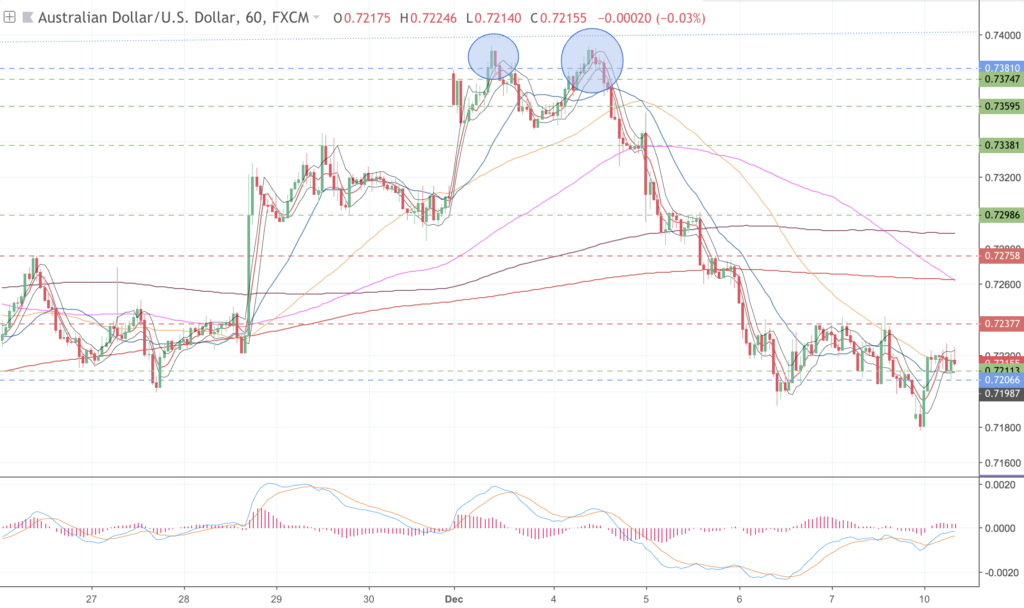
AUDUSD 1H Short
Missed this 1H set up, looking for too perfect an entry. This was a nice short into a long term (monthly) trendline, dating back to 2001! The d200 was coming into play but price action fell short, my daily resistance line was also drawn incorrectly. On the plus side I wouldn’t have run this far given the price action (but it ended up being a good runner)
AUDUSD Daily Chart
AUDUSD 1H Chart – Short
XAUUSD 4H Short
Trade didn’t materialise, price bunched up at the Daily swing point and broke out. Glad I missed out on this. Now looking to get long at pullbacks to 1241s for a run to 1261s. Might need to look at 1H or 15 min charts to get a retest with divergence.
XAUUSD Daily Chart
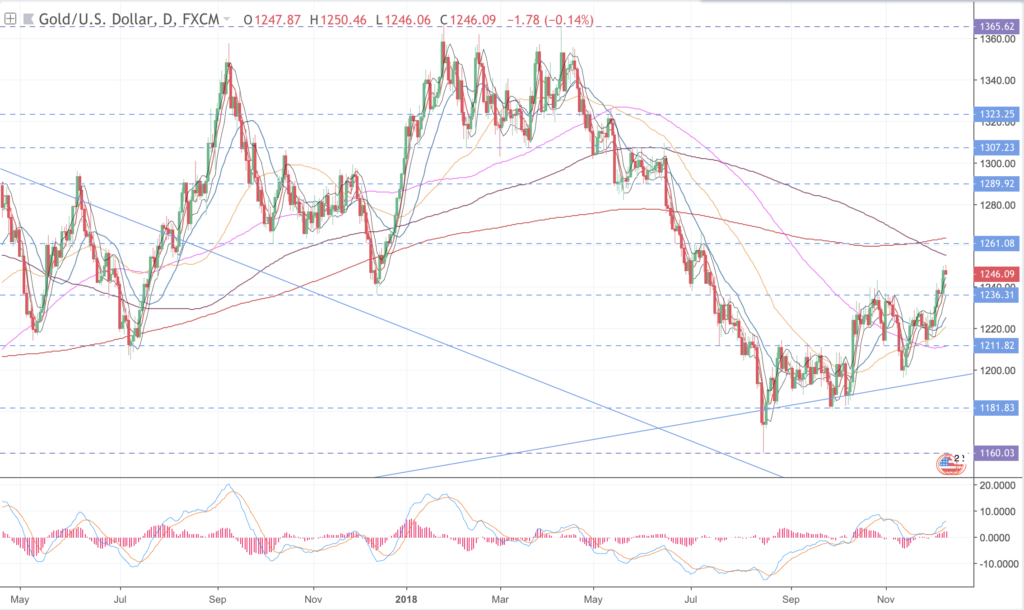
Looking to play a long run up to the next swing point at 1260s.
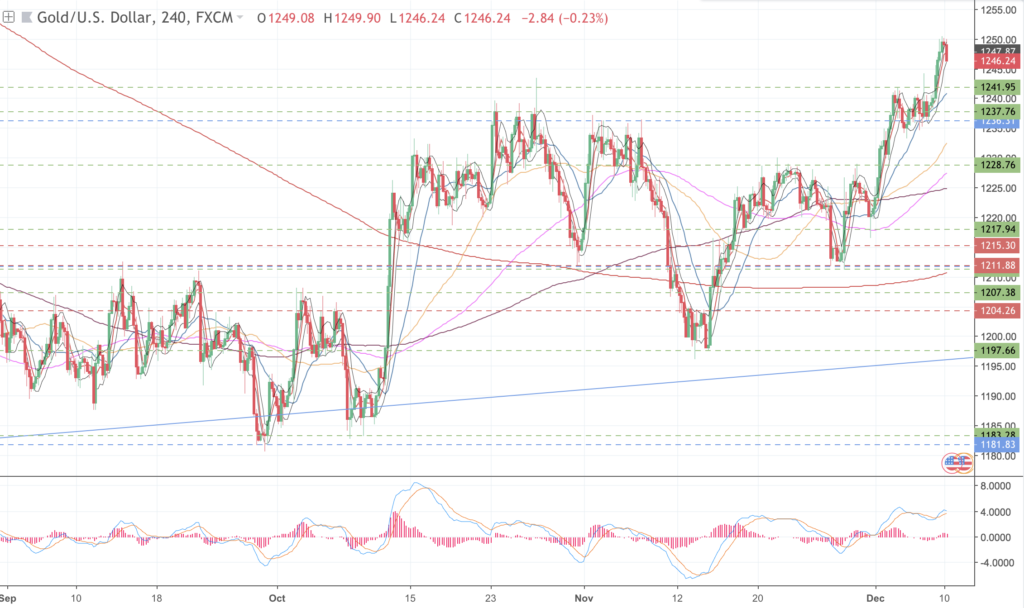
XAUUSD 4H Chart
Currently diverging now but there’s no significant prior support or resistance so won’t be trading it.
UK100 Short into prior support (now resistance)
I really liked this trade but it didn’t set up for me. I was looking for divergence into a key level. I got the level test (slight over shoot) but the divergence was messy so I didn’t trade it. Good discipline but it worked out as I expected. In retrospect maybe it was worth testing but at a smaller size (speculative play like my gold trade from the other week?)
Still think there’s a much bigger move in play here. I have a theory that the Santa rally only really comes the week before Christmas and plays out to the new year. Just a theory though. I think people try to play it too early.
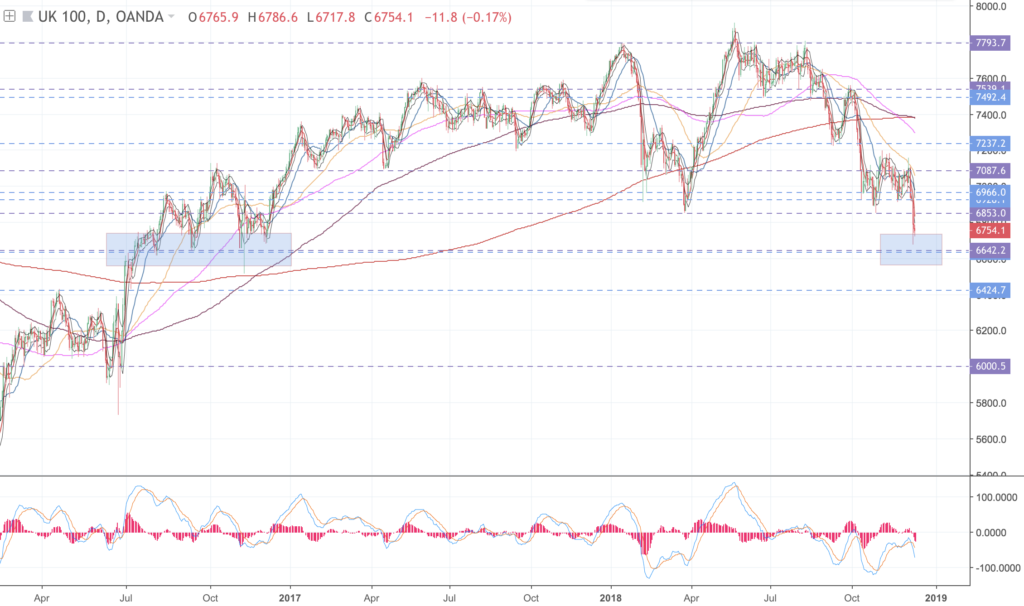
Looking for a retest of the 6640s to get long. As we are so close it makes me think the Brexit vote will go May’s way. You know what they say the market makes the news not the other way around! It’s even a divergence on the weekly chart!
Anyway here was the retest of the prior support the divergence wasn’t there.
UK100 15min chart short to prior lows
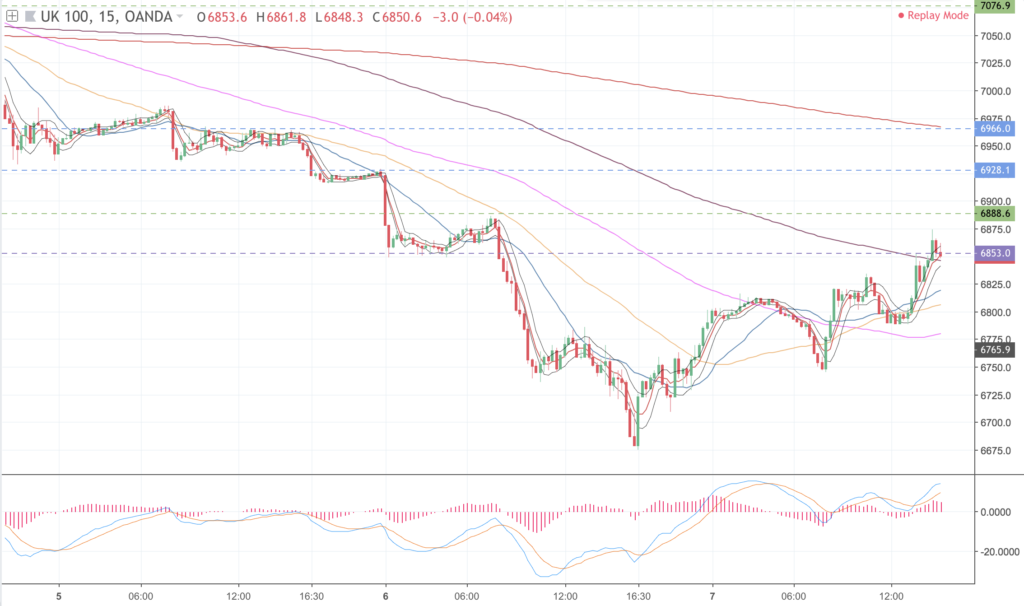
Looks like the long will set up this week.
Key events this week
Tresemme has the big brexit vote on Tuesday. Then the usual GDP, PMI, Inflation figures.
Outloook
This week, look for …
Long: CXY, BXY
Neutral: EXY, JXY
Short: DXY, AXY
EXY
Same as last two weeks, looks bullish in the long-term, will need to watch for buy set ups from support. I think a 111 test is on the cards. This is getting long in the tooth now, so it better set up soon or I’ll need another divergence long.
Monthly – Looks like it’ll want to head higher to the TL, pebble on a pond
Weekly – Still looking for the 111s
Daily – Double divergence in play. Any moves down to the 111s would be a solid buy if the divergence is intact.
DXY
Starting to think this is long in the tooth for more upside. The 100s don’t look likely until mid to late next year. Double daily divergence in play, hence why I’ve reduced my target on USDJPY. Any tests of the 97.5s would be shorts for sure.
Monthly – Looking for DXY to hit 100 – prior resistance and TL touch (could take months/years)
Weekly – Similar pattern – forming a head and shoulders at around 100
Daily – We have a double divergence in play, any moves to the 97.5s are shorts.
4h – Upside looks to be short lived right now. Low 97s would be a result.
JXY
Right now expecting Yen to either diverge at the lows and move higher or continue down. This needs monitoring. Longer term lower (much lower – 84s), still look for shorts in to the 90s, longs into divergence @ 87s
Monthly – Looks bearish. Retesting the m50 but rallies have been limited and price is struggling to move higher. Any move to the 90s would be shortable (other side of the trendline).
Weekly – Have retested the lower trendline but could see some MA ping pong and another retest into the 90s.
Daily – Looks like we’re heading lower. Might diverge at the 87s and then retest the highs at 89. Expect this to ultimately roll over.
BXY
BXY is double diverging on the daily, look for longs after a shake-out of week hands. Looks like the market expects May to win the vote after all.
Monthly – Prior TL that will probably get tested at some point in 2019-2020. If May loses the vote look for 121s otherwise a move to test the TL.
Weekly – If we hold 127s this would be bullish, I expect a shakeout and move higher.
Daily – 126s for a long set up, double divergence in play.
CXY
Look for the USDCAD short still, I think this could run nicely.
Monthly – Hand-railing the m50 would expect it to clear and head to 82 – 86s
Weekly – Two spinning tops on the TL and divergence, indicates heading higher. (although really not sure where the trendline should be drawn yet)
Daily – Got the 74.5s on the nose, looking for more upside. Can’t believe I didn’t get this short on the USDCAD!!! Short any set ups.
AXY
Looks very bearish now. Short any set ups that we get.
Monthly – Looks bearish for now. I think it could set up a decent divergence long at some point. Look at 69s and 63s.
Weekly – Look out belowwwwww! Maybe a small bounce at the 69s.
Daily – Looks bearish if we move up to the 74s again it would be an area to short.