Acc Risk: 0.5%
Sell: 1x @ 1.0781
Stop: 1x @ 1.0832 (51 pips)
T1: 1x @ 1.0681 (100 pips, 2x R:R)
Mindset: 😐 Not too confident
Update 1 – Post NFP (Still in the trade) – 03 Feb
Update 2 – Moving my target 😐 (still in the trade) – 05 Feb
Update 3 – Target hit – 05 Feb
Spotted a pretty standard divergence the other night so took a position, I shorted on the open of the next 4 hourly bar @ 1.0781. Aiming at a 2x reward to risk. I was looking to add an additional position at the upper band but cancelled the order because I wasn’t comfortable with the full position size. I think this is mainly down to not having much trade history and building my confidence.
The support areas on the higher timeframes are moving averages which are pretty soft levels of support (I assume everyone has slightly different MA chart settings (e.g. exponential, simple, 20 or 21 etc etc). The trend is still up and hasn’t really shown any topping price action to me (spikes higher, collection of dojis or flattening of the trend).
For my target I’m aiming for the 100MA. It has already been tested but I’m only looking for a retest because I’m not feeling confident about the trade. I wonder if in hindsight I should’ve aimed for more.
Here’s the set up (red comments are points against)
4H Chart – The Set up

Daily Chart

Weekly Chart

Post NFP Update (still in the trade) – 03 Feb
Leading up to NFP the target was looking like a dead cert. The NFP was positive for the dollar but earnings and unemployment weren’t so the picture was mixed. The Euro has since rallied higher and price action is looking like bullish for now.
It made me go over the higher timeframes just to revalidate where I think we are (I didn’t do this properly before – broke my trade plan!)
Monthly Chart – 03 Feb

I redrew my trend line going back to 2000 and to me it looks like we’ve broken it and are doing the kiss goodbye. Trendlines are very flaky though, like elliot waves it is all down to interpretation. Someone could well have drawn that as support. However that’s how I see it. I can easily imagine a monthly roll-over and a bullish divergence setting up.
Weekly Chart – 03 Feb
More of the same just zoomed in. Green line is my current short @ 1.0781.

4H Chart – 03 Feb
Green line is my short @ 1.0781, red the stop @ 1.0840 and blue the target @ 1.07.

Price didn’t make it down to my target and for now looks bullish to me. We’ll see how next week works out. I can see a marginal new high on the cards with potentially a double divergence setting up. So might get stopped out and look to be shorting this again.
I’m glad to be trading a system with some stats behind it so I still take trades rather than talk myself out of positions. Even if I am wrong I will have got some experience out of it.
One thing that frustrates me about this trade is that using a moving average as a target murders the RR. Is there a point which I should just aim for a fixed RR? Perhaps as long as I average min 1x RR overall that is fine? One to ask Charlie.
Moving my target 😐 (still in the trade) – 05 Feb
Just a quick update, logged on to ETX this morning to tend to my limit orders, and noticed that I’m now moving my target to Friday’s prior low.

Getting frustrated moving my MA target to previous lows.
I know this is the system, but it’s frustrating to see. During back testing I did notice that often the exits weren’t great RR when targeting bigger MAs. Not always the case but I wonder if after a while the RR goes below 1 it’s just better to lock it in at 1 RR and wait for the target to be hit? Question for Charlie.
Target hit – 05 Feb
Not long after moaning about my target creeping up, it got hit. Over the weekend, I took some time to review the charts and I could see more upside easily following through, but this morning opened down and the target got hit around lunchtime. Here’s the final trade.
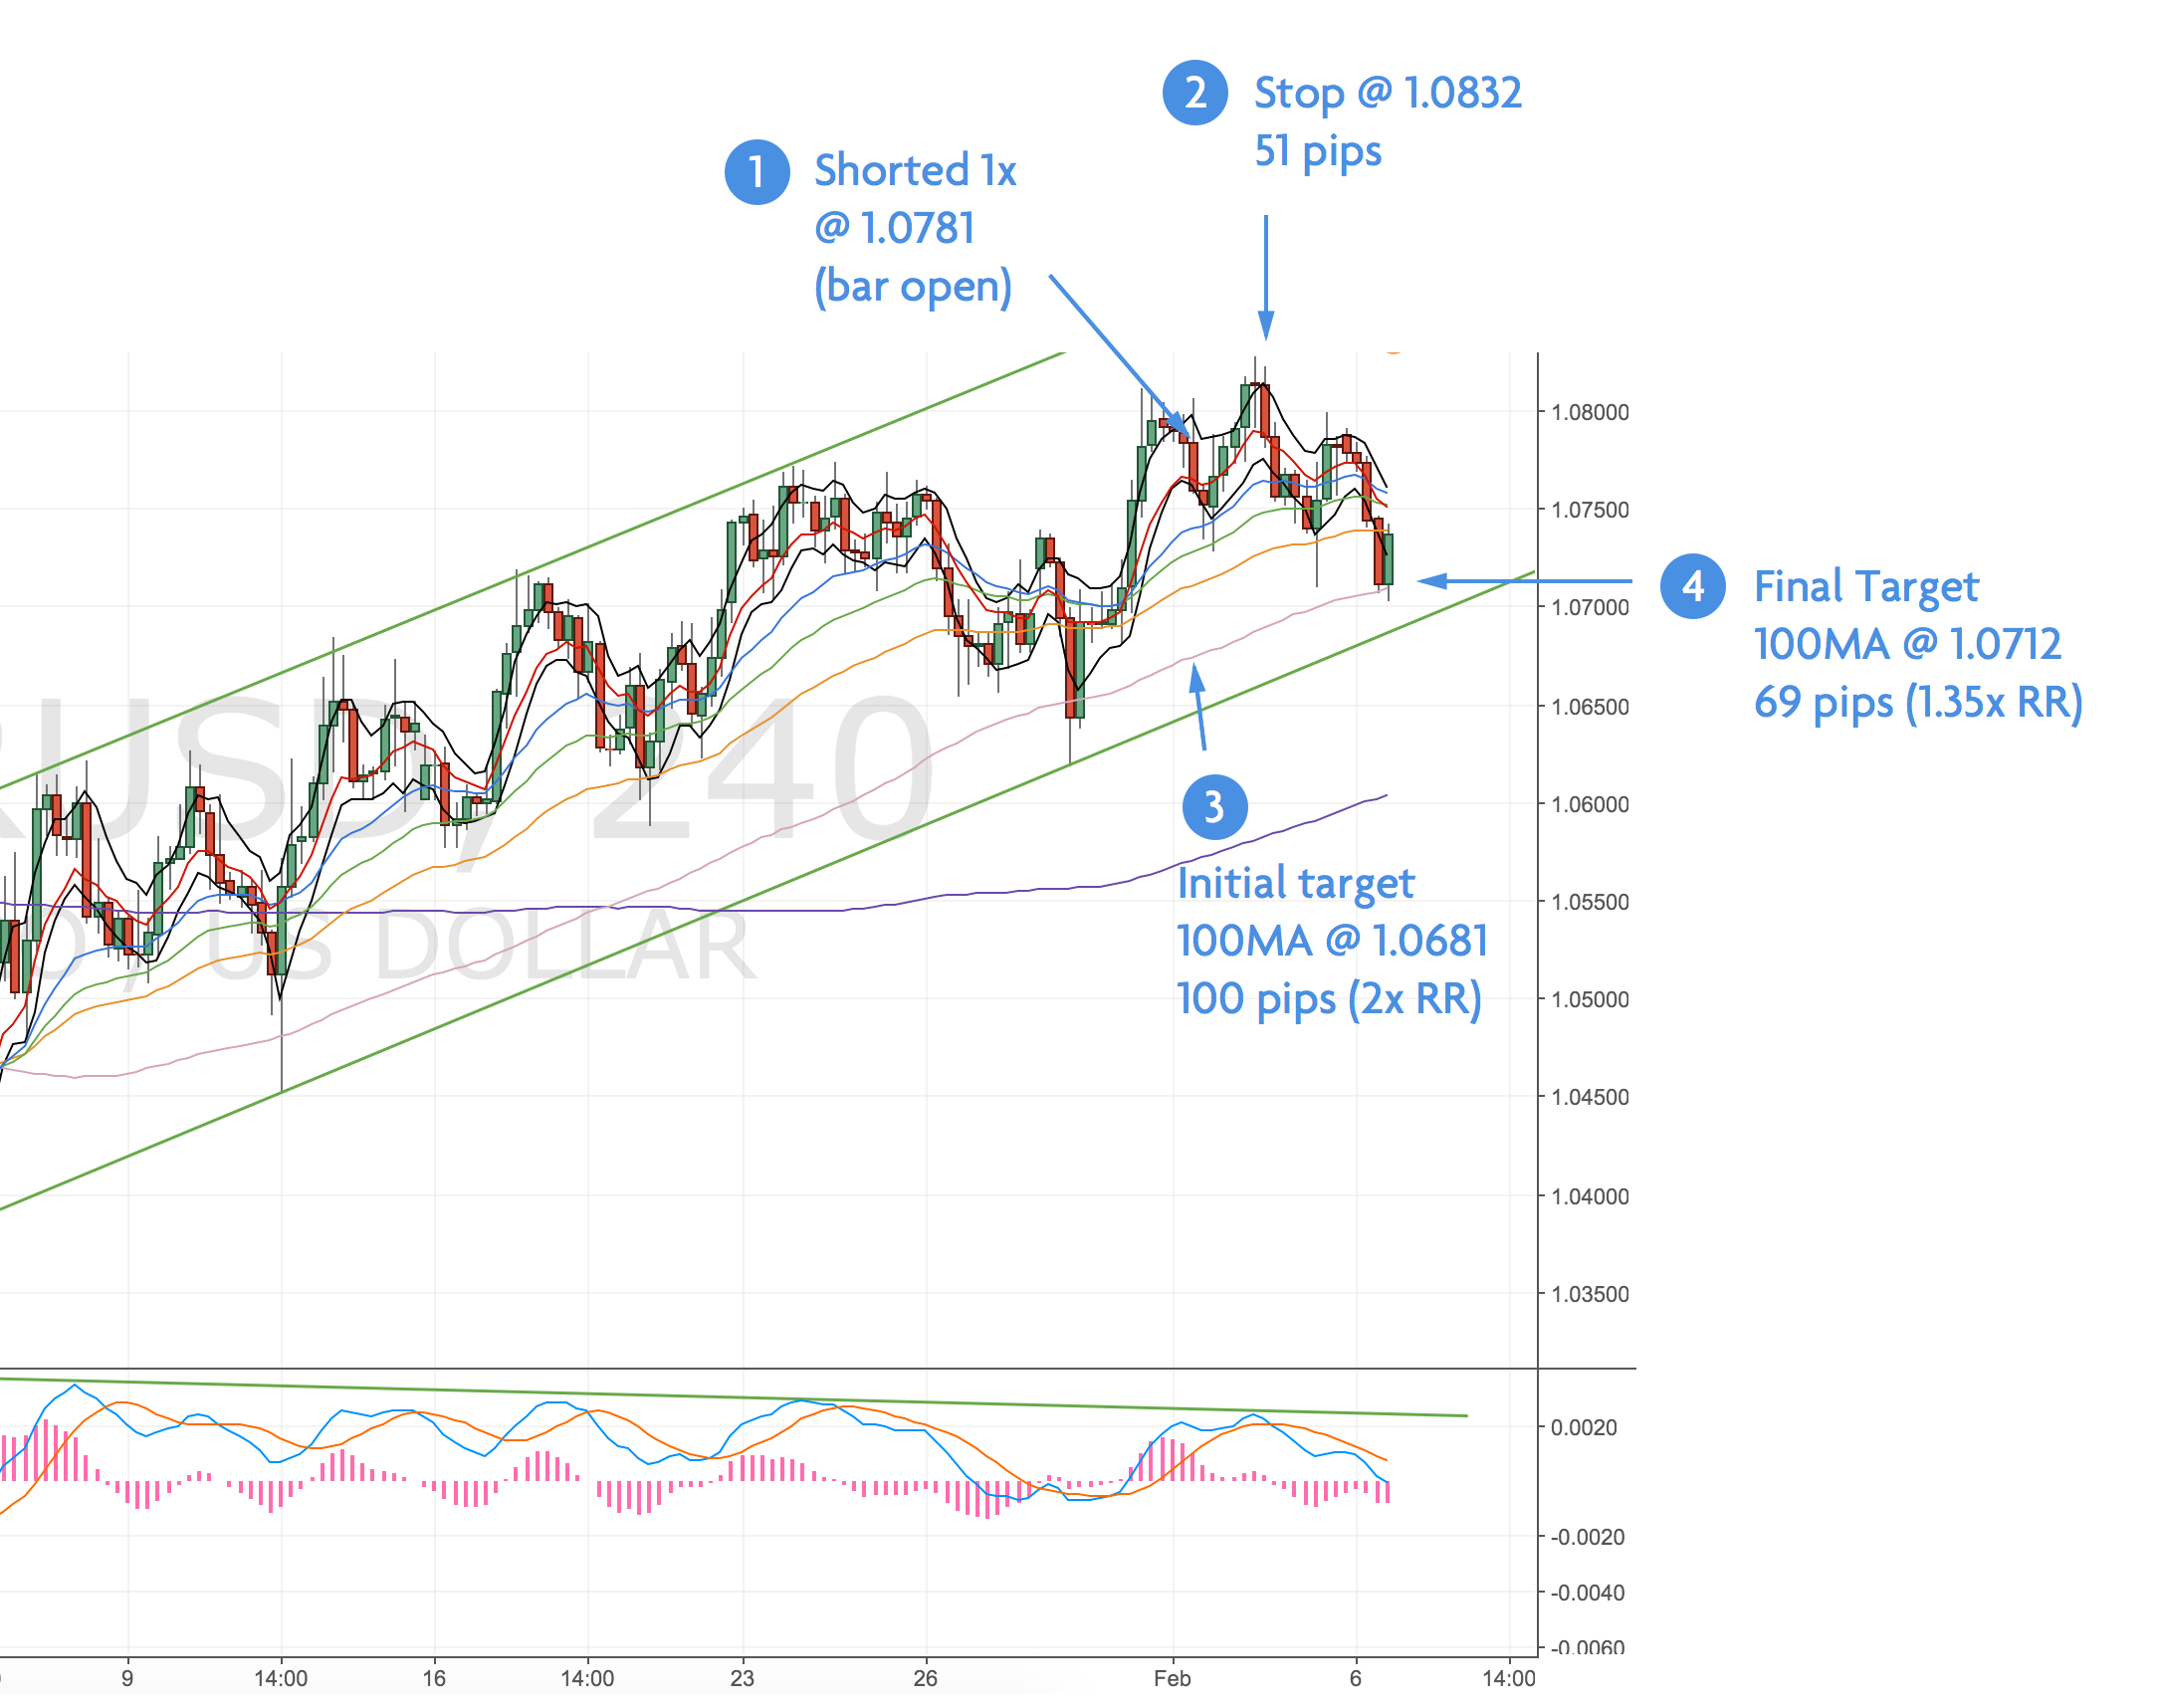
FInal trade, target hit at 1.0712.
I’ll take some time to digest how I felt during this trade, I wasn’t super confident about it to start with, so feel lucky that it worked out. Especially after the NFP results. It looks pretty textbook now – so I should be happy.
Looking again at the chart, I noticed the divergence goes back further. I didn’t spot when I placed the trade, and in hindsight it might’ve been better to take two positions and run the 2nd to the 200MA? We’ll see how this pans out.