Total Acc Risk: 0.5% => 1.1%
EURUSD
Acc Risk: 0.2% => 0.5%
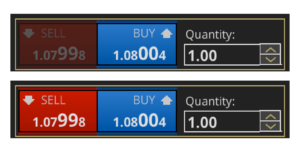
Entry: 1x 1.0864, 2x 1.08750 (market order)
Stop: 3x 1.0915 (51 pips)
Target 1: 2x 1.0787 (4h50, 77 pips 1.5 RR)
Target 2: 1x 1.0690 (4h100 & d20, 174 pips, 3.4 RR)
XAUUSD
Acc Risk: 0.3% => 0.6%
Entry: 2x 1253.8, 2x 1258.0 (market order)
Stop: 1263.3 (Avg. 77 pips)
Target: 4x 1241 (4h50, 128 pips, 1.35 RR)
Updates
XAUUSD order triggered, now in the full trade – 28 Mar
Cancelled the remaining EURUSD Order – 29 Mar
closed some positions – 30 Mar
have added to my gold position – 5 Apr
NFP tomorrow, feeling ominous – 6 Apr
Stopped out – 7 Apr
Still tracking Gold – 11 Apr
Gold heading higher – 13 Apr
This is a more complex trade for me. I have a few xyzUSD pair shorts either setting up or currently diverging. So I’ve split my exposure to the USD across the best looking set ups (EURUSD and XAUUSD). I feel uneasy about these two trades, I feel obliged to take them as my scan shows so many correlations right now.
The problem I’m struggling with; I can’t seem to get a run of winning trades going and it feels like I am beginning to hemorrhage money. I’m desperate to close my reasonable profits on my GBPJPY long, it’s close to target, but that just isn’t disciplined.
I have to remind myself that I am taking these two trades because my monthly reviews show when I pass on divergences, I will usually regret it in hindsight. However, the long USD trade seems so obvious to me right now.
Of those set ups I have chosen XAUUSD and EURUSD to go short on, primarily because the charts seem to have the cleanest set ups (i.e. touching long term MAs and diverging on the 4H and almost on the Daily timeframes – sort of 🙂 !).
Here are the set ups.
Gold Daily & 4H Charts
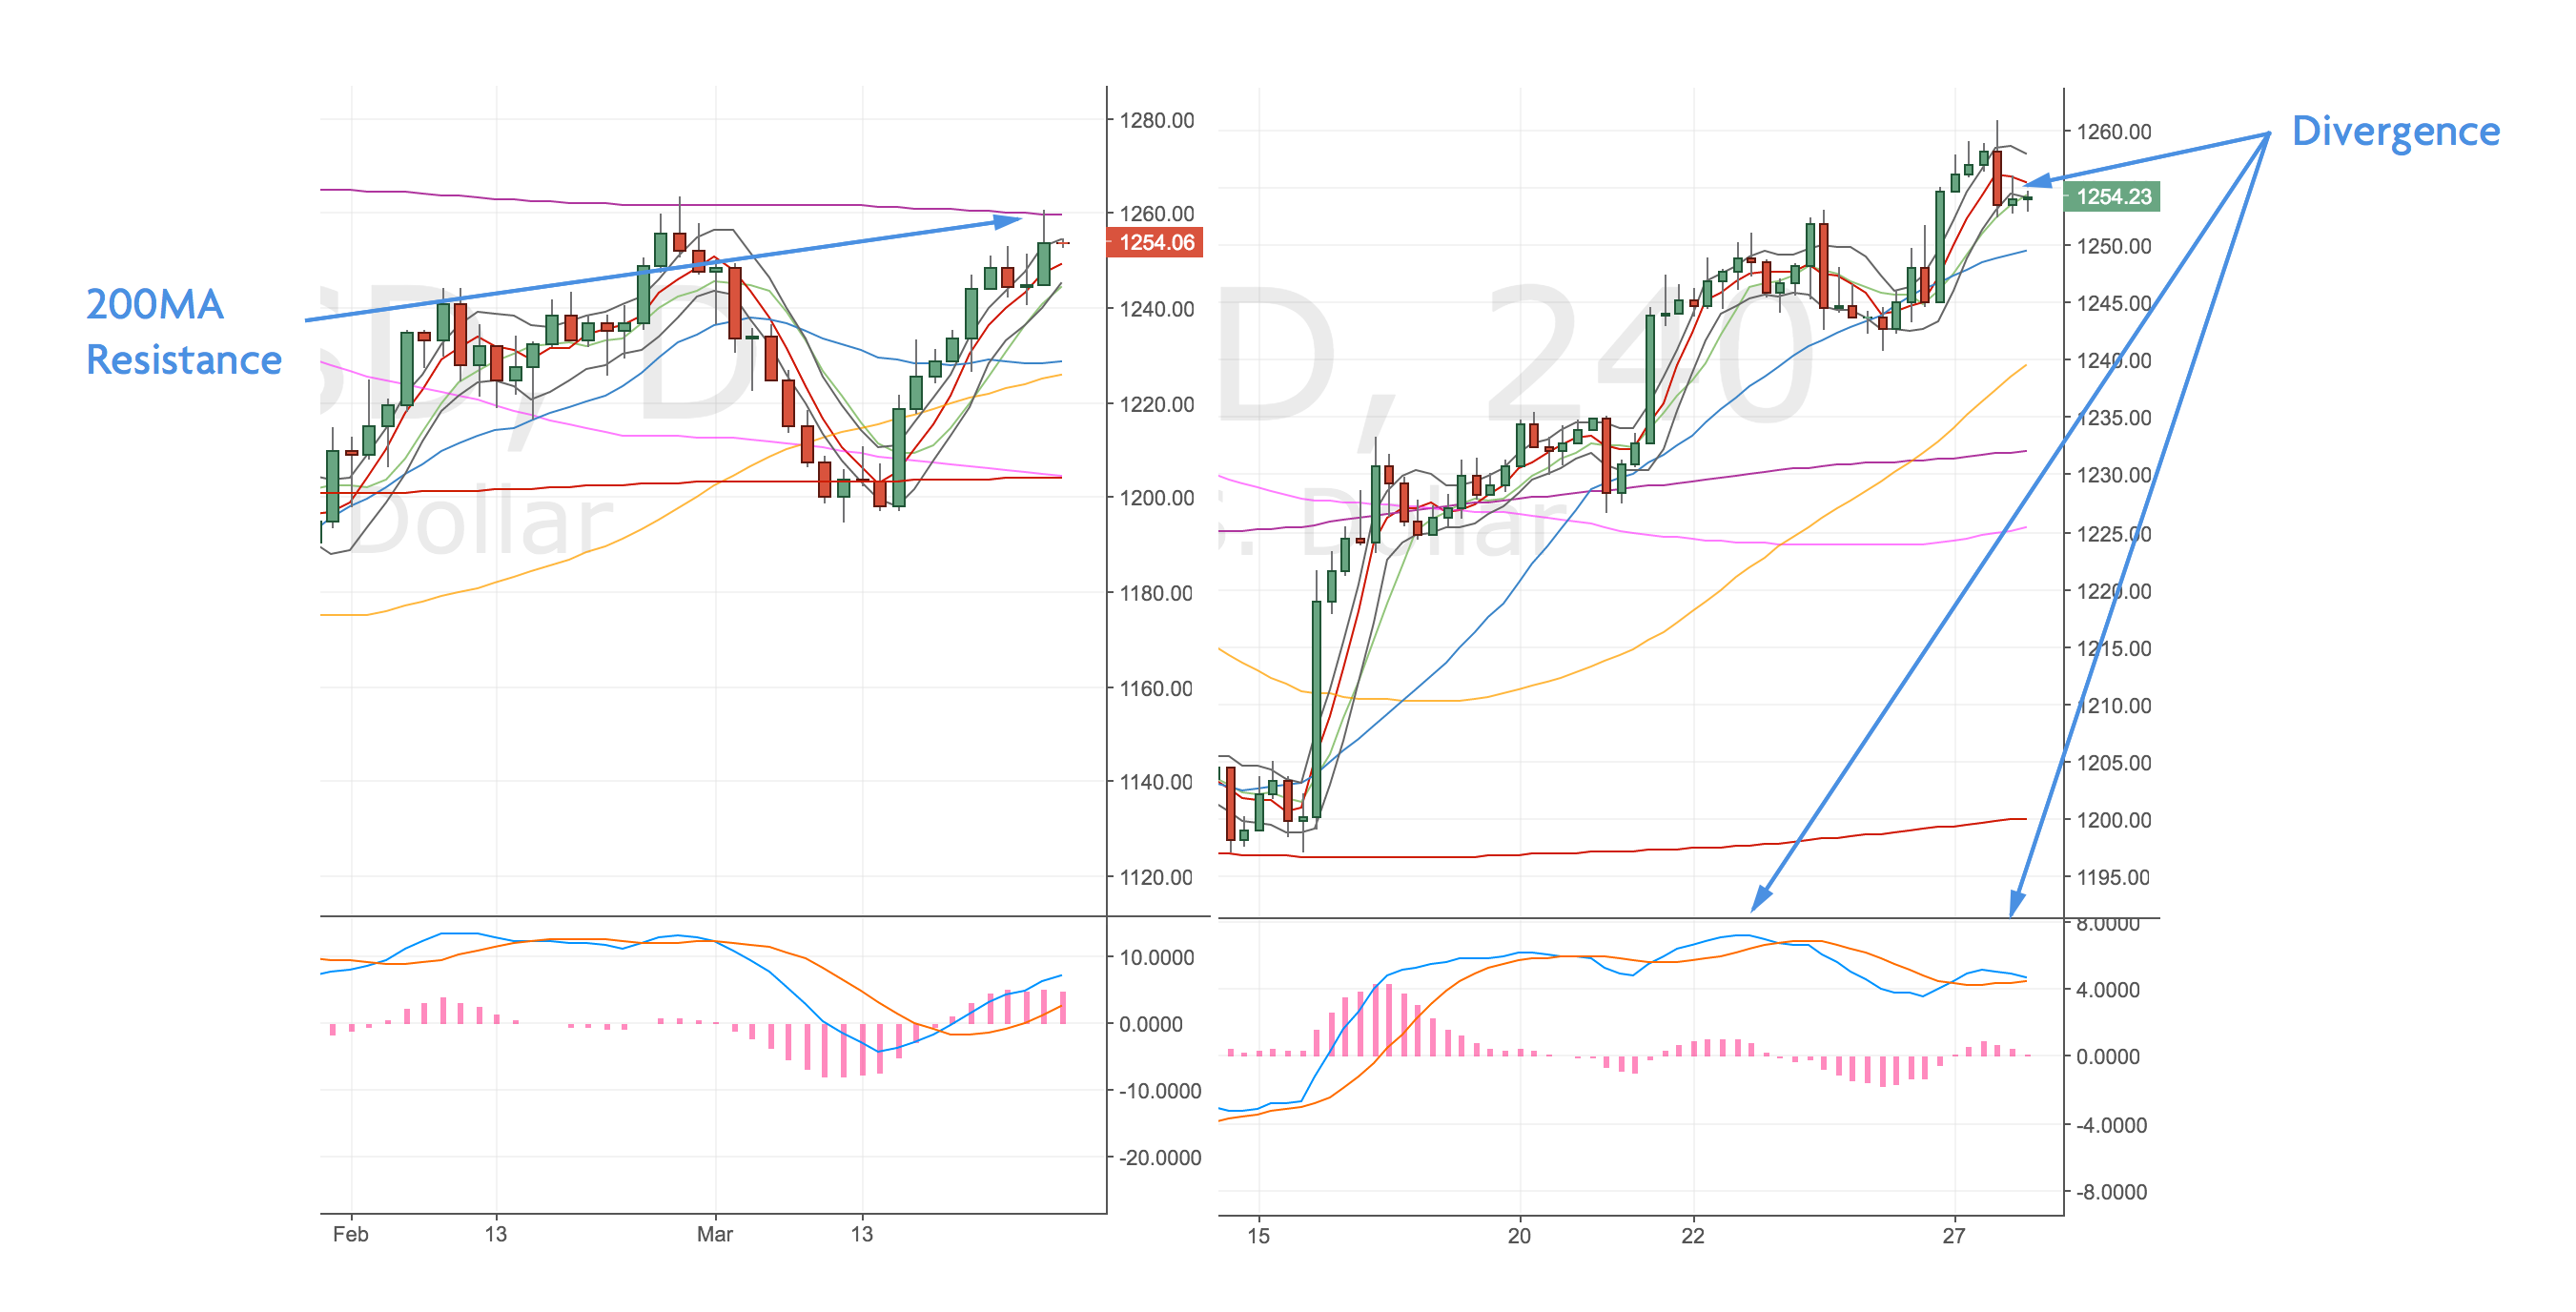
Gold Daily & 4H Chart – 27 Mar
The 4H divergence is pretty clear, the daily one isn’t but I’ve mentioned this before in my monthly trade reviews – it seems as though MAs distort some of the divergences either pulling or pushing price so the signal doesn’t set up.
Regardless, I am trading this on the 4H divergence – aiming for the 50MA. It’s a pretty crap RR when you consider the 50MA will be moving higher, but still in my favour for now.
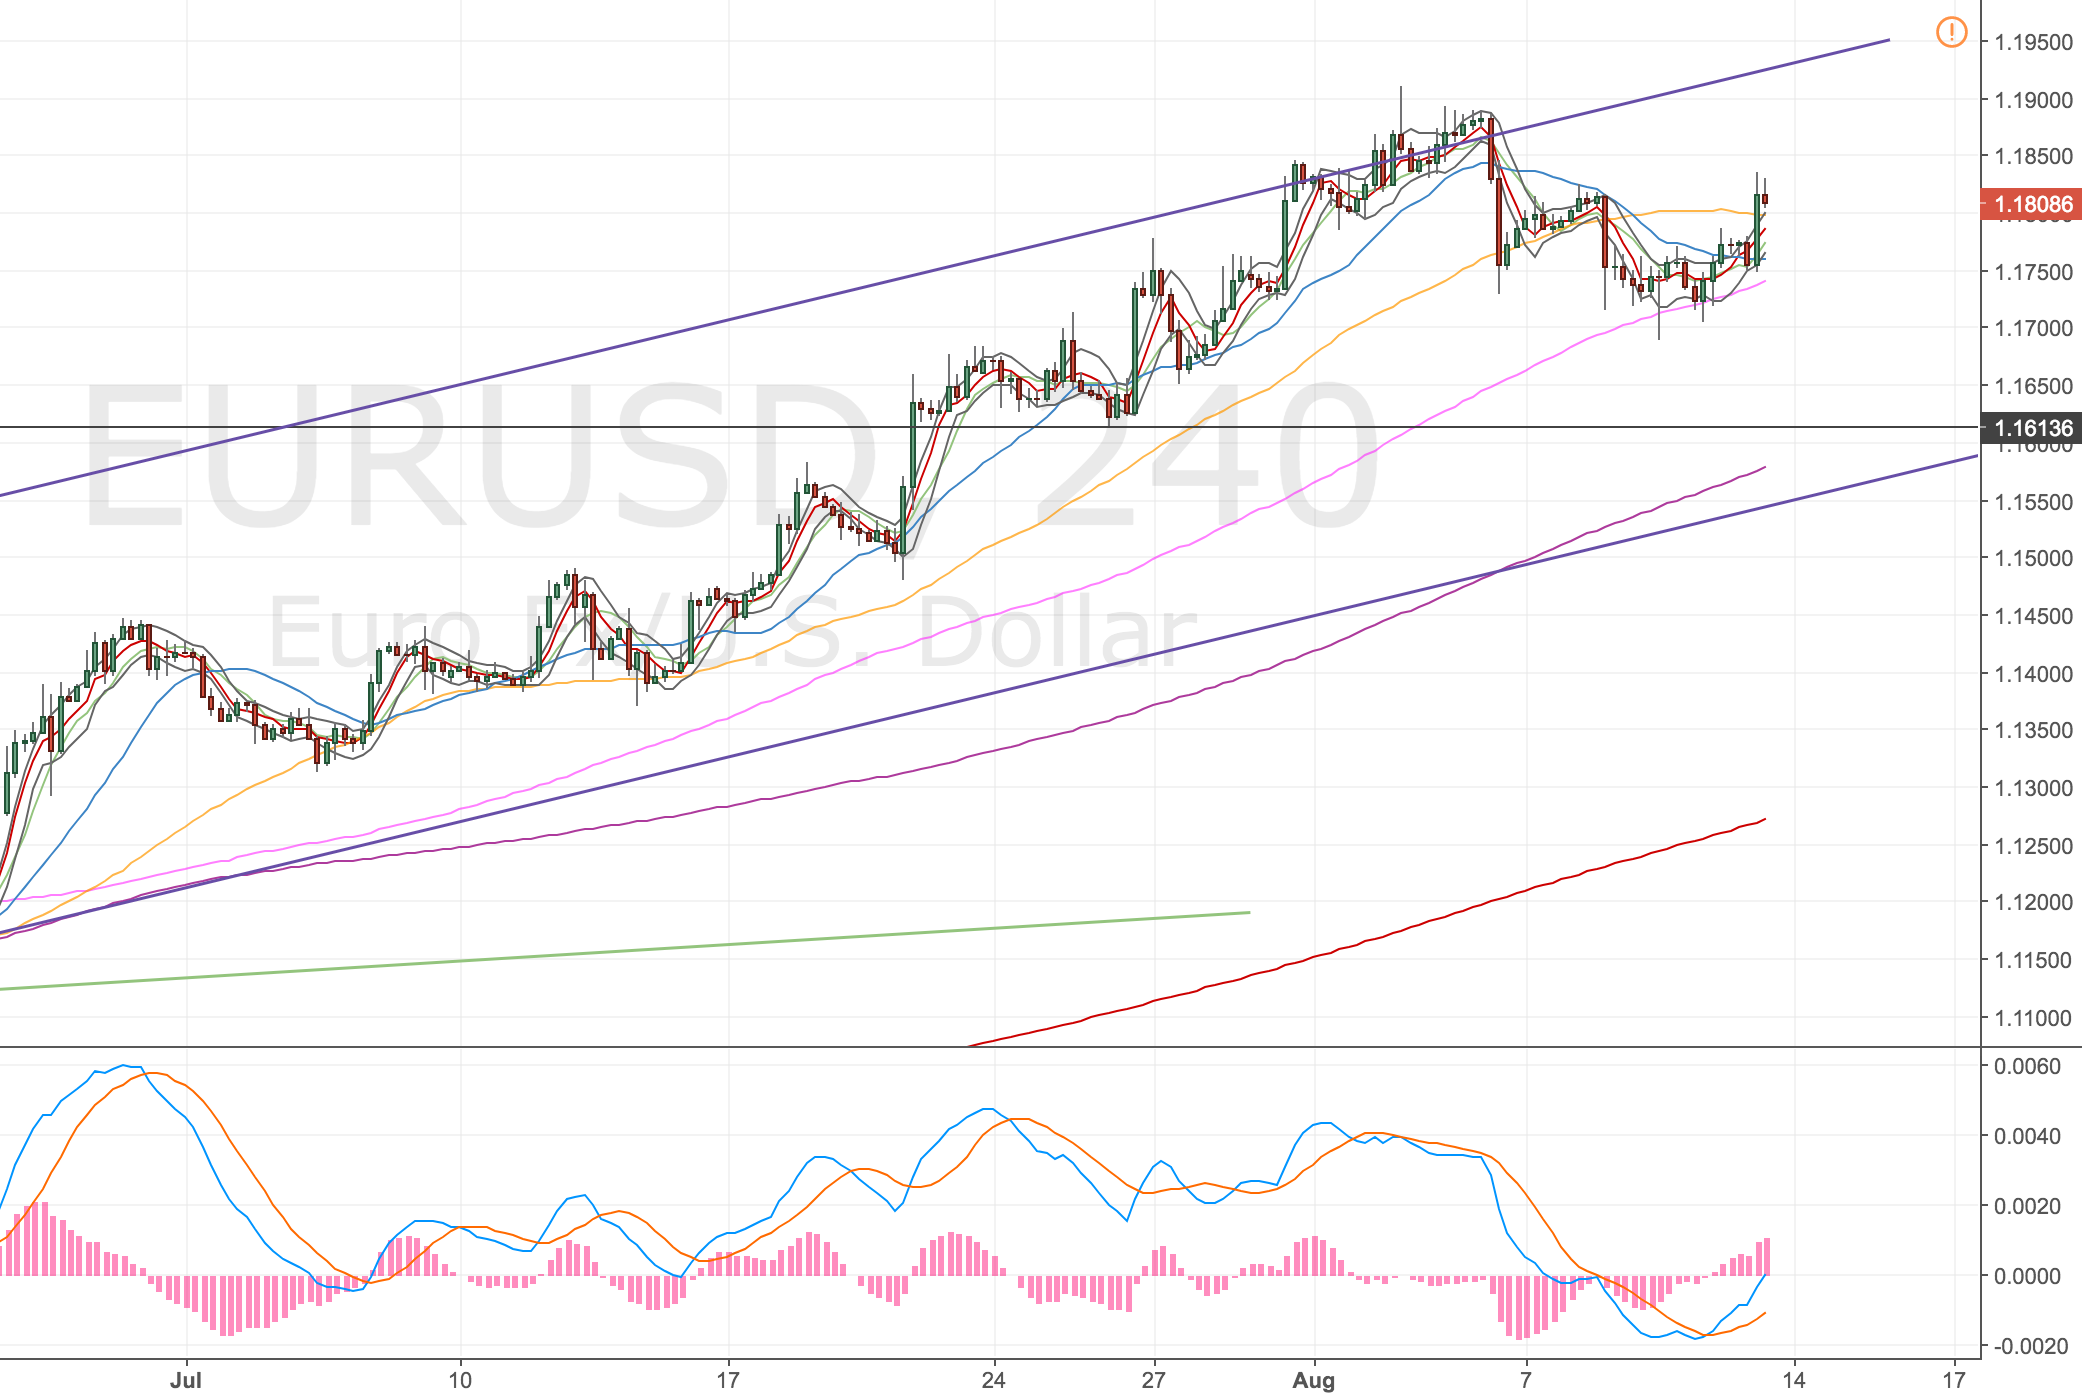
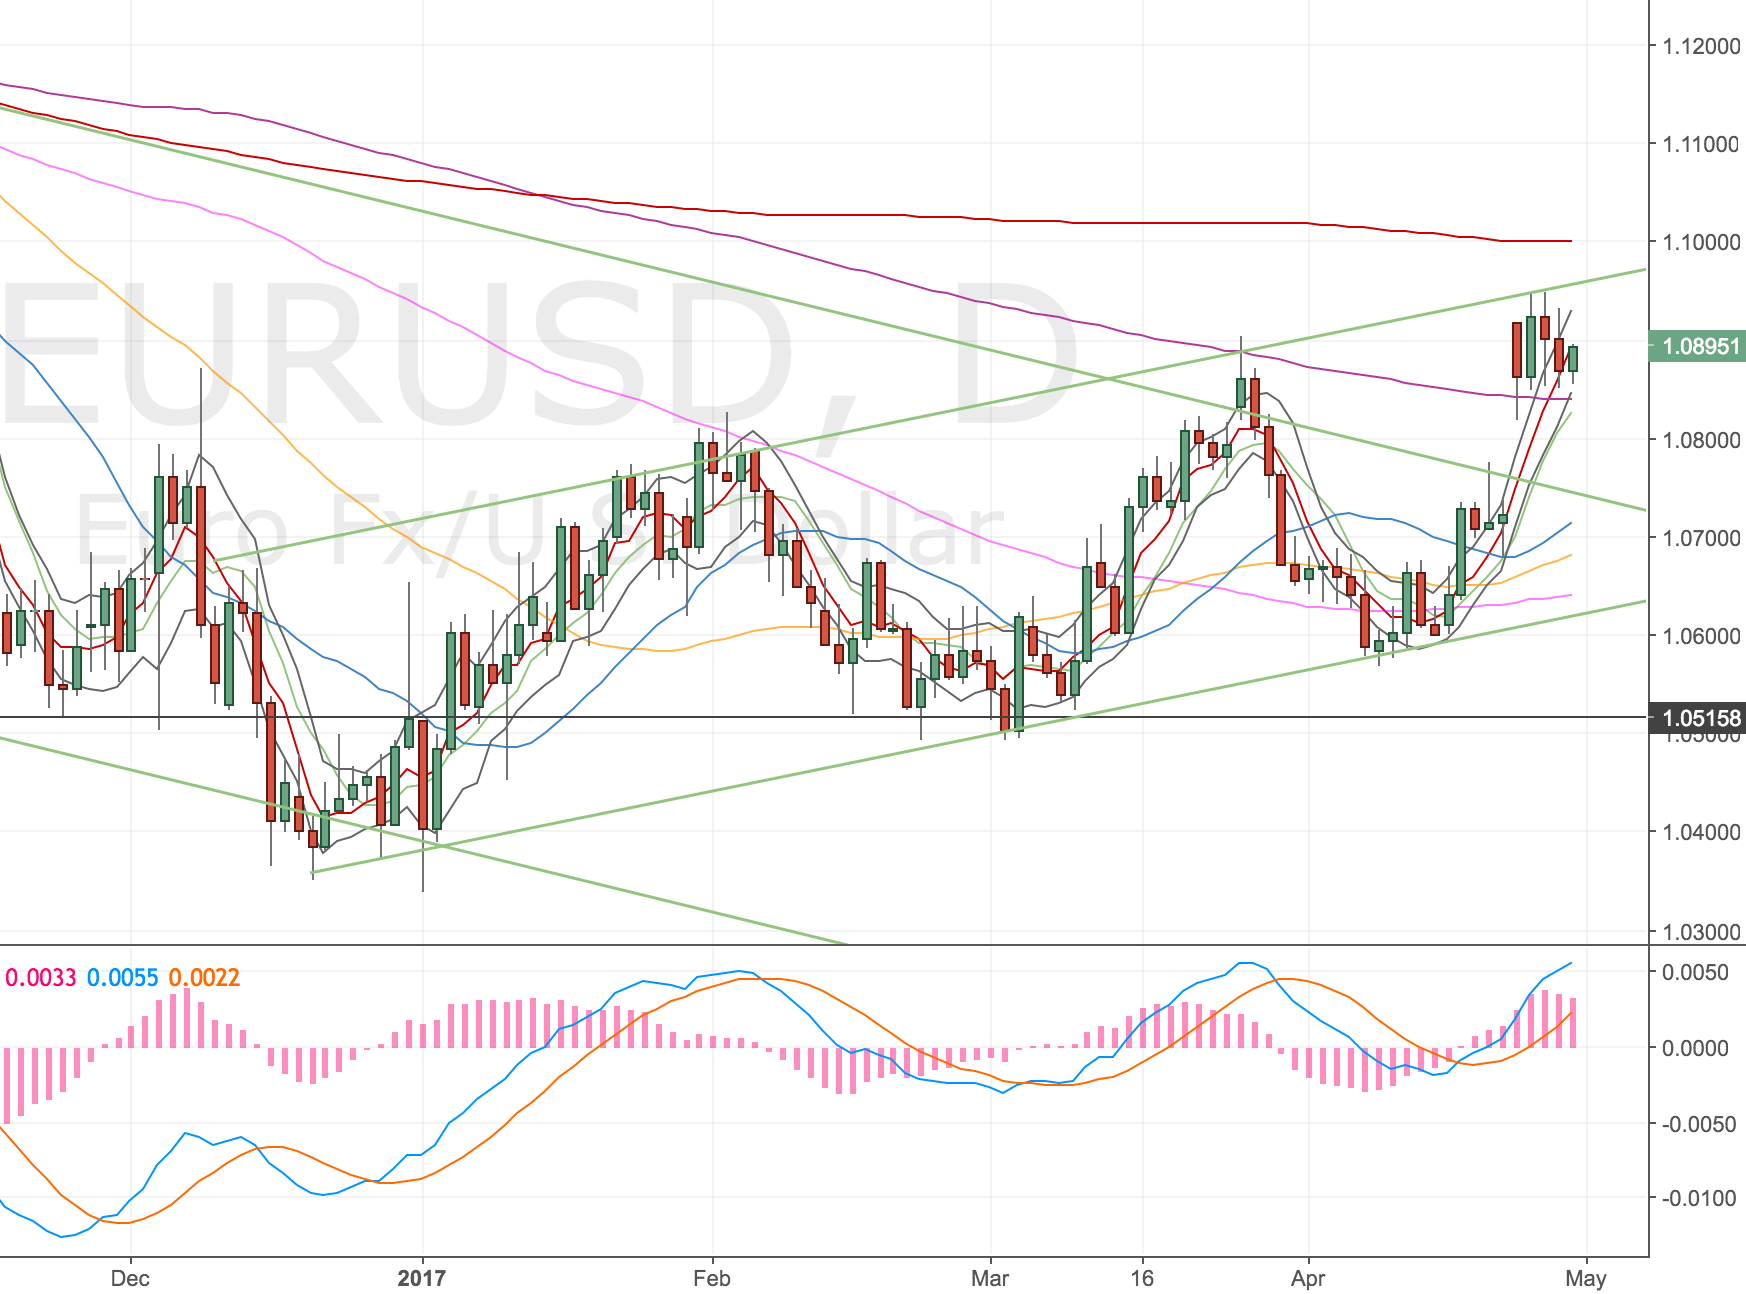
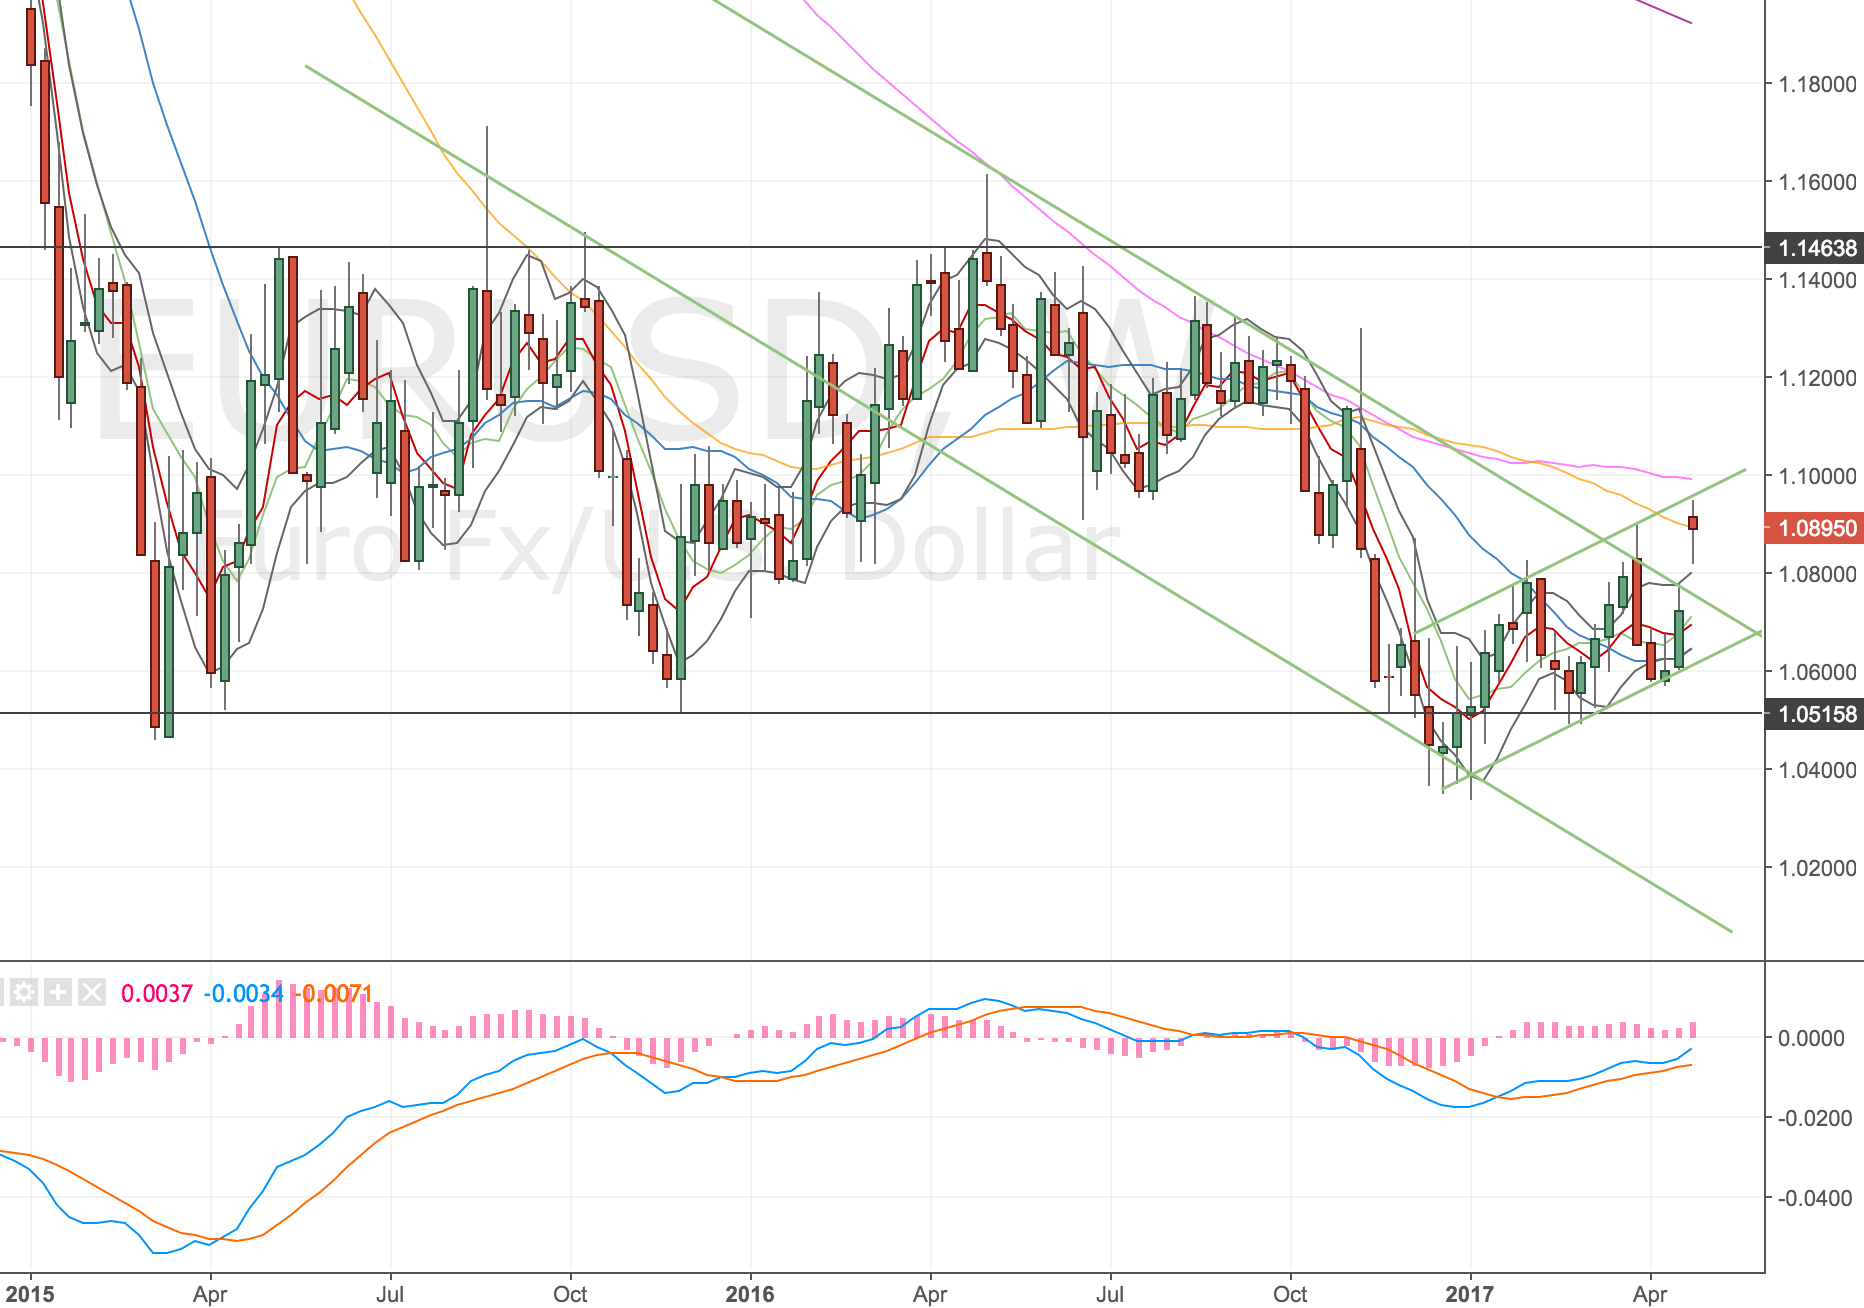
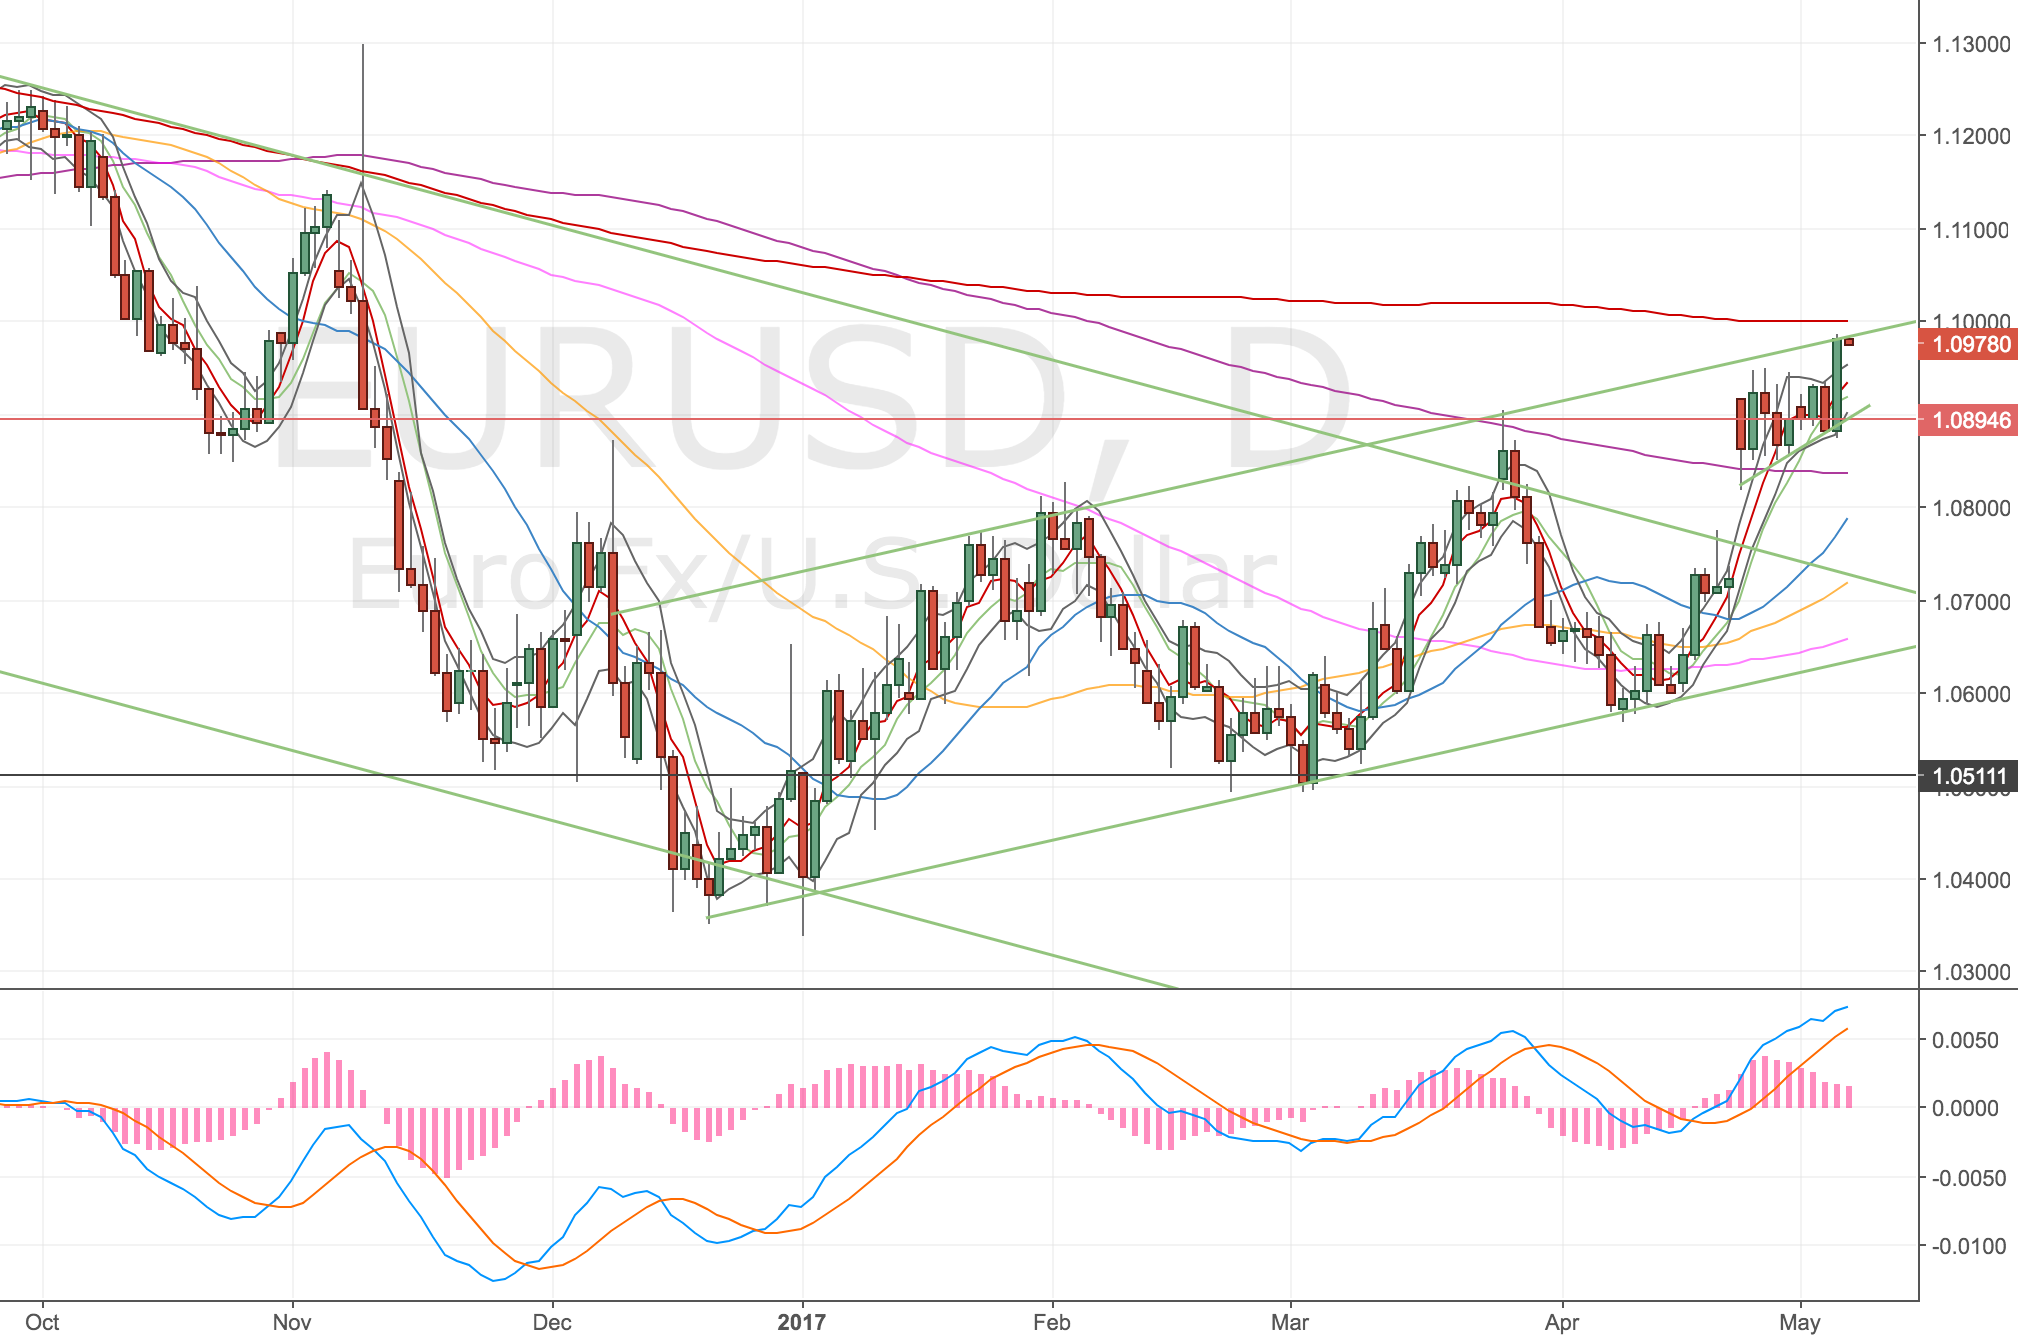
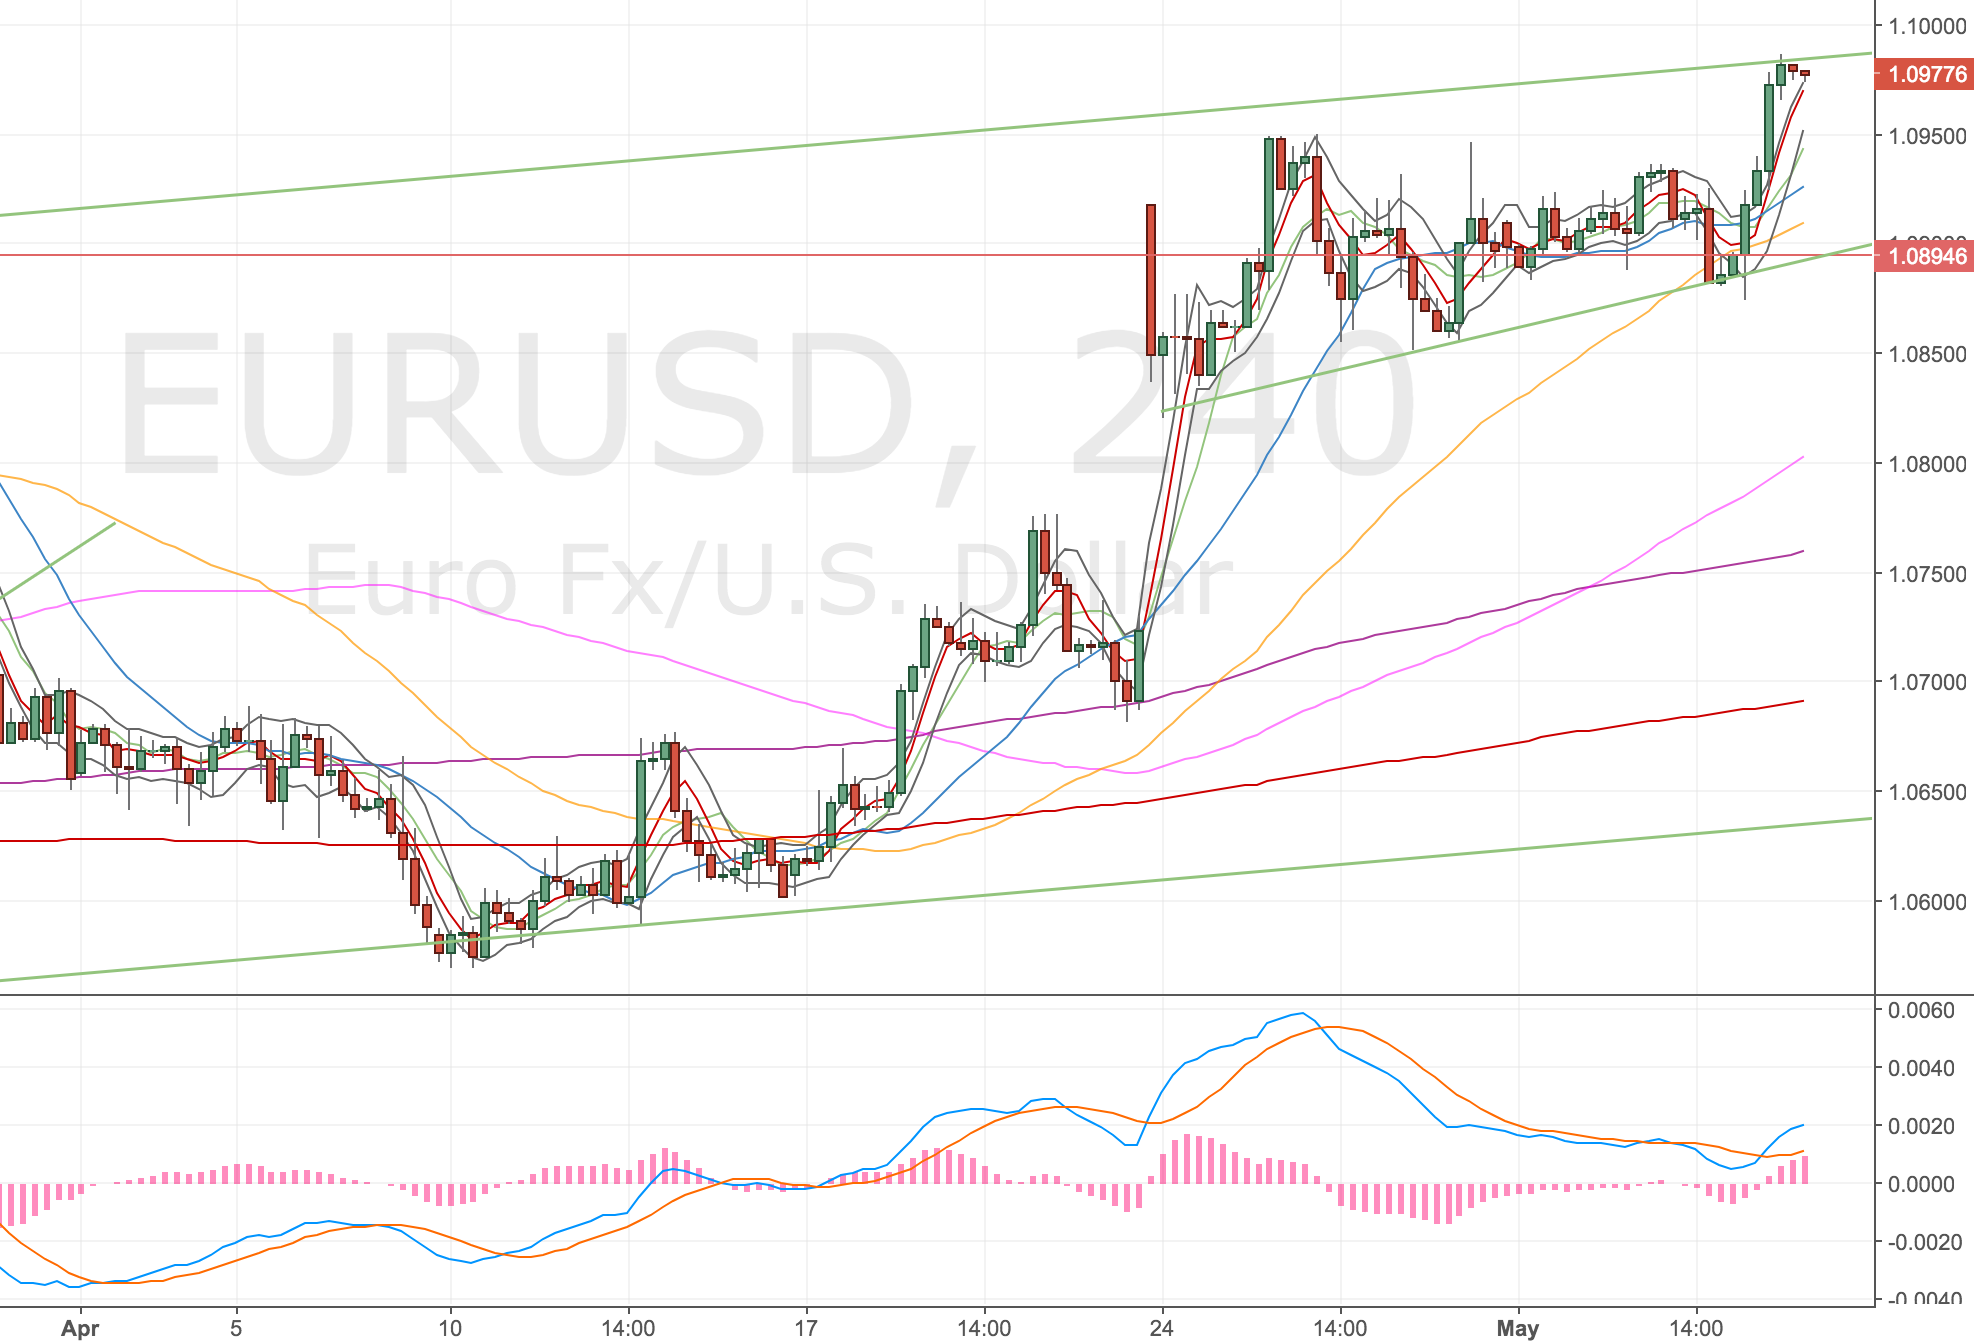
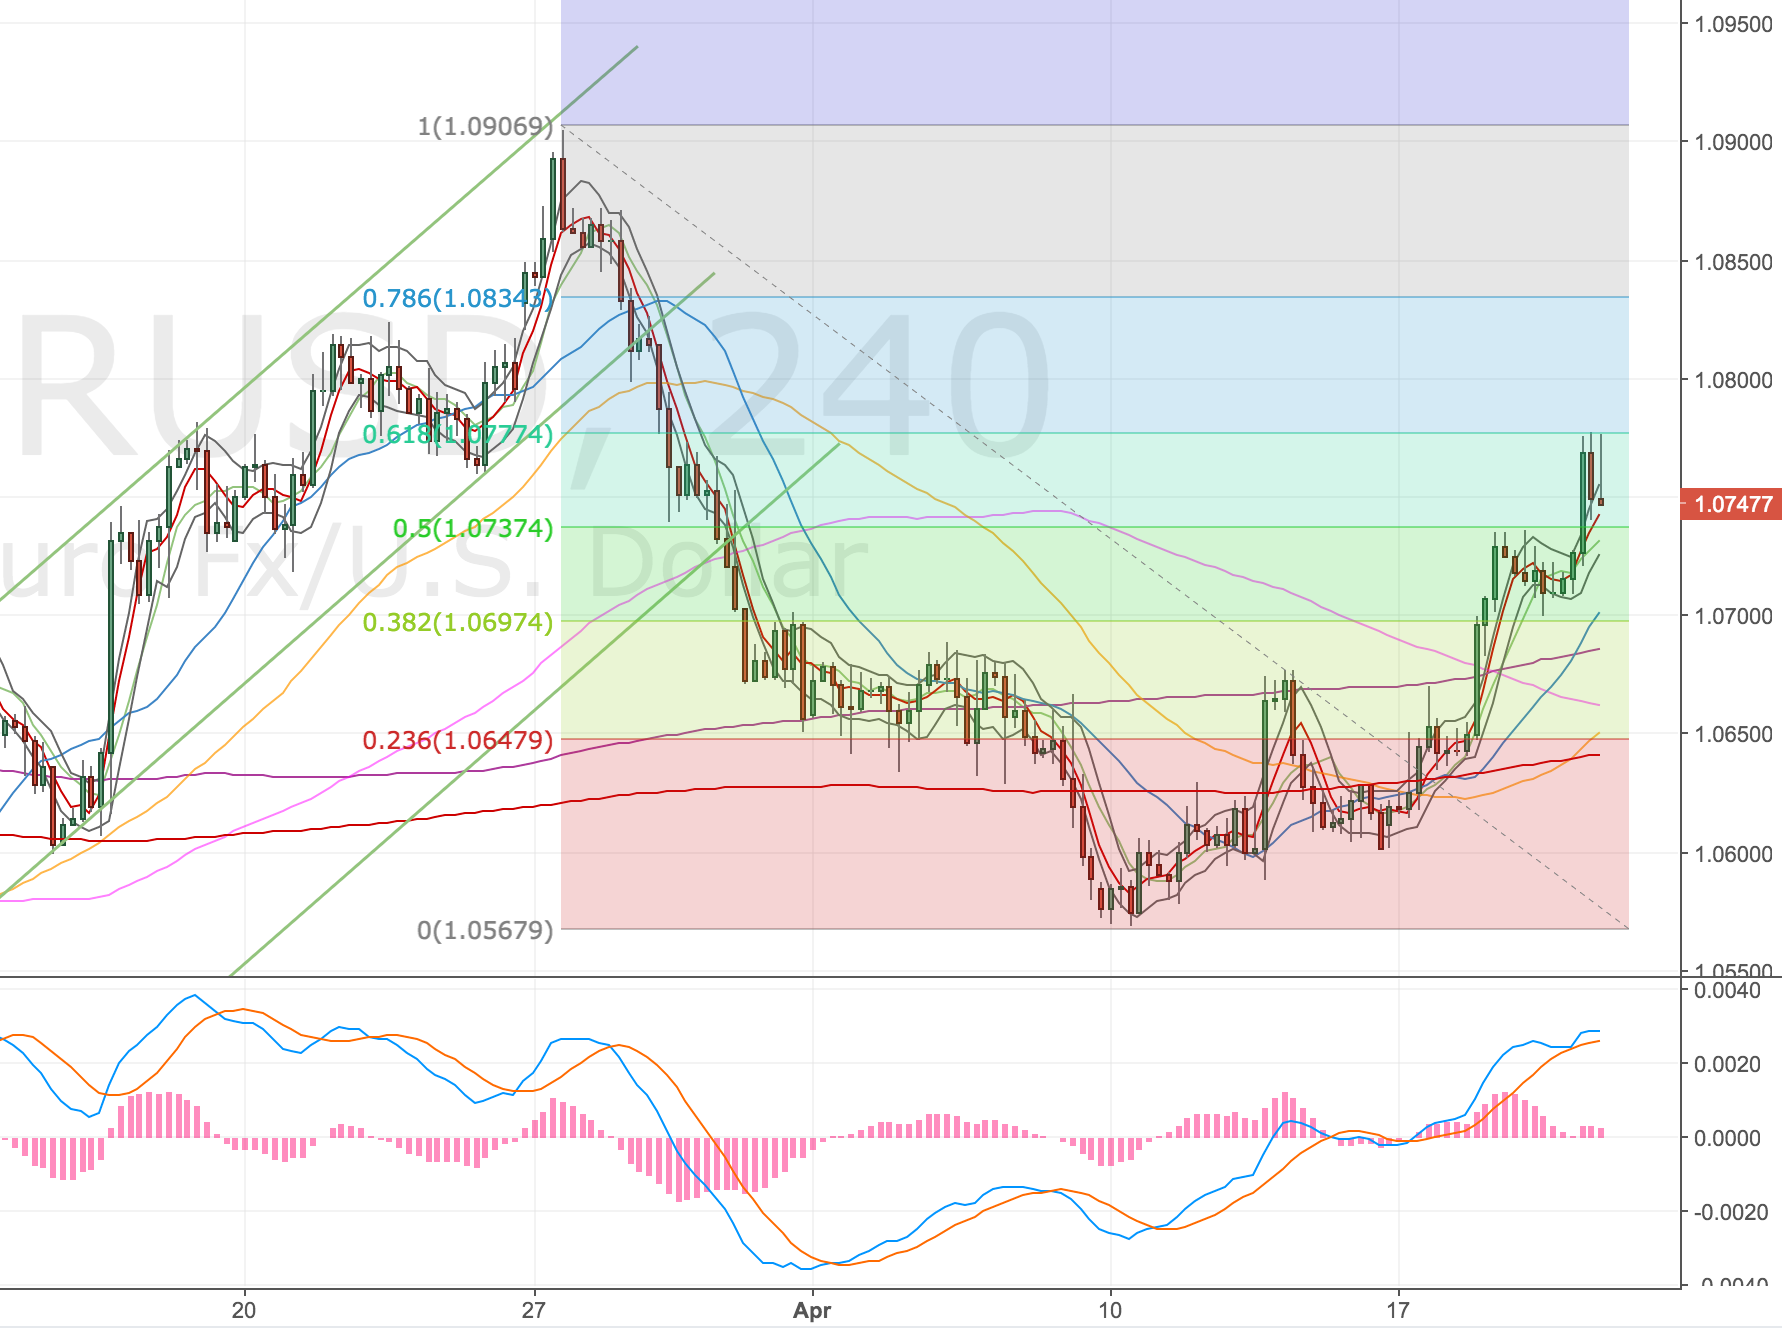
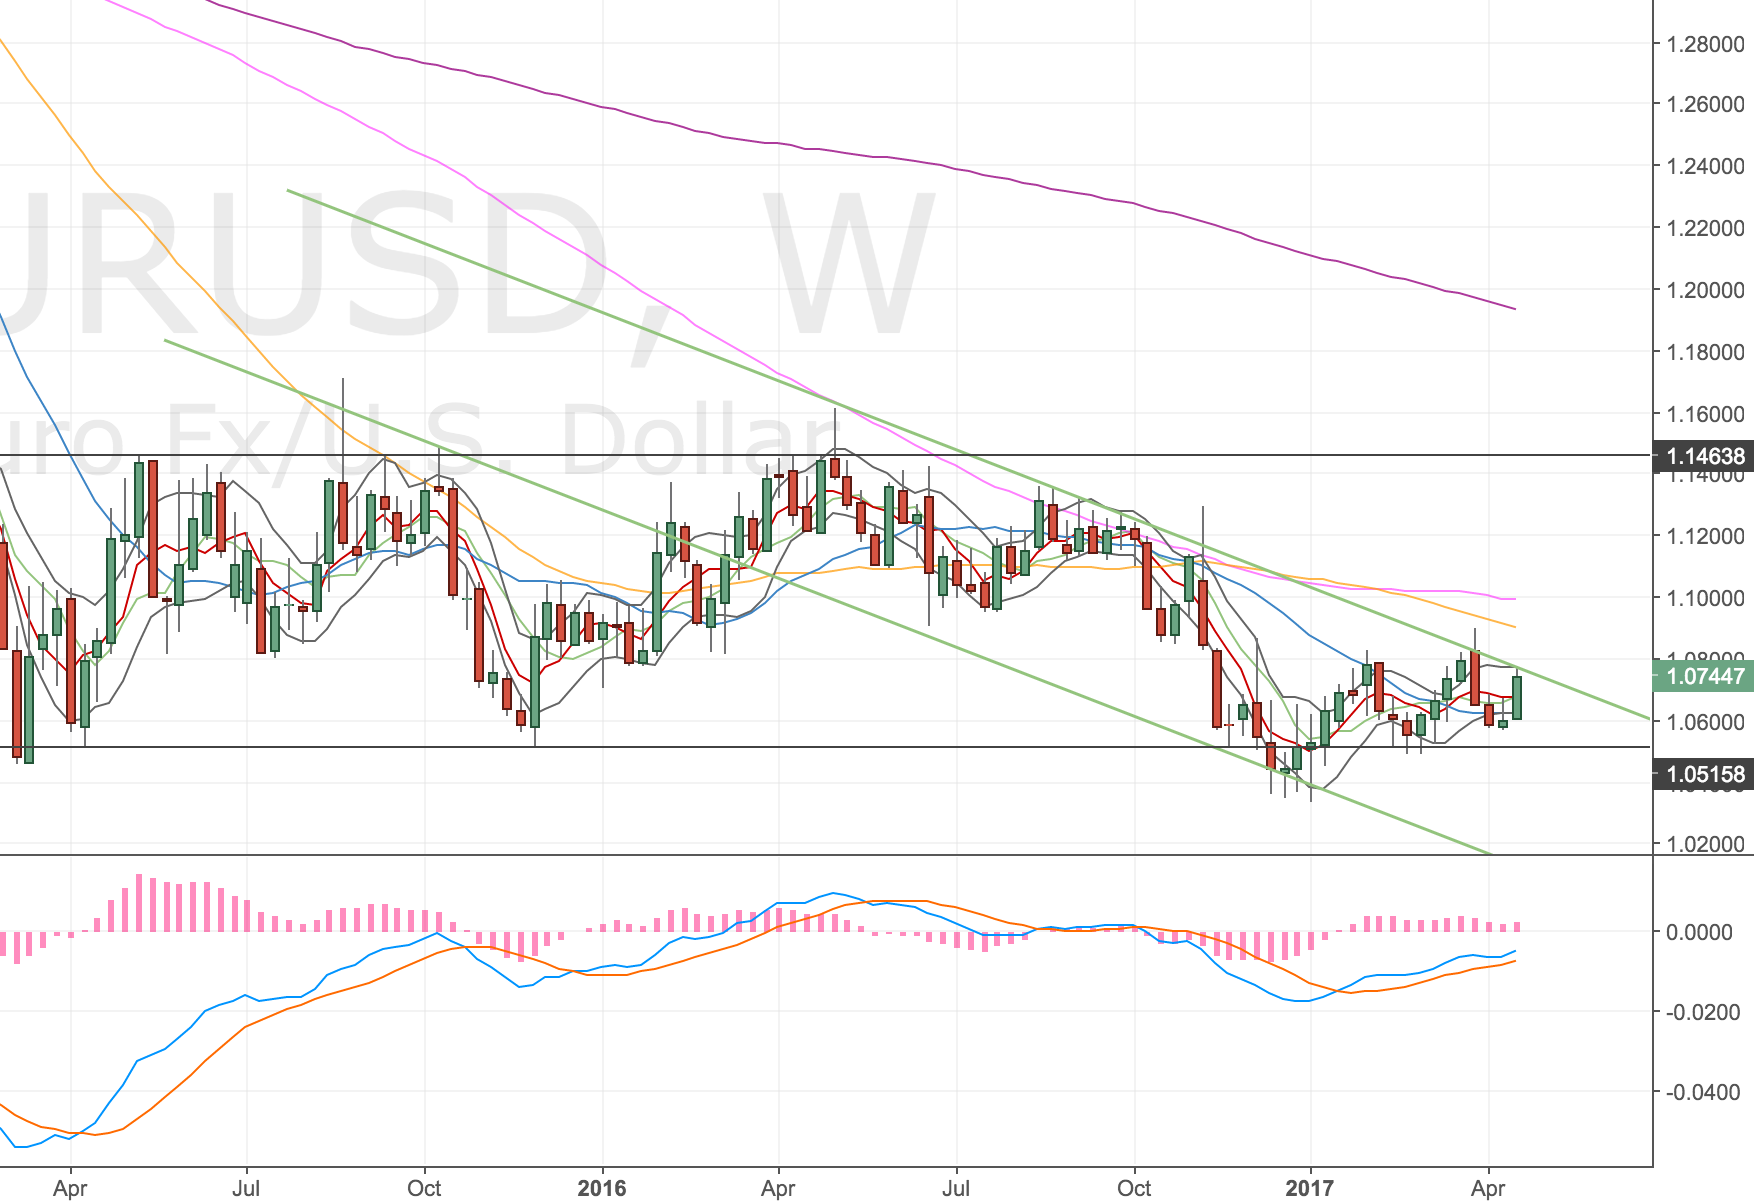
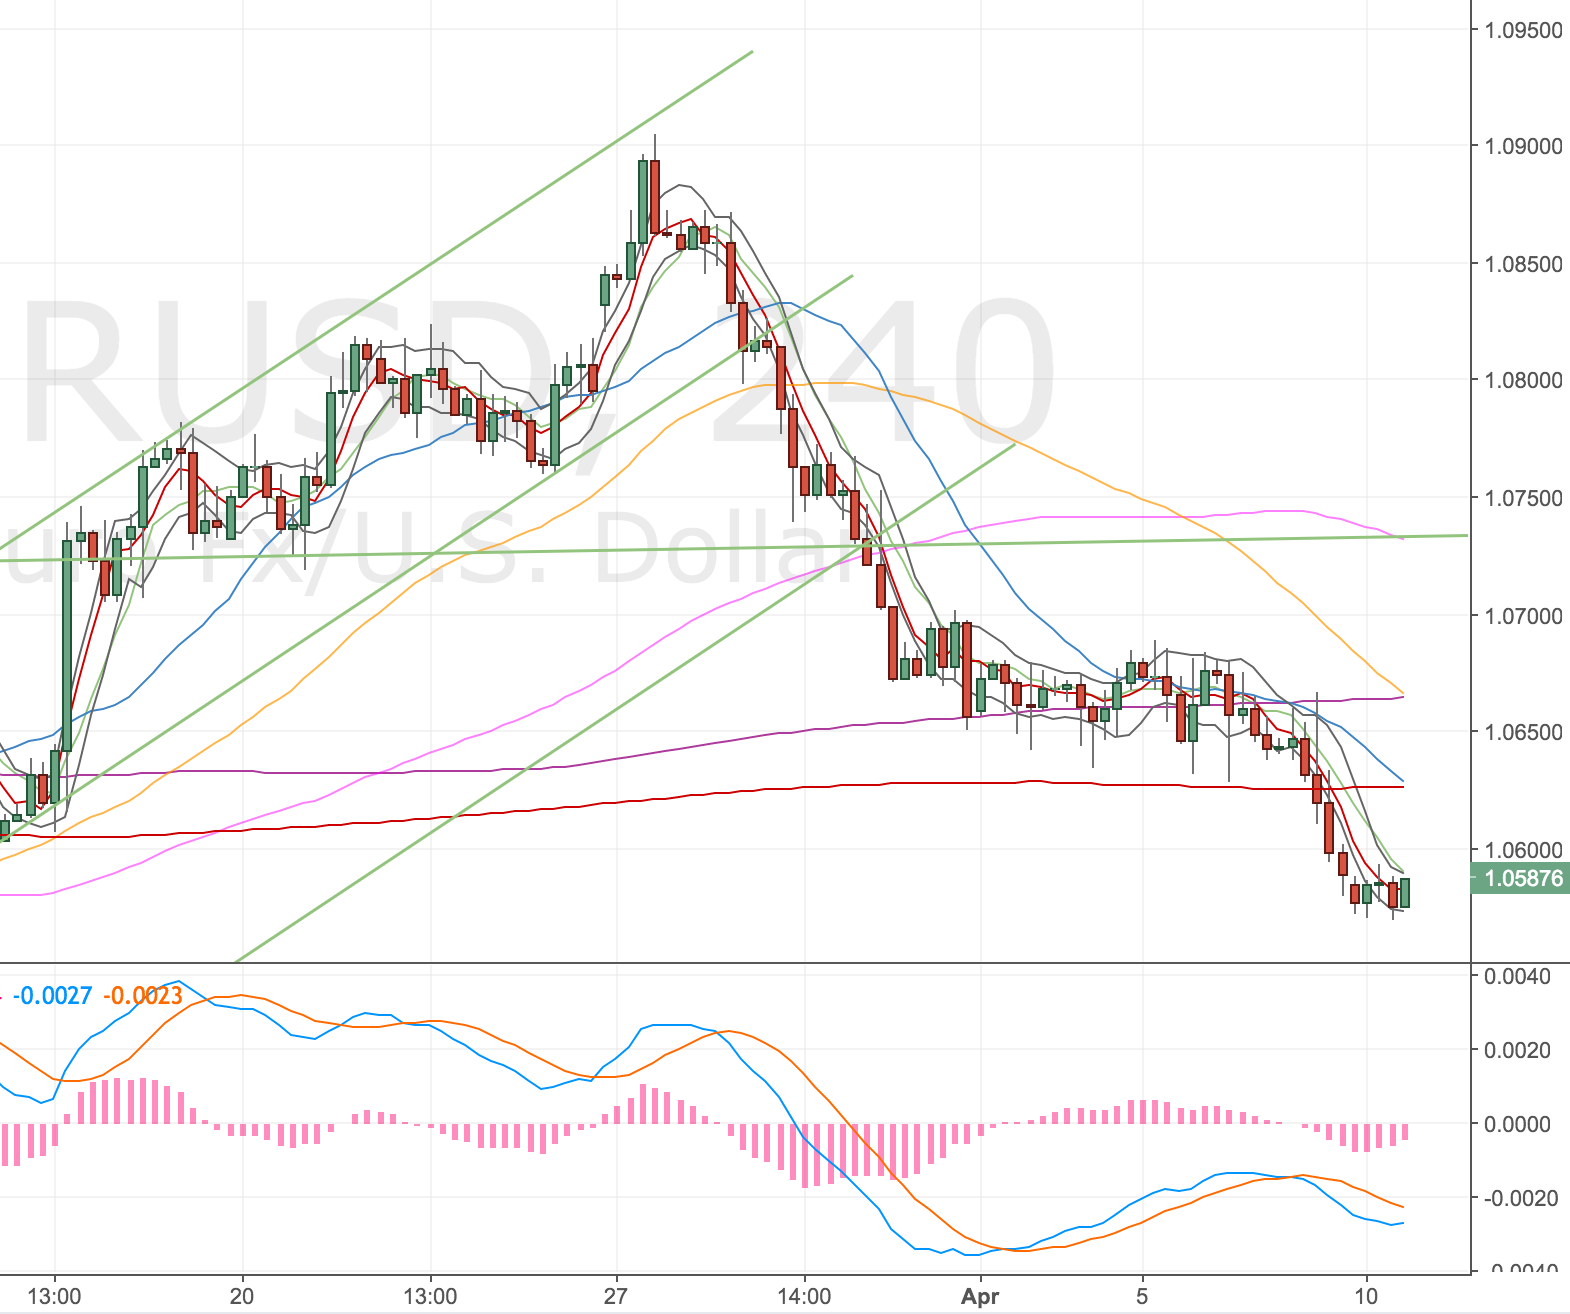
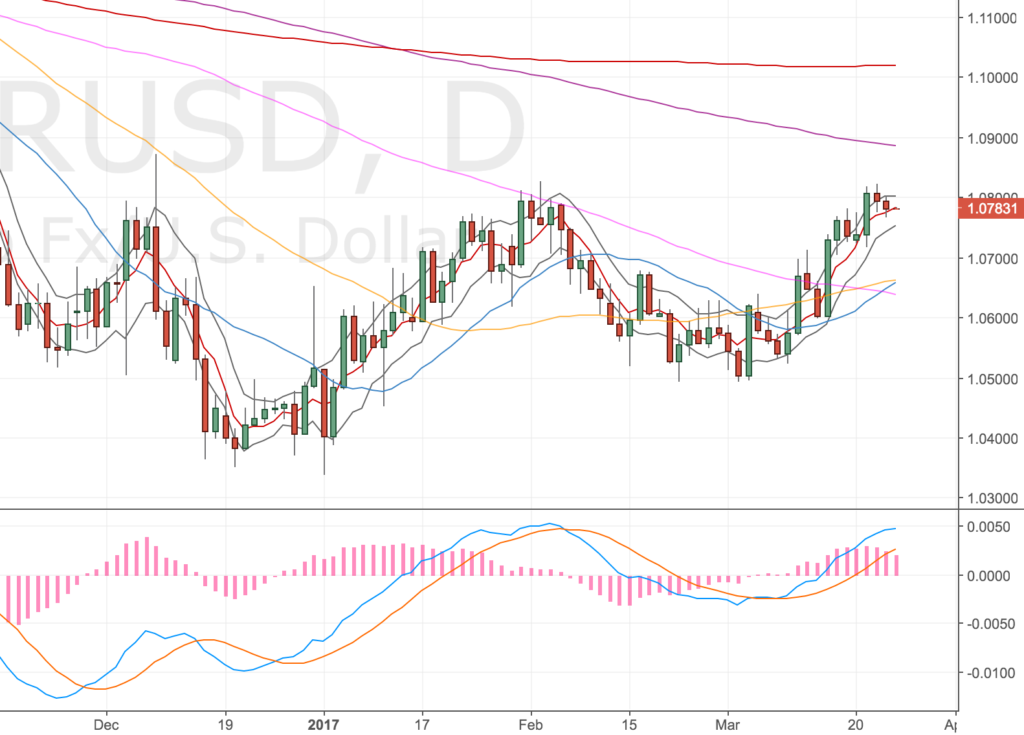
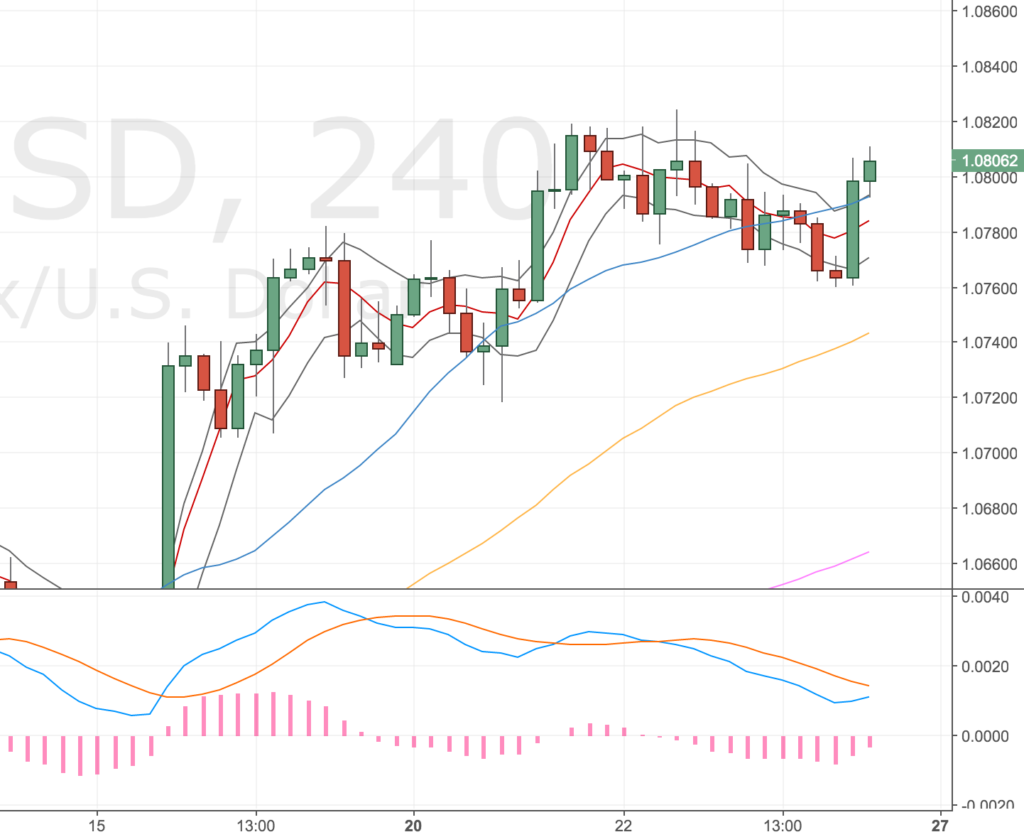
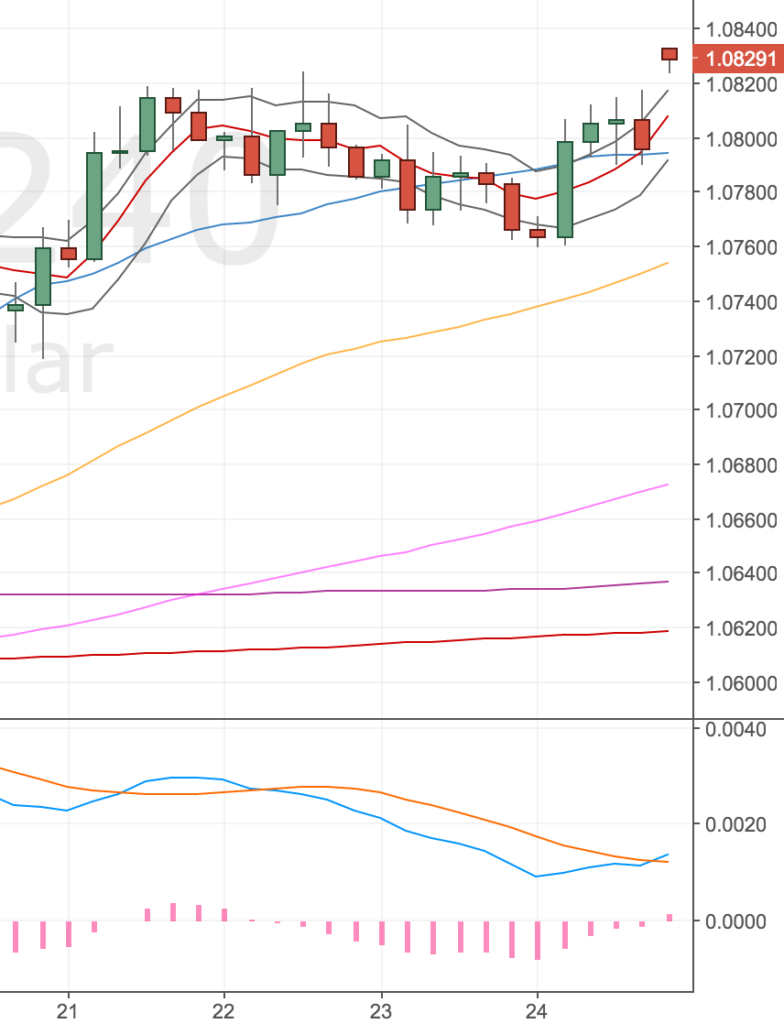
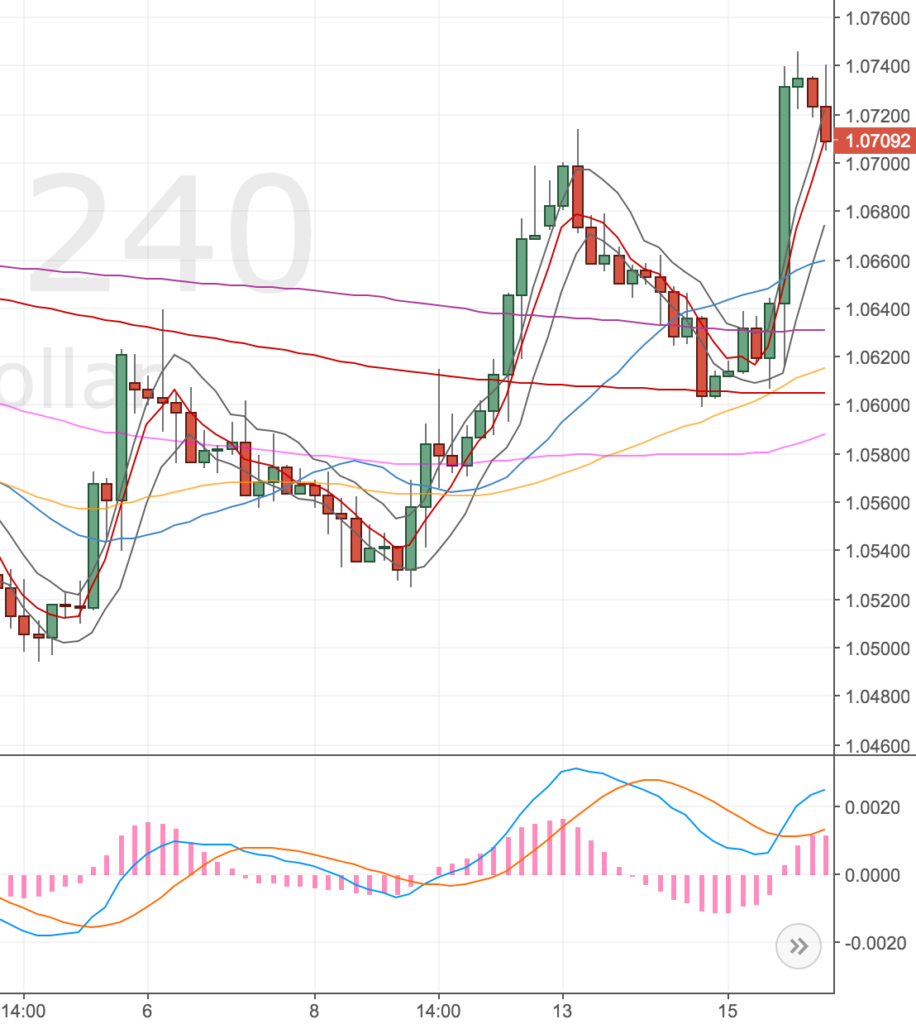
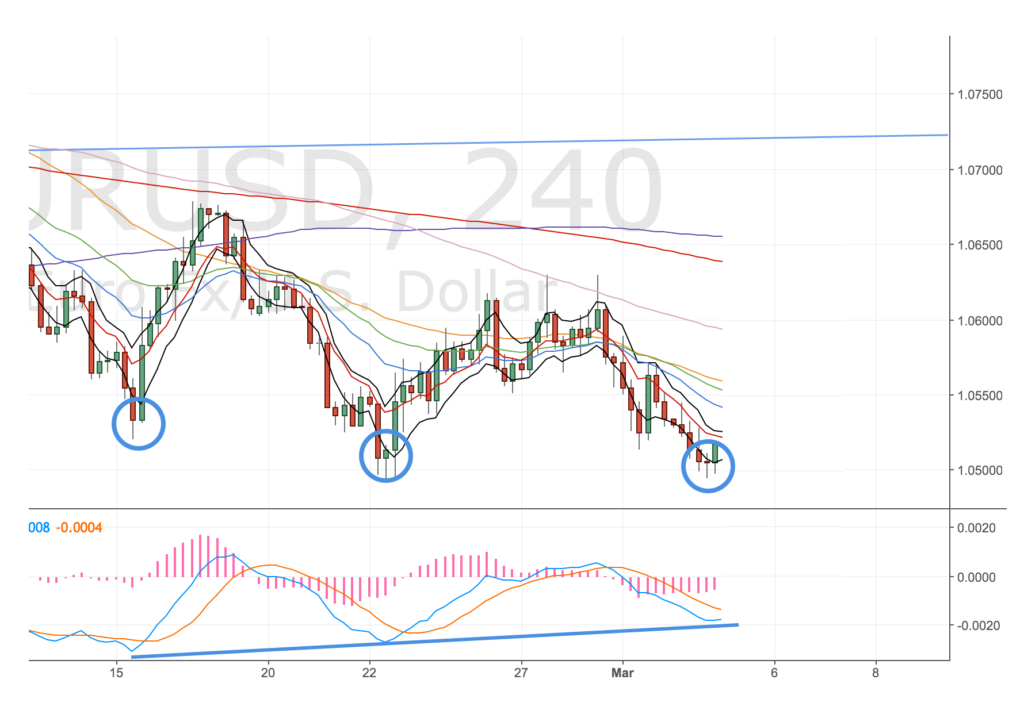
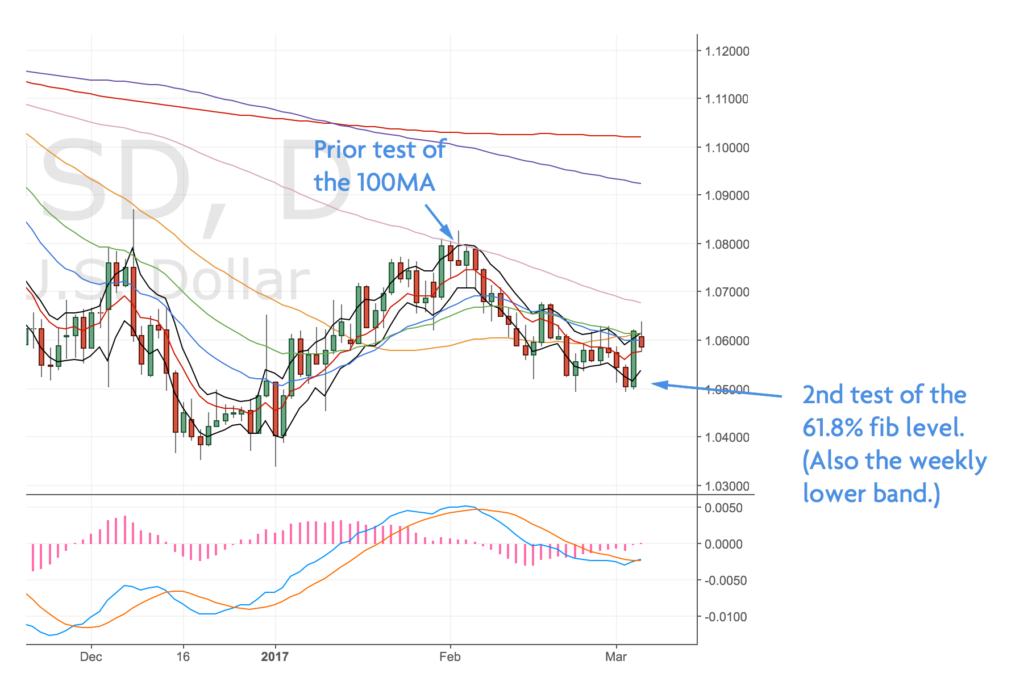
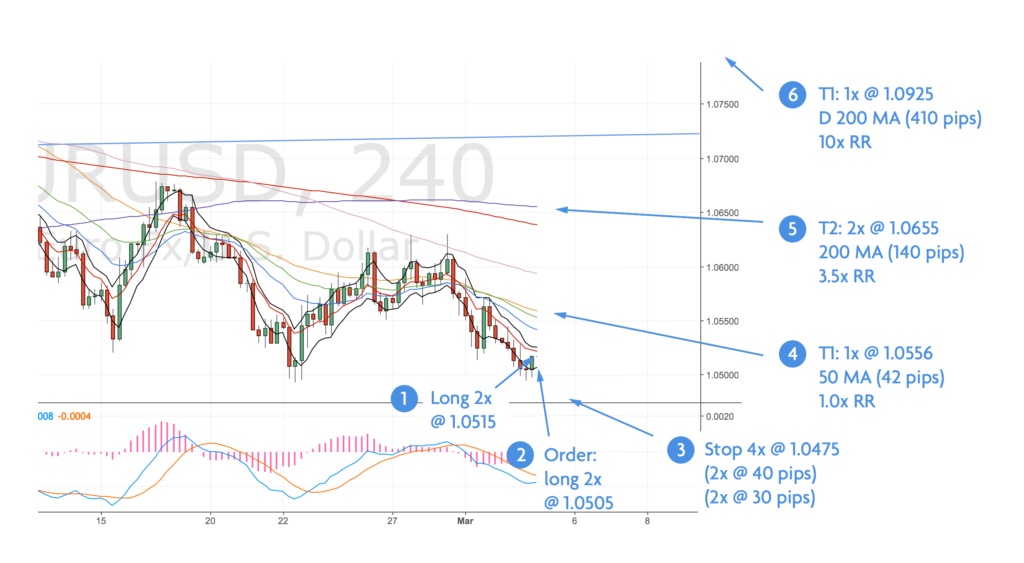
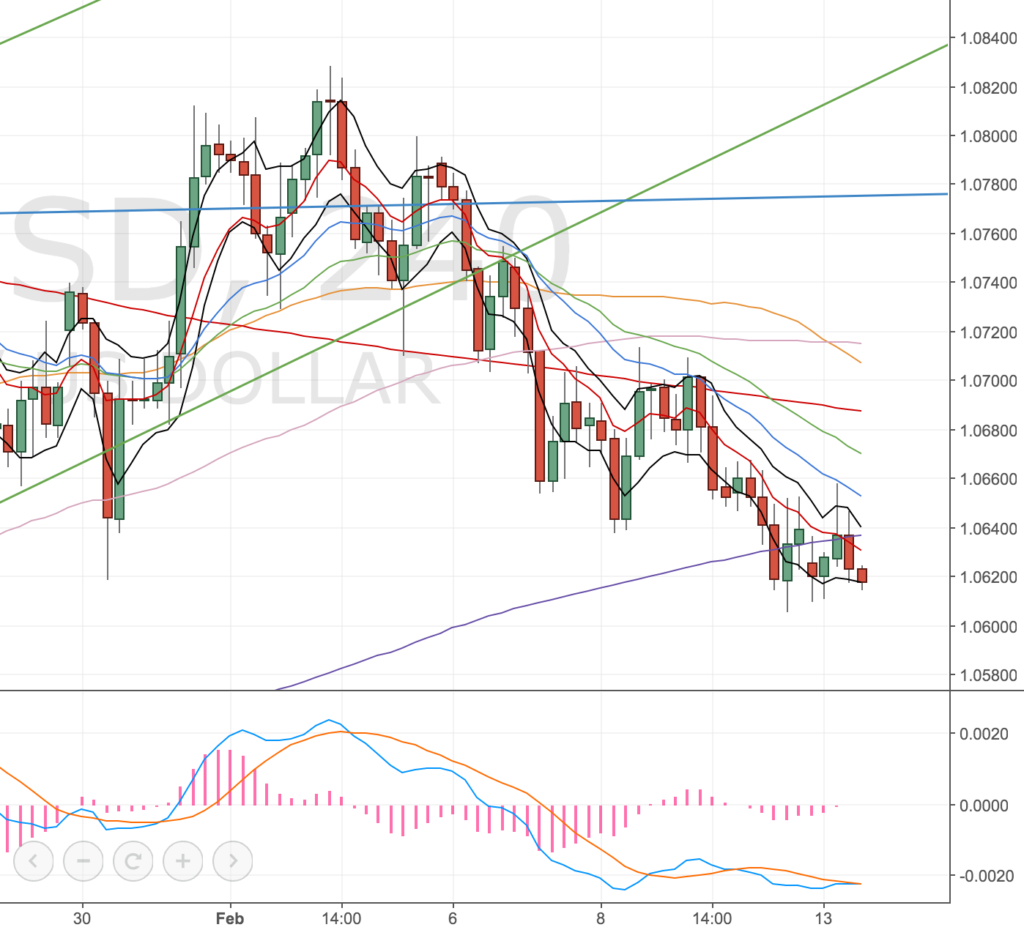
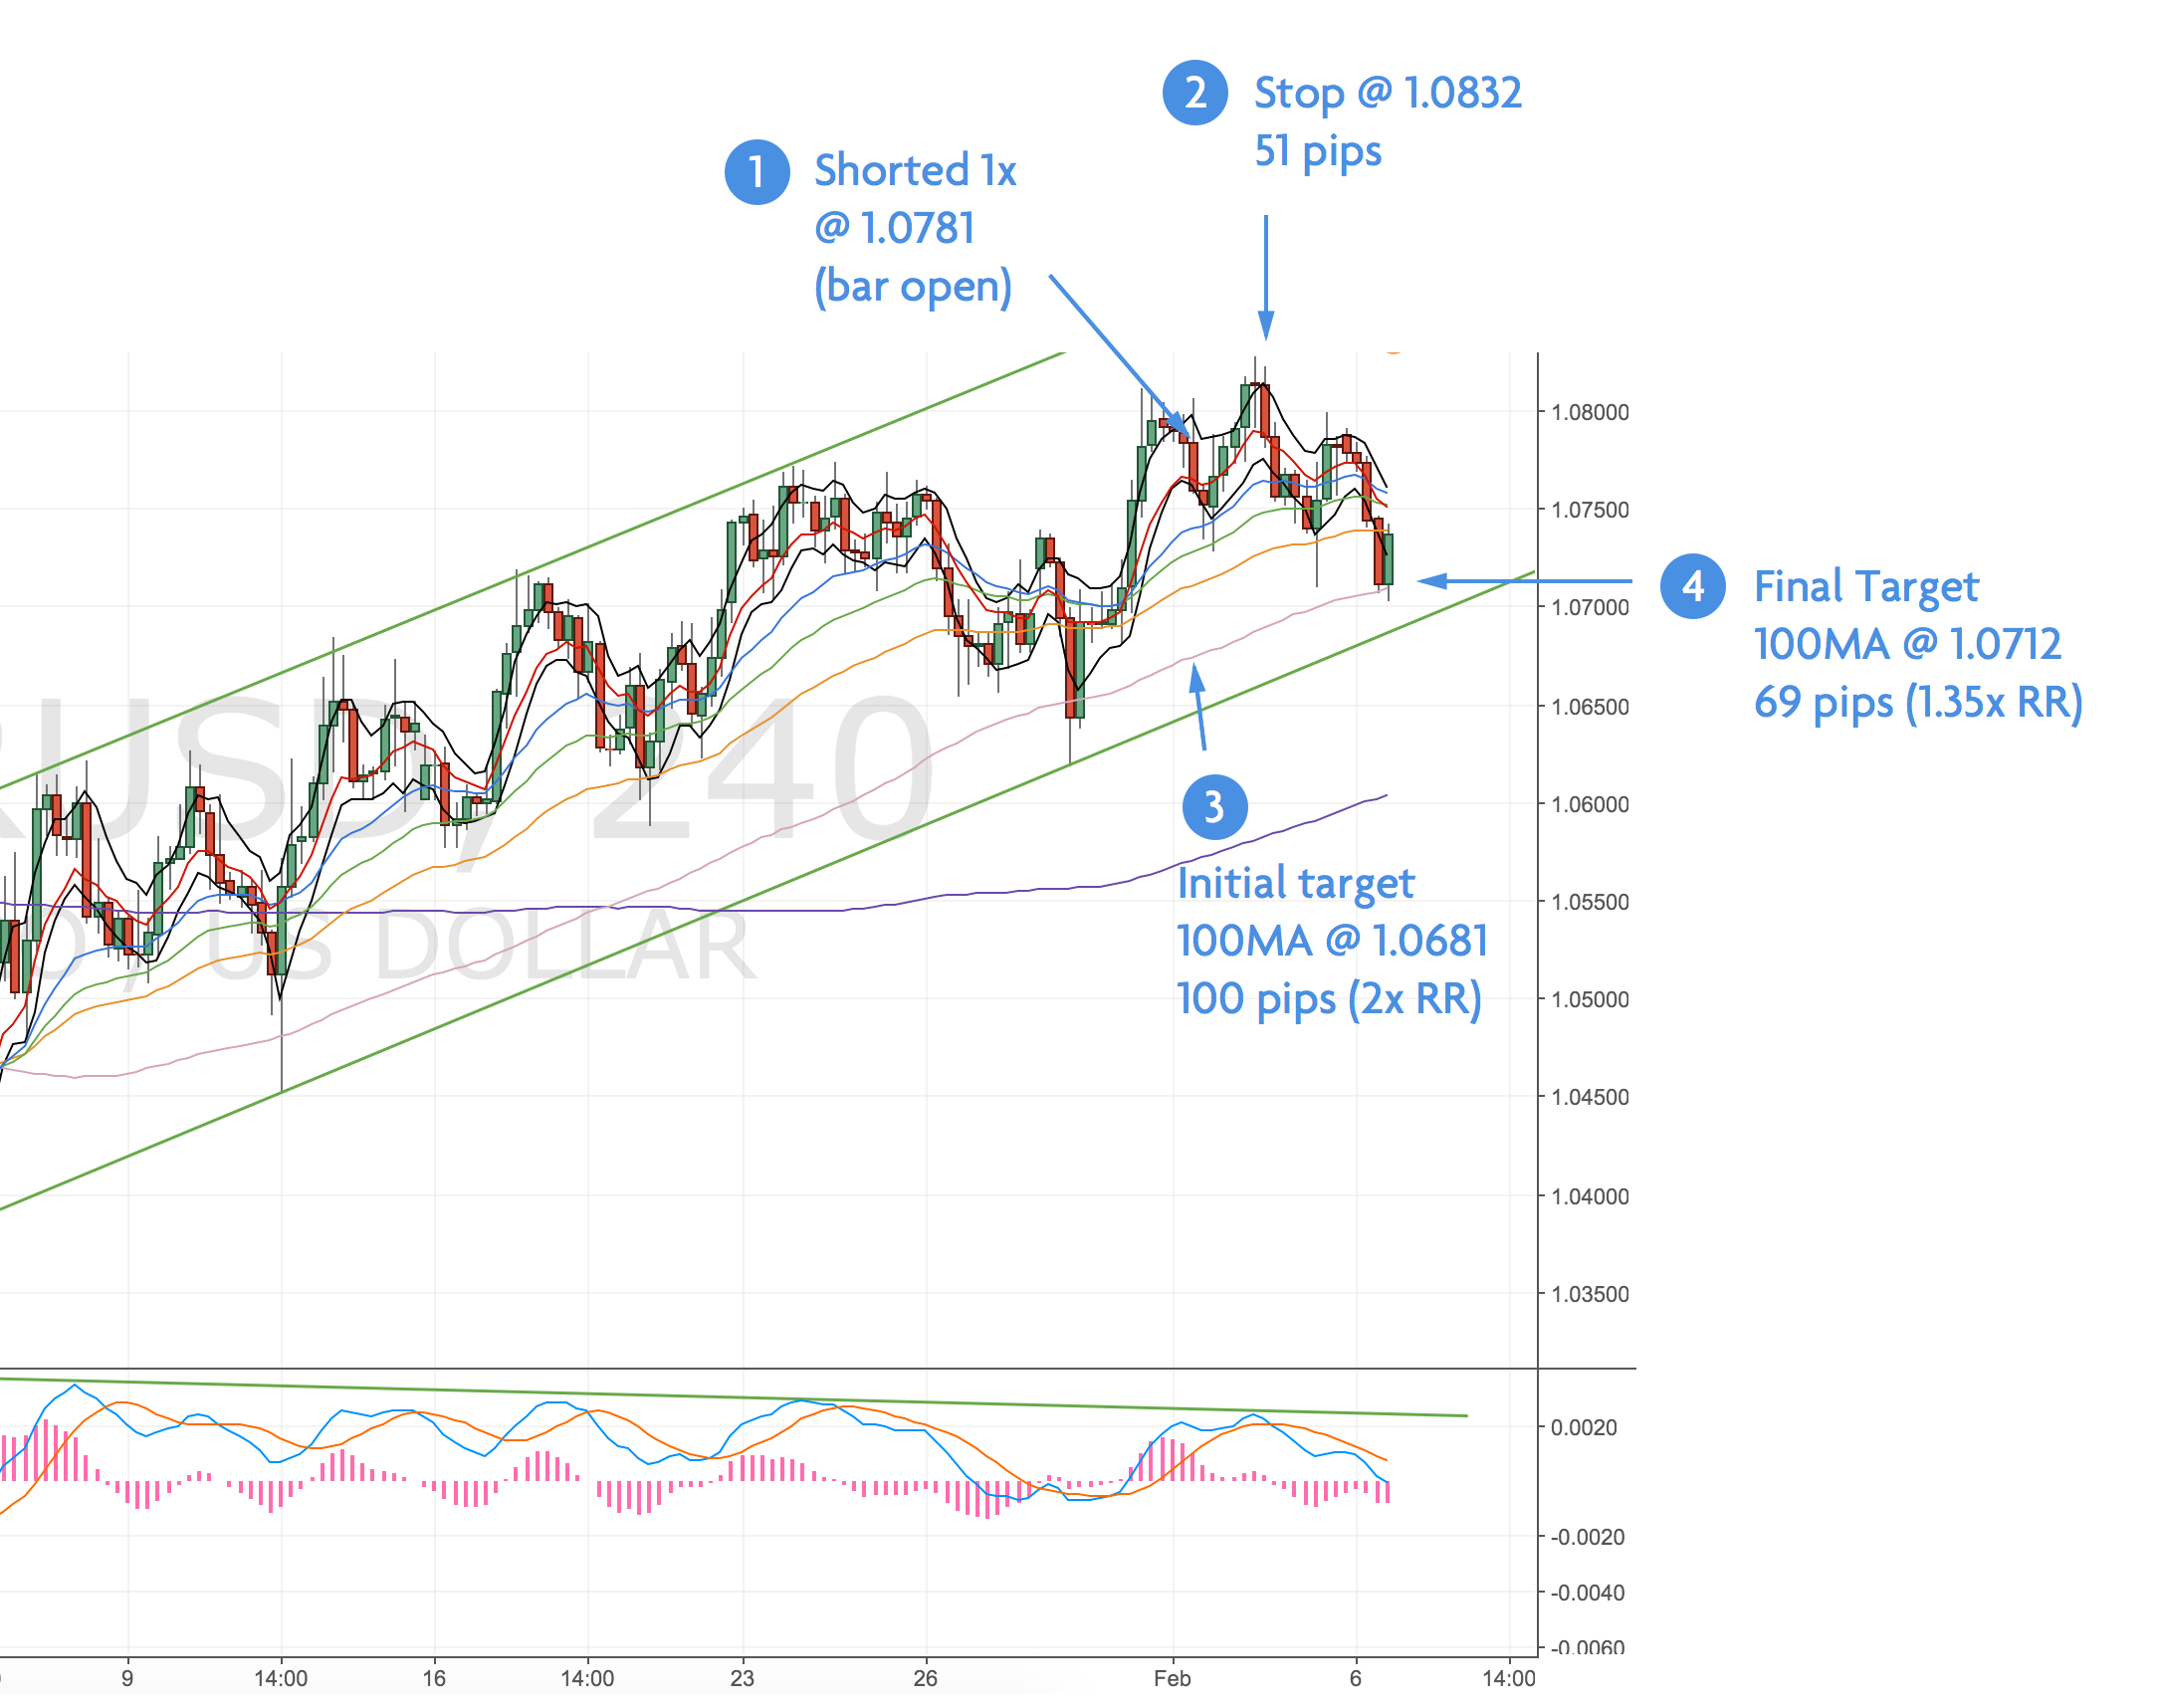
EURUSD Daily & 4H Charts
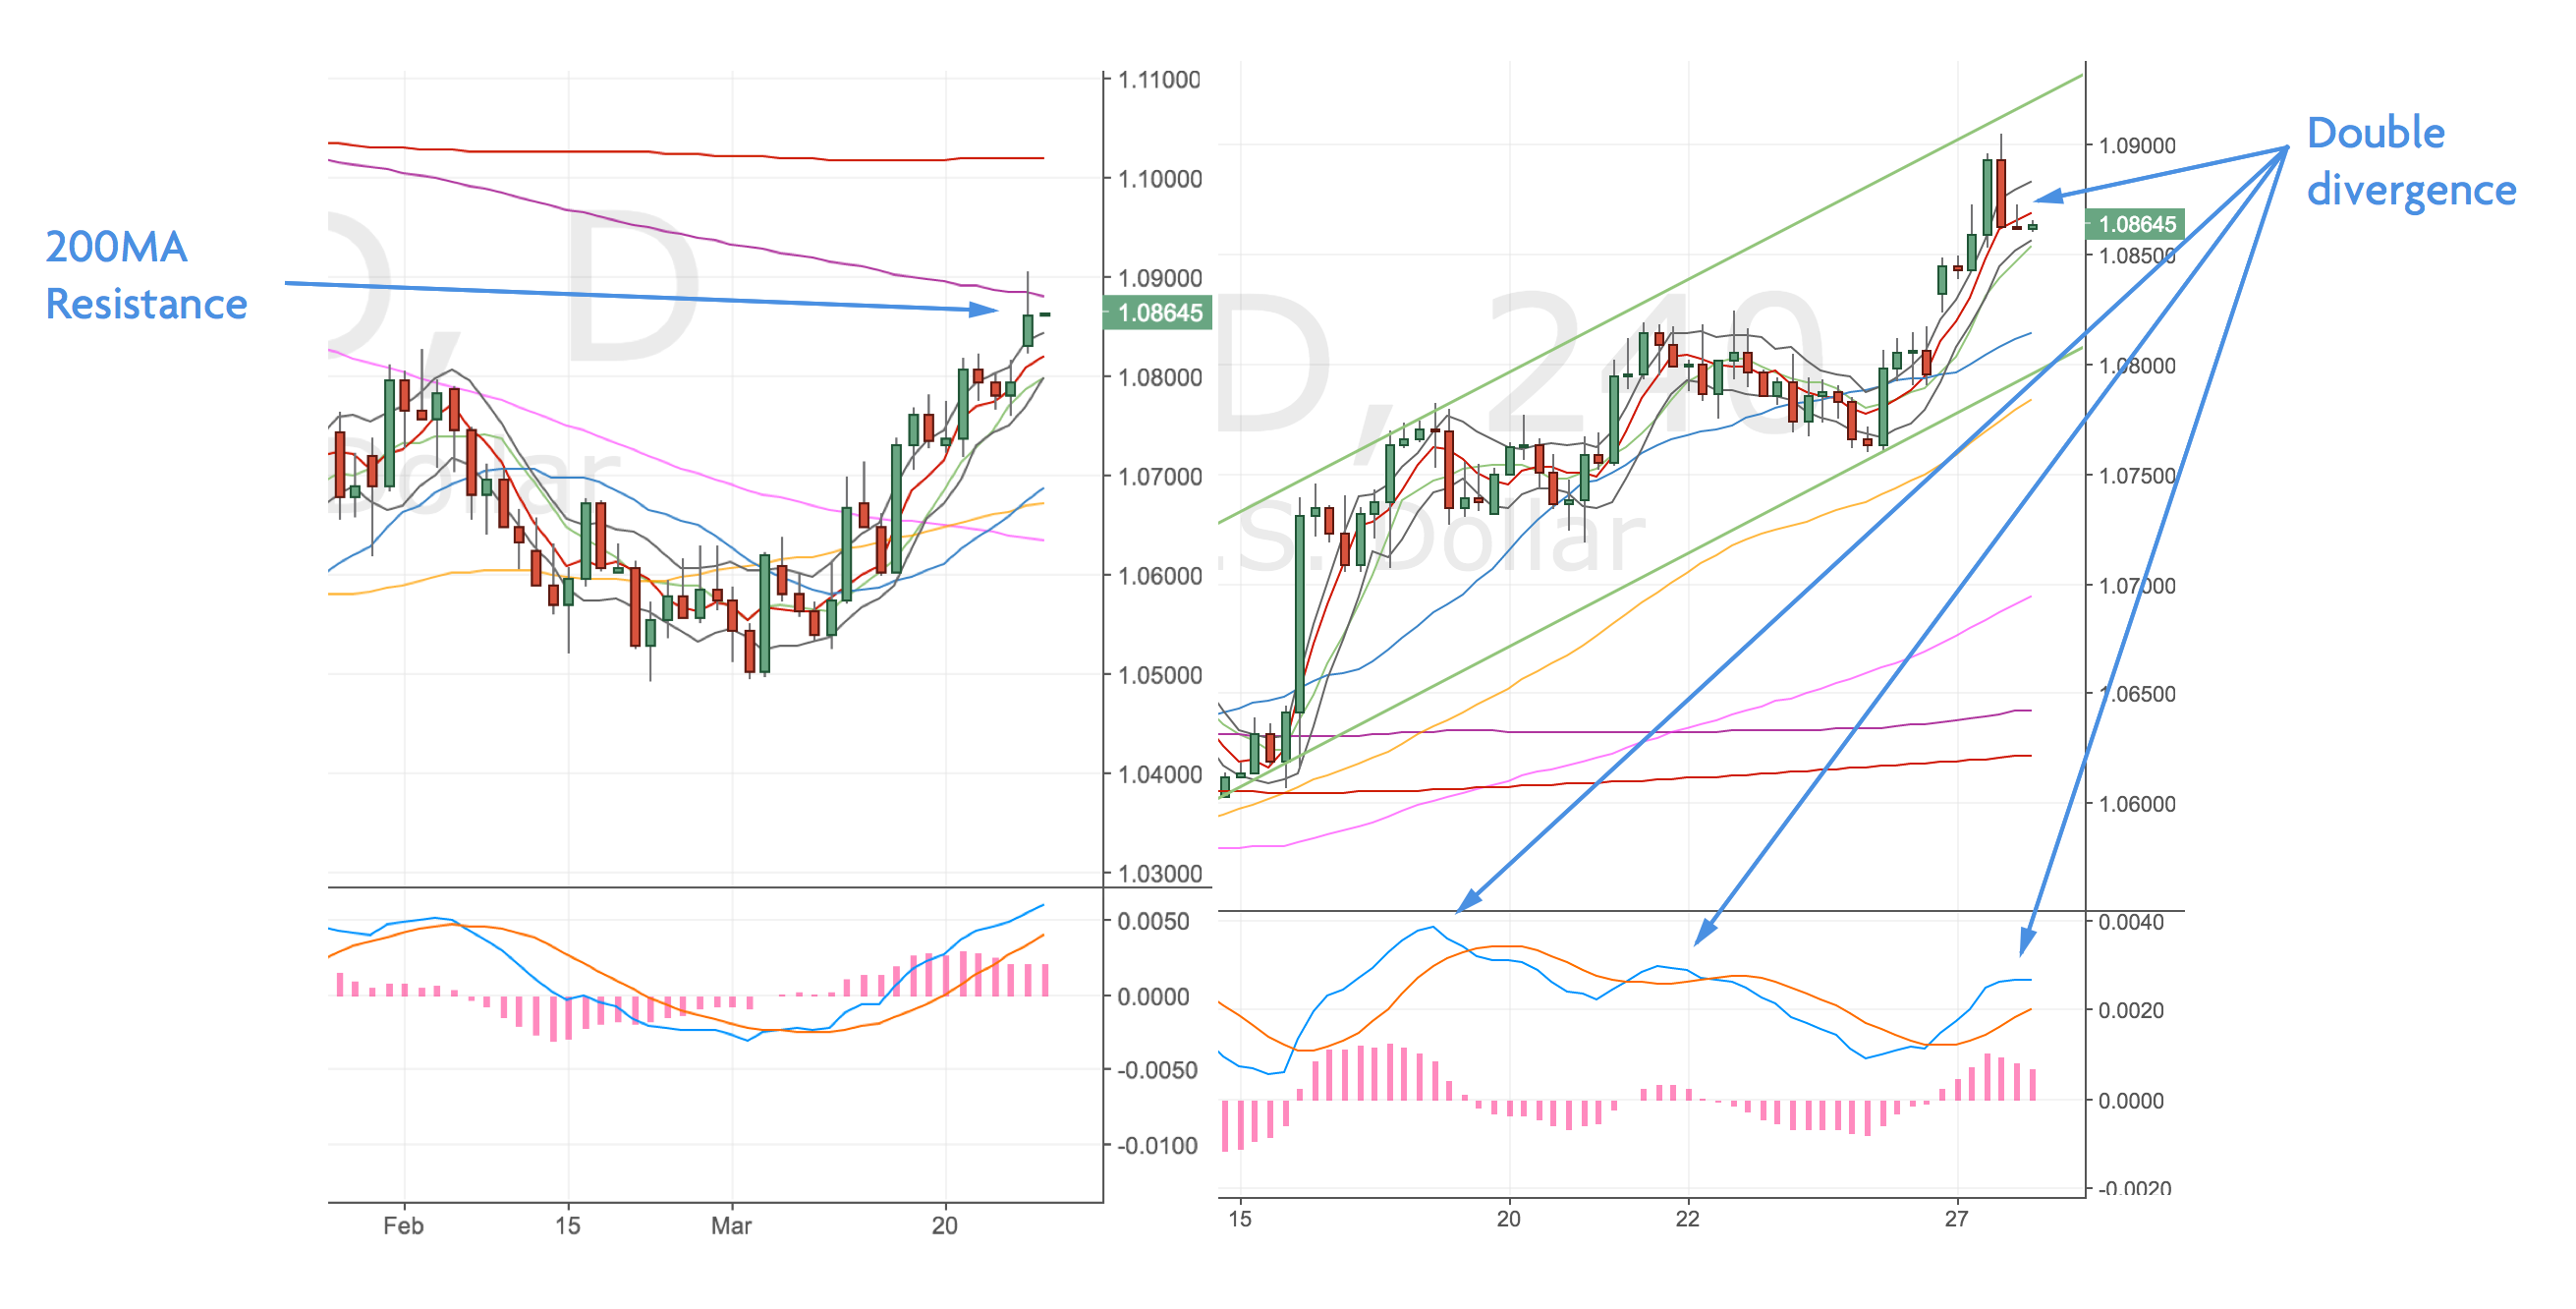
EURUSD Daily & 4H Chart – 27 Mar
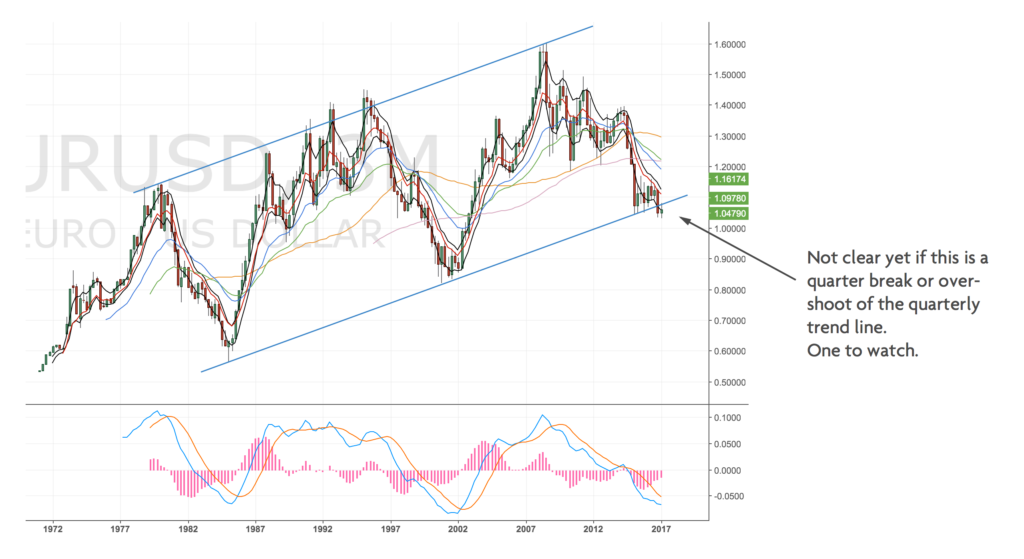
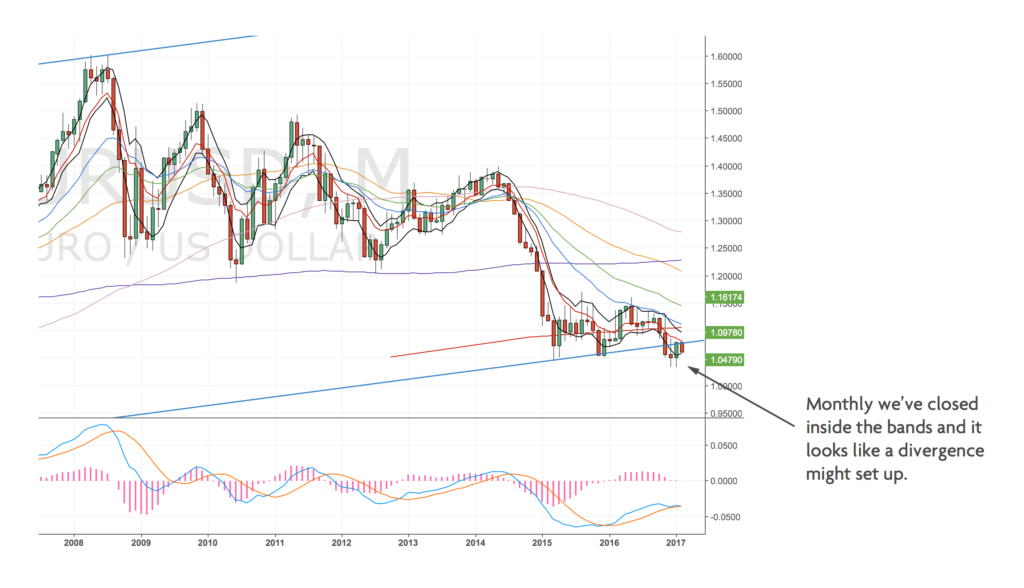
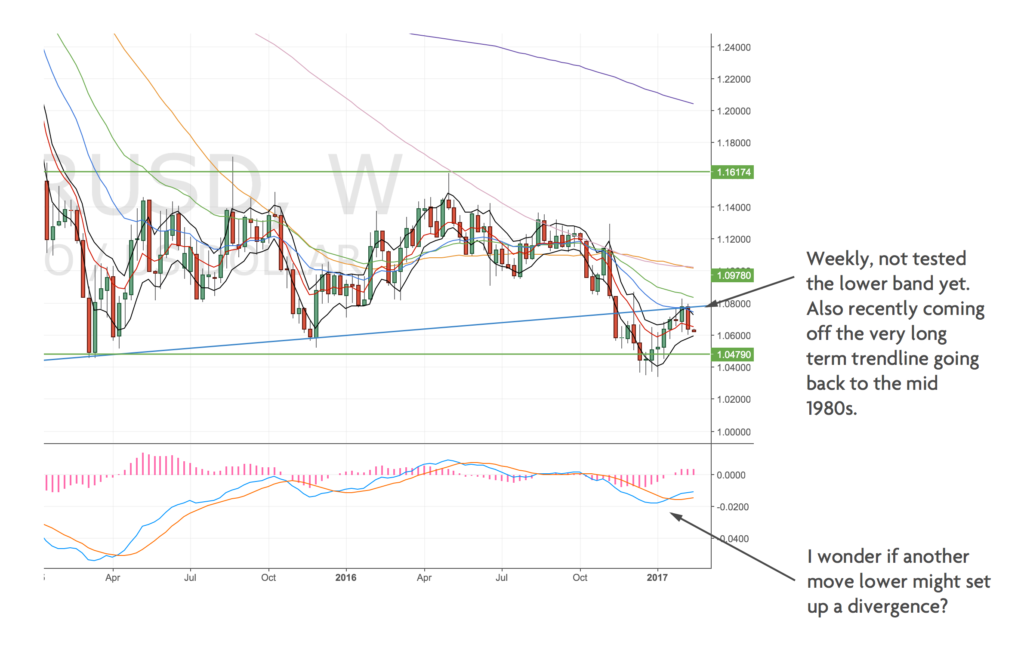
The weekly chart is very close to touching the 50MA, the monthly is close to the 20MA.
Trade set up
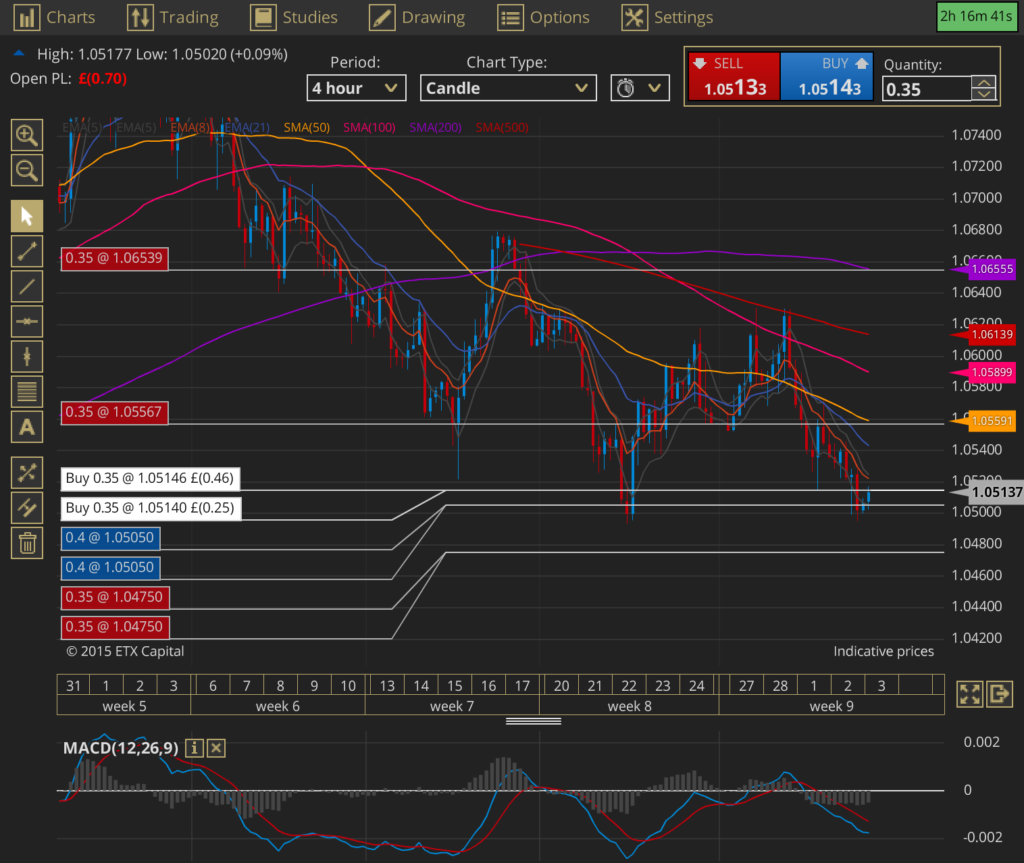
Across the two pairs, I’ve got a full position on both at a little over 1%. ~ 1/3 of the position is open now in each market, the remaining ~ 2/3s is to be opened by order at the upper bands (I chose the upper bands because the prior candlesticks were spiky and long bodied so the upper bands coincide with about 50% of the candlestick body).
I’m not totally comfortable with these trades, but I need to trade the system – not my opinion. The proximity of the MAs on the higher timeframe does worry me. I need to be more like Chirrut from Star Wars. He has absolute faith in the force and I need to have faith in my system’s probability. 🙂

If Chirrut was a trade he’d probably say…
I’m trading the system and the system is with me, I am trading the system and the system is with me, I am trading the system and the system is with me …

Trust in the system. I am trading the system and the system is with me
Hahaha, I’m such a dumb ass.
XAUUSD order triggered, now in the full trade – 28 Mar
My additional gold order has triggered at 1258. So 2/3rds of my dollar position is open now. The remaining 1/3, order to short the EURUSD, doesn’t look like it’ll get hit.
Cancelled the remaining EURUSD Order – 29 Mar
Mini update, price has now hit the 4h50 so I’ve cancelled the remaining EURUSD order to get short. As some of the move has now played out, there’s no need to add to the position if price comes higher.
As we’ve got a double divergence in play, I’ve kept the more ambitious 4h100 target and ditched the 4h50 target.
Closed some positions – 30 Mar
Some good news, but bad trading, today. Both of these positions have been doing OK; however, I’ve been undecided about my targets and not been moving my limit orders inline with my MAs regularly.
Being honest, it’s been a combination of being forgetful and dog tired. I managed to catch another cold off the boy and he’s not been sleeping well so I’ve not been on my A game. This time though, I’ve been lucky to be watching when price has hit my targets, so I’ll accept the spoils and consider this a lesson learnt.

Taking some profits
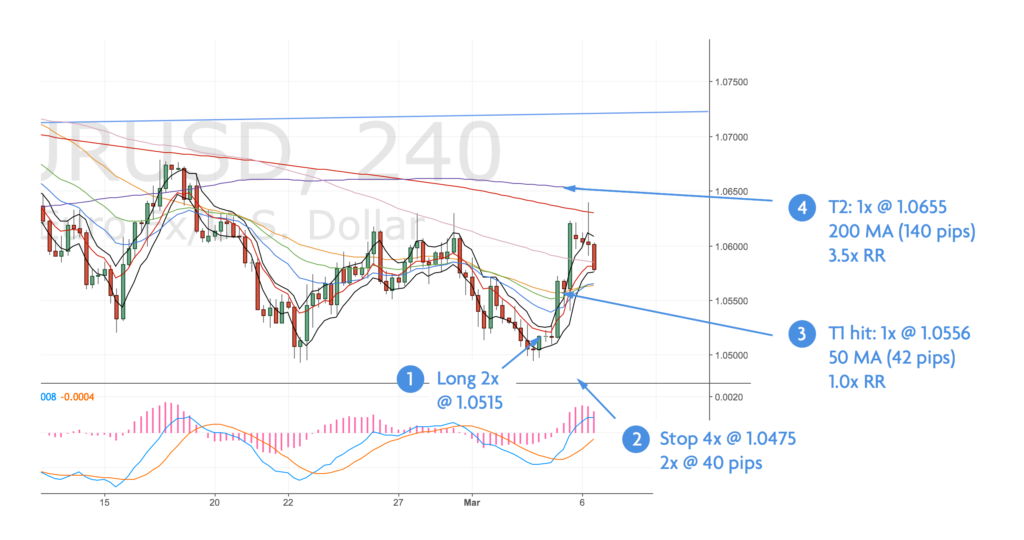
My EURUSD trade is now closed – we touched the 4h100 around early lunchtime. My Gold trade is partially closed, I took half profits following the USD GDP figures move down to the 4h50. Not a big win on either, but not terrible.
The remainder of my Gold trade is being held for the 4h200 now. I originally planned to close the whole position at the 4h50 but price action has been slow and the 4h50 has moved up and up. So, I’ve held half of the position open, because I would’ve been dissatisfied with a move lower that I wasn’t in.
Here’s the latest charts.
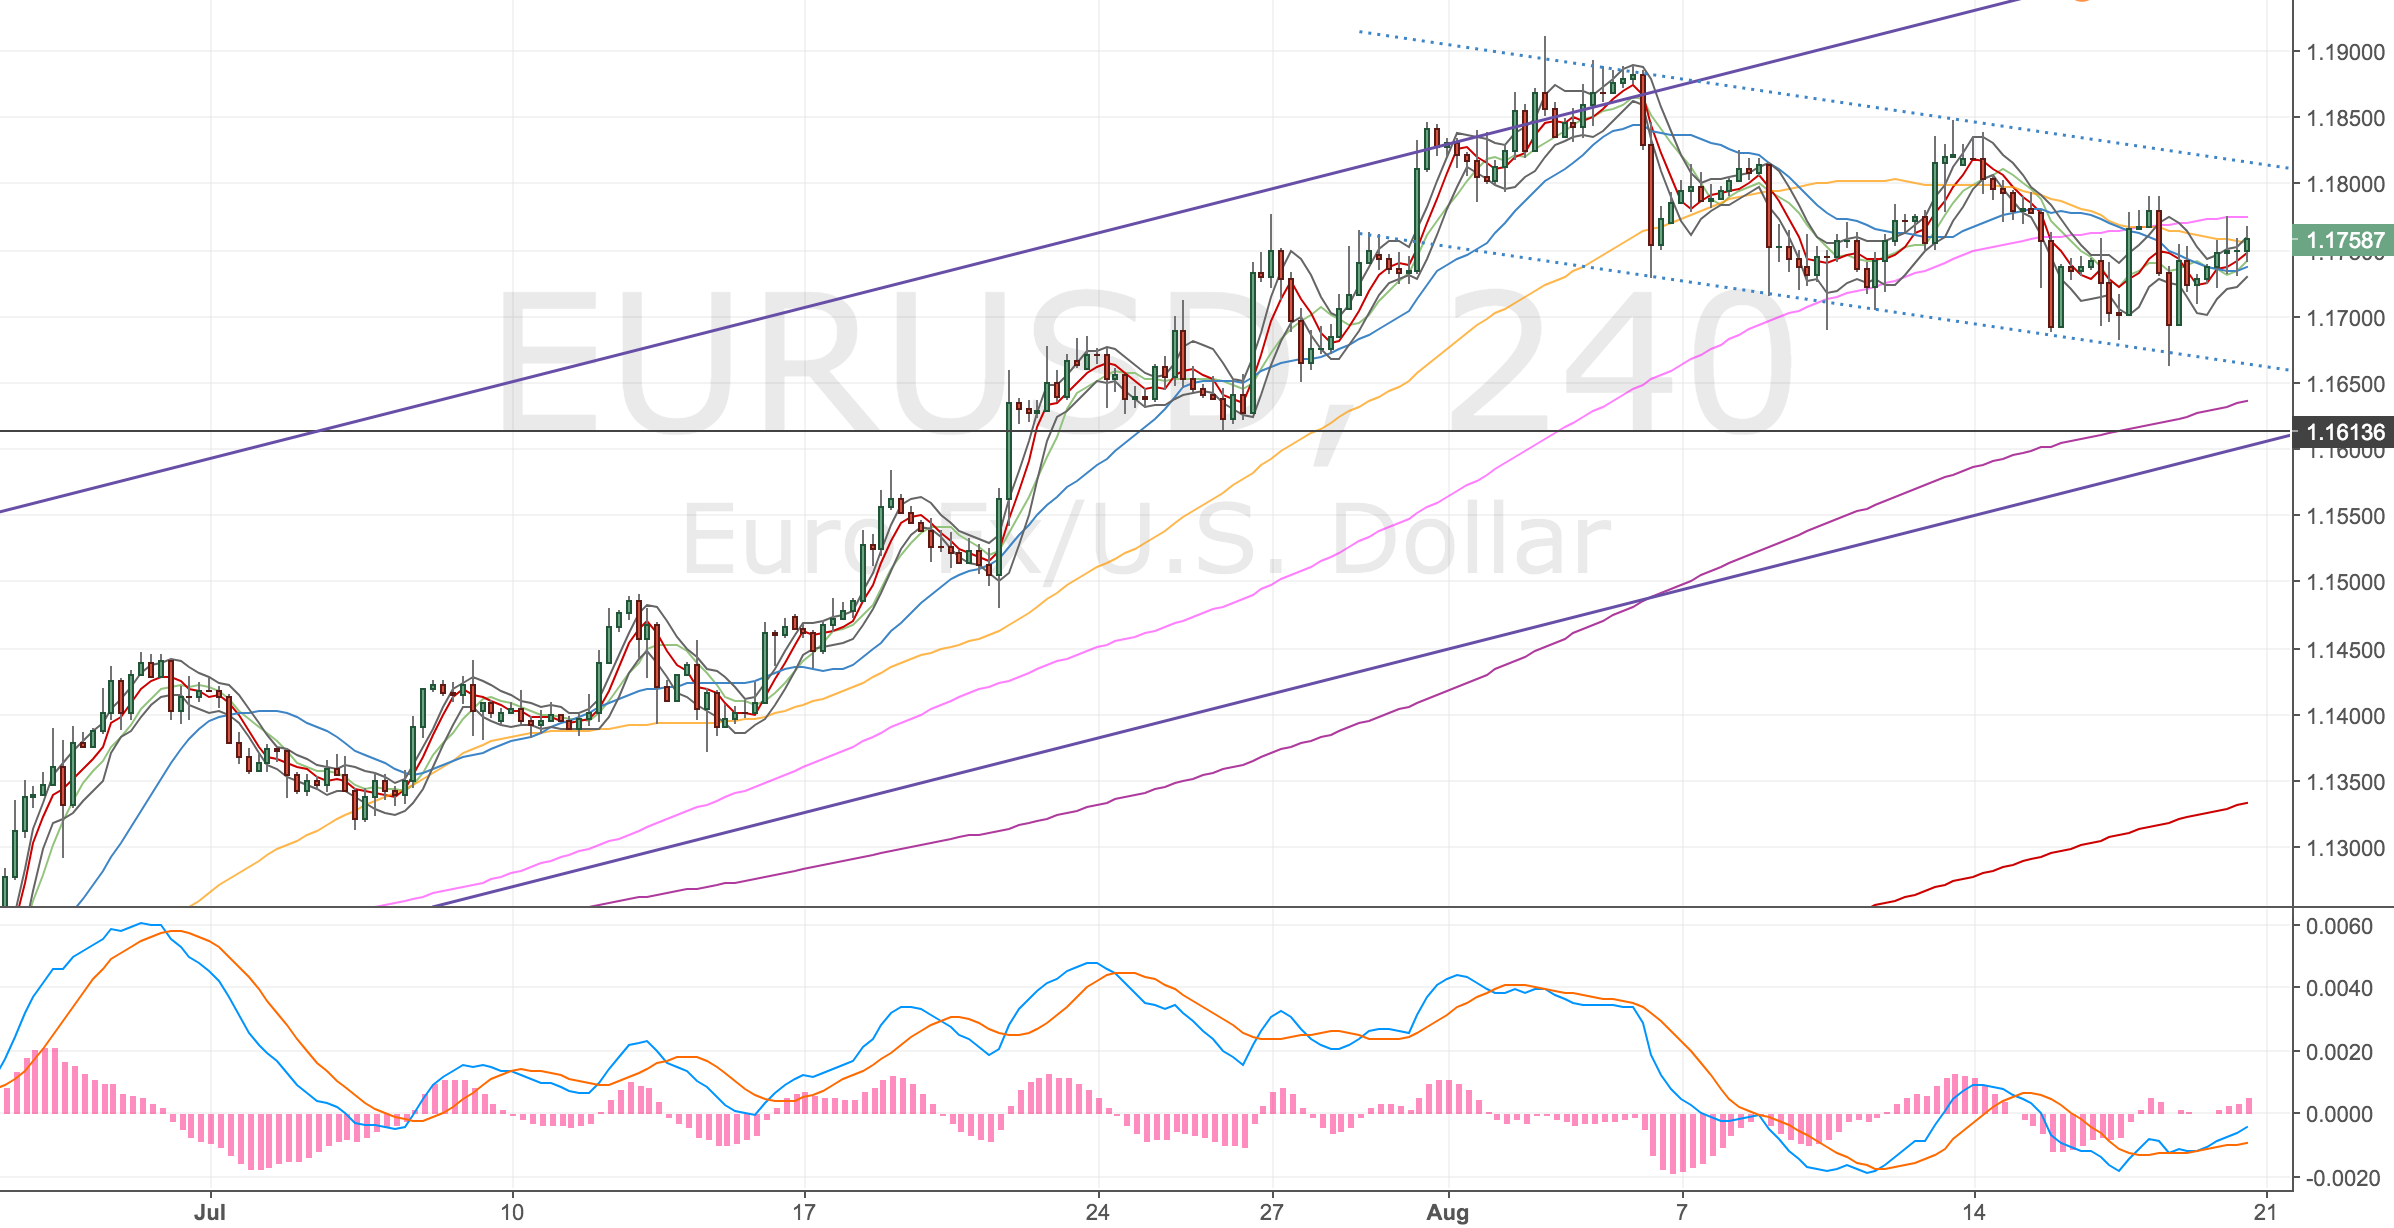
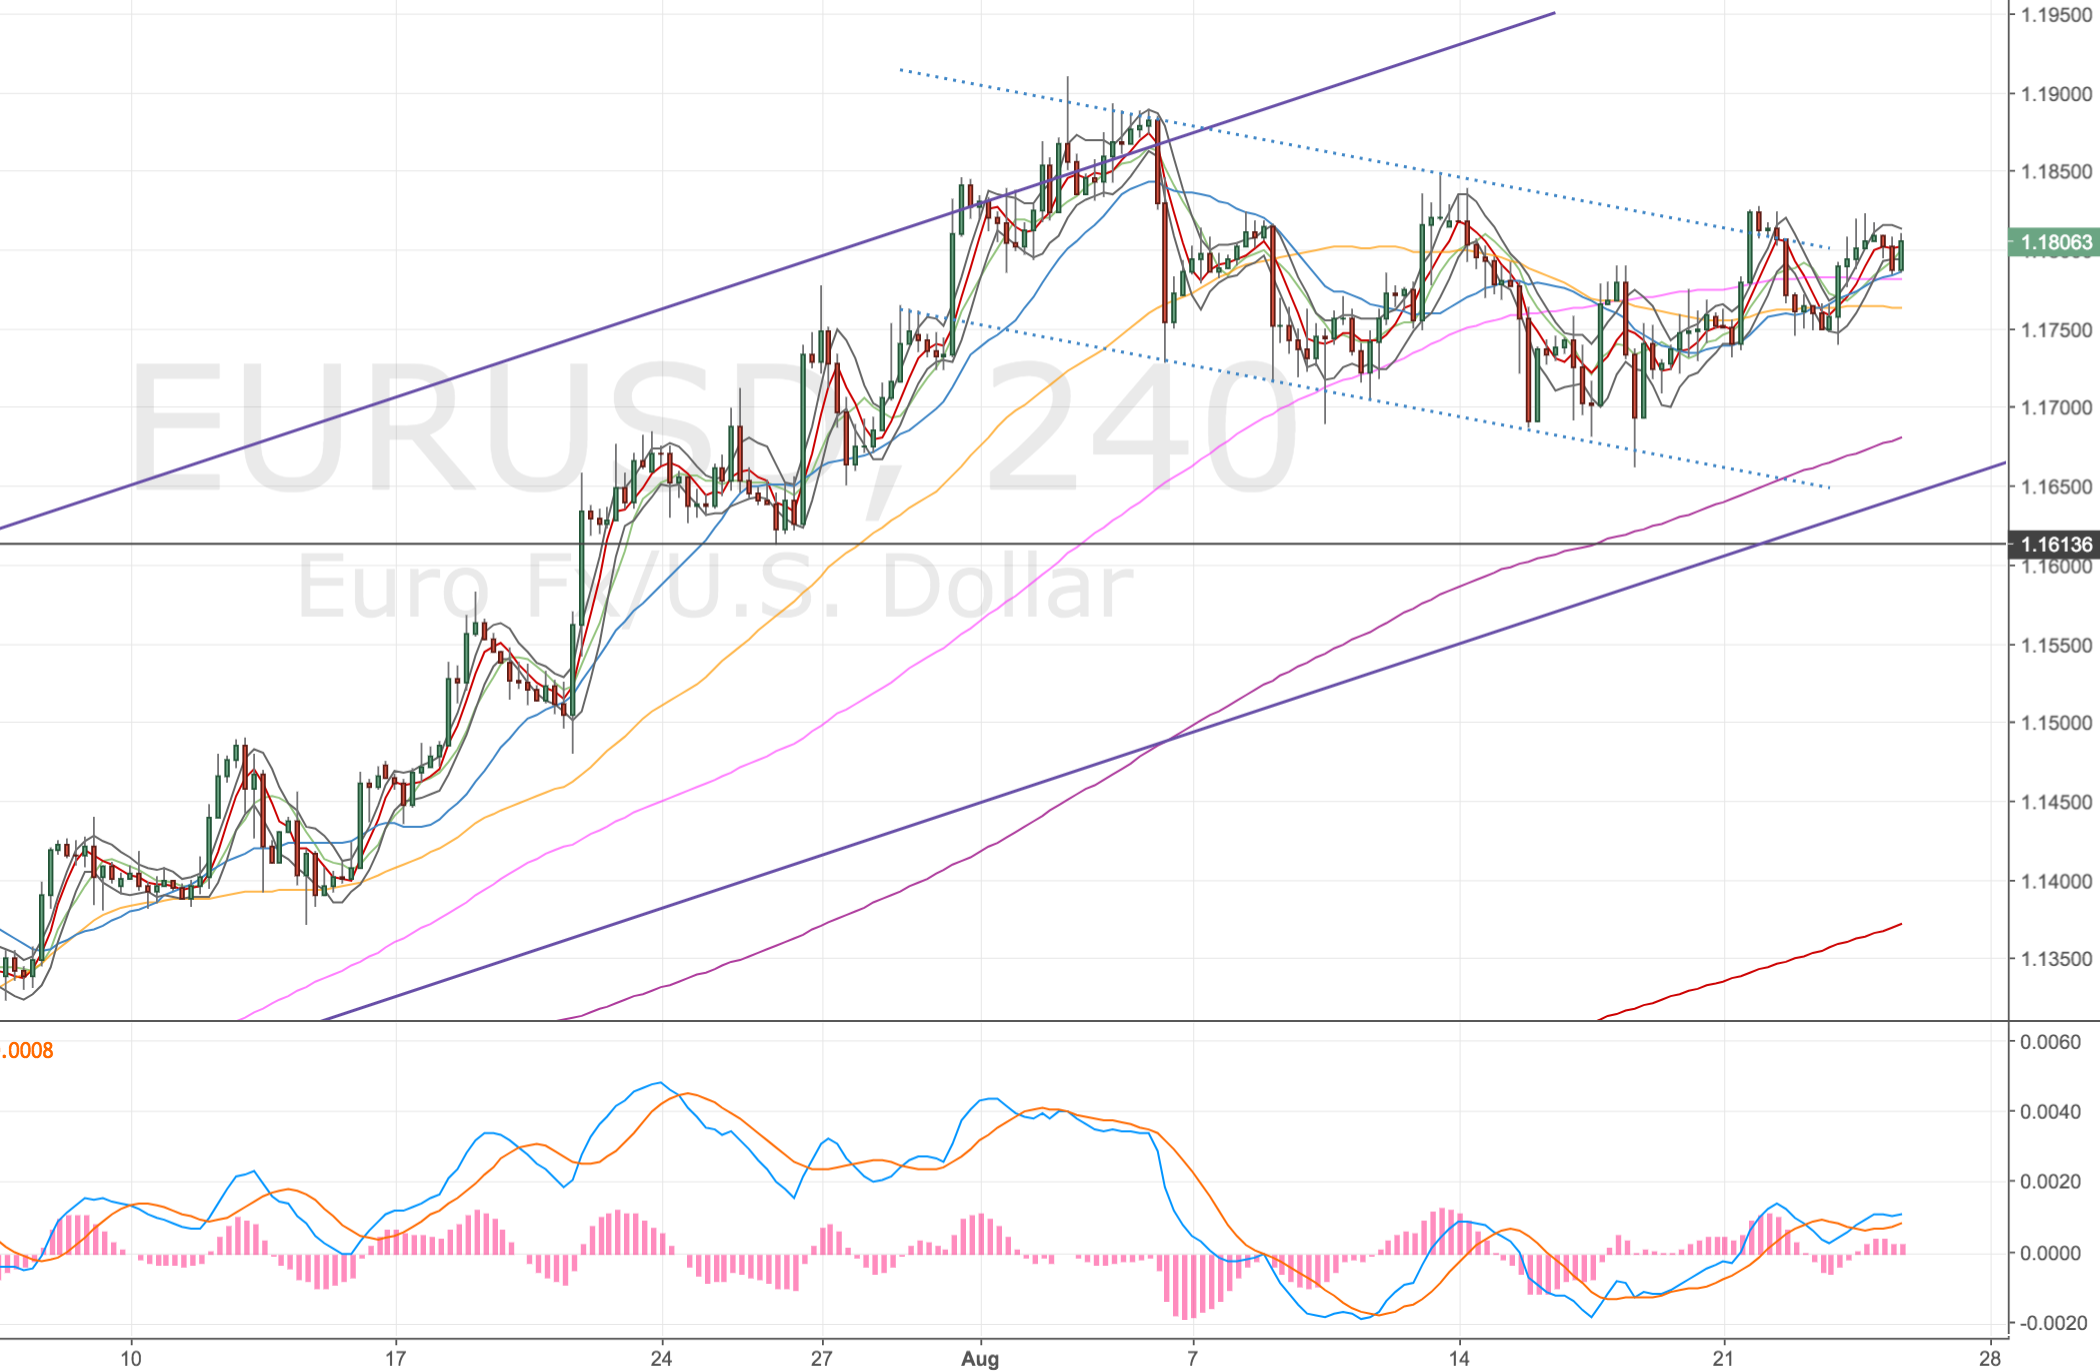
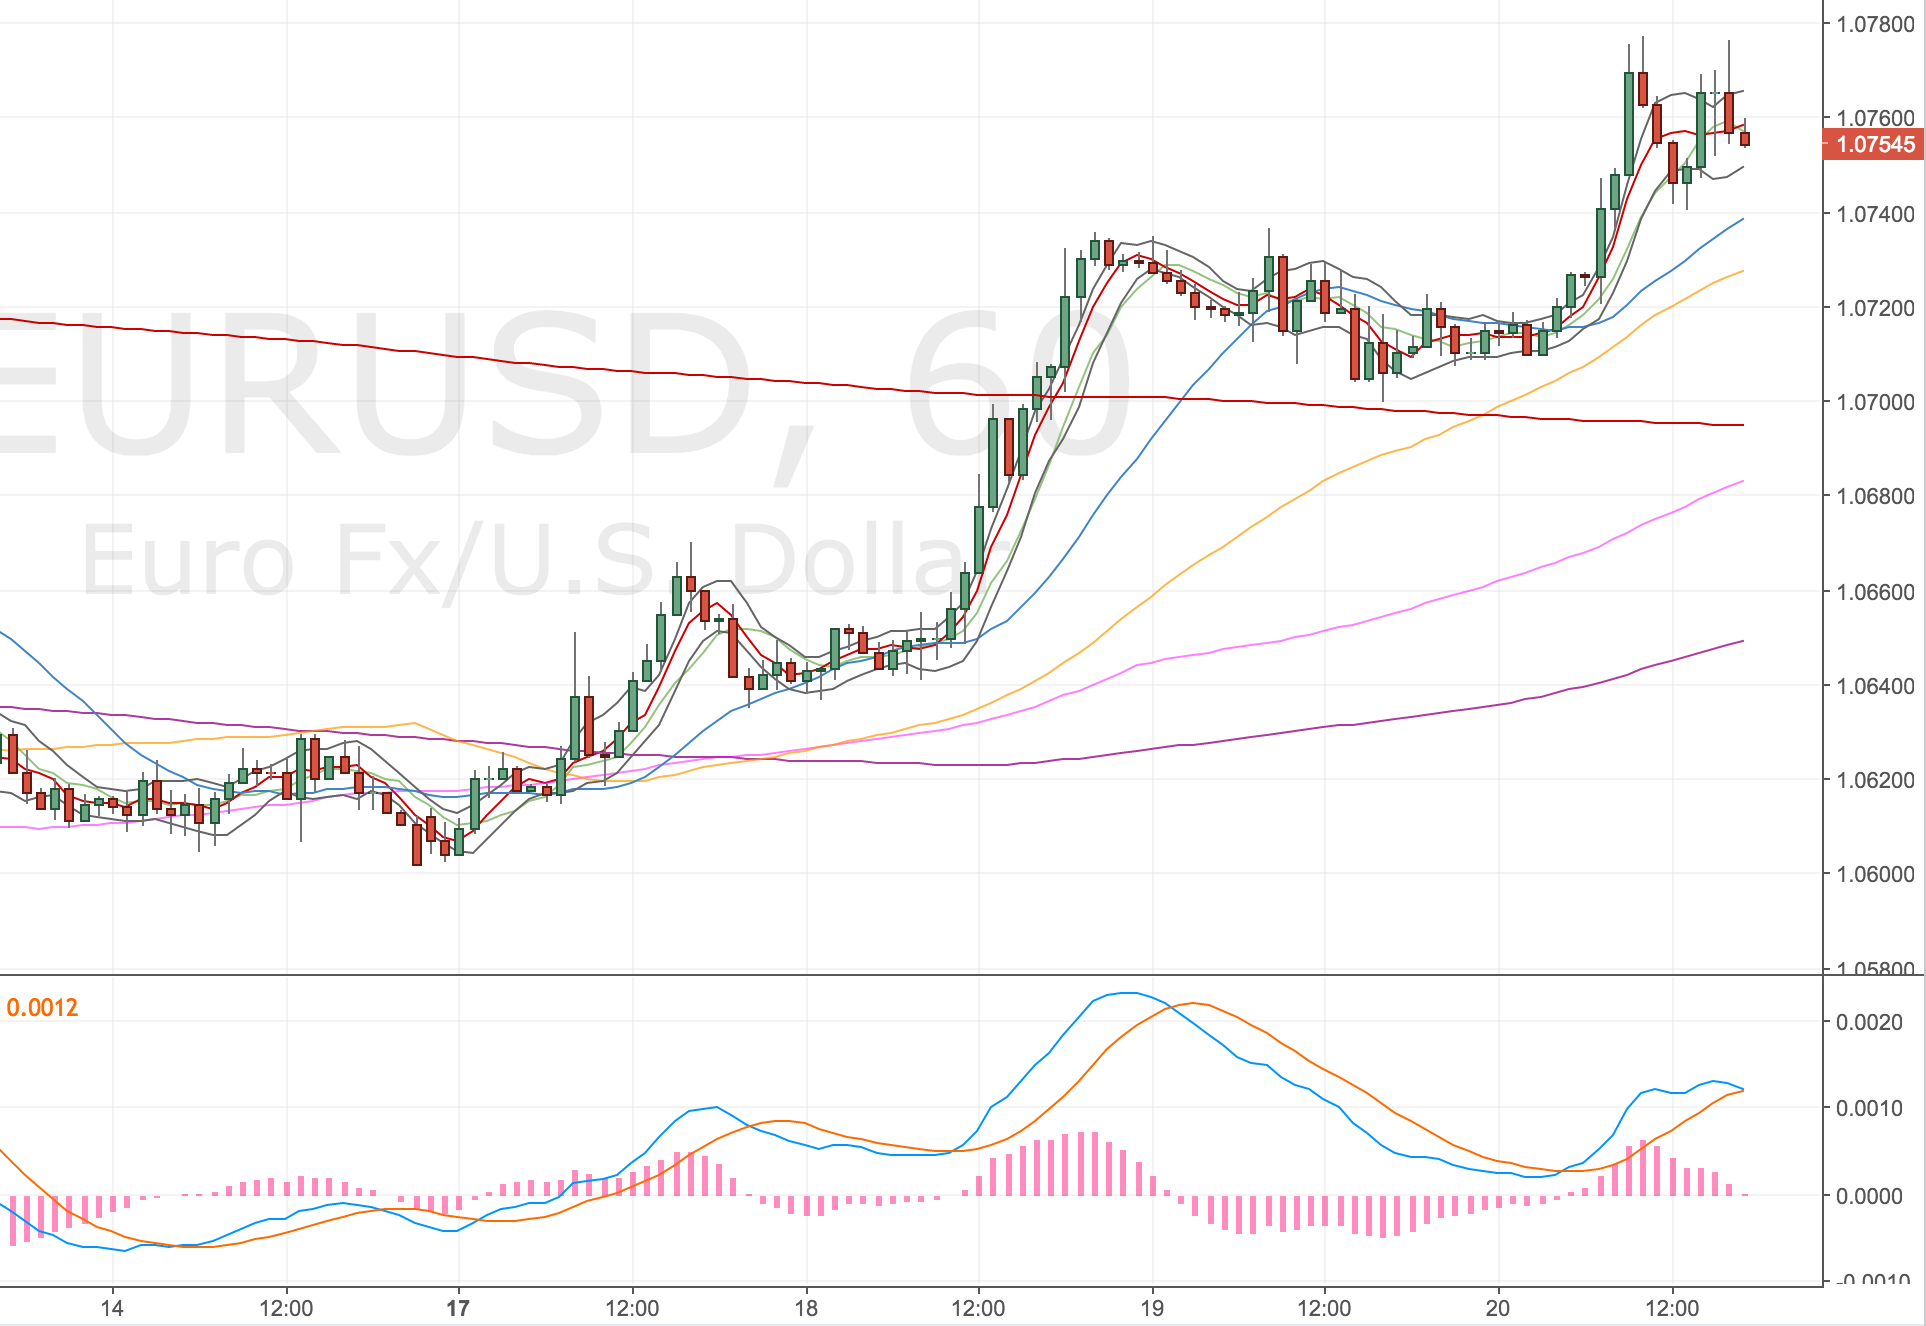
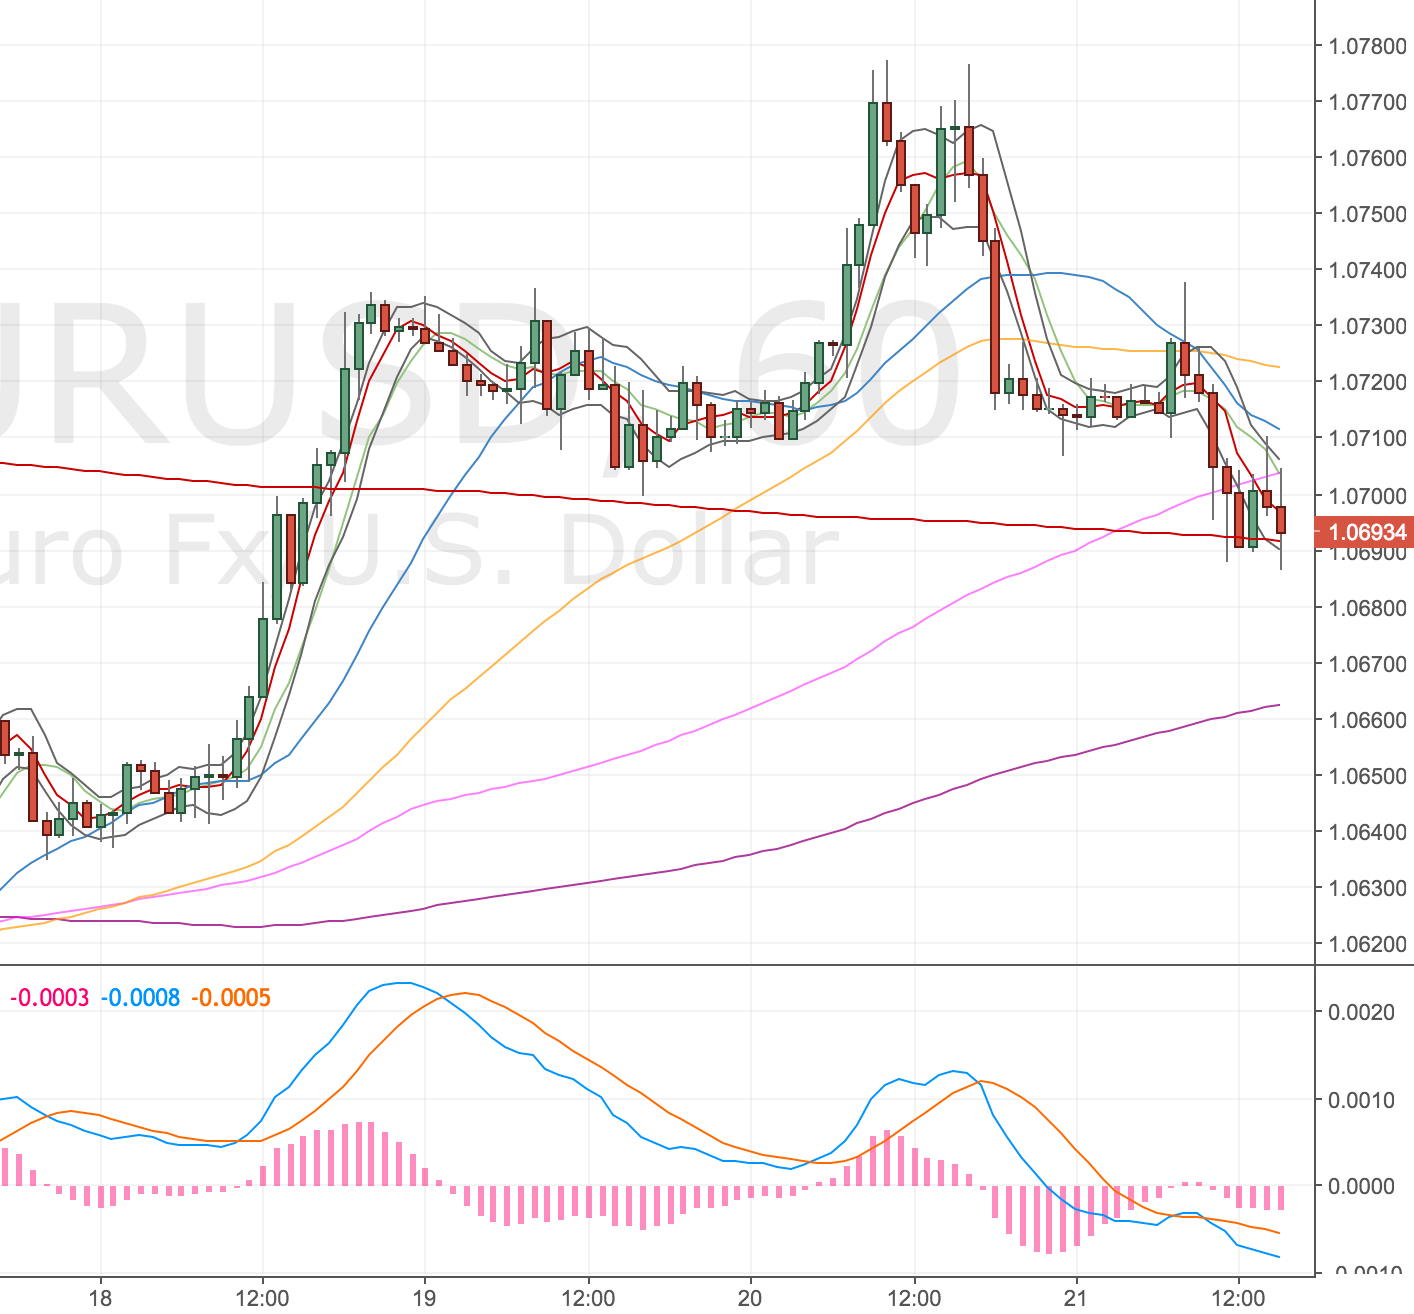
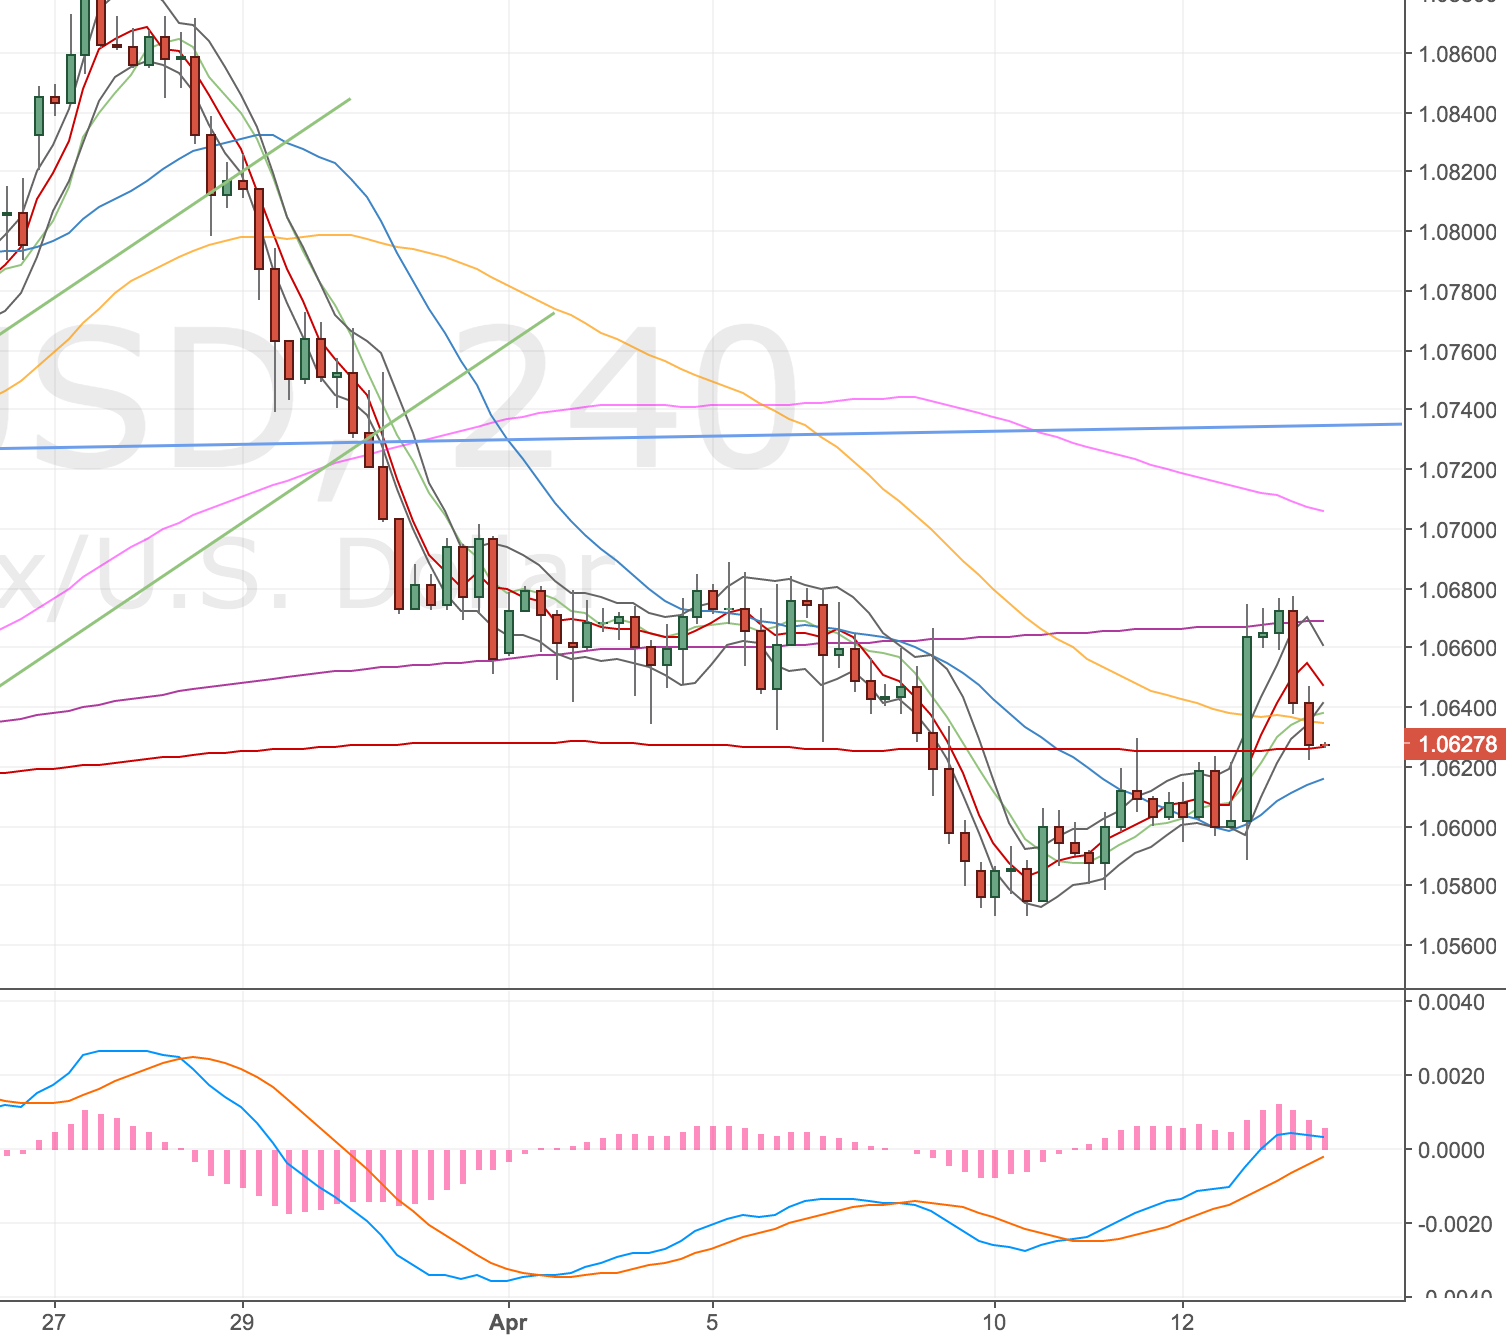
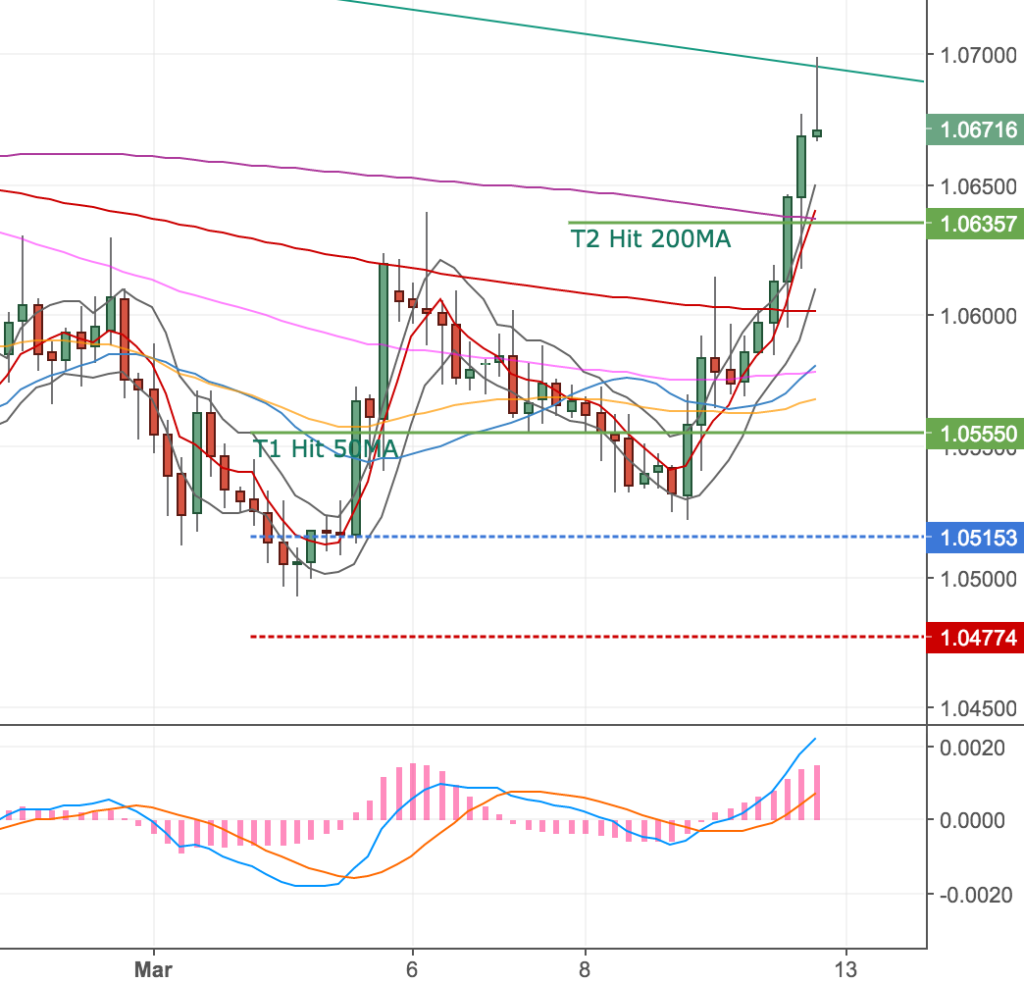
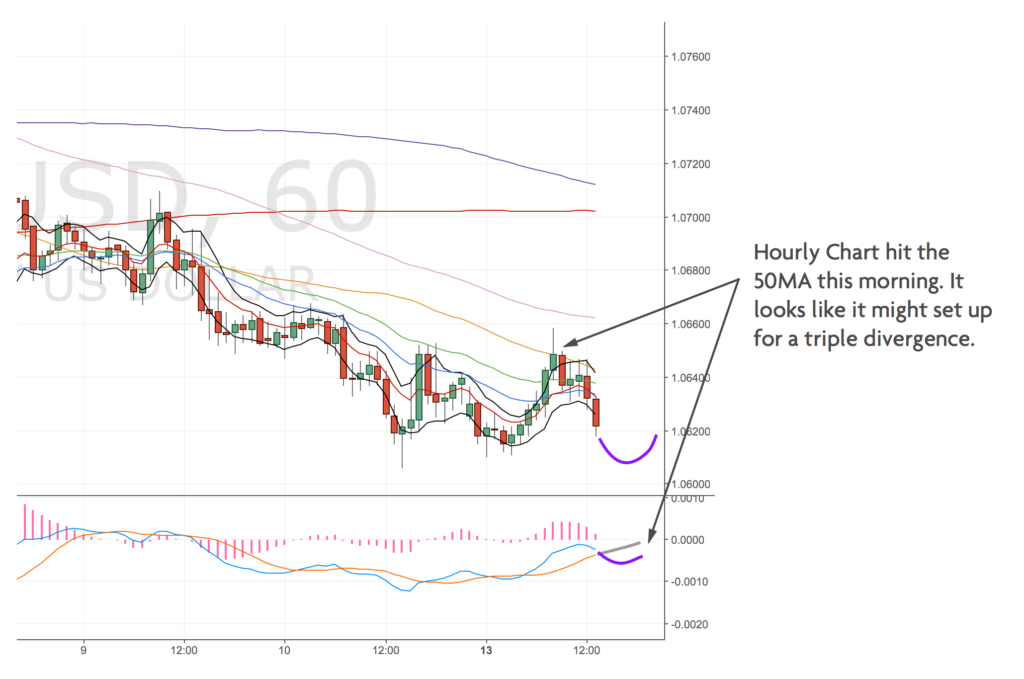
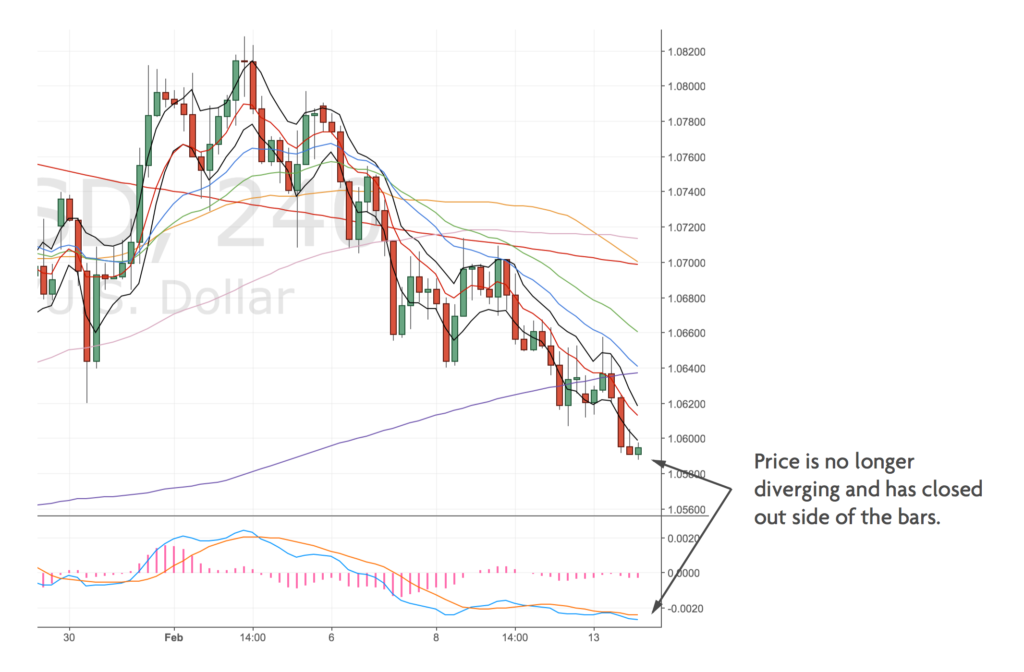
EURUSD 4H Chart
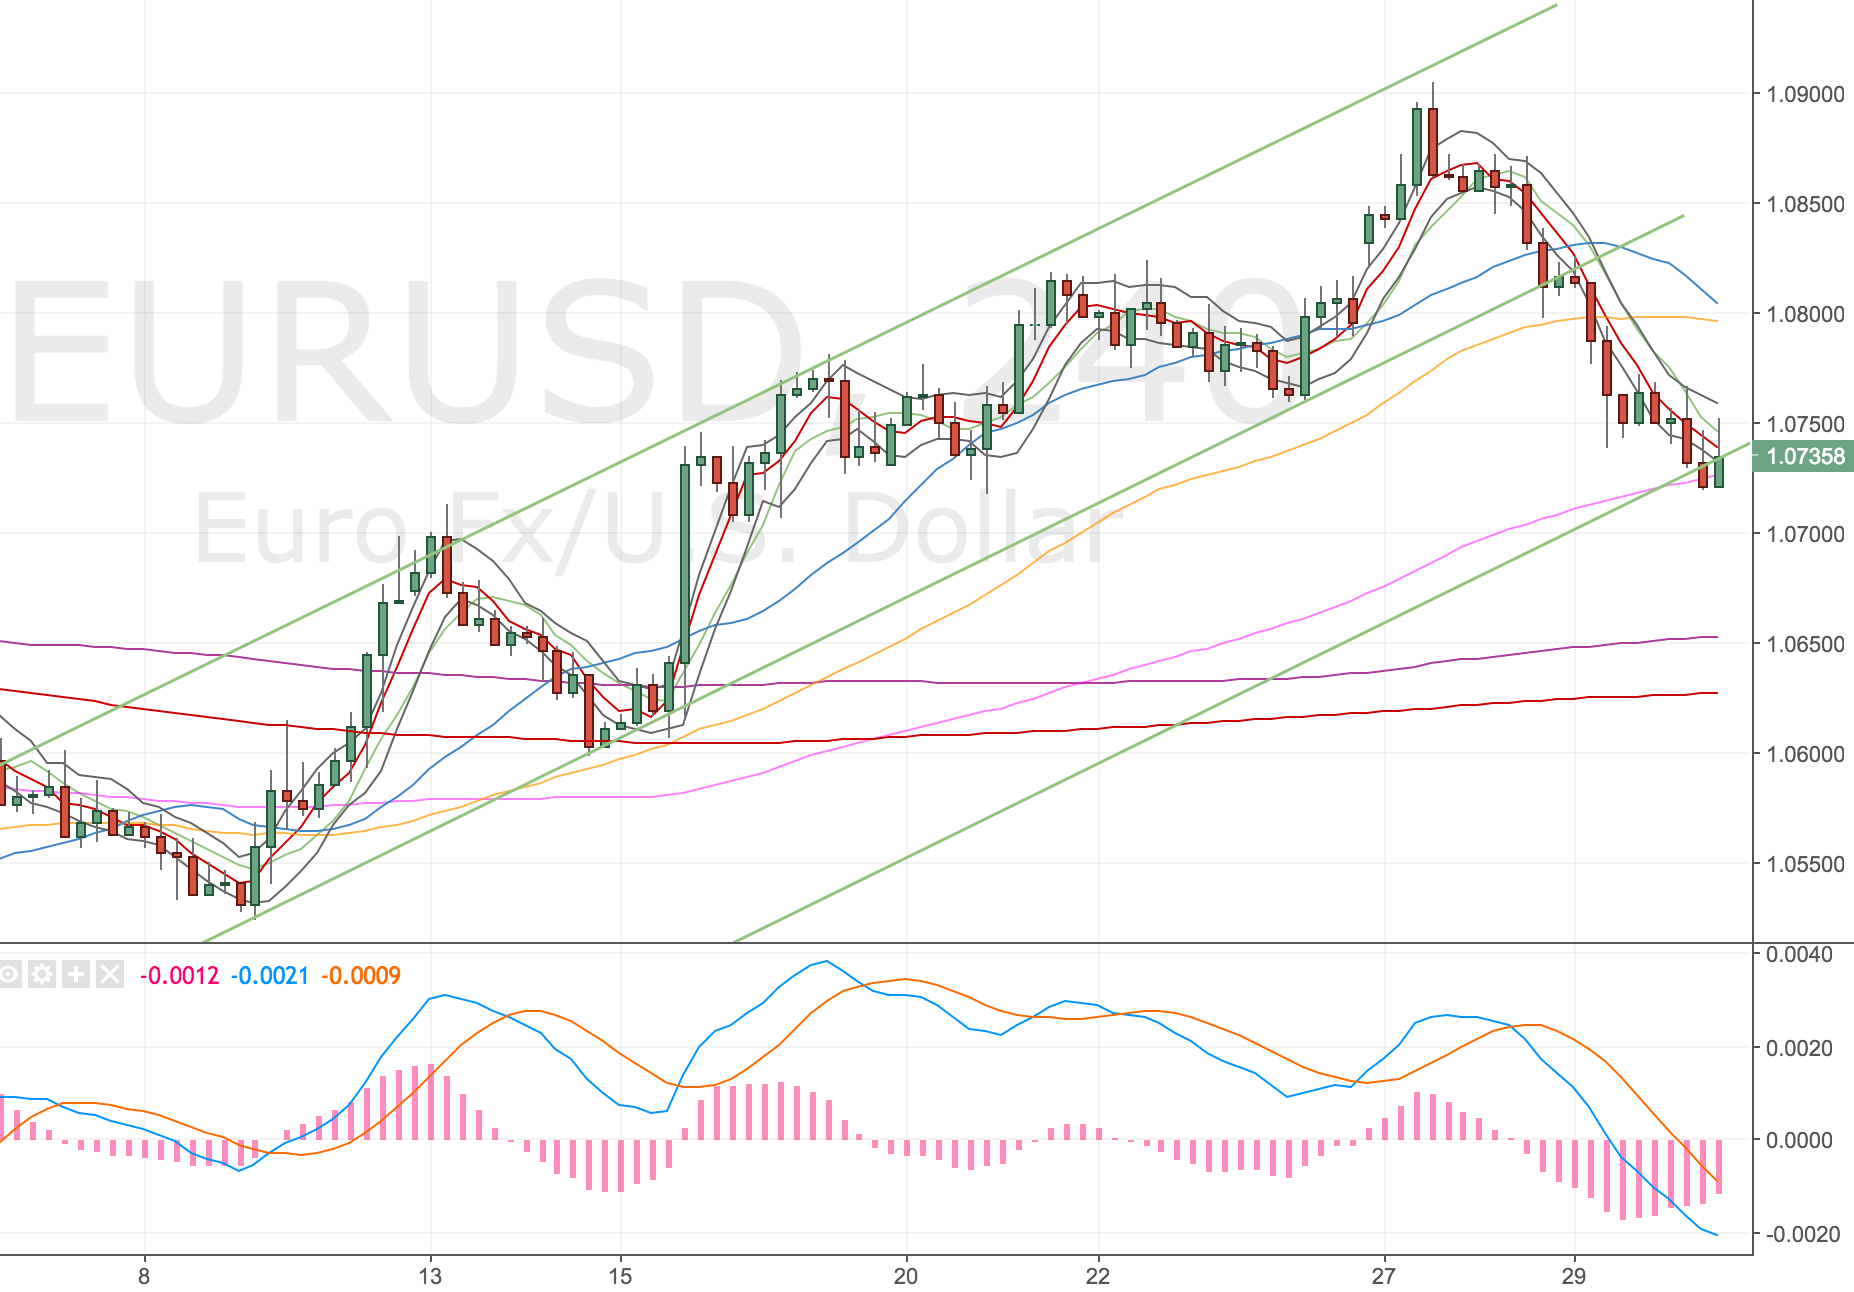
EURUSD 4H Chart – 30 Mar. Pink line is the 4h100.
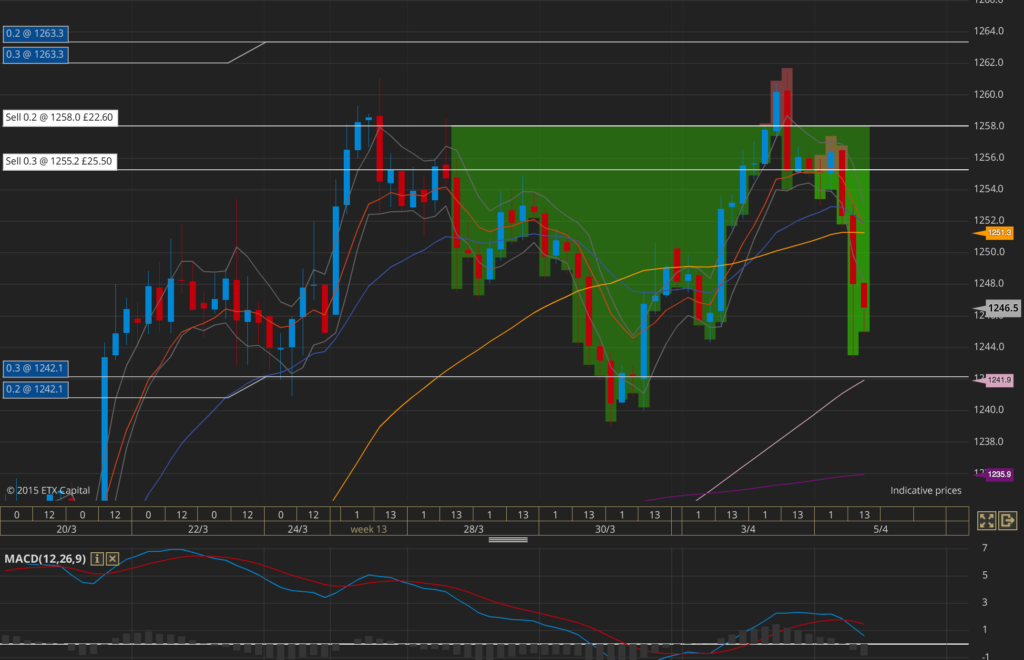
XAUUSD 4H Chart
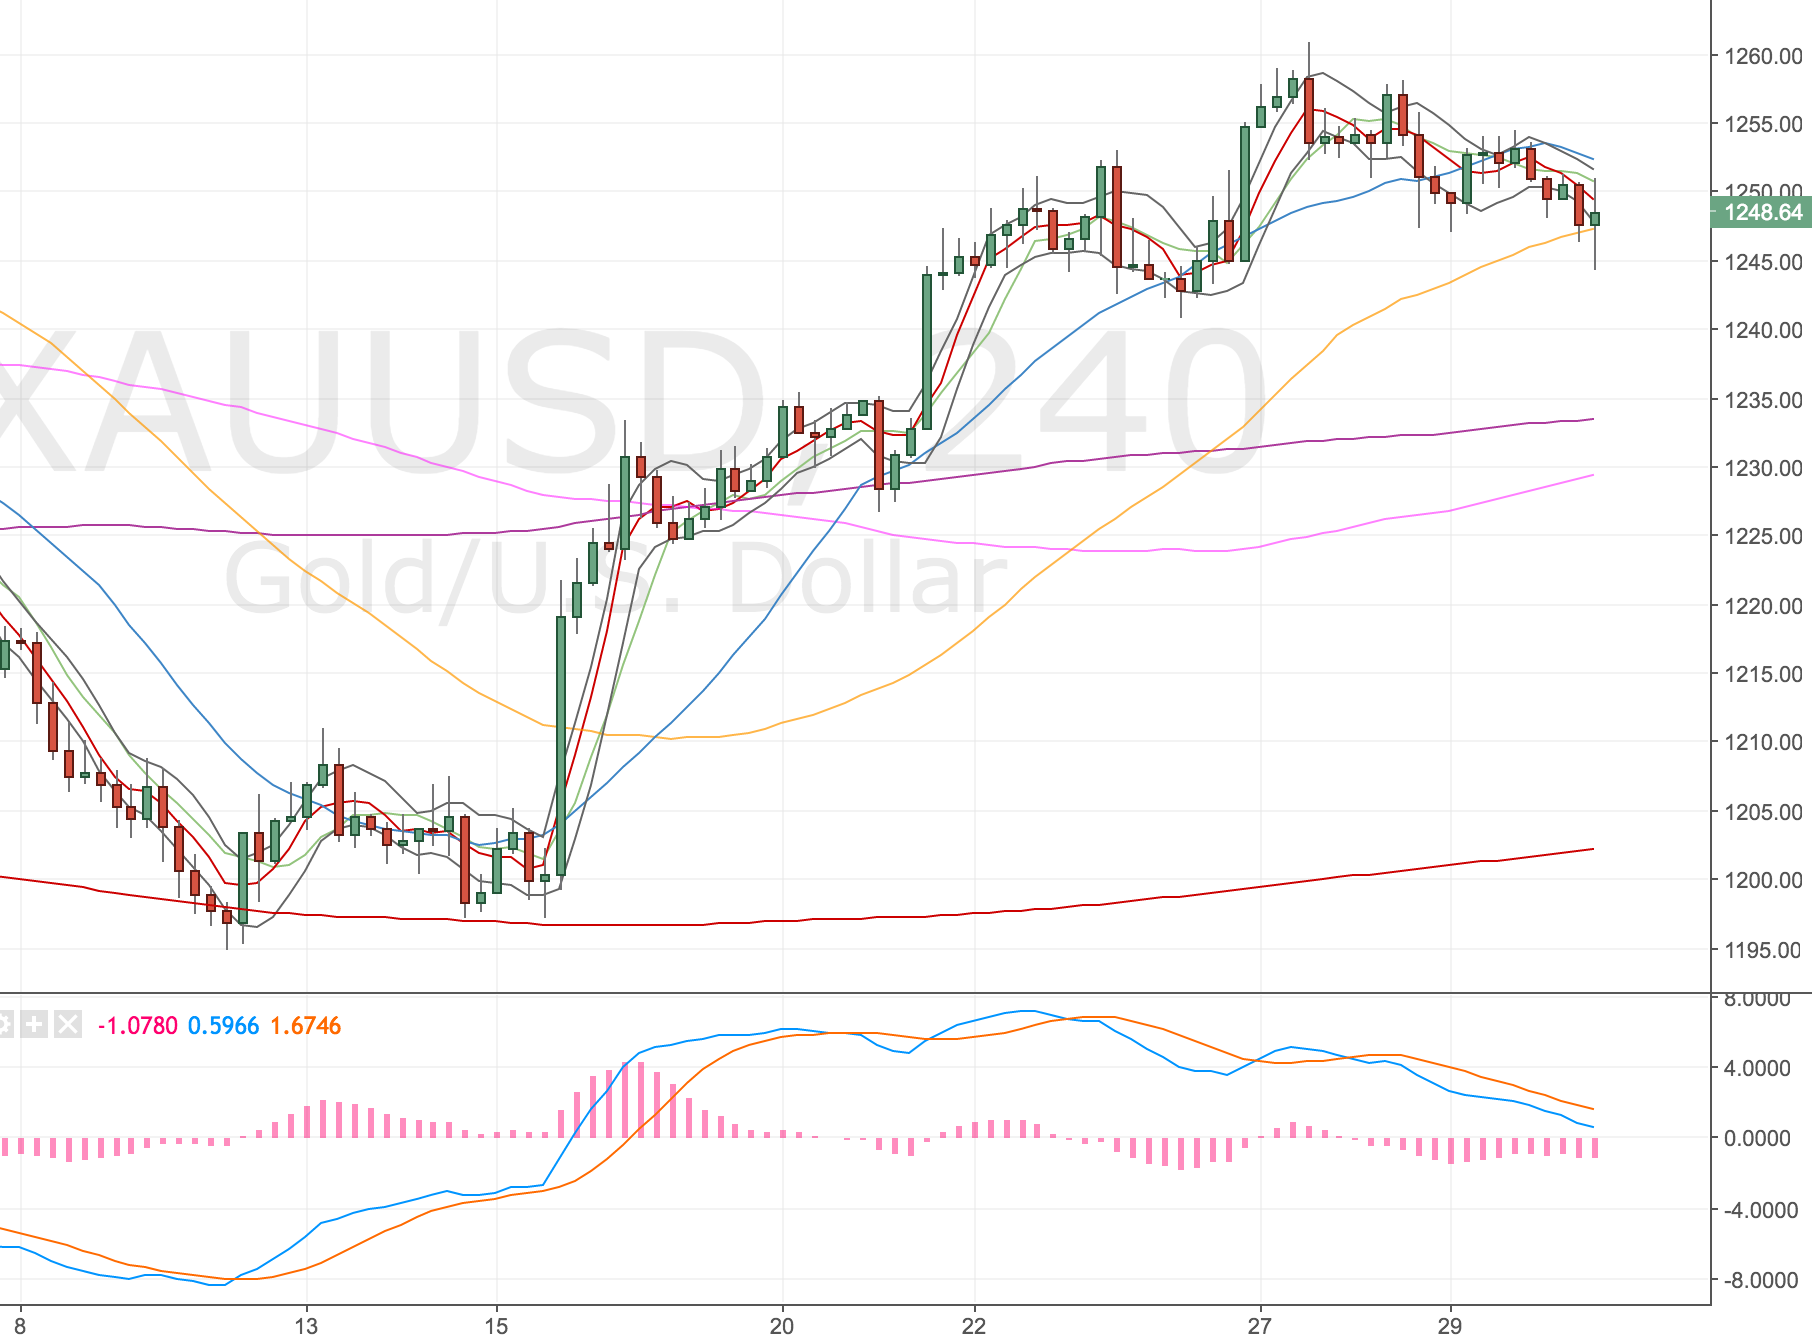
XAUUSD 4H Chart – 30 Mar. Purple line is the 4h200.
It feels good to have cut my risk and be out of some of those positions! I can move on to the next opportunity.
Here’s what I’m left with now.
XAUUSD
Acc Risk: 0.3%
Entry: 1258.0
Stop: 1263.3 (53 pips)
Target: 1233.7 (4h200, 243 pips, 4.58 RR)
Have added to my Gold position – 5 Apr
Gold has been holding up and has made another test of the d200. I wasn’t surprised to see it and fortunately for me it has made another 4h divergence. So we have a double divergence in play. So I’ve added to my position at 1253. the 4h100 has also crossed the 4h200 so I’ve split my targets to test both (as they are close by and the 4h200 hasn’t been tested in a while)
XAUUSD
Acc Risk: 0.5%
Short: 1256.3 (Avg price)
Stop: 1263.3 (70 pips)
Target 1: 1240 (4h100, 160 pips, 2.32 RR)
Target 2: 1234 (4h200, 223 pips, 3.18 RR)
I did get a screenshot of this but late on in the day. I was working to get ready for a call with Charlie. Here’s how it is looking. Looks like it might hit my target soon!
XAUUSD 4H Chart – 5 Apr
Just noticed my targets are both on the 4h100. Ops better update that! So many mistakes lately – I’m not putting enough dedicated time into this – it’s always rushed lately. Need to be better at that.
NFP tomorrow, feeling ominous – 6 Apr
The ADP figures were a strong beat and I feel that whatever happens now NFP will be a disappointment, surely a good figure is priced in so anything short of excellent will be a disappointment. We’ll see at lunchtime I guess.
Stopped out – 7 Apr

Trump announces an air strike on Syria. No doubt he mentioned some very bad people – sad.
Well I never got to those NFP figures, Trump launched a missile strike overnight and that seems to have spiked Gold higher (to be expected.) I’m not too fussed about this, not the sort of thing you can predict and so long as risk is managed it’s going to happen.
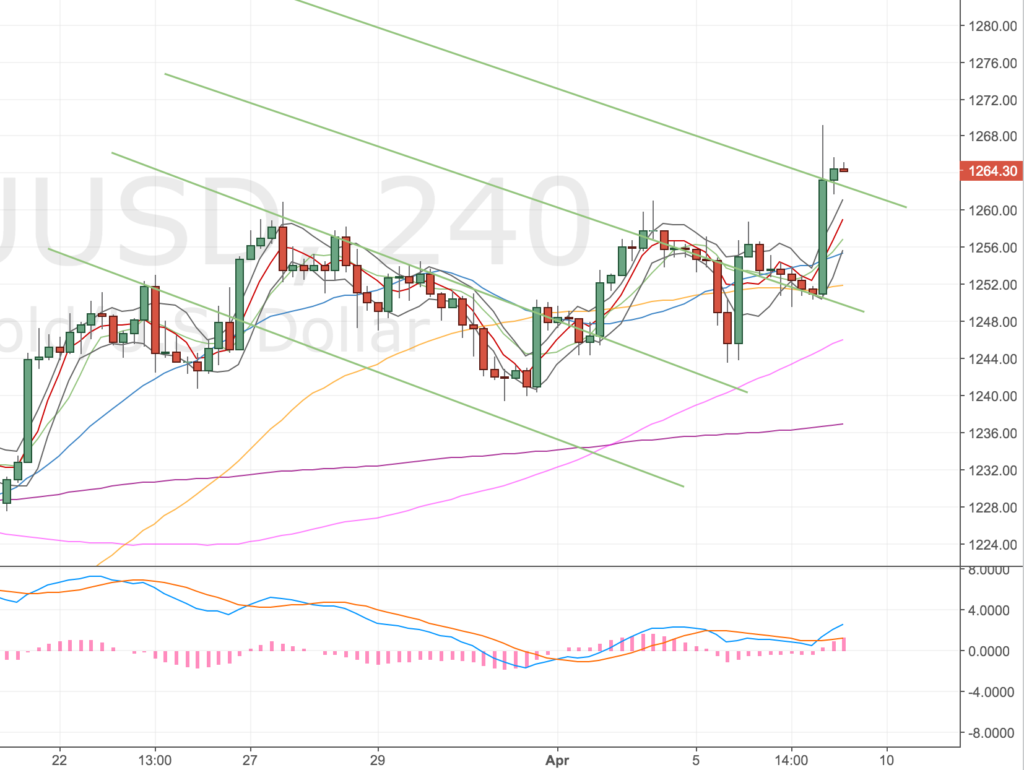
XAUUSD 4H Chart – 7 Apr 17
Price is potentially forming another divergence (double this time). I expect with the NFP figures we’ll get the set up. This set up is on the daily and 4h timeframe. I think I’ll be waiting towards the end of the day to trade this. NFP is due out at 1.30 and the candlestick on the 4h FXCM chart closes at 2pm (which might be a bit close!?) IDC 4h candlestick closes an hour later at 3pm so I might wait for that to get my read on the market.
Still tracking gold – 11 Apr
Following Friday I missed an entry to get short again on Gold. TBH I was pretty fed up with the price action and was happy to leave the trade and wait for fresh eyes on Sunday, at the back of my mind was a slight doubt that was the correct decision, but I left it nonetheless. Well turns out it wasn’t, Friday evening triggered the trade to get short, I didn’t think much would happen until Monday and I didn’t need to be holding risk over the weekend for no reason so didn’t check the market.
Being a double divergence the target would’ve been the 4h100, which got a great touch soon after!
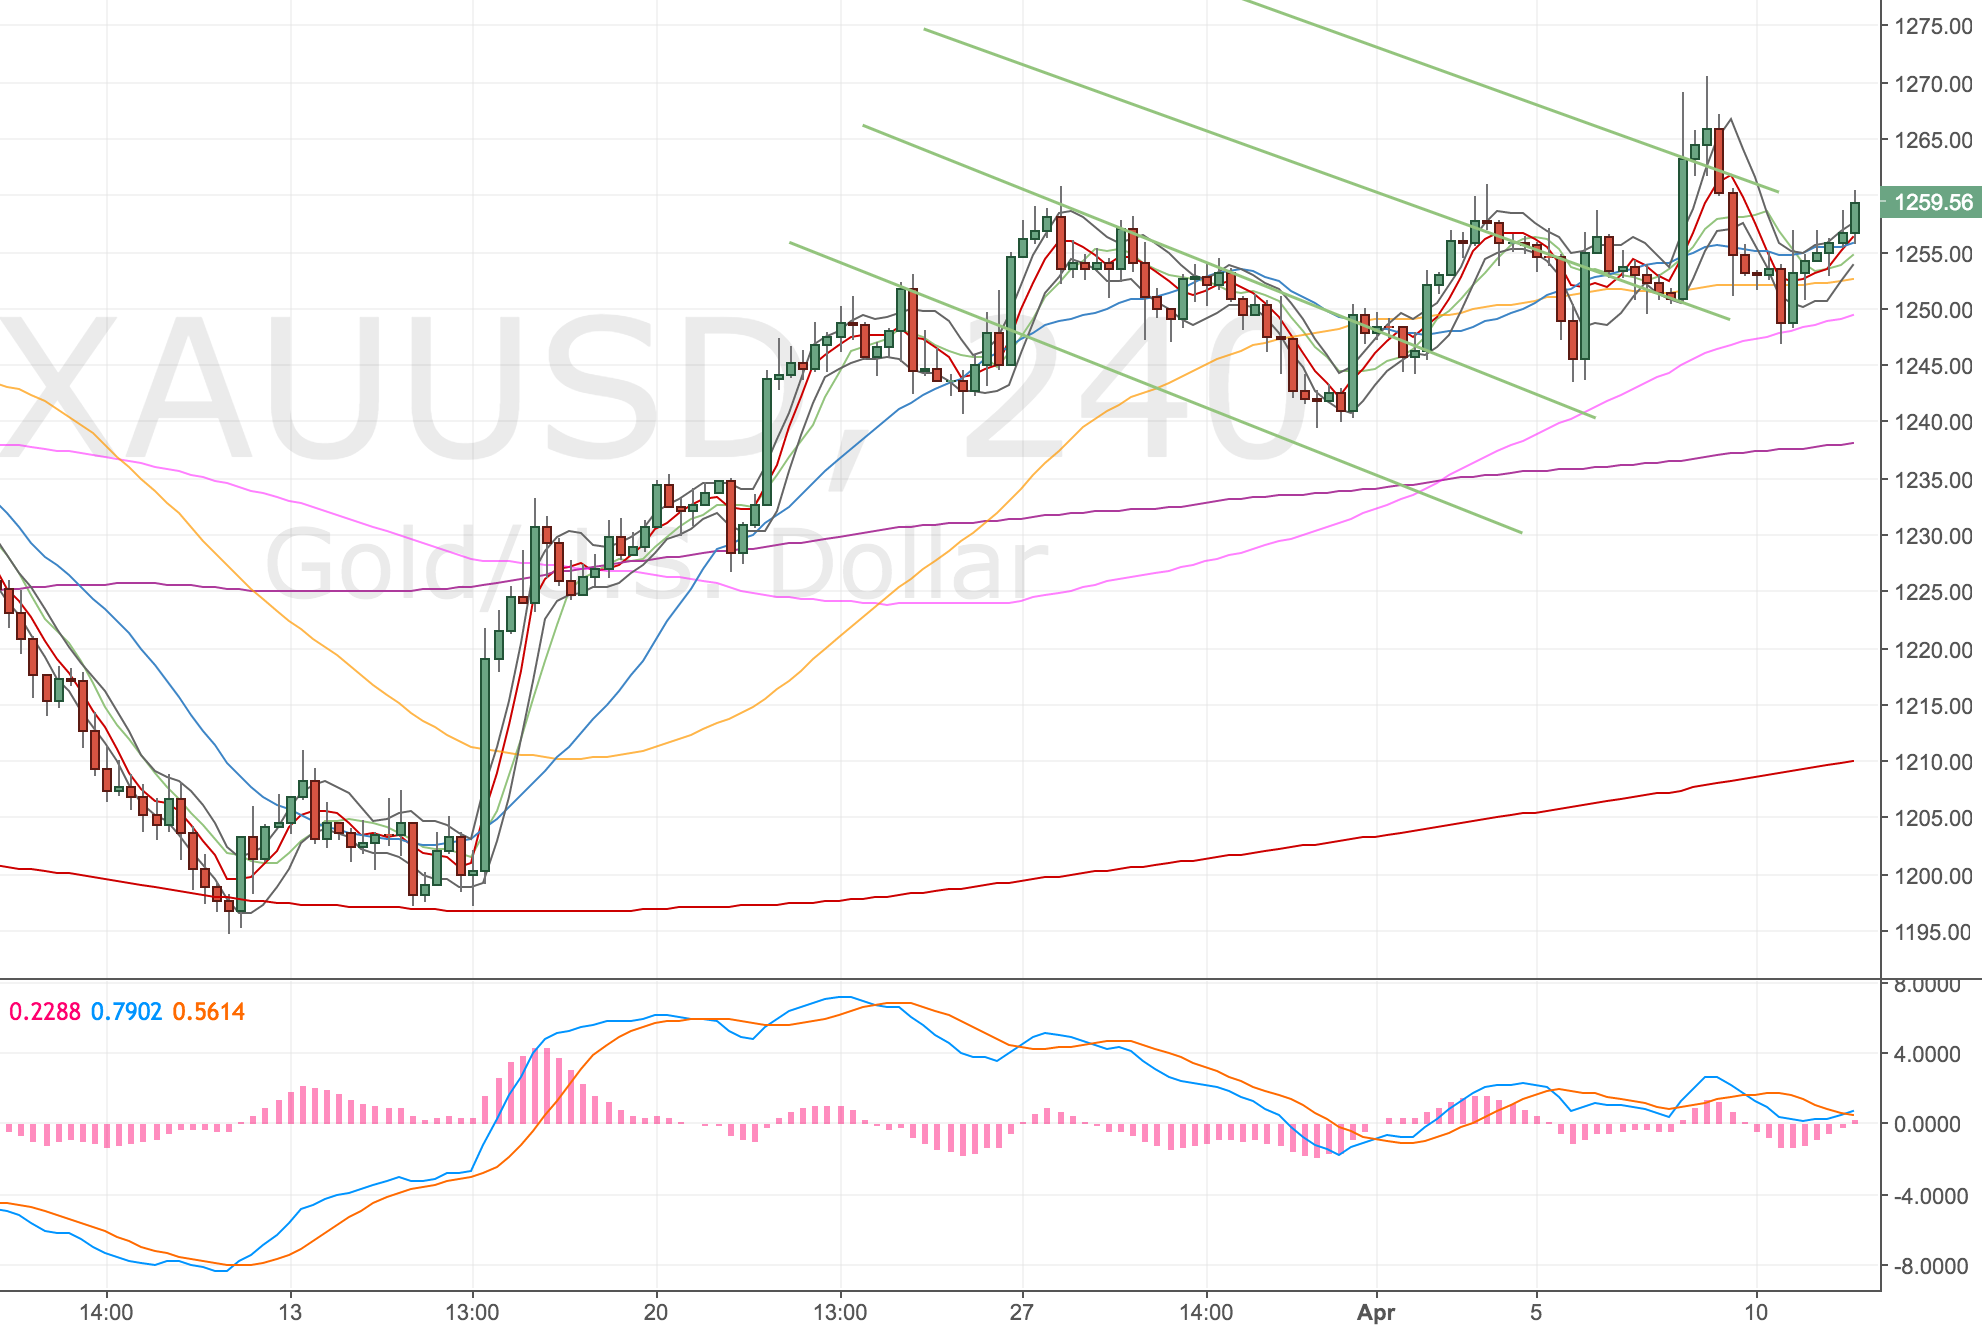
XAUUSD 4H Chart – 11 Apr
I guess price action is crap, until it isn’t!
Price is heading higher, and looks to be setting up a daily divergence. Shame the 4h won’t now. The double divergence was much nicer. It’ll be really interesting to see what price action is like over the next two days.
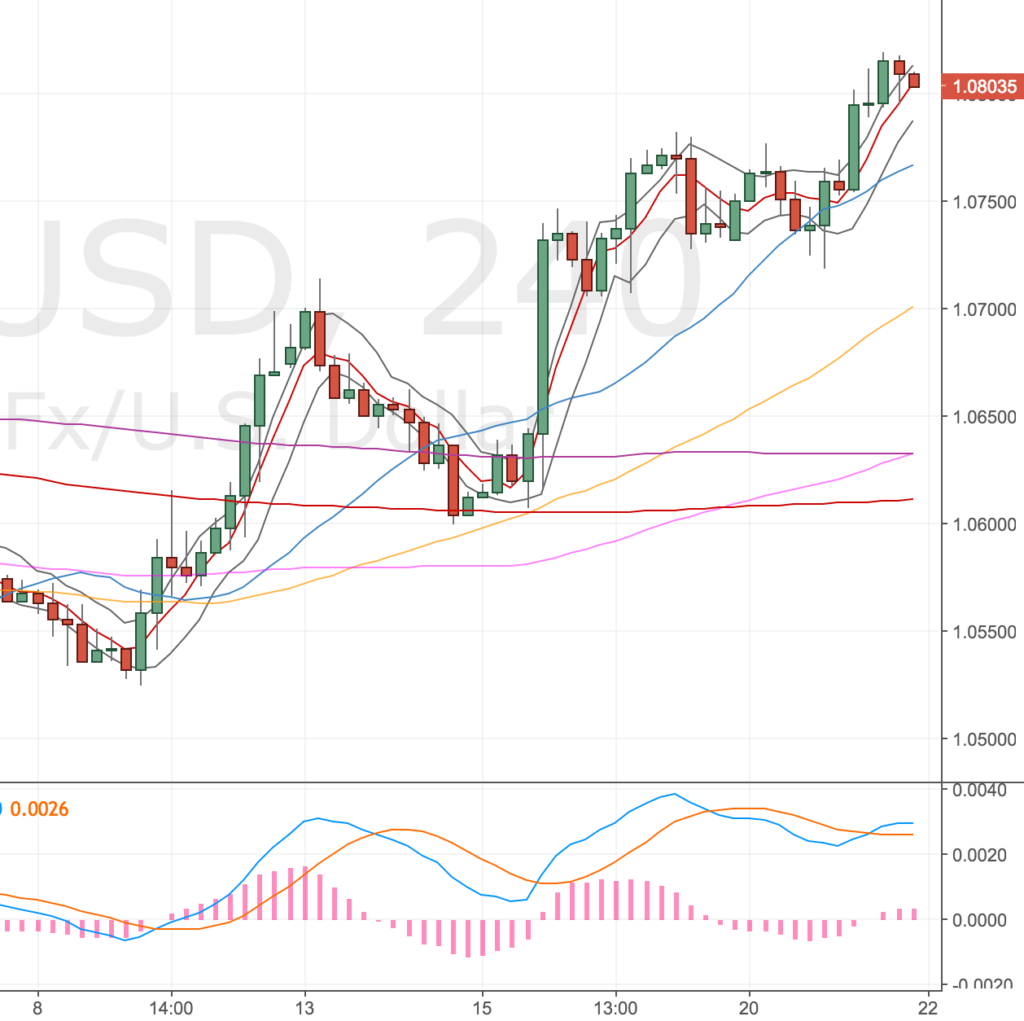
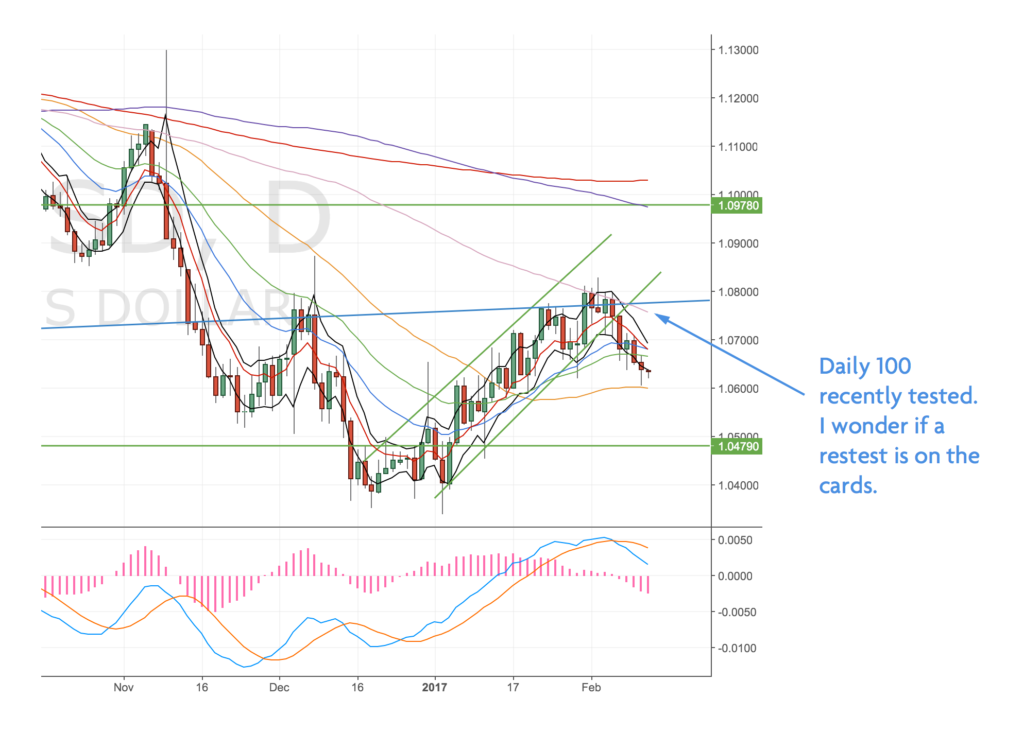
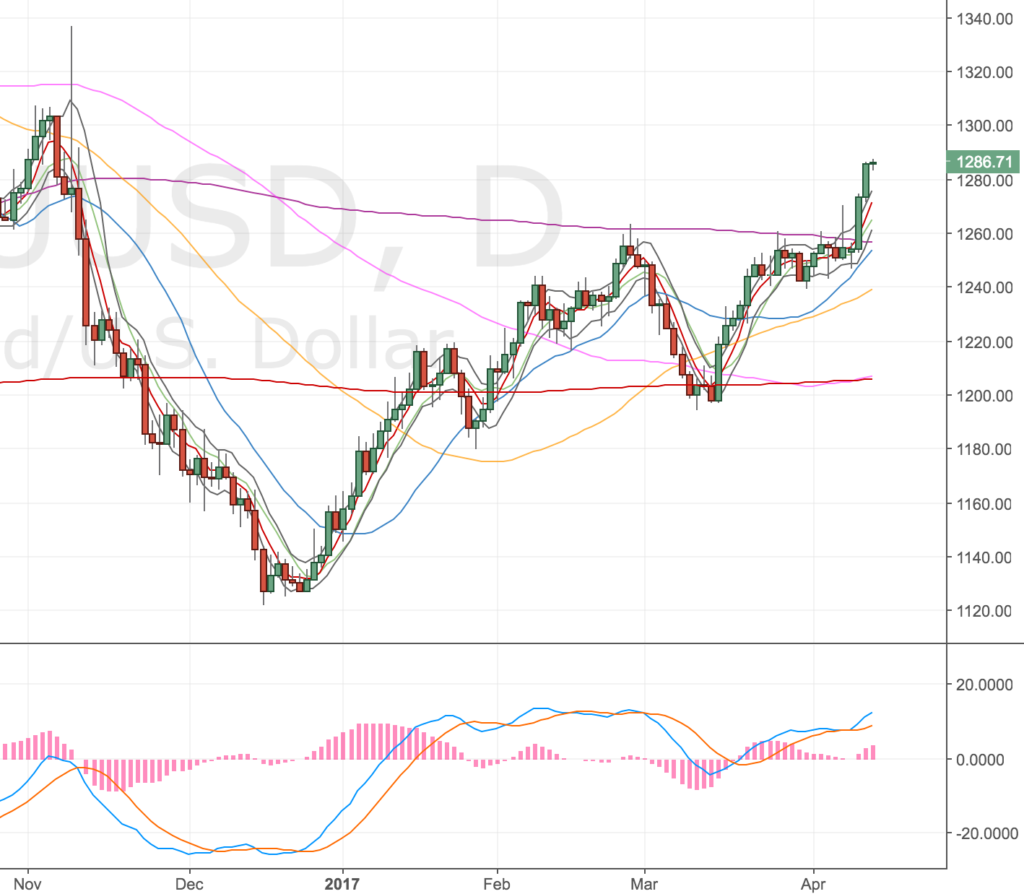
Gold heading higher – 13 Apr
Just keeping my eye on this – for now the trade is over, if we get a sudden reversal the daily chart could still set up but the price action seems very bullish right now. There was a lot of hand-railing of the d200 and the small pullbacks were quickly bought up, so I guess the writing was on the wall for Gold shorts.
Either way, we got some pips out of this, on to the next trade.
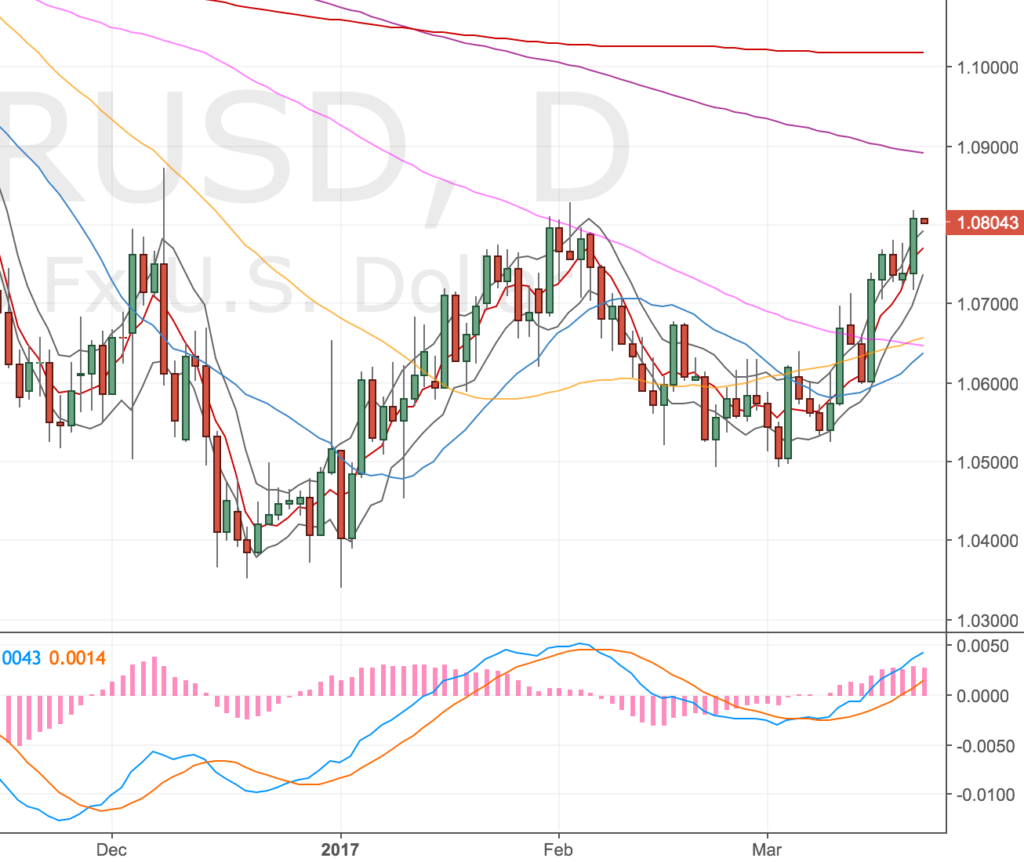
XAUUSD Daily Chart – 13 Apr