Acc Risk: 0.35%
Short: 1.0759
Stop: 1.0782 (23 pips)
Target: 1.0697 (1h500, 62 pips, 2.7 RR)
Mindset: optimistic and impatient
Update 20 Apr – Manually closed for a 40 pip profit 😐
I have to confess a few faults here:
- Trading off the hourly timeframe, not in my plan (although I think I should include it!)
- Trading mechanically first, then analysing a trade after I’ve put it on
- Suffering from FOMO (fear of missing out). I feel a pressure to take every set up so I don’t under trade my system.

I cover 20 markets and so I’ve usually got a set up forming or tradable. However over Easter I didn’t trade, and it’s been pretty quiet lately, so I haven’t put a trade on for about a week. I have been keen to get back into the market. I was looking at the EURUSD 4H chart and looking for a divergence which didn’t materialise, price was into a weekly trendline resistance, so I went down to the 1H timeframe to see if a divergence had occurred there.
It had, it looked nice, so I didn’t think twice about it.
1H Chart – the setup
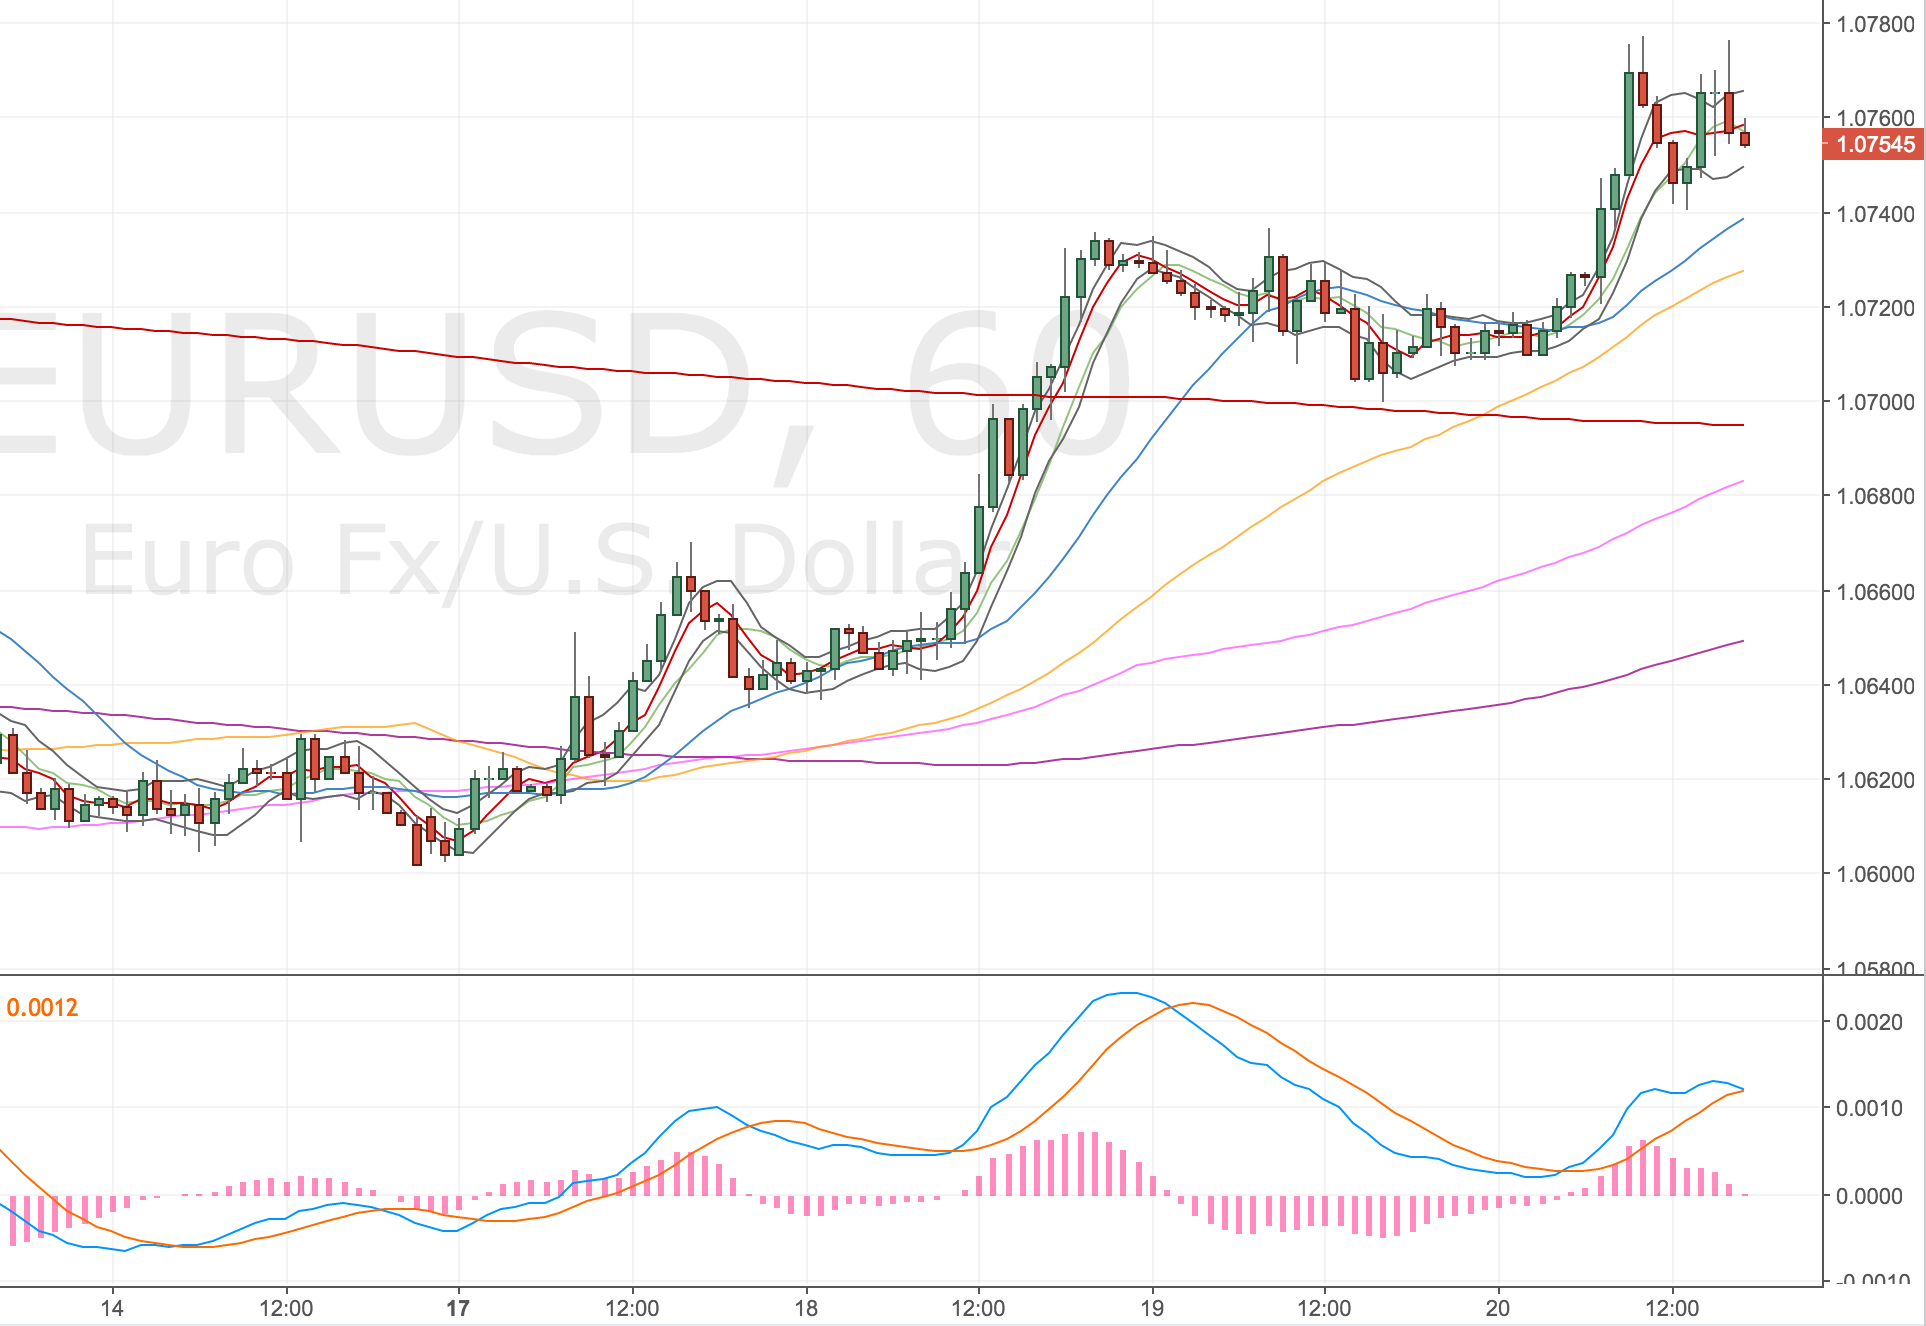
EURUSD 1H Chart – 20 Apr
4H Chart
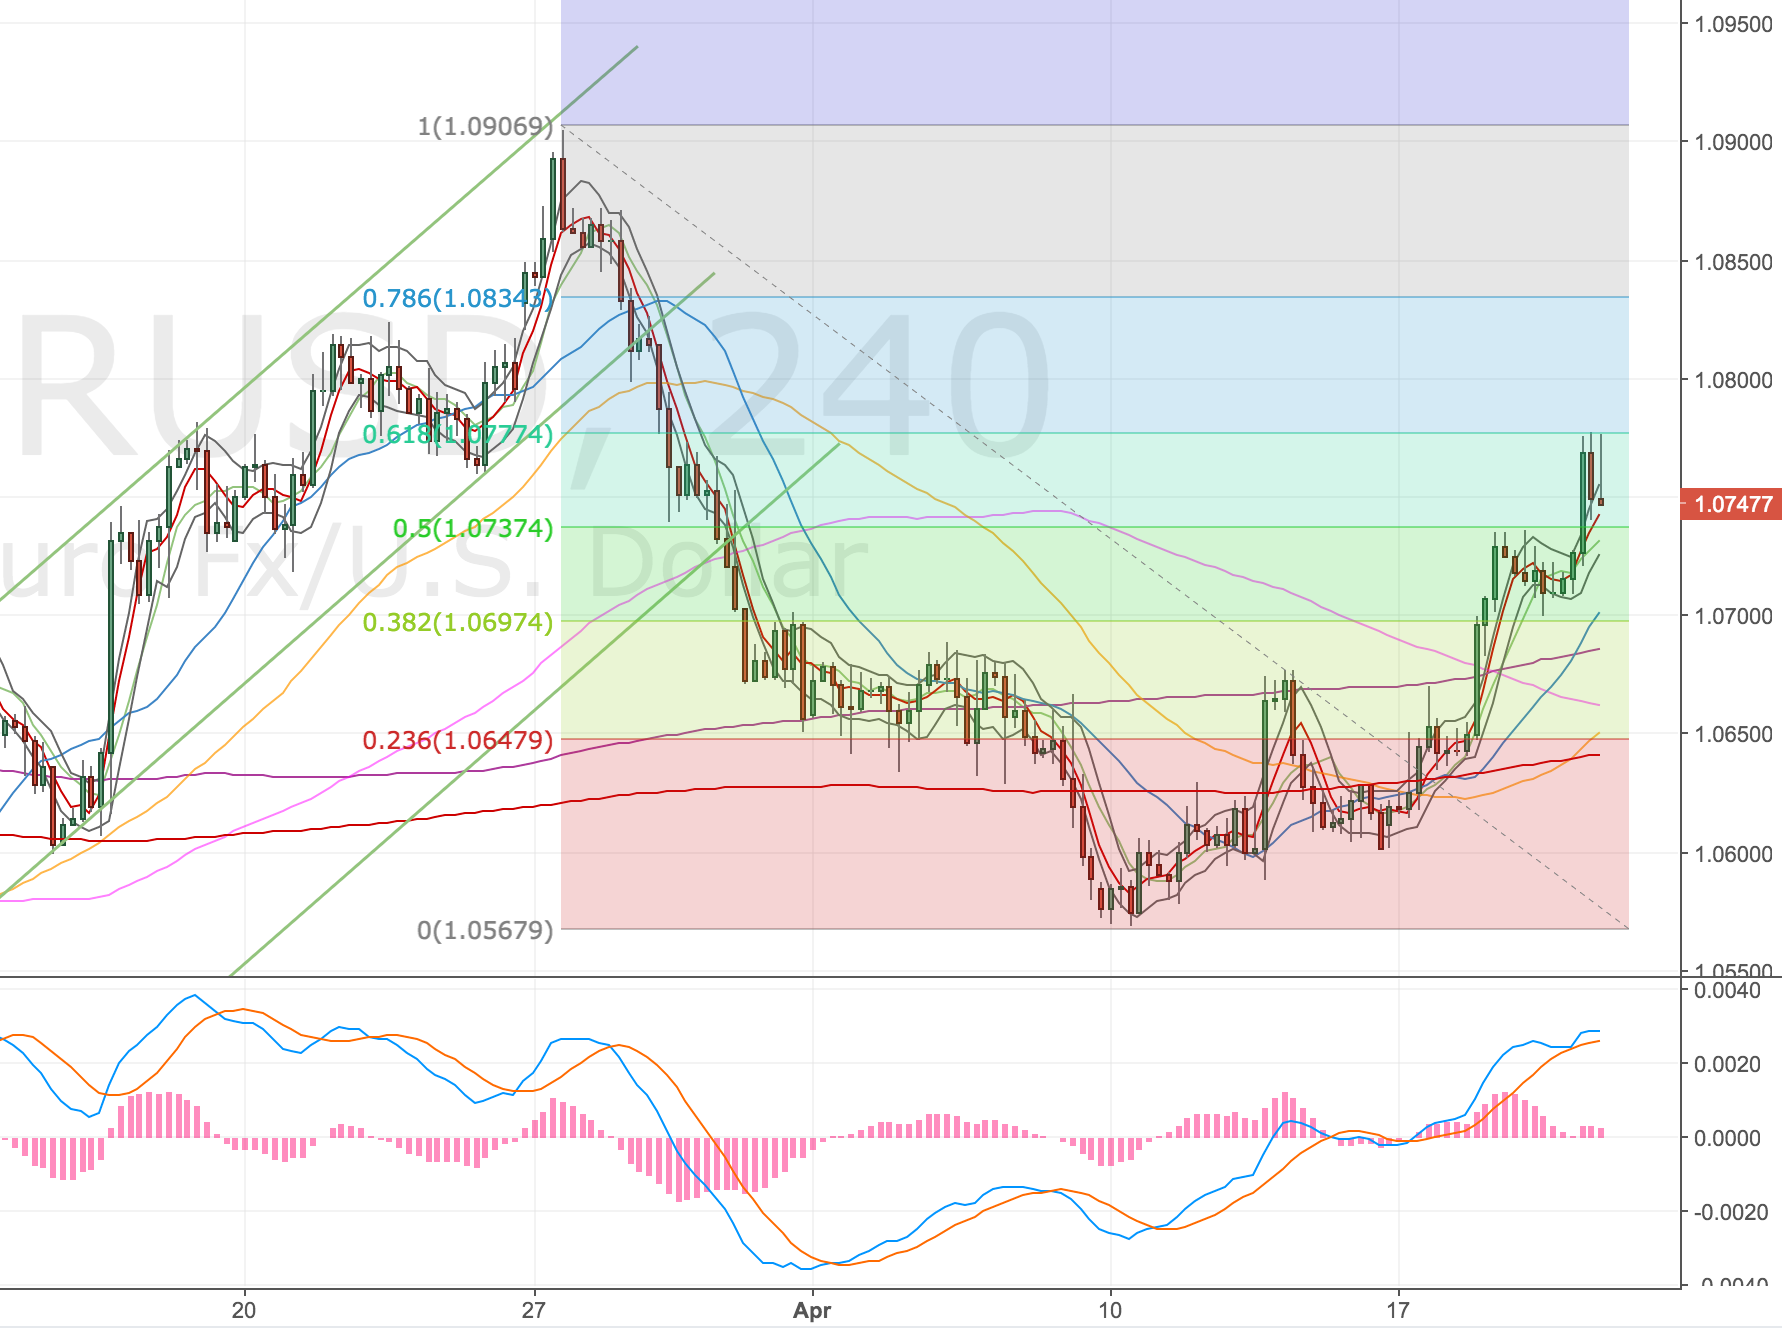
EURUSD 4H Chart – 20 Apr. Not that I would trade from it, but I did note a 61.8% retrace.
Weekly Chart
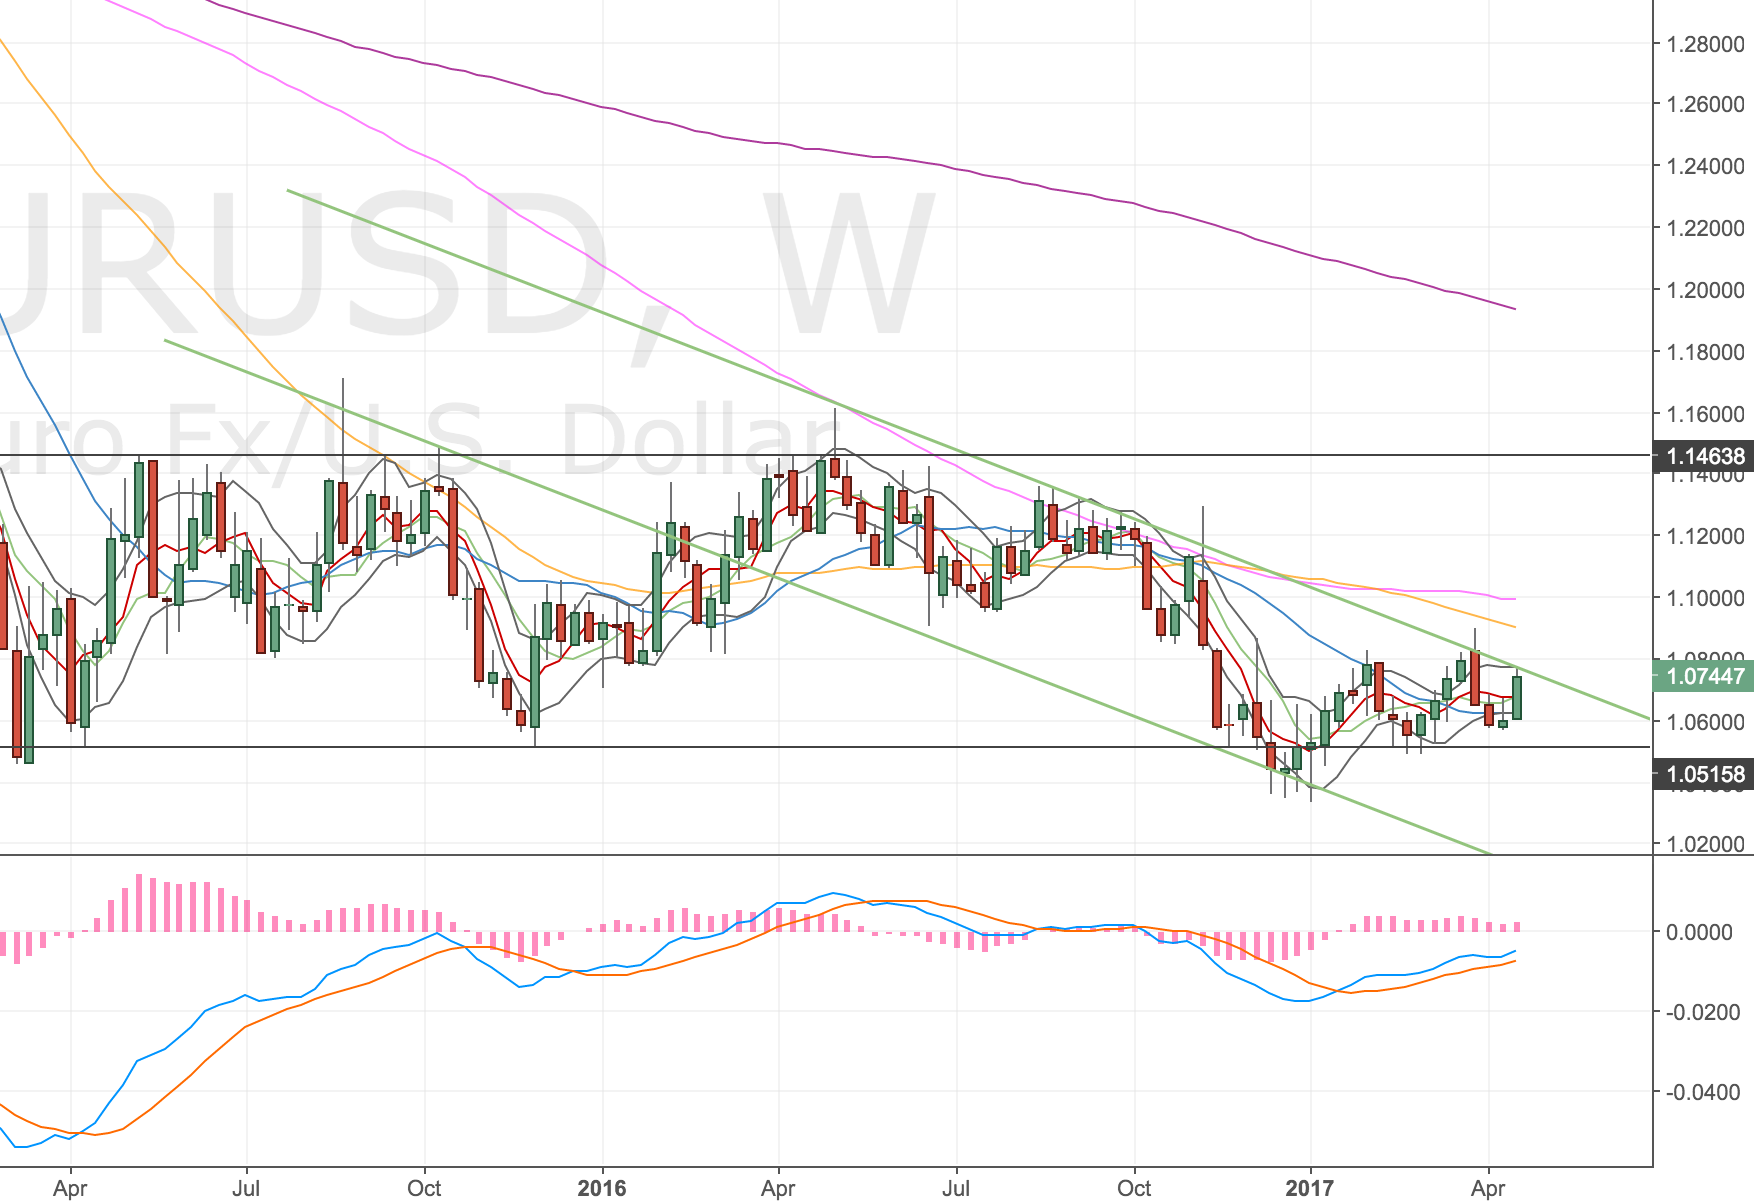
EURUSD W Chart – 20 Apr
It’s a small position – risk is only 0.35% but I wanted to get back into the market. Not a great reason but I have followed the set up rules, just on a different timeframe.
I have also been thinking recently that it might be short-sighted to stick rigidly to my two timeframes (daily & 4 hourly) when things don’t quite set up like this did, why not check the hourly timeframe for an entry?
One other habit I’ve noticed is seeing a set up, taking it and THEN really checking the charts to see what other factors might be in play. I need to kick that habit into touch! Thinking about it for a second, I would say this is partly because I don’t truly know what I am looking for, I have no other stats to base my analysis on (e.g. 70% of the time when price closes inside the 4h bands, it will touch a particular ma, or x tests of trendline usually lead to a break etc) it’s back to my opinion again, I have no real weighting I can apply to what I am seeing.
I think I need to do some more back testing, although not sure how best to backtest broad analysis like this.
Update 20 Apr – Manually closed for a 40 pip profit 😐
Well I haven’t followed my original plan here. I’ve had a lot of doubt about my target, some targets are very clear to me and don’t get changed, but some are difficult to pick. This is a great example, the set up was on the hourly chart, but I’m always thinking bigger targets – hence my 1h500 target which aligned with the 4h200. However, I only have daily and 4h backtesting stats on the 20, 34, 55 & 100 MAs and the divergence only occurred on the 1h timeframe.
So I decided I was trading on opinion and not my strategy, so I closed the position just below the 1h50 (yellow line) @ 1.0719. Not that it matters/bothers me, but price has since hit the original 1h500 target (red line).
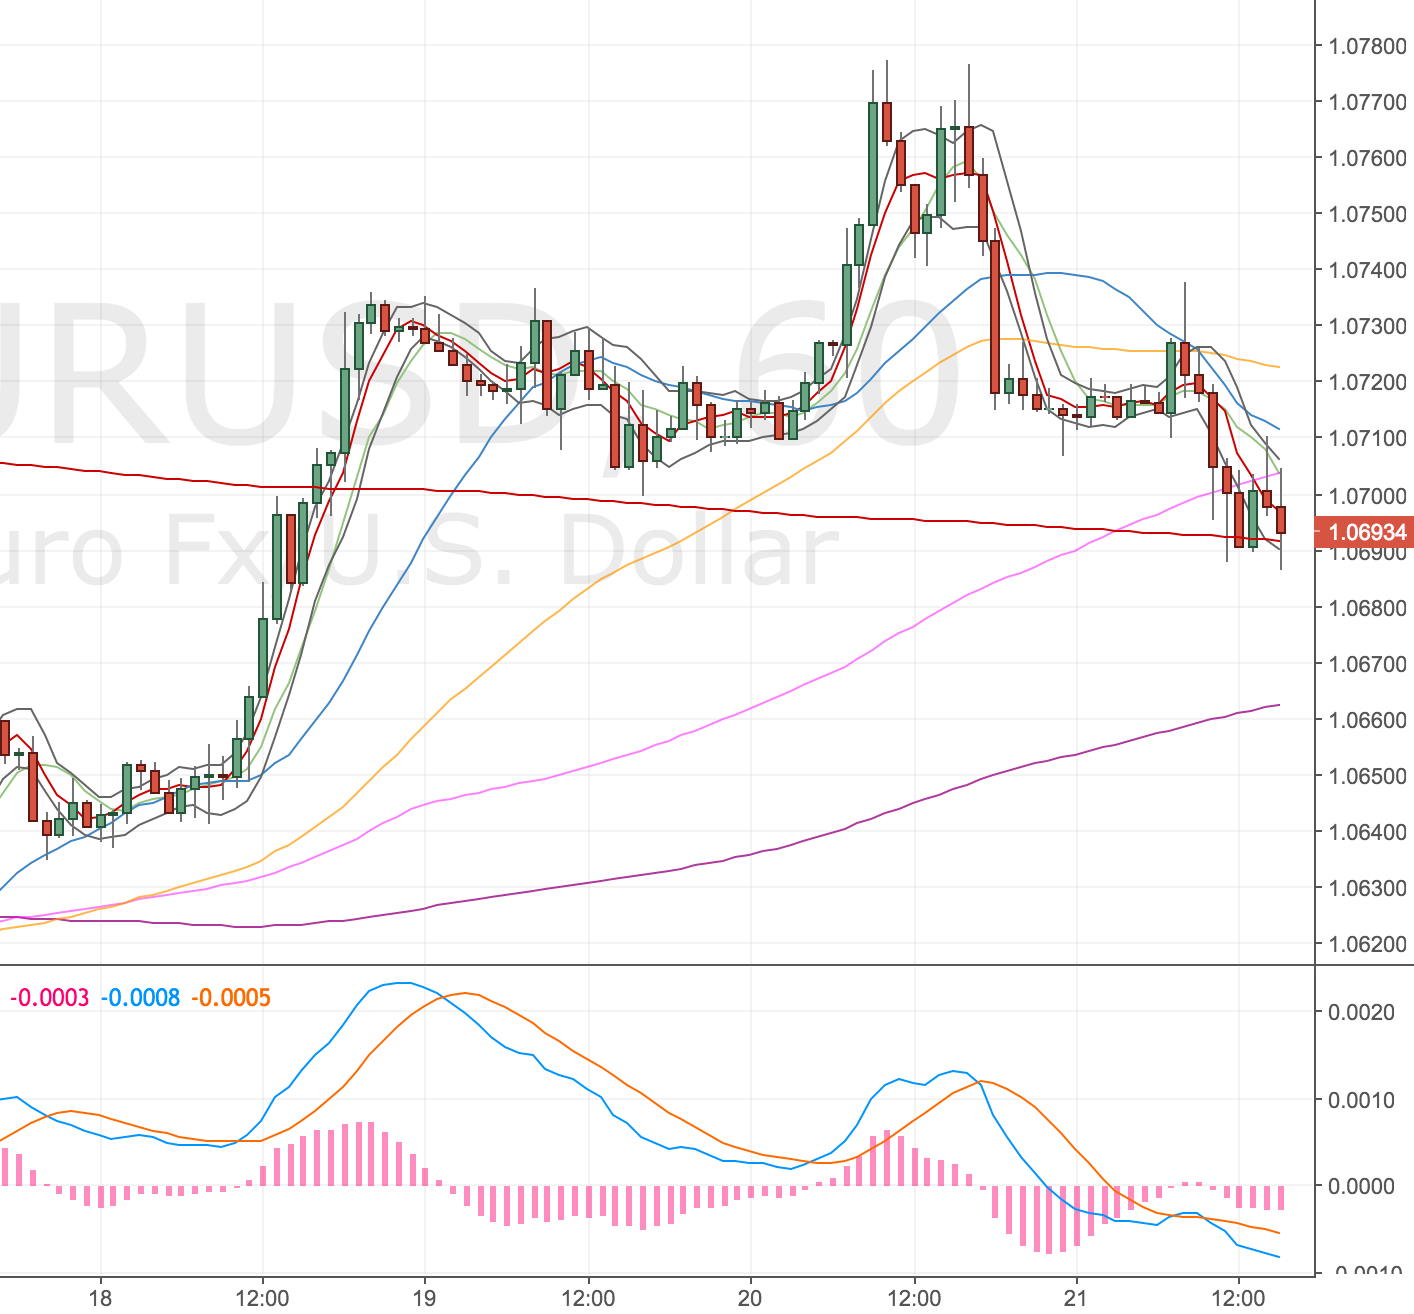
EURUSD 1H Chart – 21 Apr
A few thoughts/questions on this trade:
- I haven’t back tested the 1h timeframe, but I found similar results across the daily and 4h timeframes so assumed it would be the same for the hourly (but I never checked / did the work).
- Once the trade was on I checked the chart regularly! I didn’t want another loser (had a number of losers going long against the Yen) and I wasn’t confident about my exit. This has to be a sign I’m not comfortable with the trade. In future is it best to just close the trade if I find myself in this situation again?
- I think I did the right thing in retrospect – exiting at the 1h50 – my original target was baseless and I still earnt an okay RR
Some things here to cover with Charlie.