Acc Risk: 0.45%
Short: 1292.8
Stop: 1297.1 (43 pips)
Target: 1271.8 (4h50, 210 pips, 4.8 RR)
Mindset: OK. Expecting a couple of stop outs before this might work out.
Spotted this short set up and like it because we have the potential for divergences across multiple timeframes. My only reservation is the price action hasn’t made a big spike high, I would feel much safer if it had, but you’ve got to be in it to win it so I opened a position.
If the divergence also occurs on the daily, I will look to add.
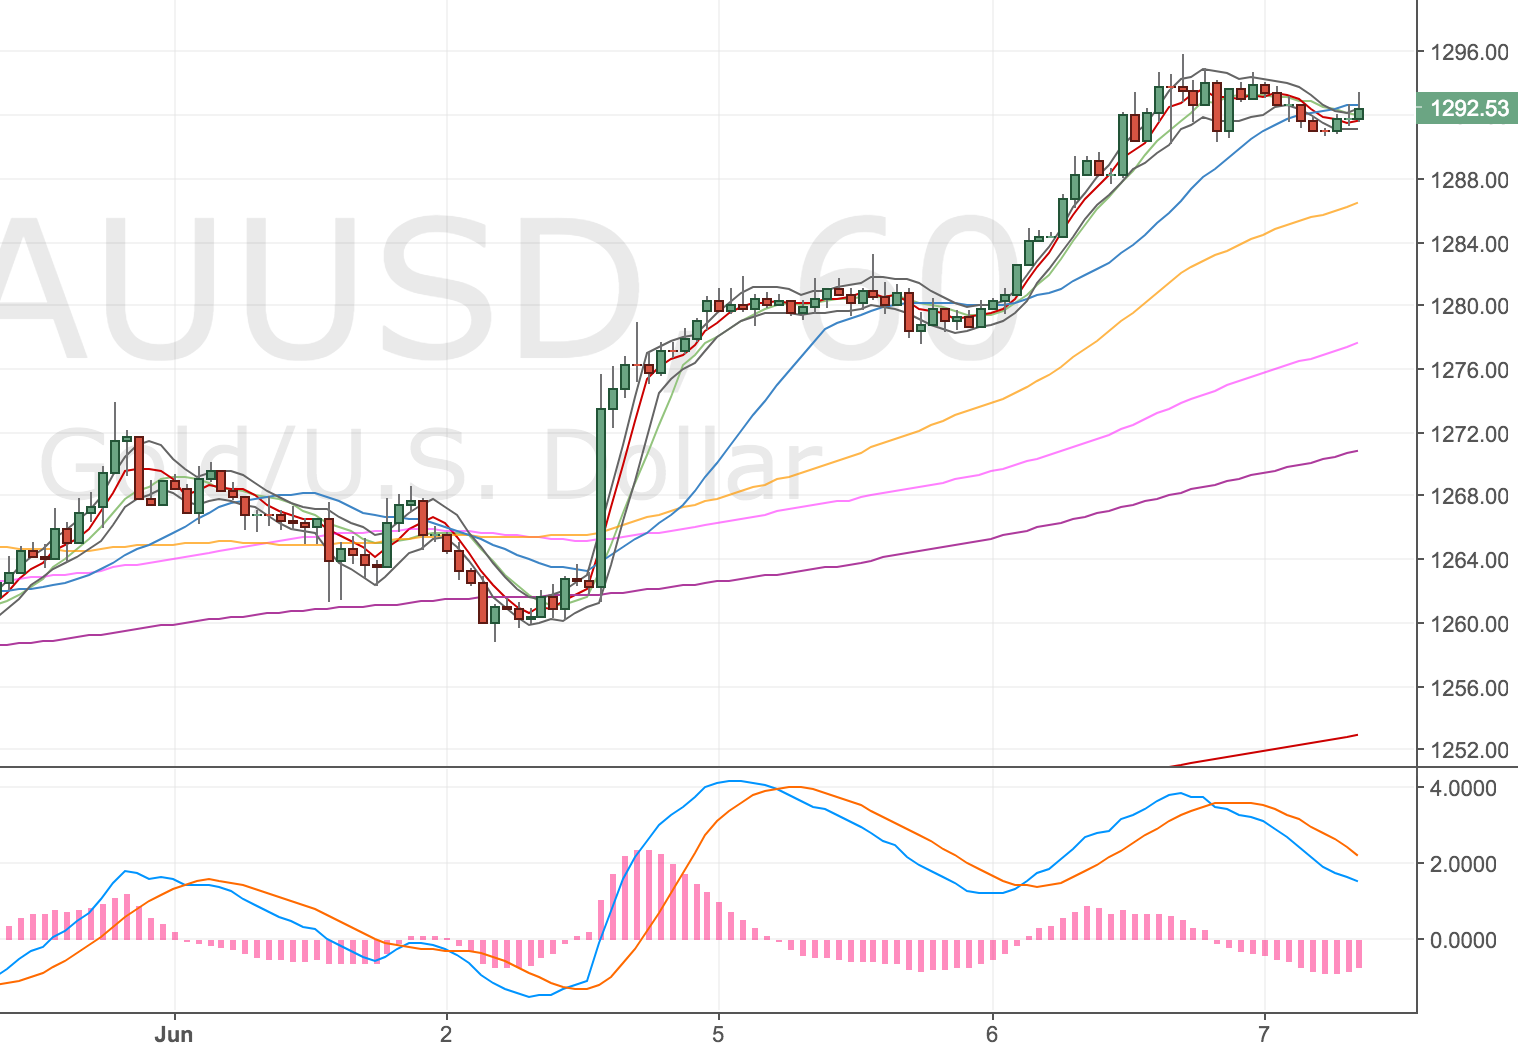
4H Chart – set up
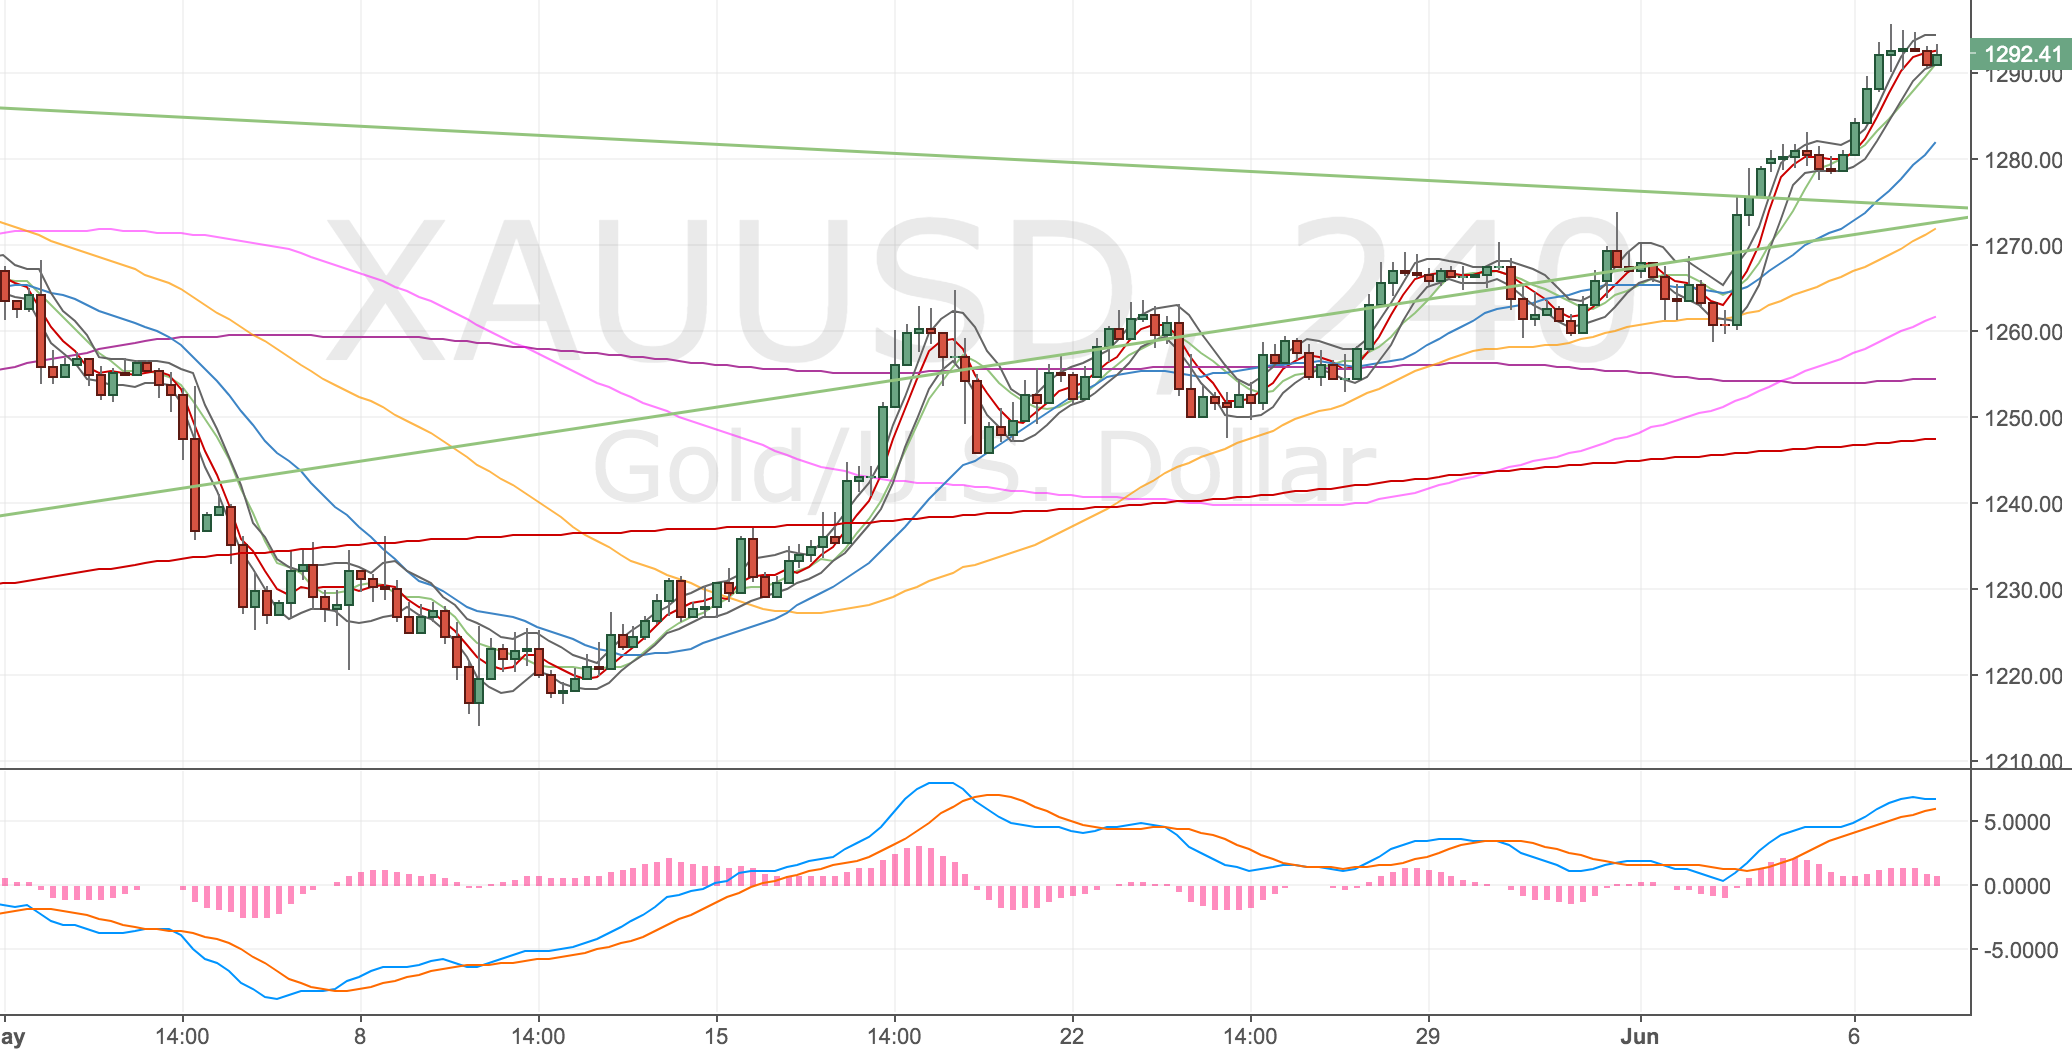
Gold 4H Chart – 7 June
Here’s the divergence I’m keen on. The reason I like this trade is on the higher timeframes.
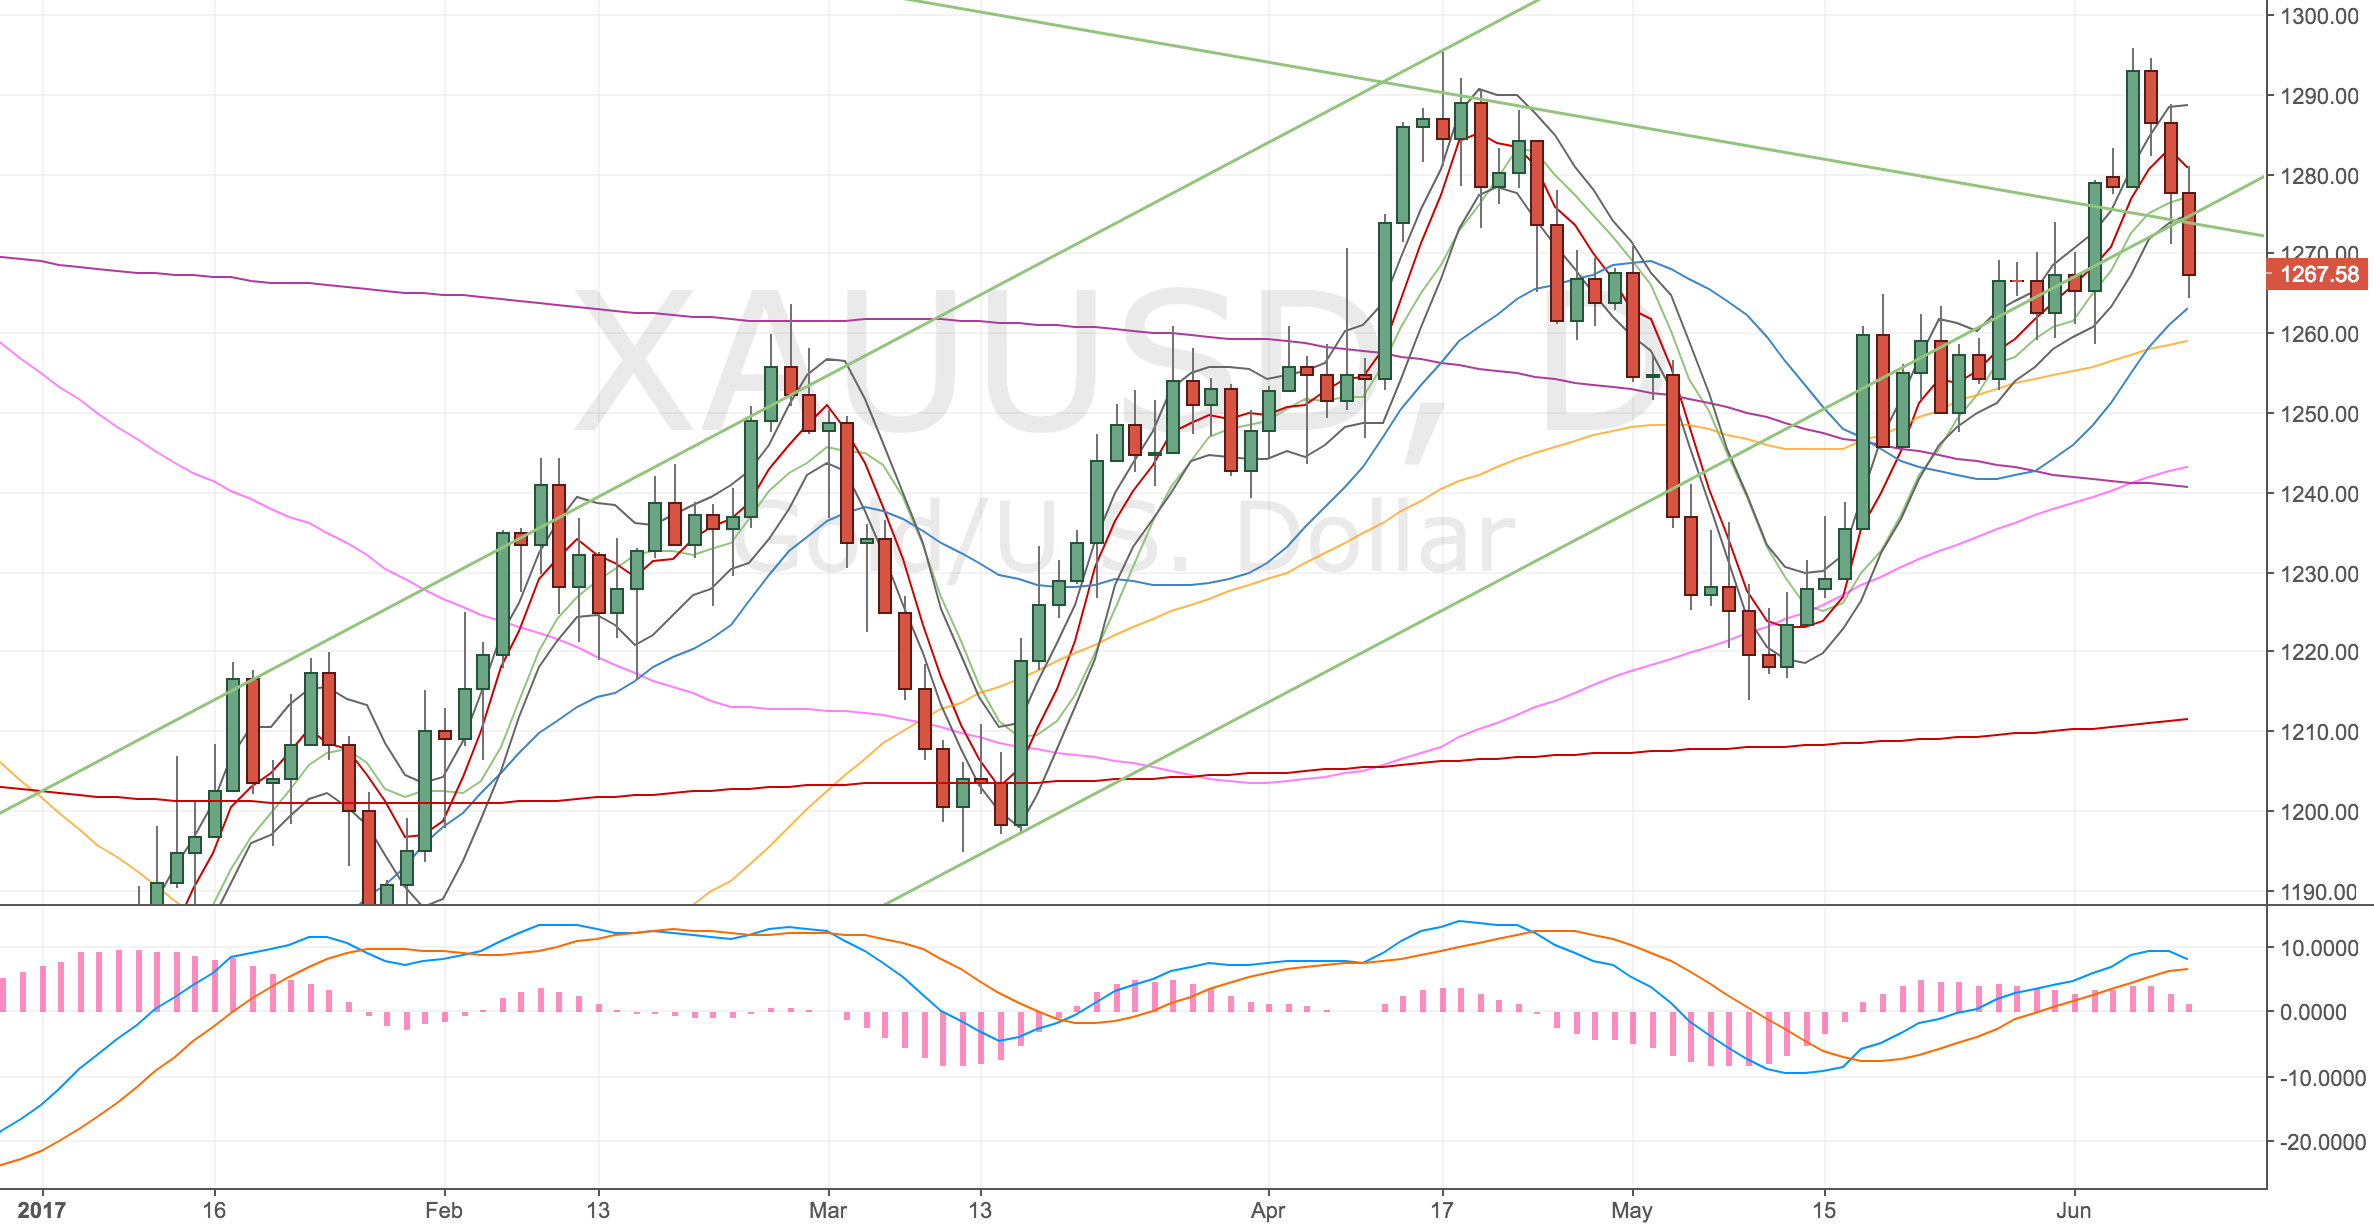
Monthly Chart
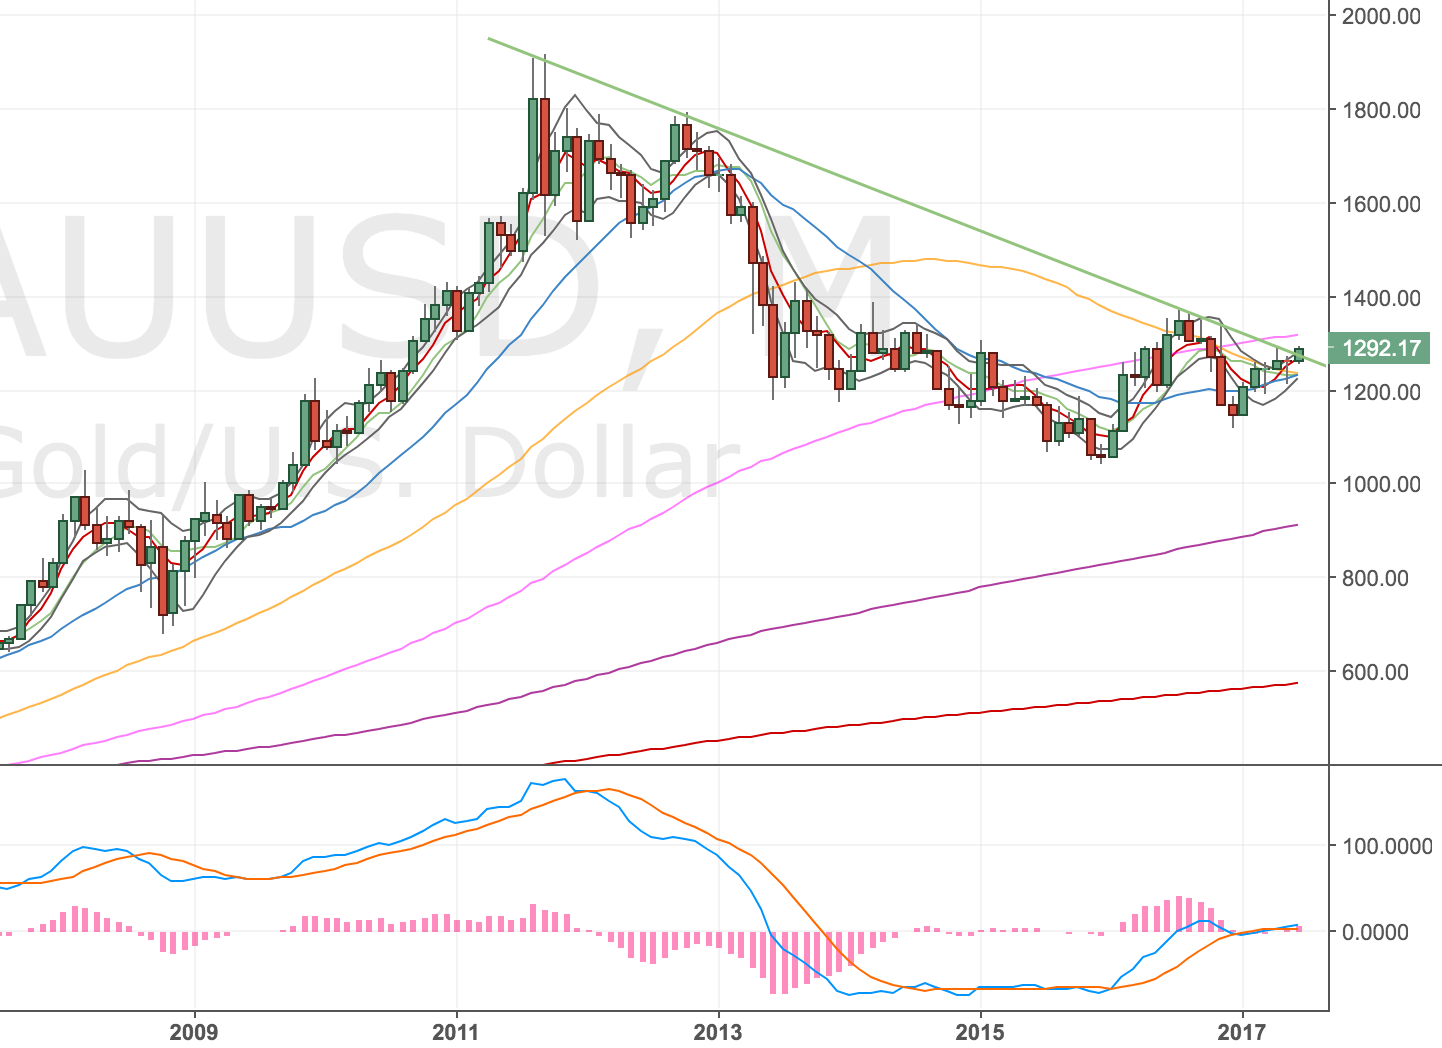
Gold Monthly Chart – 7 June
We’re testing a very long term trendline. It’s been recently tested (relatively) but I would expect a reaction to it before we were to break it. I’m looking for some monthly hand-railing.
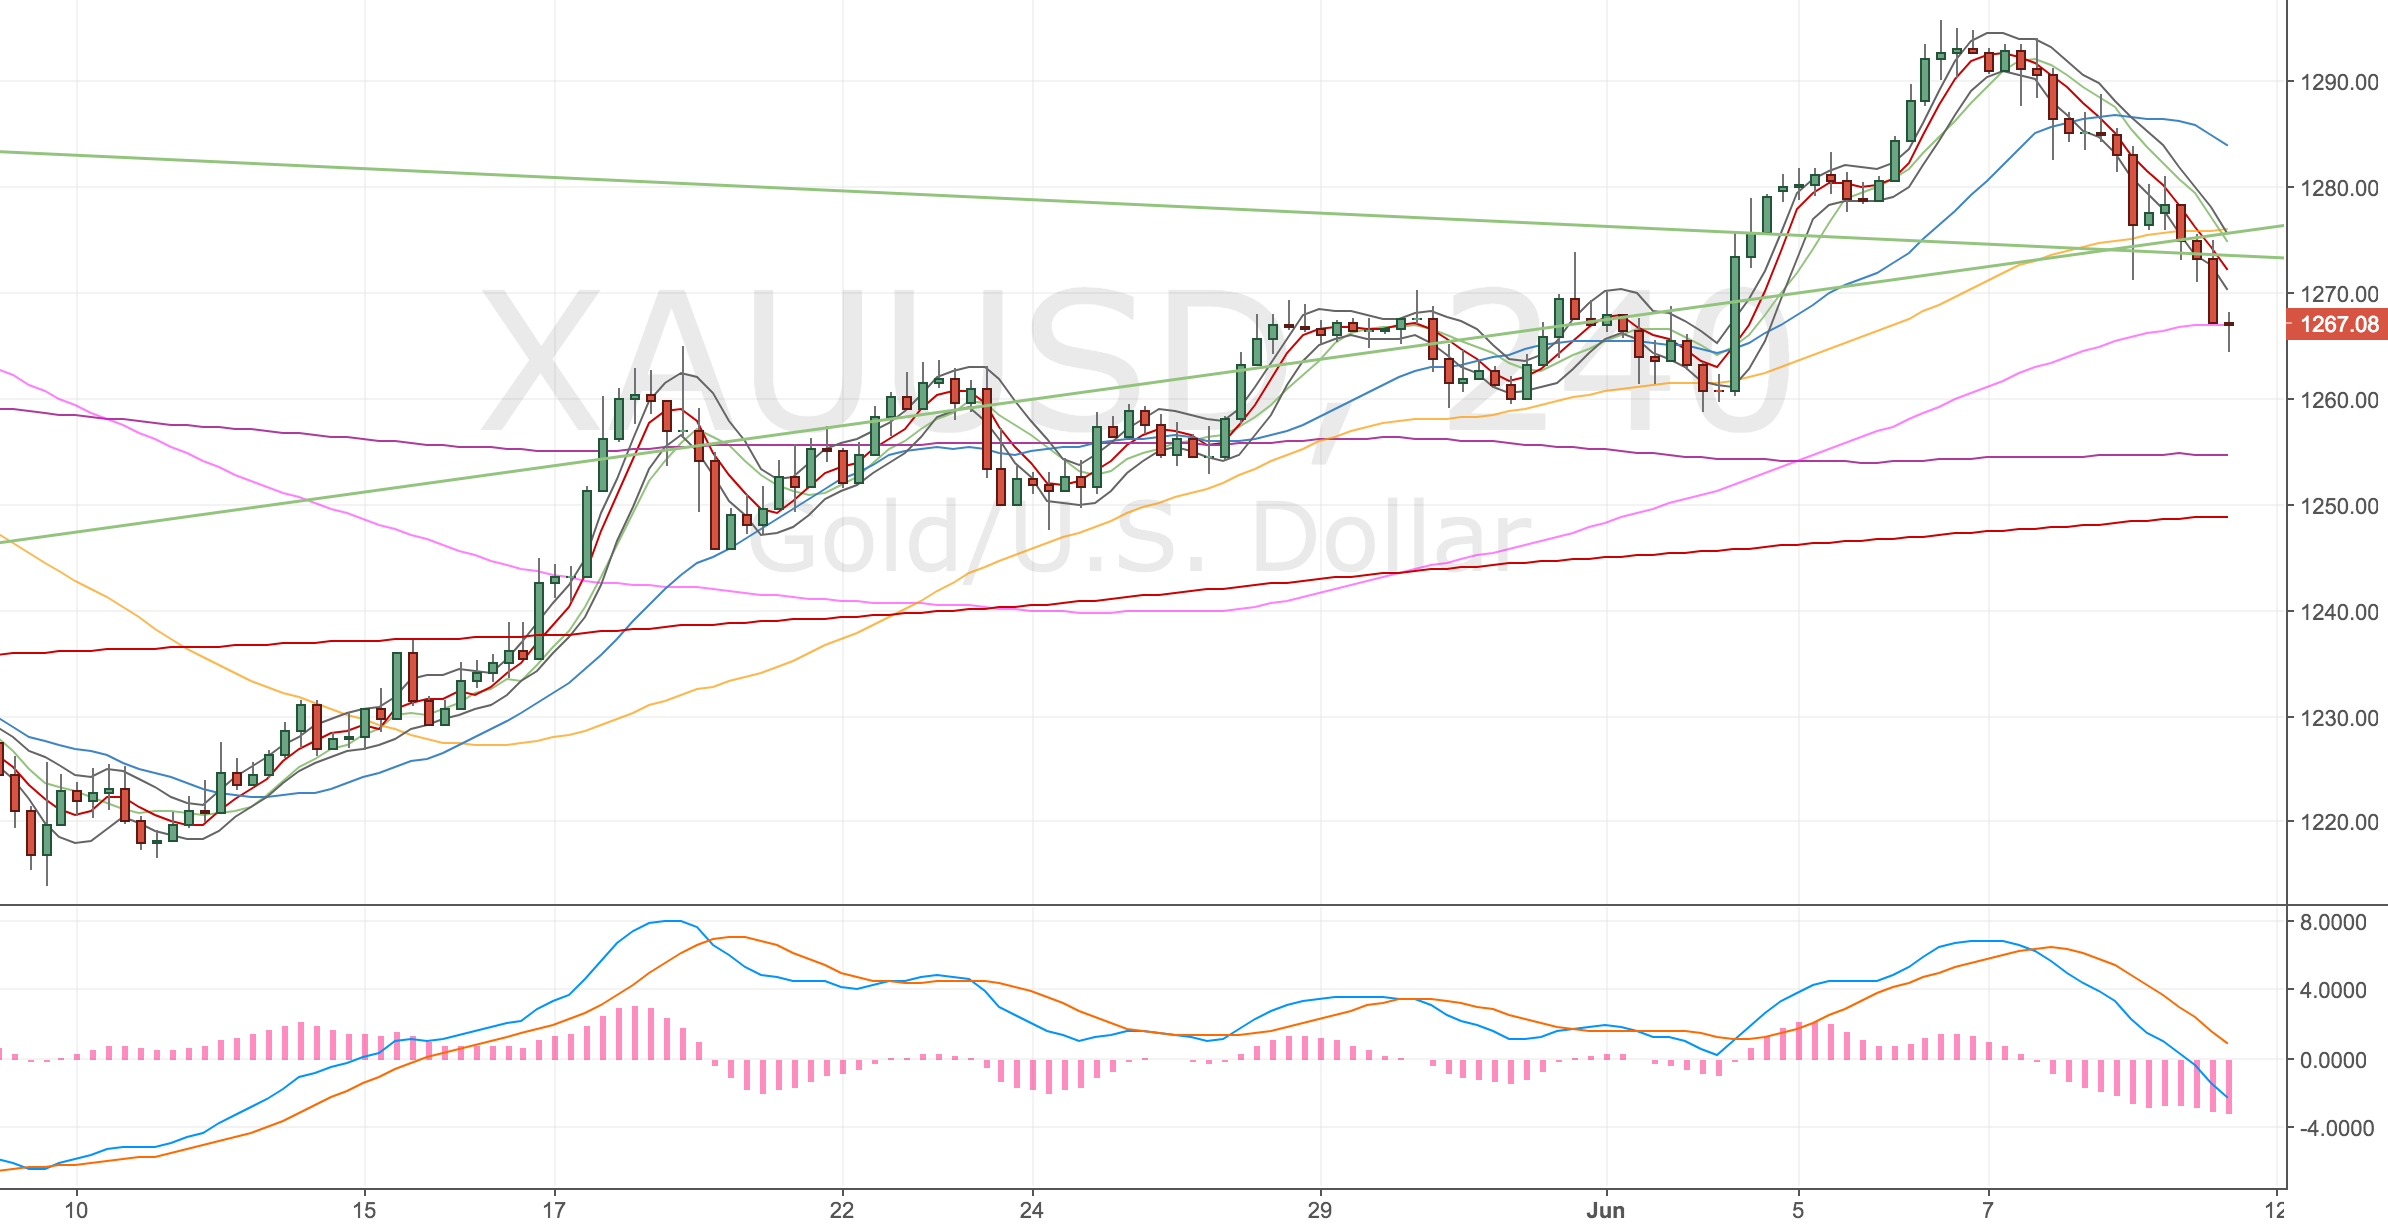
Weekly Chart
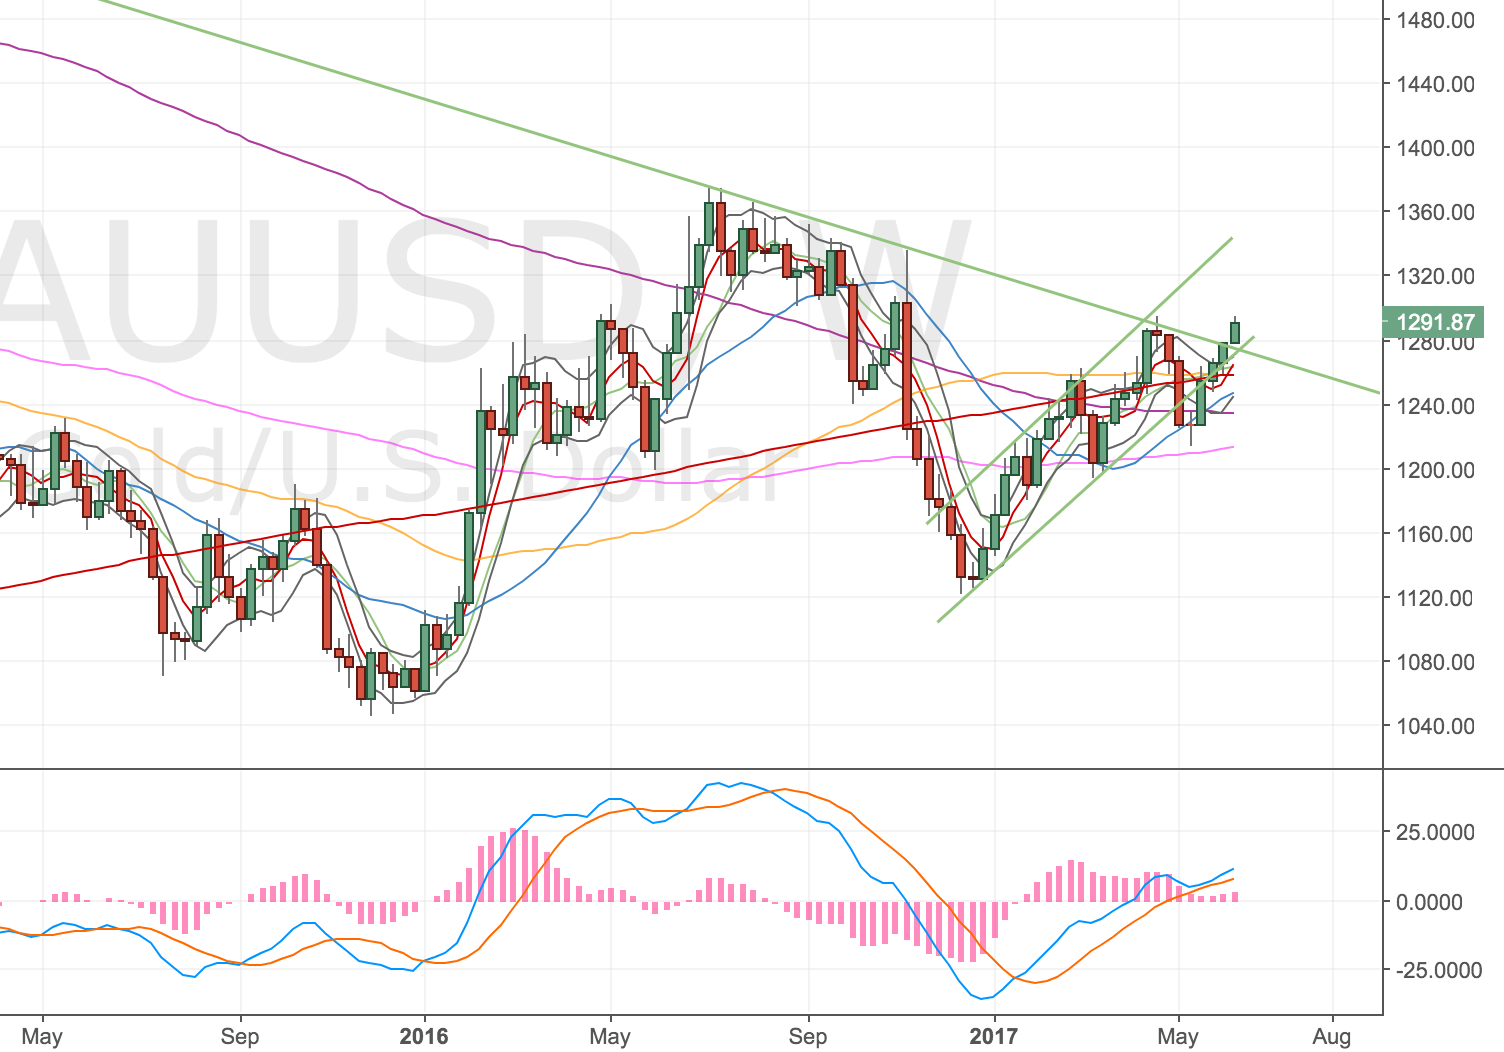
Gold weekly chart – 7 June
Similar to the chart above, I noticed a slight narrowing of the MACD and Signal lines (shown by the histogram divergence). I expect the price to come lower and react to this.
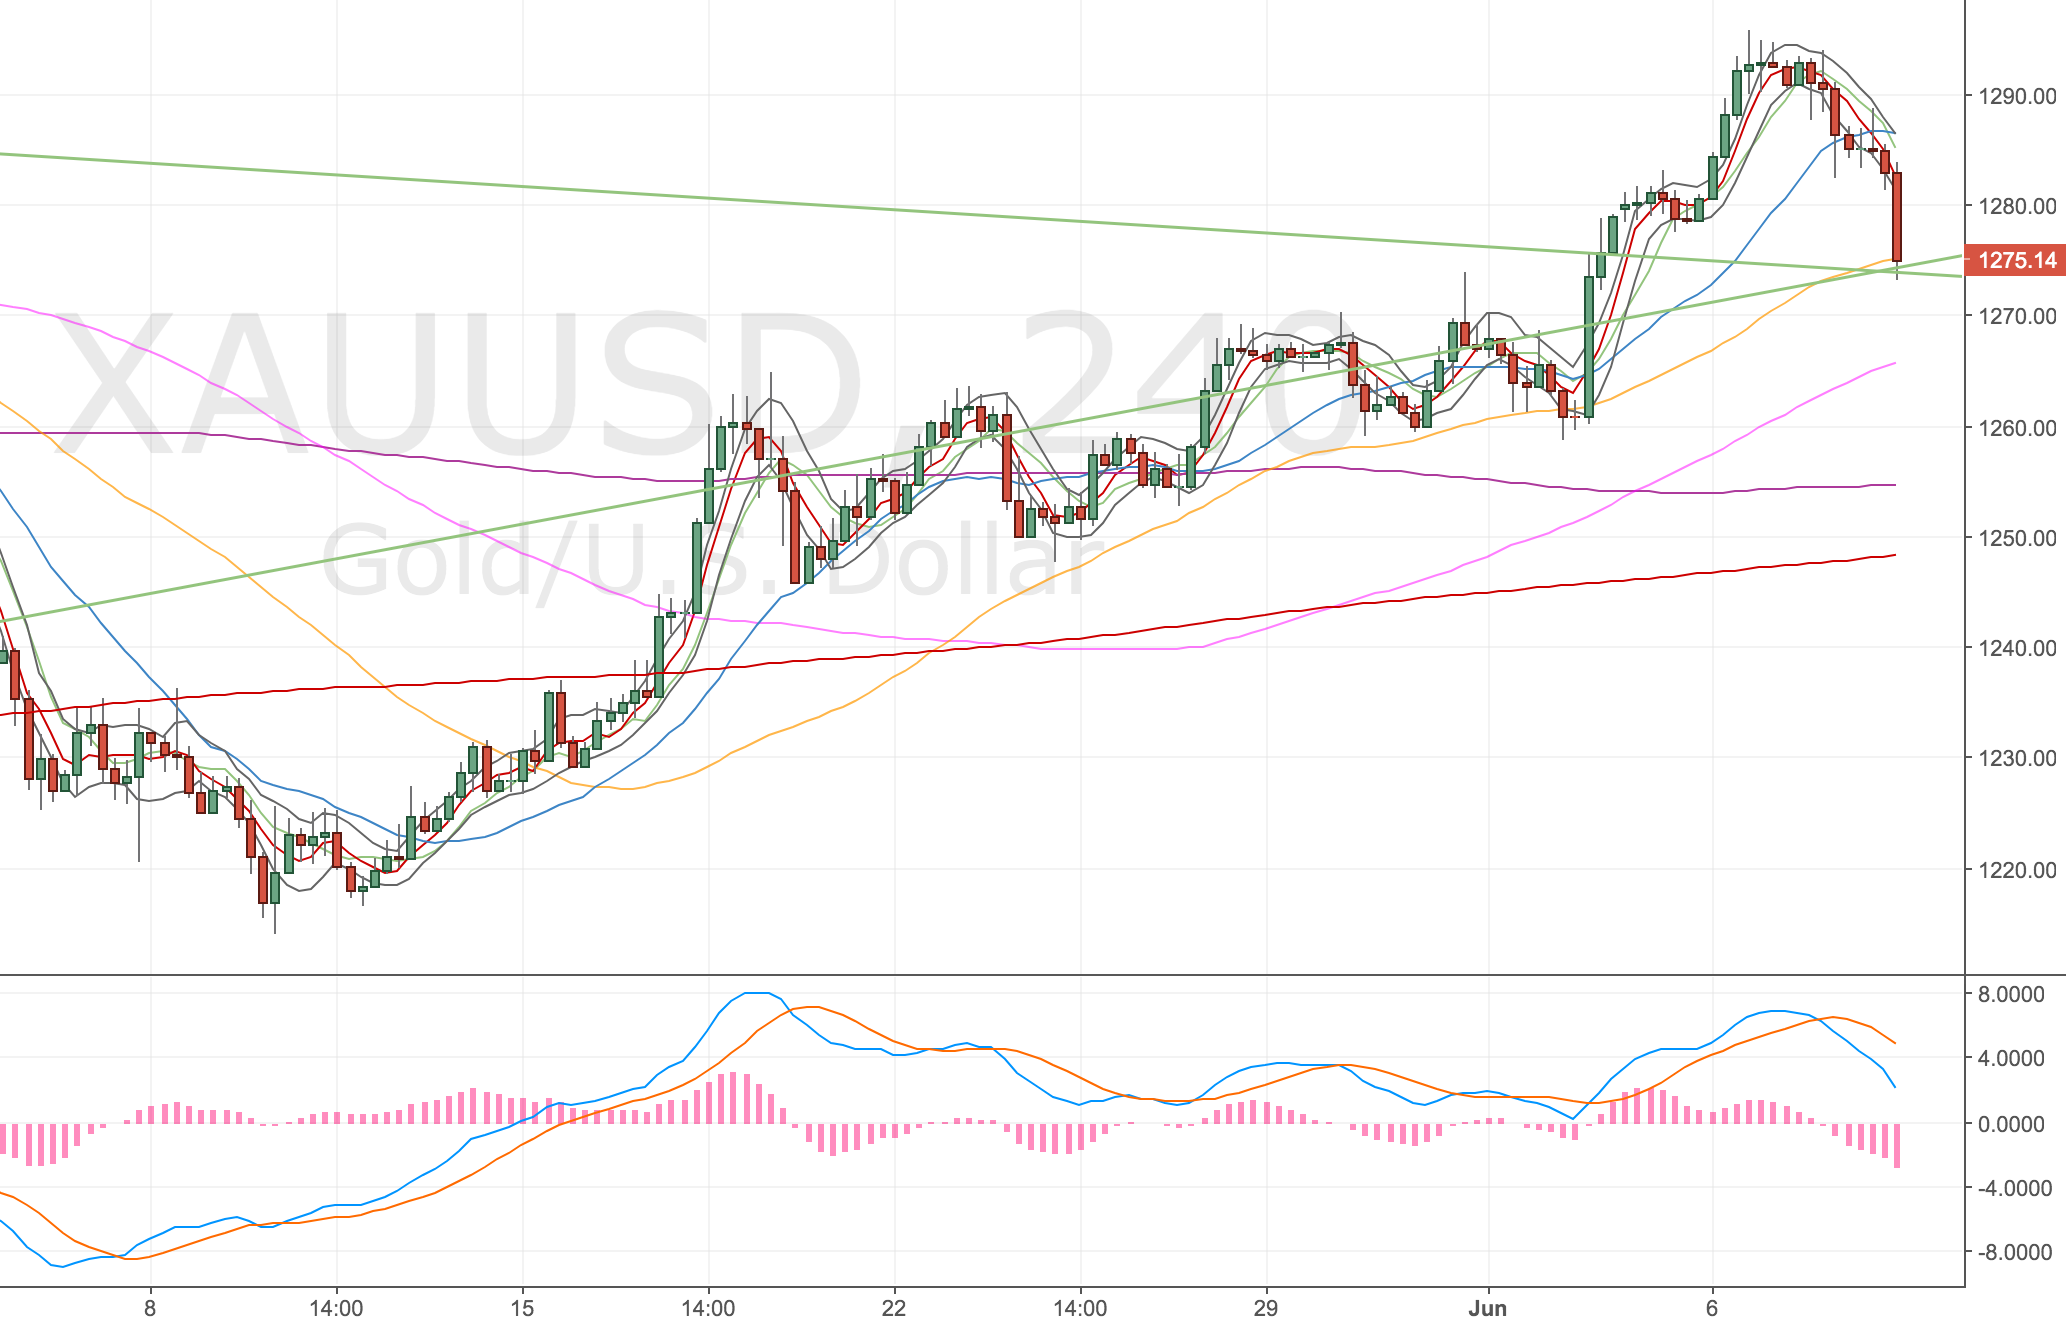
Daily Chart
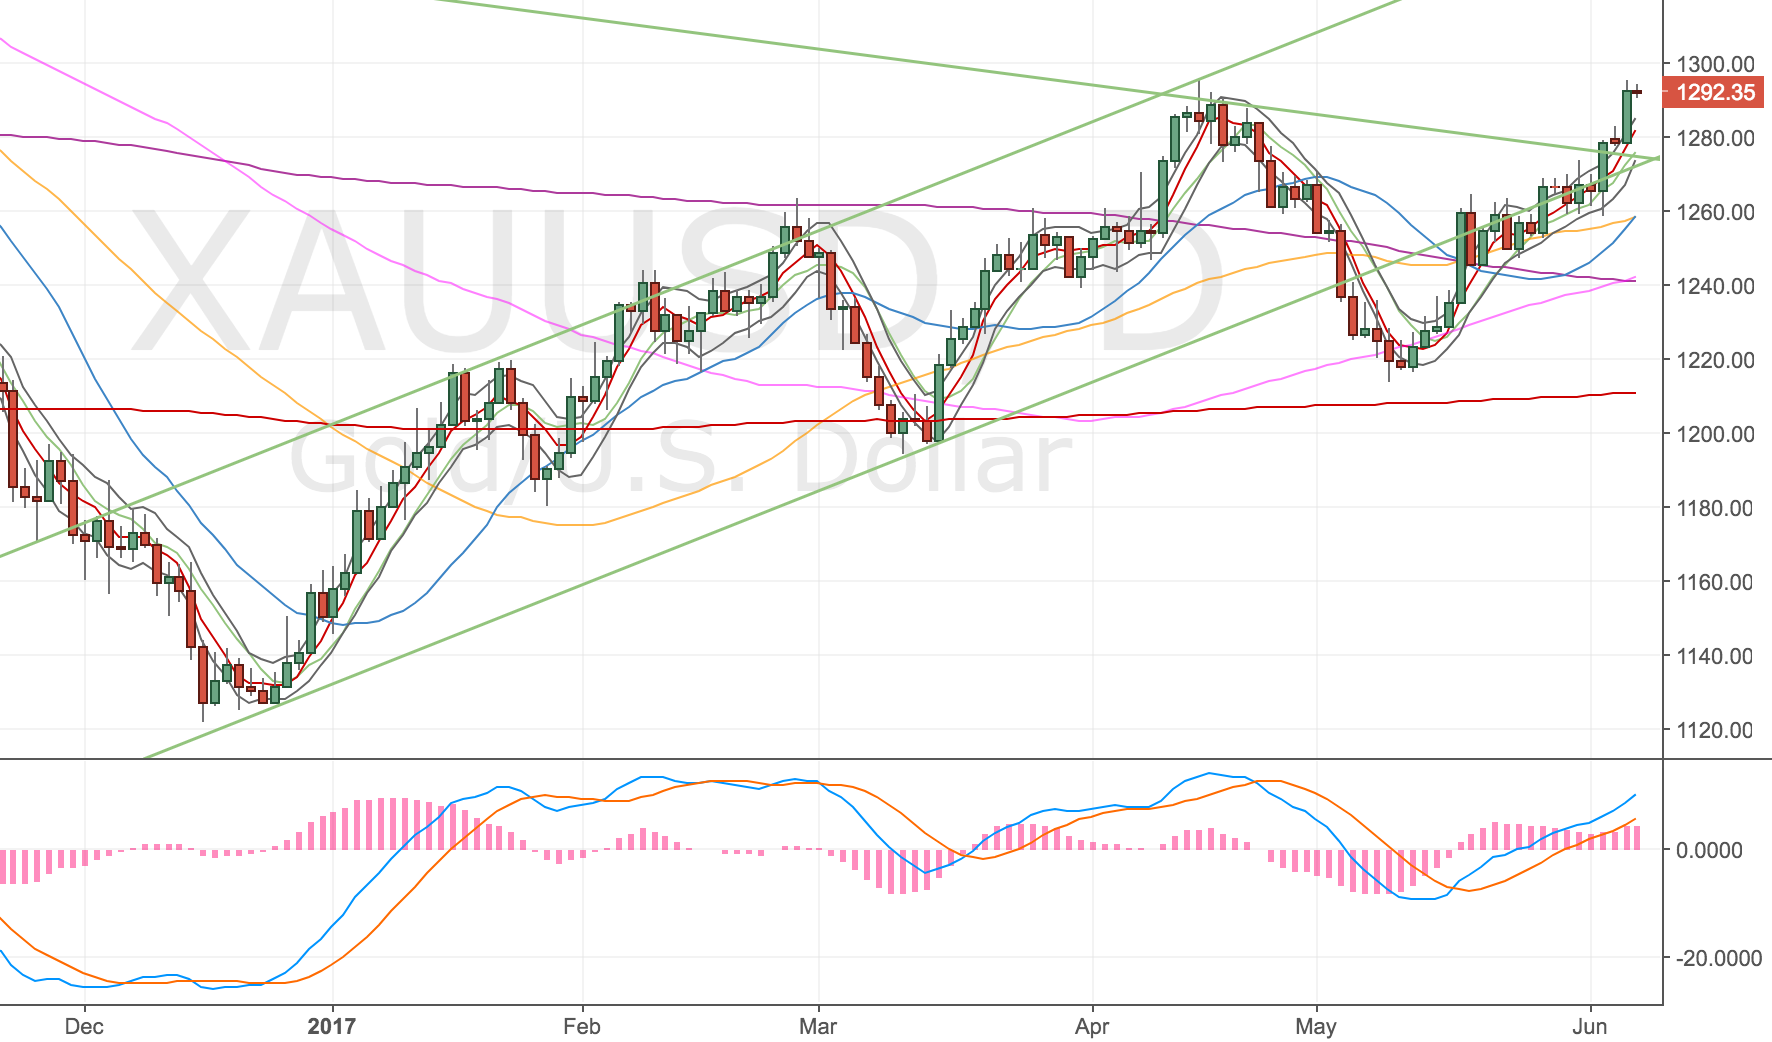
Gold Daily Chart – 7 June
Although we’ve broken my trend line – I drew it so I don’t put too much emphasis on it! If price comes down into the bands, we’ll have a daily divergence adding conviction to my trade. The MAs are all getting into order so I don’t imagine we’ll get much of a pull back. Maybe to 1240.
Hourly Chart
Gold Hourly Chart – 7 June
The hourly chart shows a divergence and potentially a double divergence forming. I’m late to this divergence but I’ve got a level here that I would’ve got at the time so I’m taking the trade. Price might go a little higher, I’m prepared for it, just hope I can get back in, unlike my FTSE trade.
Woohoo another winner – 8 June
It’s great to bank another winner so close to my last one and it’s a decent size too. The trade was not perfectly managed though. I was late to update my limit order (I was trading the 4h50) and when I saw price coming down to 50 I was frantically logging in to update my order (not great).
I was actually intending to move it lower (as the daily divergence has now confirmed) but I didn’t get there in time and the order was closed @ 1273.5. Still, pleased with the trade, it’s a 4.5x RR trade 🙂
Here’s the chart. I may be very lucky to have got out where I did. Although price has moved a long way from the bands so might be good for a run?
Gold 4H Chart – 8 June
Will I get the daily short? – 9 June
Price has paused at my exit level before heading lower. I thought I might not get my daily entry (even though the chart shows the 5ma touch – I don’t think it would’ve until the candle close pulled the MA down). Not sure what’ll happen next but I’ll keep watching it.
4H Chart
Gold 4H Chart – 9 June
Daily Chart
Gold Daily Chart – 9 June
It makes me feel nervous to be trading around a breakout zone. Probably means I should be more confident?