Starting balance: £6,967.51
Target return: £243.86 (3.5%)
Actual return: £115.85 (1.66%)
Win rate: 100%
Closing balance: £7,083.29
Not a great month for me, the stats above look OK but I only took two trades and they just happened to both win. The renovations and routine are again my two biggest blockers to trading. When work is busy and the house renovations are still on-going, I find it very difficult to fit everything in.
I also took some holiday and missed some class set-ups on my birthday.
August’s Goals
Here are the goals I set myself at the start of the month.
- Maintain a 40% win rate – Success
- Do at least one daily scan – Miss
- Log all my missed trades with reasons why I didn’t take them – Miss
- Up my position size to 0.75% – Success, although in the end I just upped it by £10.
Daily performance
The strategy didn’t do great this month, mainly due to trending markets. I was lucky to dodge these set ups.
| All Signals | Win Loss % | Signals Taken | Win Loss % | |
|---|---|---|---|---|
| Winners | 1 | 100% | 0 | 0% |
| Losers | 0 | 0% | 0 | 0% |
| Still live | 0 | 0% | 0 | 0% |
| Missed | 0 | 0% | 0 | 0% |
| Total Pips | 192 | - | 0 | - |
4H performance
Not a great set of figures for the strategy or me, but I did out-perform the win rate!
| All signals | Win Loss % | Conf. signals | Win Loss % | Signals Taken | Win Loss % | |
|---|---|---|---|---|---|---|
| Winners | 22 | 46.8% | 20 | 52.6% | 2 | 100% |
| Losers | 25 | 53.2% | 18 | 47.4% | 0 | 0% |
| Still live | 0 | 0% | 0 | 0% | 0 | 0% |
| Missed | 0 | 0% | 0 | 0% | 0 | 0% |
| Total Pips | 1,012 | - | 1,031 | - | 111 | - |
August trade log
| # | Date | Stgy | Mkt | Pos | Acc Rsk | Open | Stop | Stp Pips | Tgt | Tgt Pips | R:R | Close | Fnl Pips | Fnl R:R | Days | P&L (£) |
|---|---|---|---|---|---|---|---|---|---|---|---|---|---|---|---|---|
| 1 | 24 Aug 17 | DST | NZDUSD | Long | 0.75% | 0.7218 | 0.7185 | 33 | 0.7279 | 61 | 2 | 0.7288 | 70 | 2.1 | 6 | 86.23 |
| 2 | 03 Aug 17 | DST | EURUSD | Short | 0.45% | 1.1868 | 1.1916 | 48 | 1.1645 | 243 | 5 | 1.1827 | 41 | 0.85 | 23 | 29.62 |
Miss of the month – US Oil
Hindsight is such a great thing, I noticed this US Oil trade during my September scans, it’s not A grade but it was a decent set up and oil can really move so it would’ve been worth trading IMO.
4H Divergence Chart
I noticed the divergence was forming on a trendline which I had recently drawn.
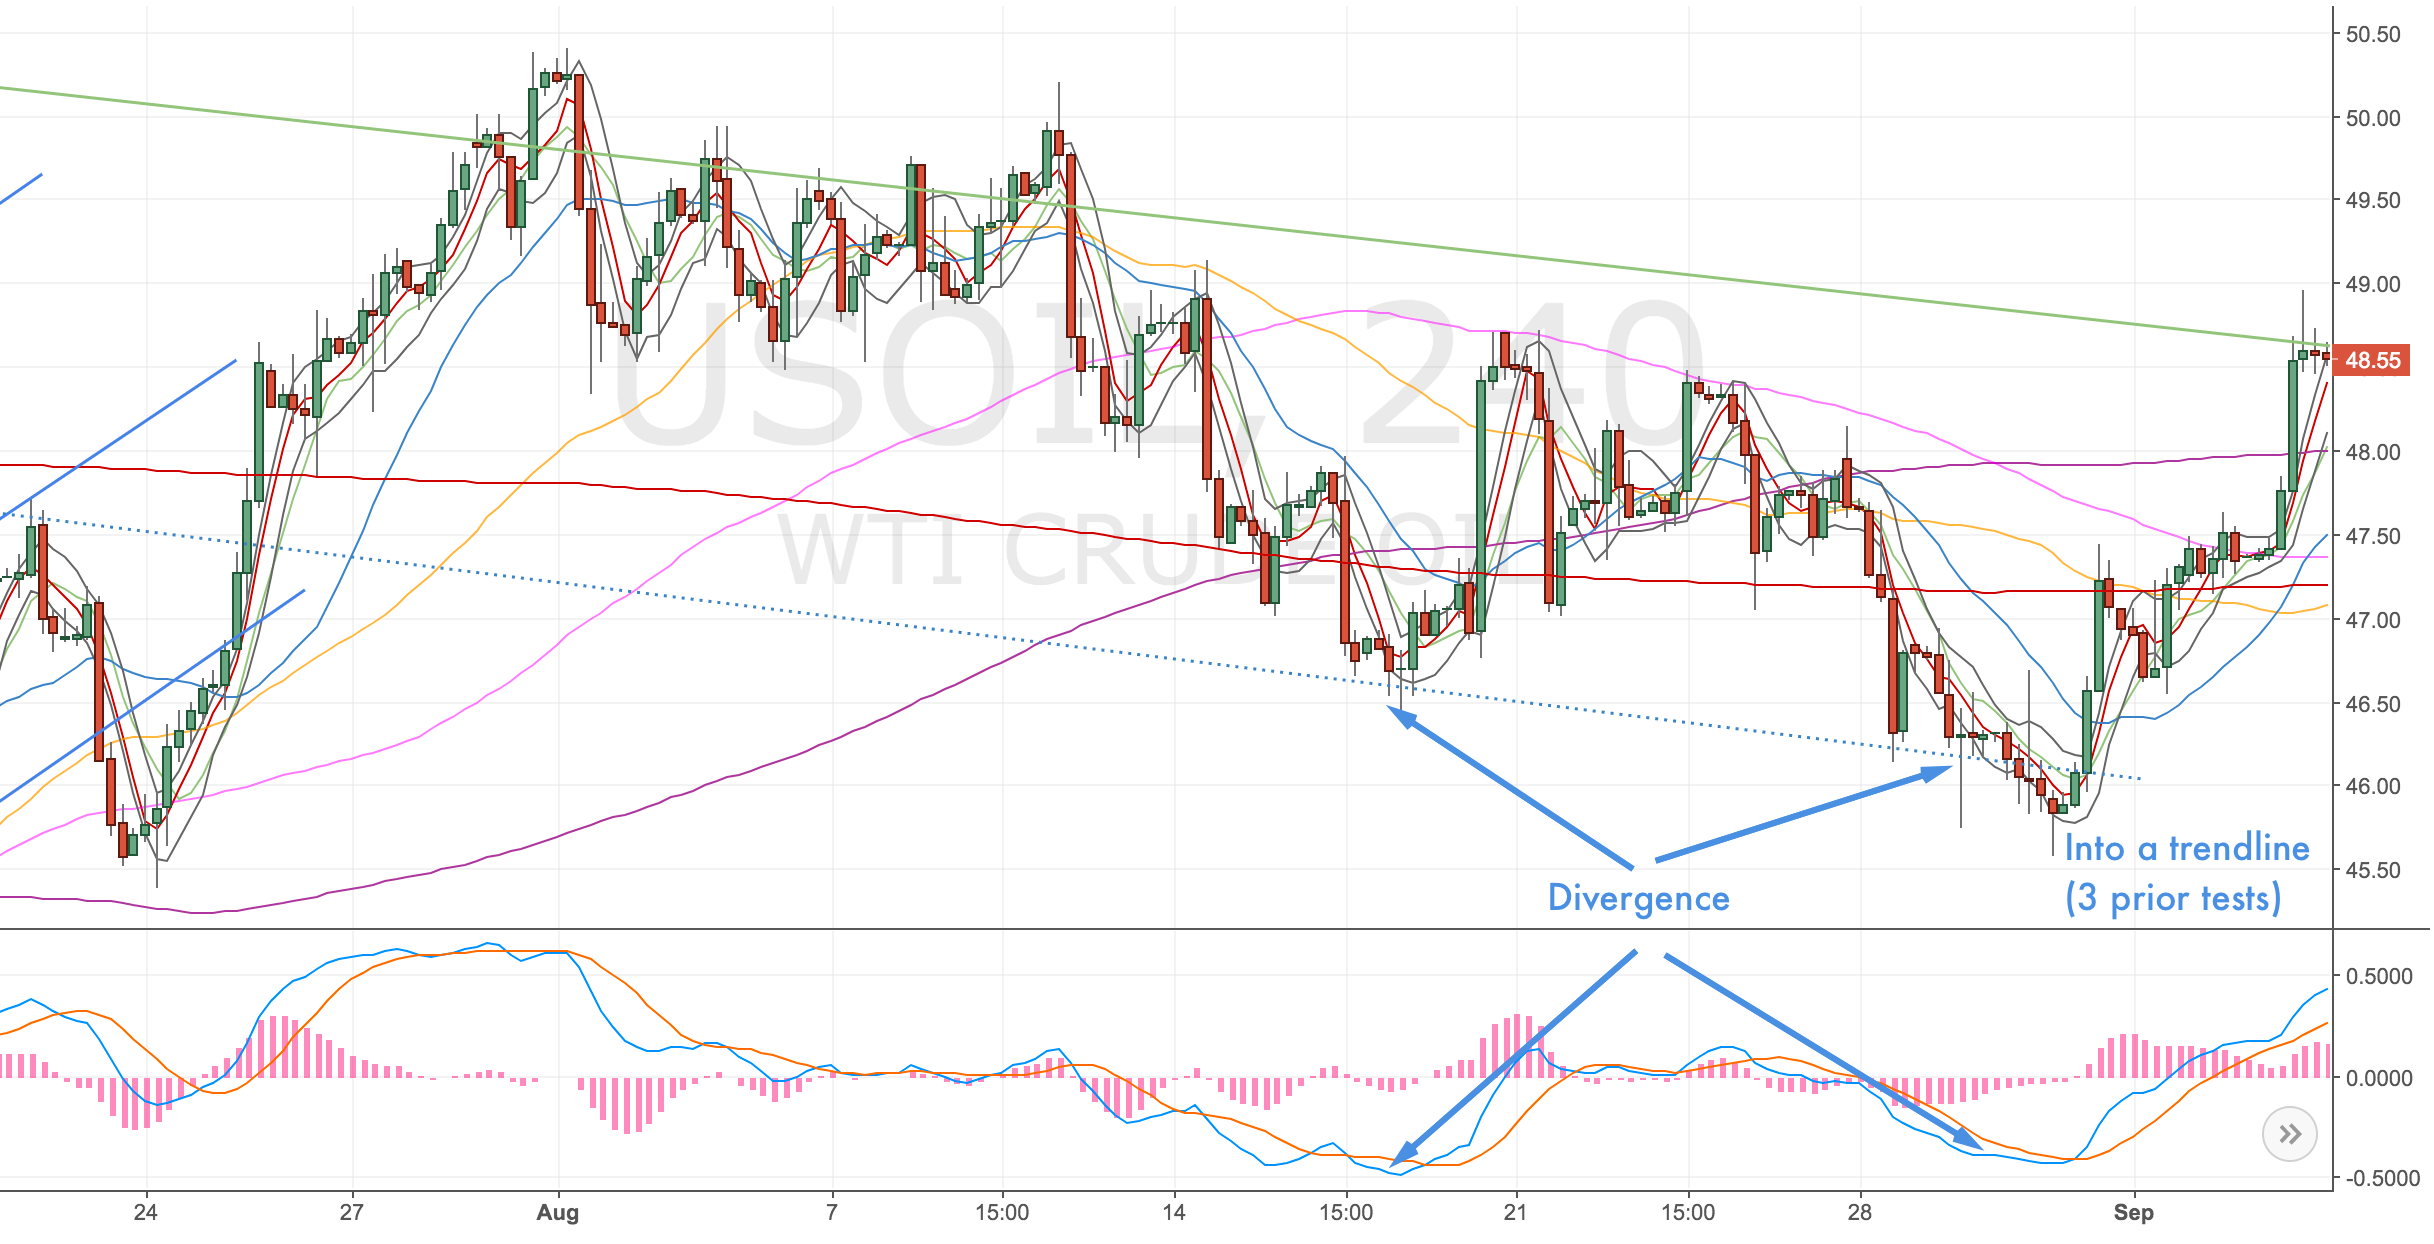
4 Hourly Oil Chart
1H Confirmation
A decent double divergence had formed on the hourly chart.
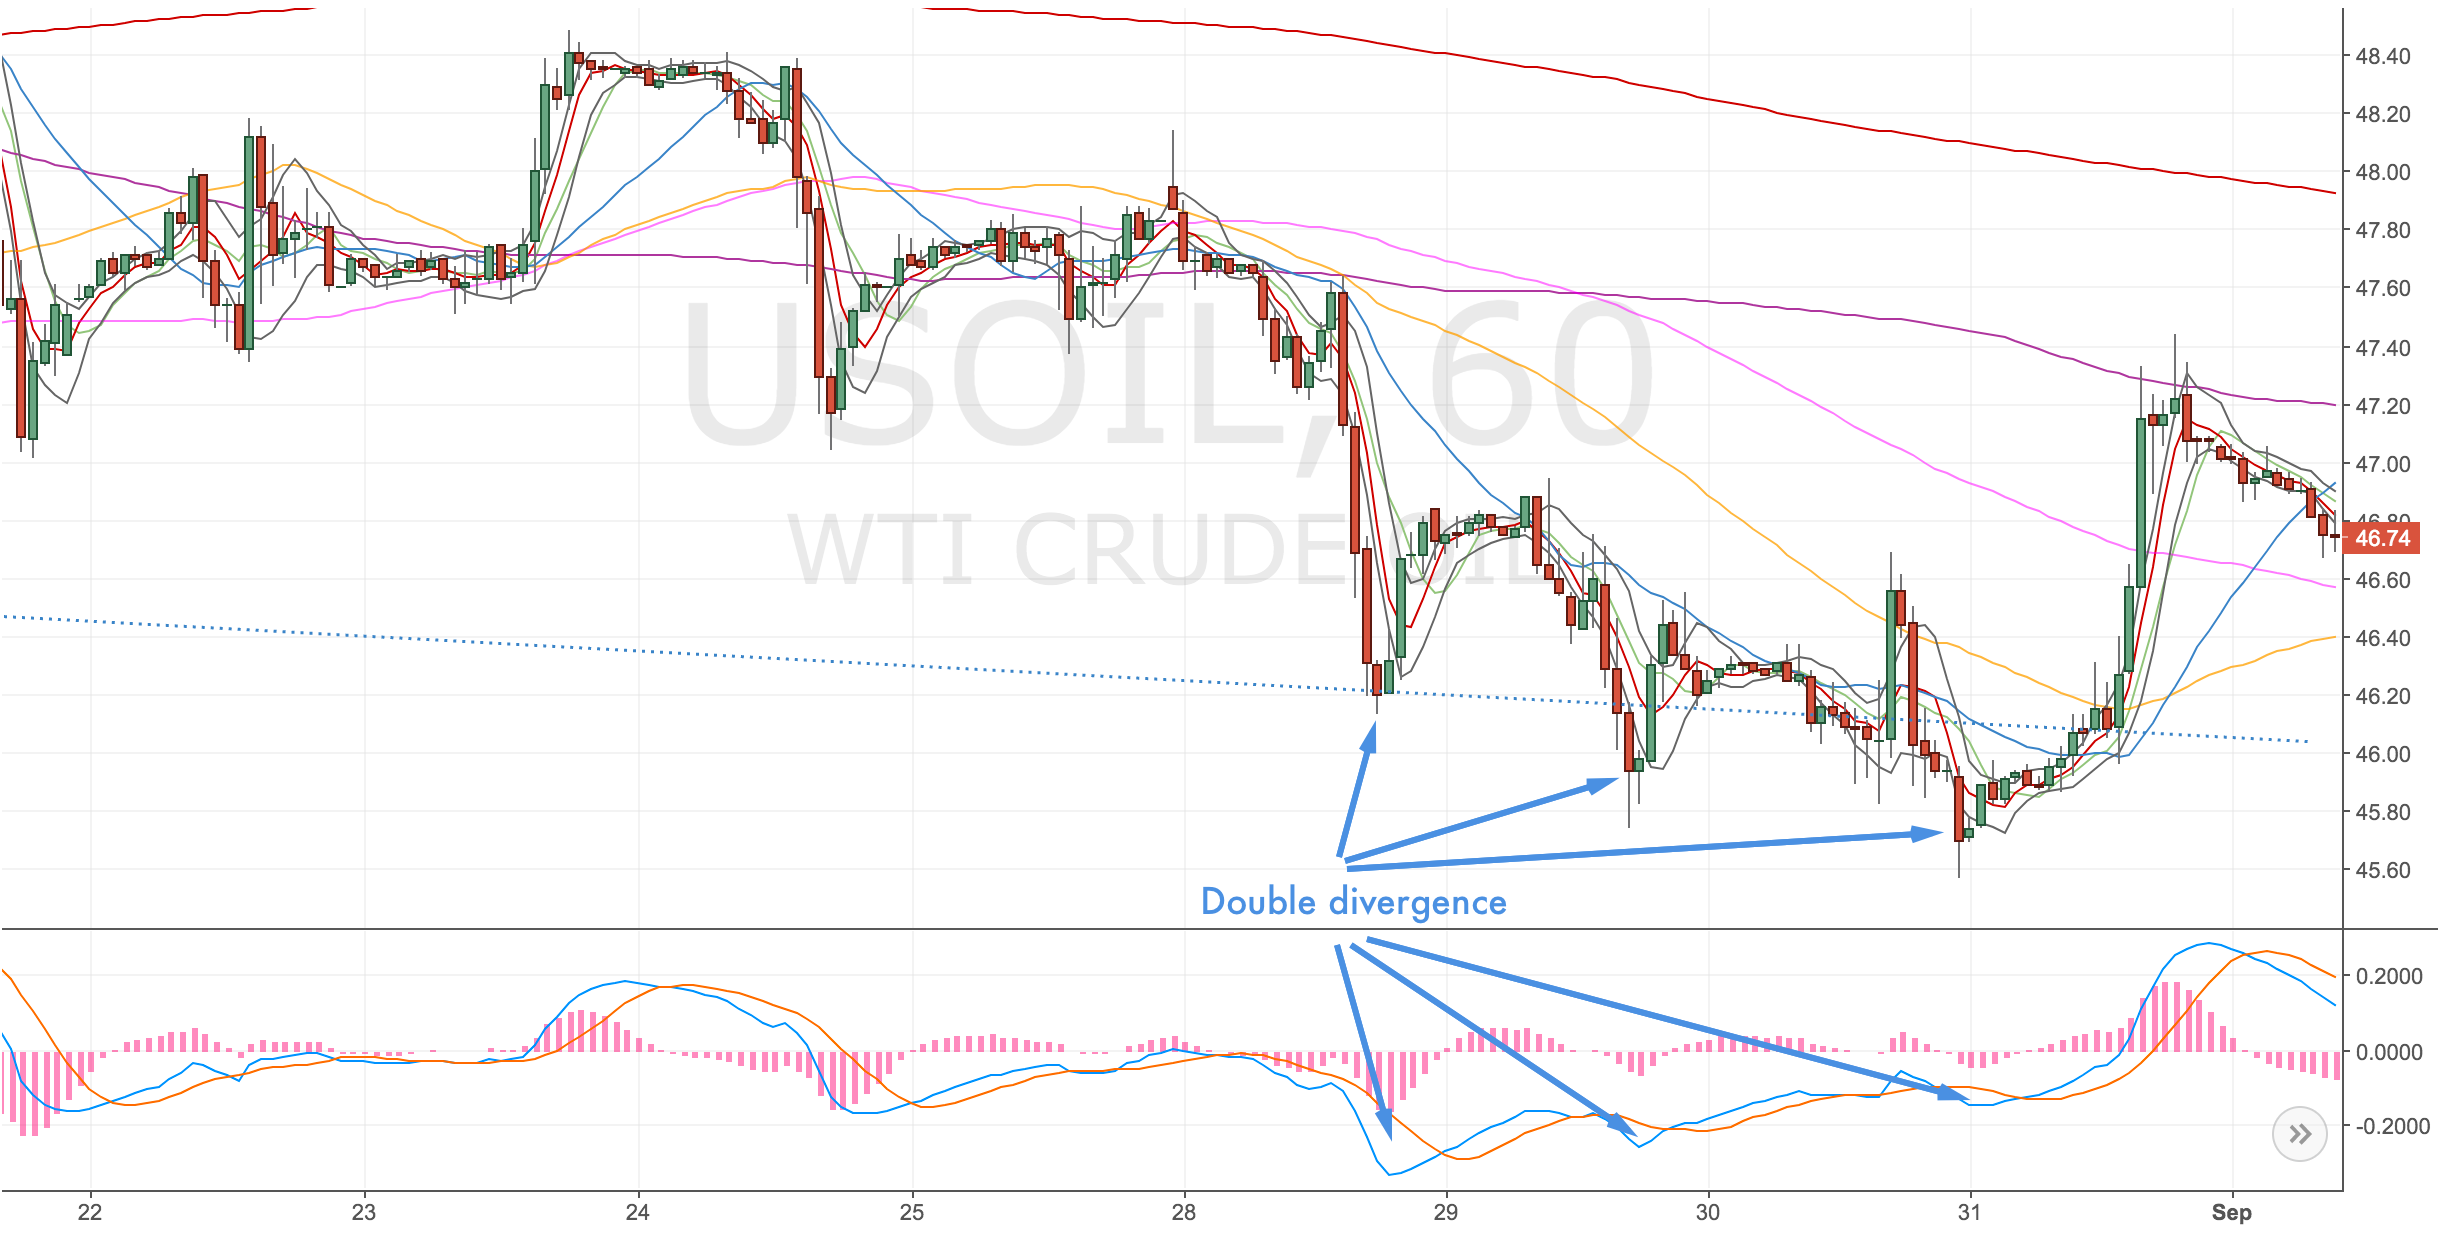
Hourly Oil Chart
Daily Chart
Not much on the daily chart, but I did notice the proximity to the d500 which was a case against this trade.
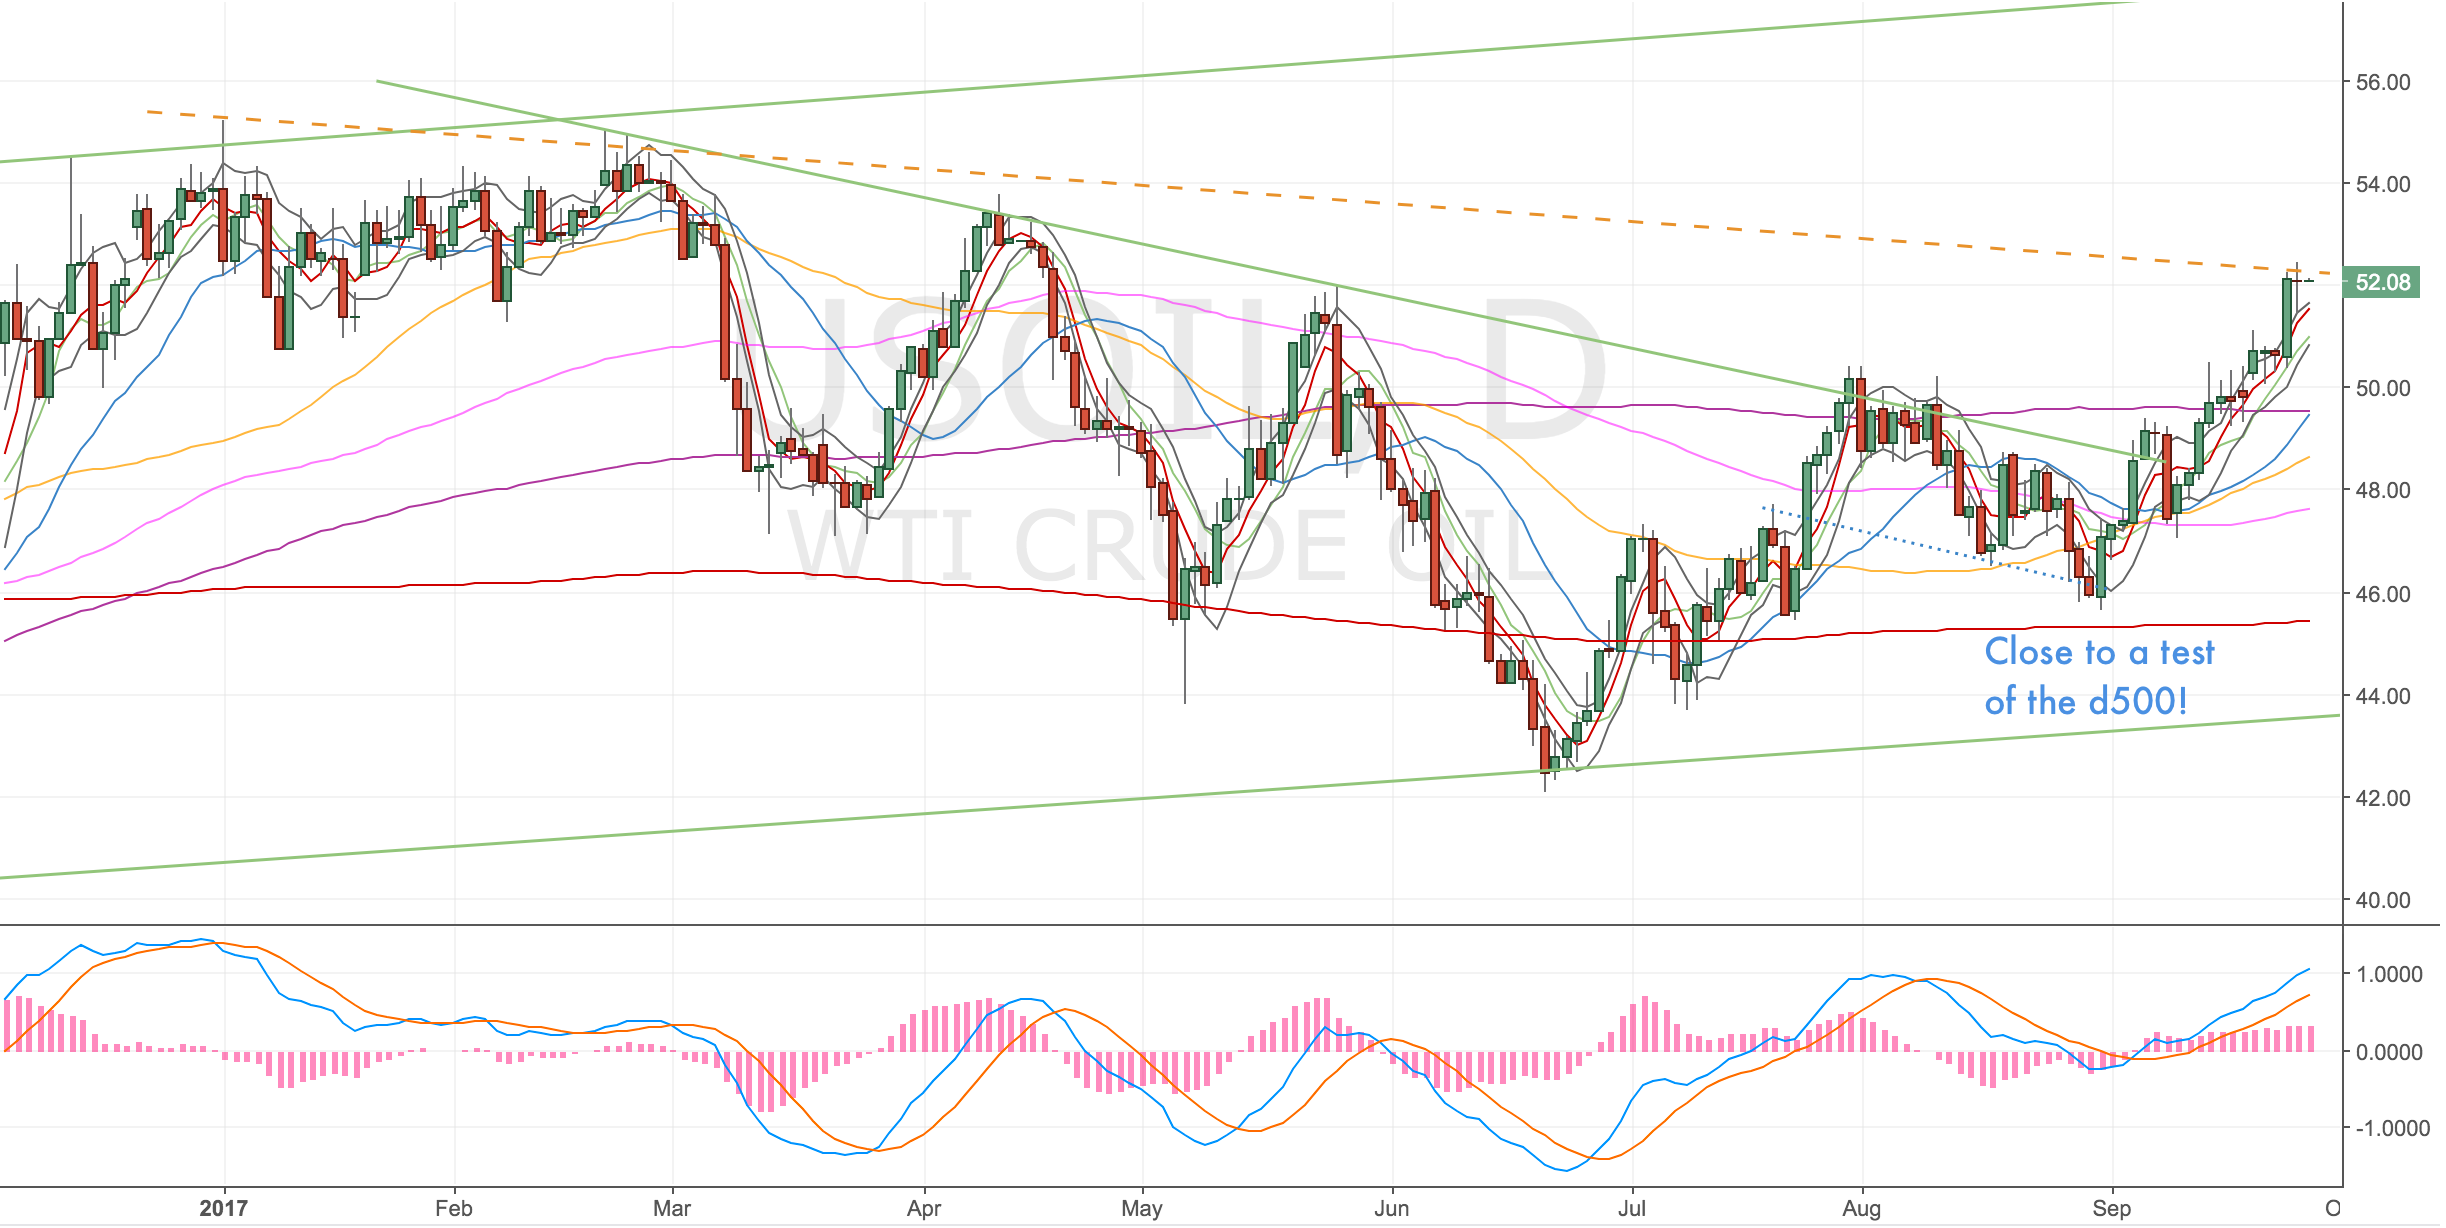
Daily Oil Chart
Weekly Chart
The prior weeks leading up to this trade were all doji type bars, indicating a move higher. We were also handrailing the green trendline.
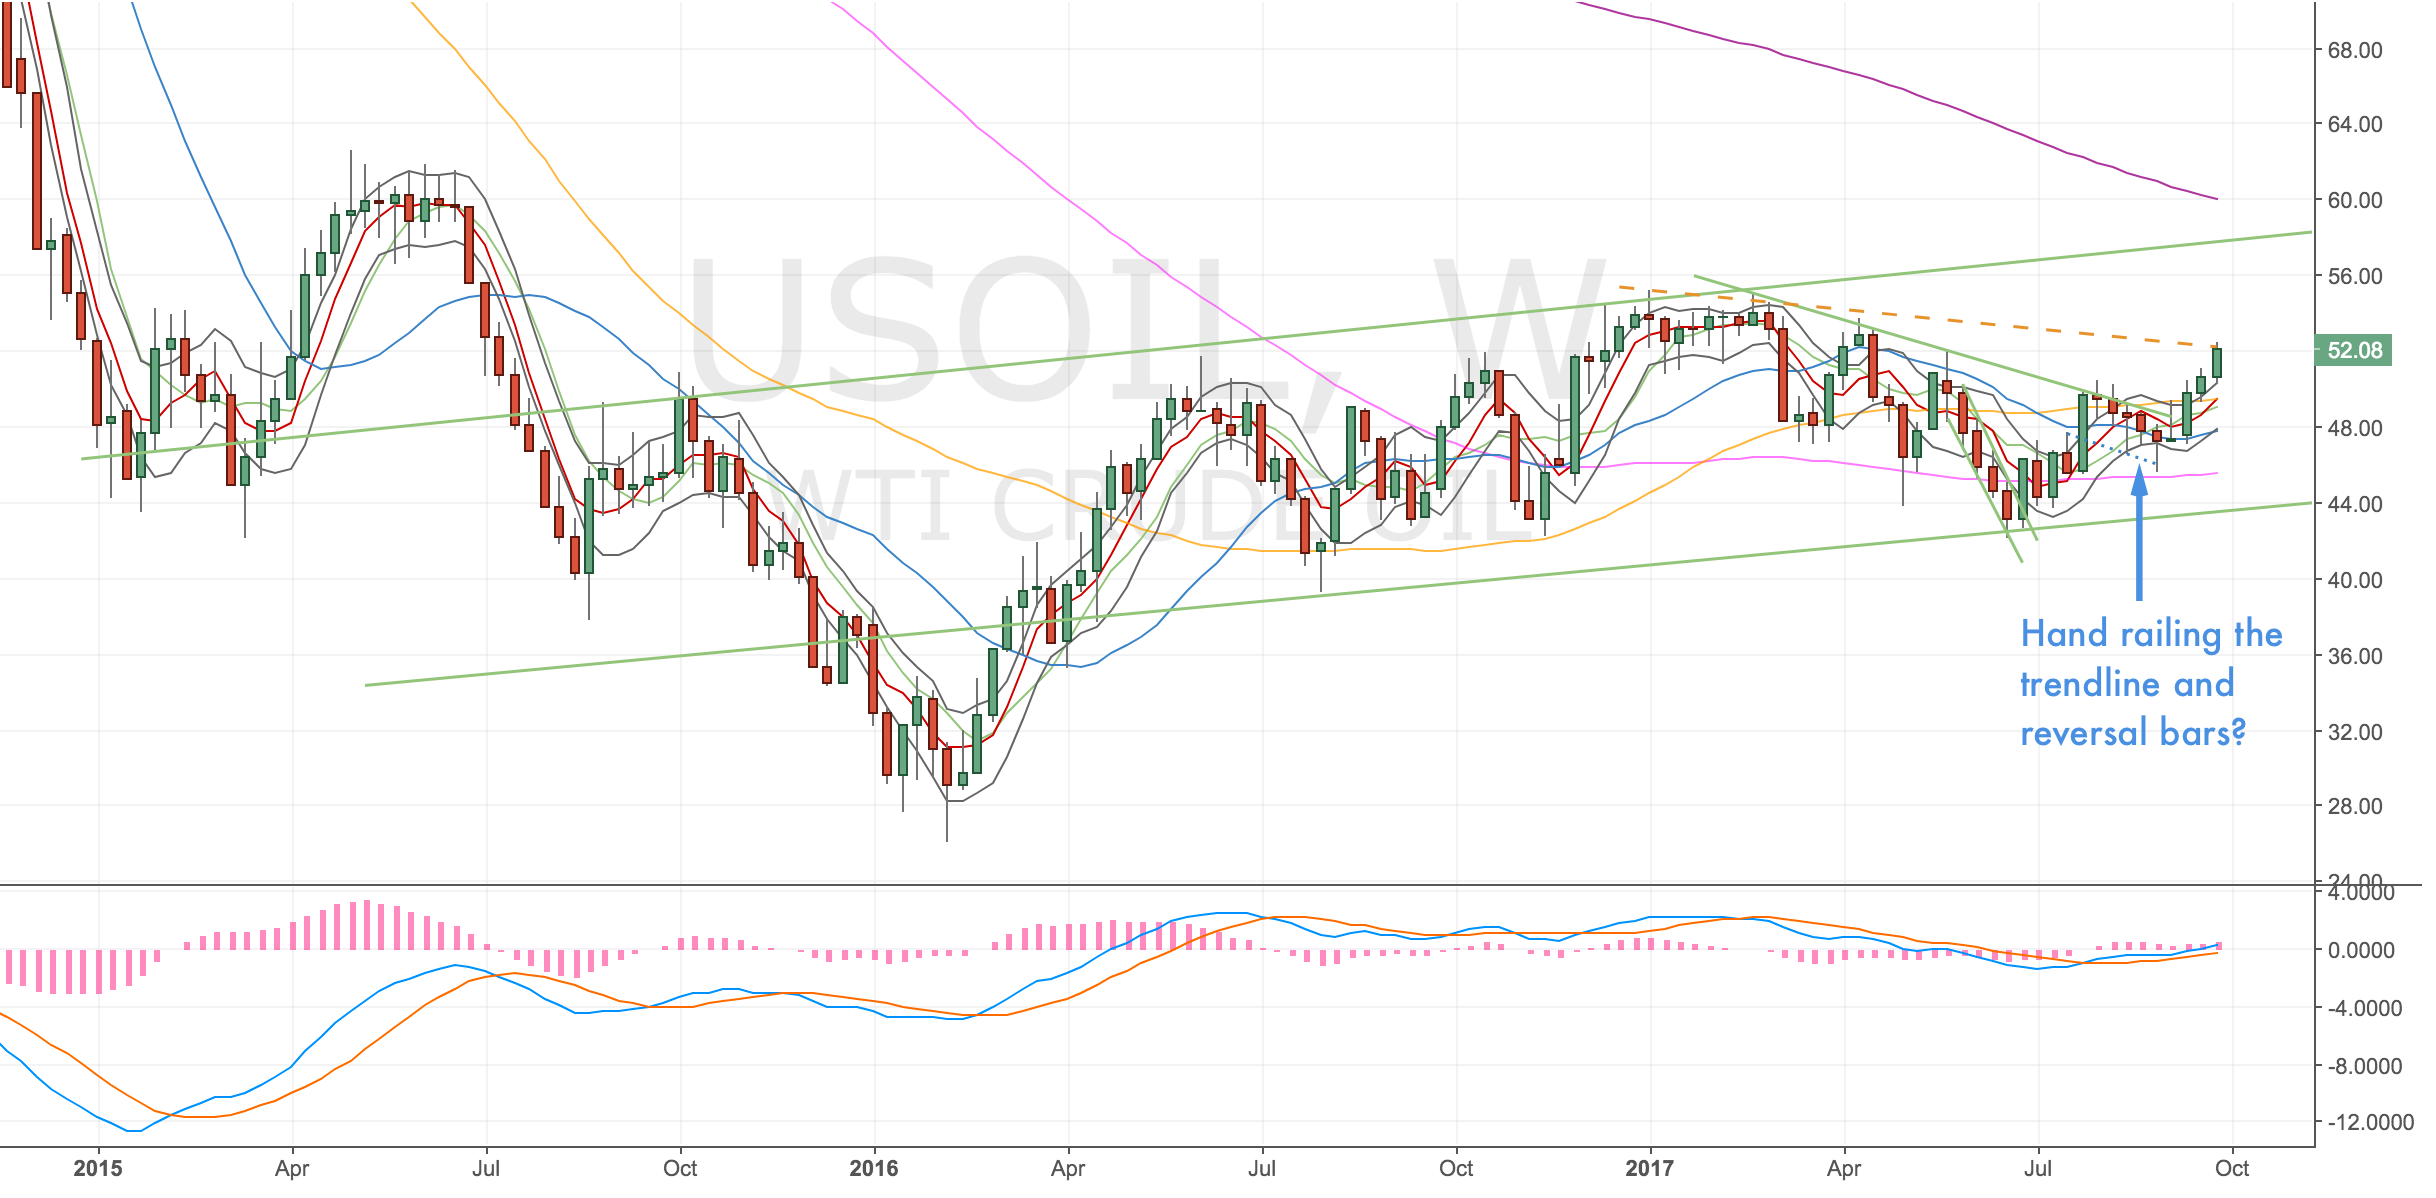
Weekly Oil Chart
Would’ve been a good trade to run to the 4h200 & d200.
New goals
- Maintain a 40% win rate
- Do at least one scan every trading day
- Log all my missed trades with reasons why I didn’t take them