Acc Risk: 0.5%
Short: 88.77
Stop: 89.39 (62 pips)
Target: 84.60 (418 pips, d500, 6.74x RR)
Mindset: Like the entry – other JPY pairs may have started to turn?
Updates
Still here waiting – 20 Jul
Stopped out – 25 Jul
Got another set up – 28 Jul
Trade worked out but still tinkered with it – 3 Aug
Checking in with the trade afterwards – 11 Aug
Been watching the JPY pairs for a while now, looking for short set ups. I’ve not been tied to which JPY pair I’d short but so far I missed the EURJPY set up – that went over night – and I didn’t spot the USDJPY set up as it was during my work hours.
Not too worried though – I can still see more upside in the AUDJPY, GBPJPY and until now the CADJPY.
For this position I’ve slightly incremented my risk to the full 0.5%! I’ve decided I need to start increasing my risk, as currently, it’s much hard to hit my monthly targets.
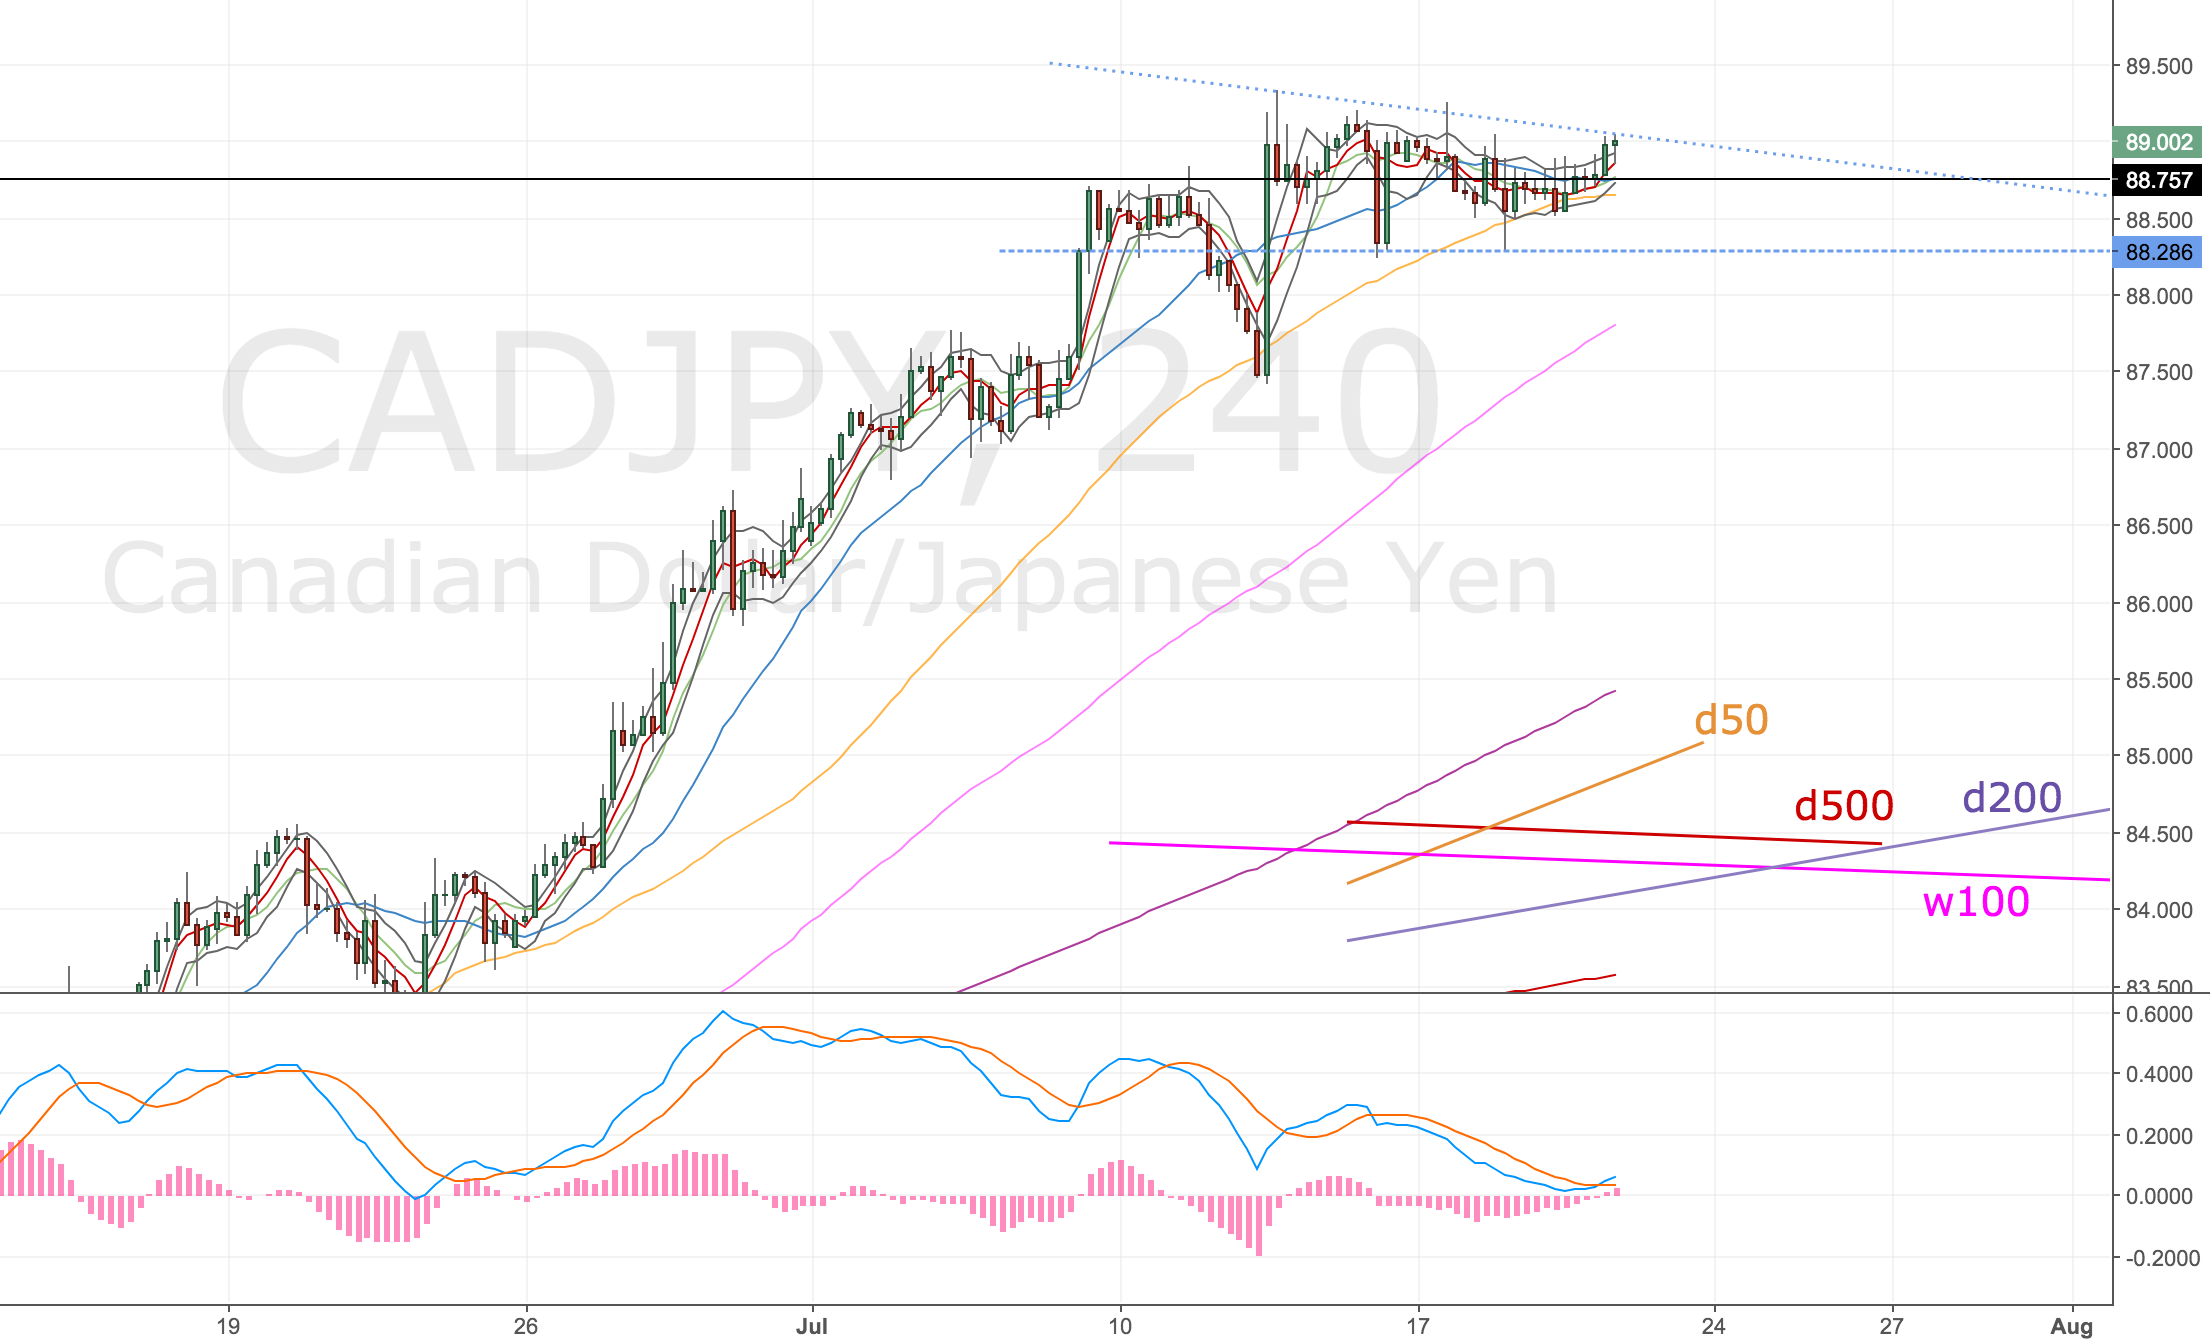
4H Chart – set up
Double divergence.
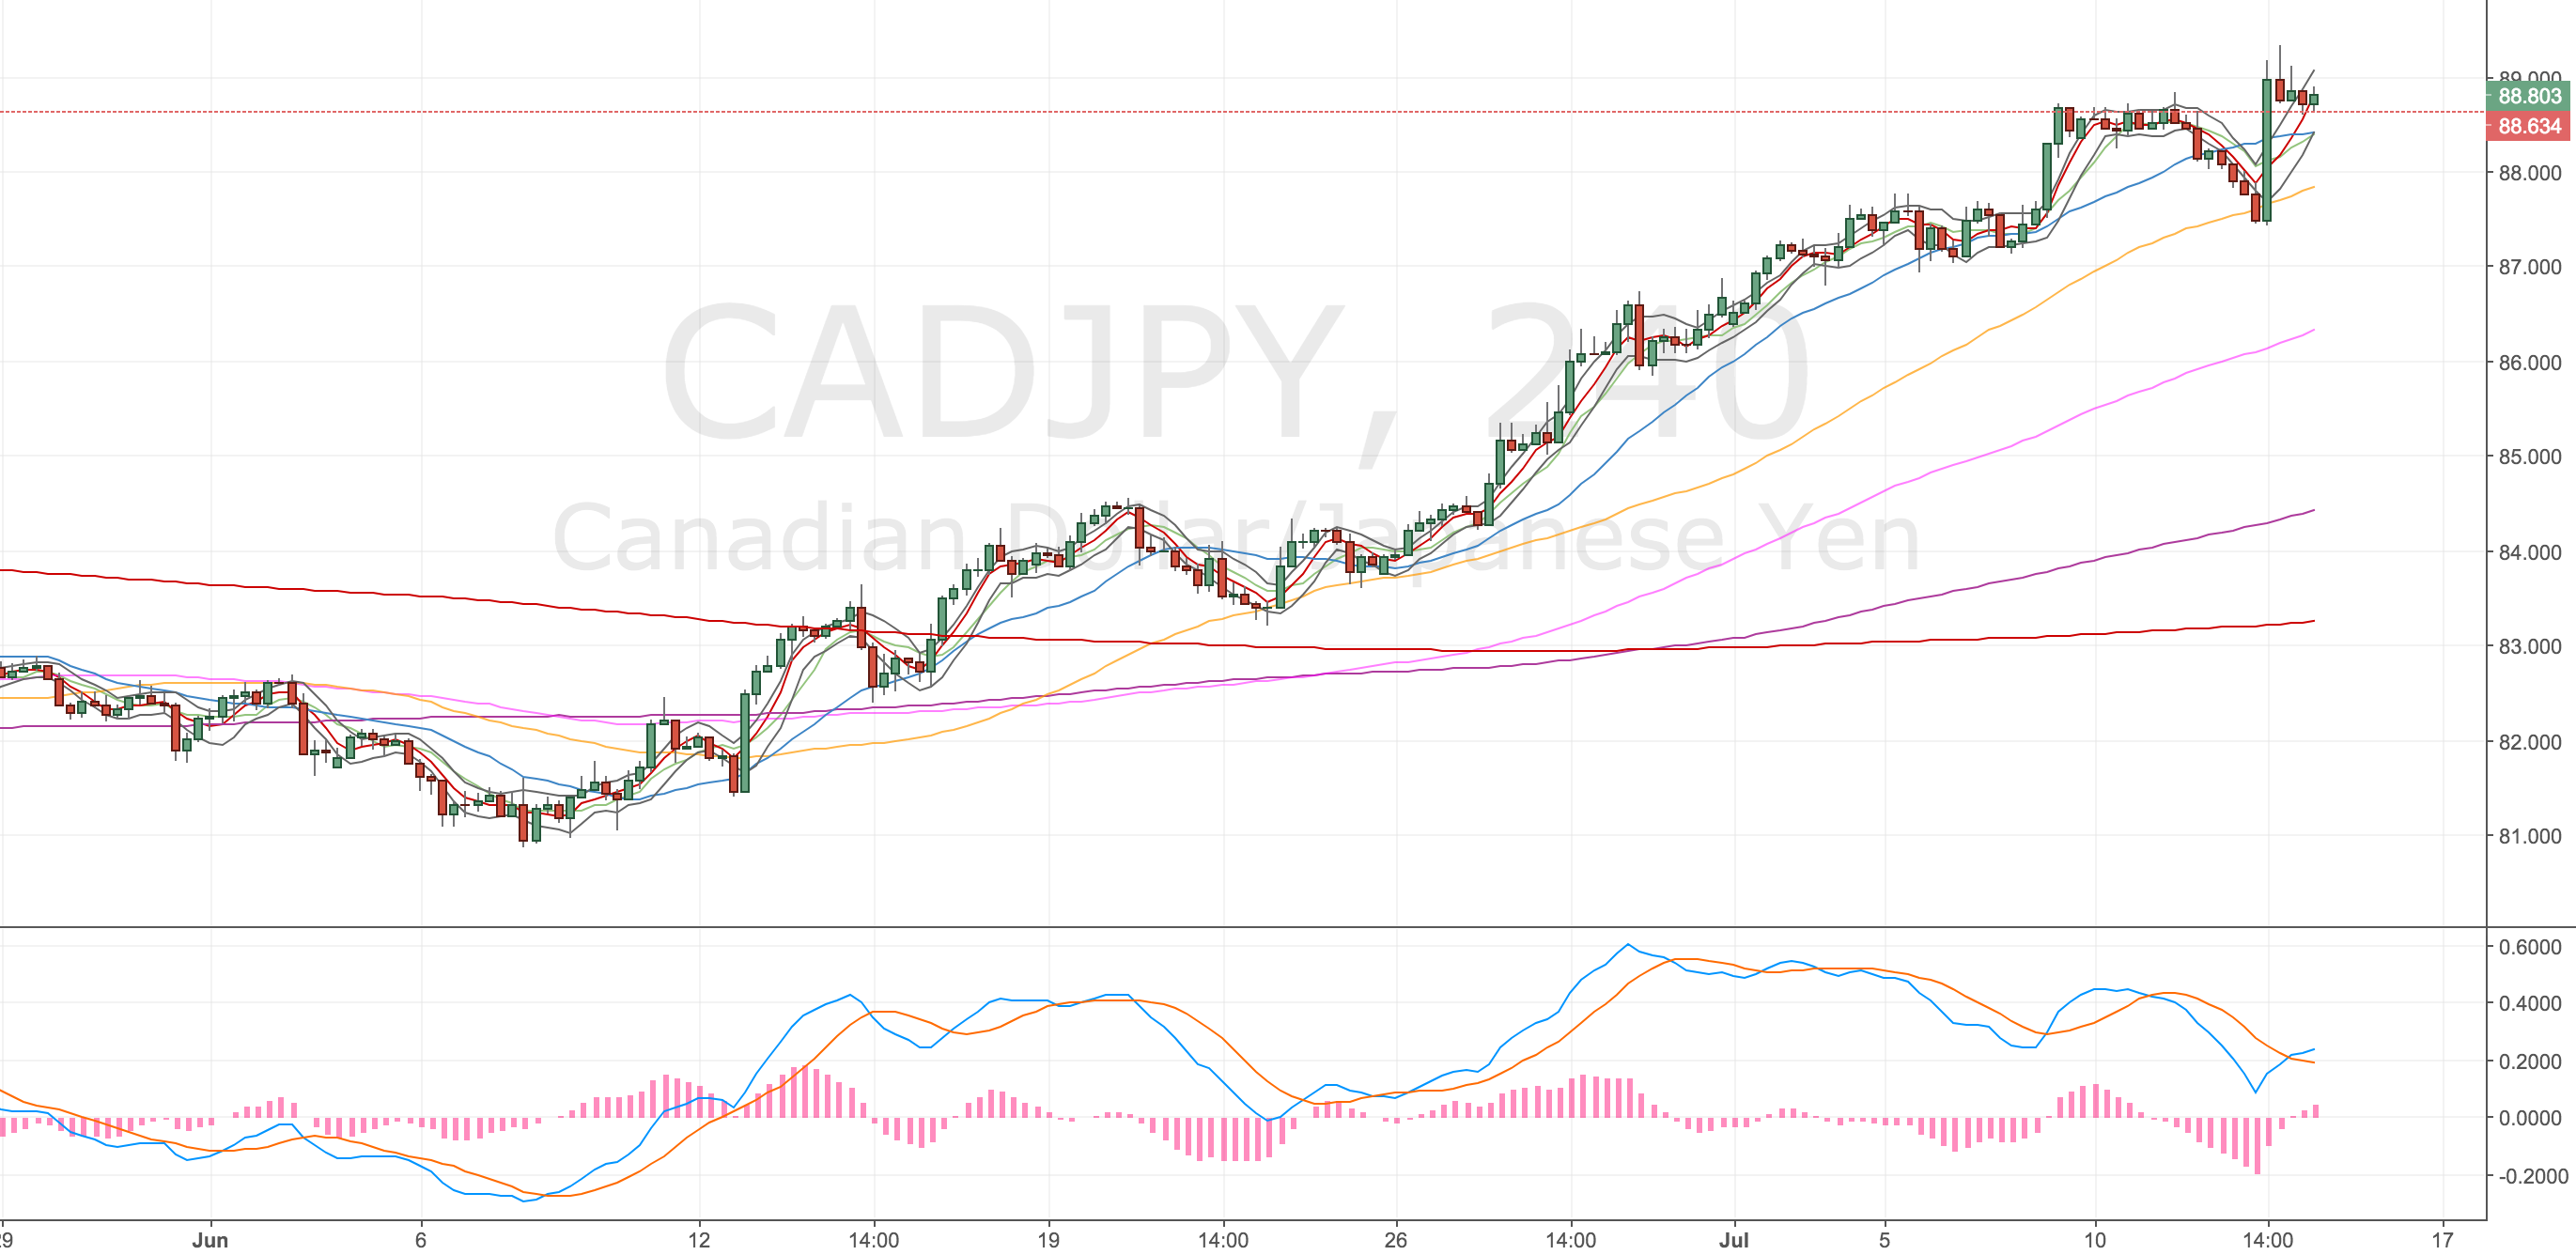
CADJPY 4H Chart – 13 Jul
1H Chart – confirmation
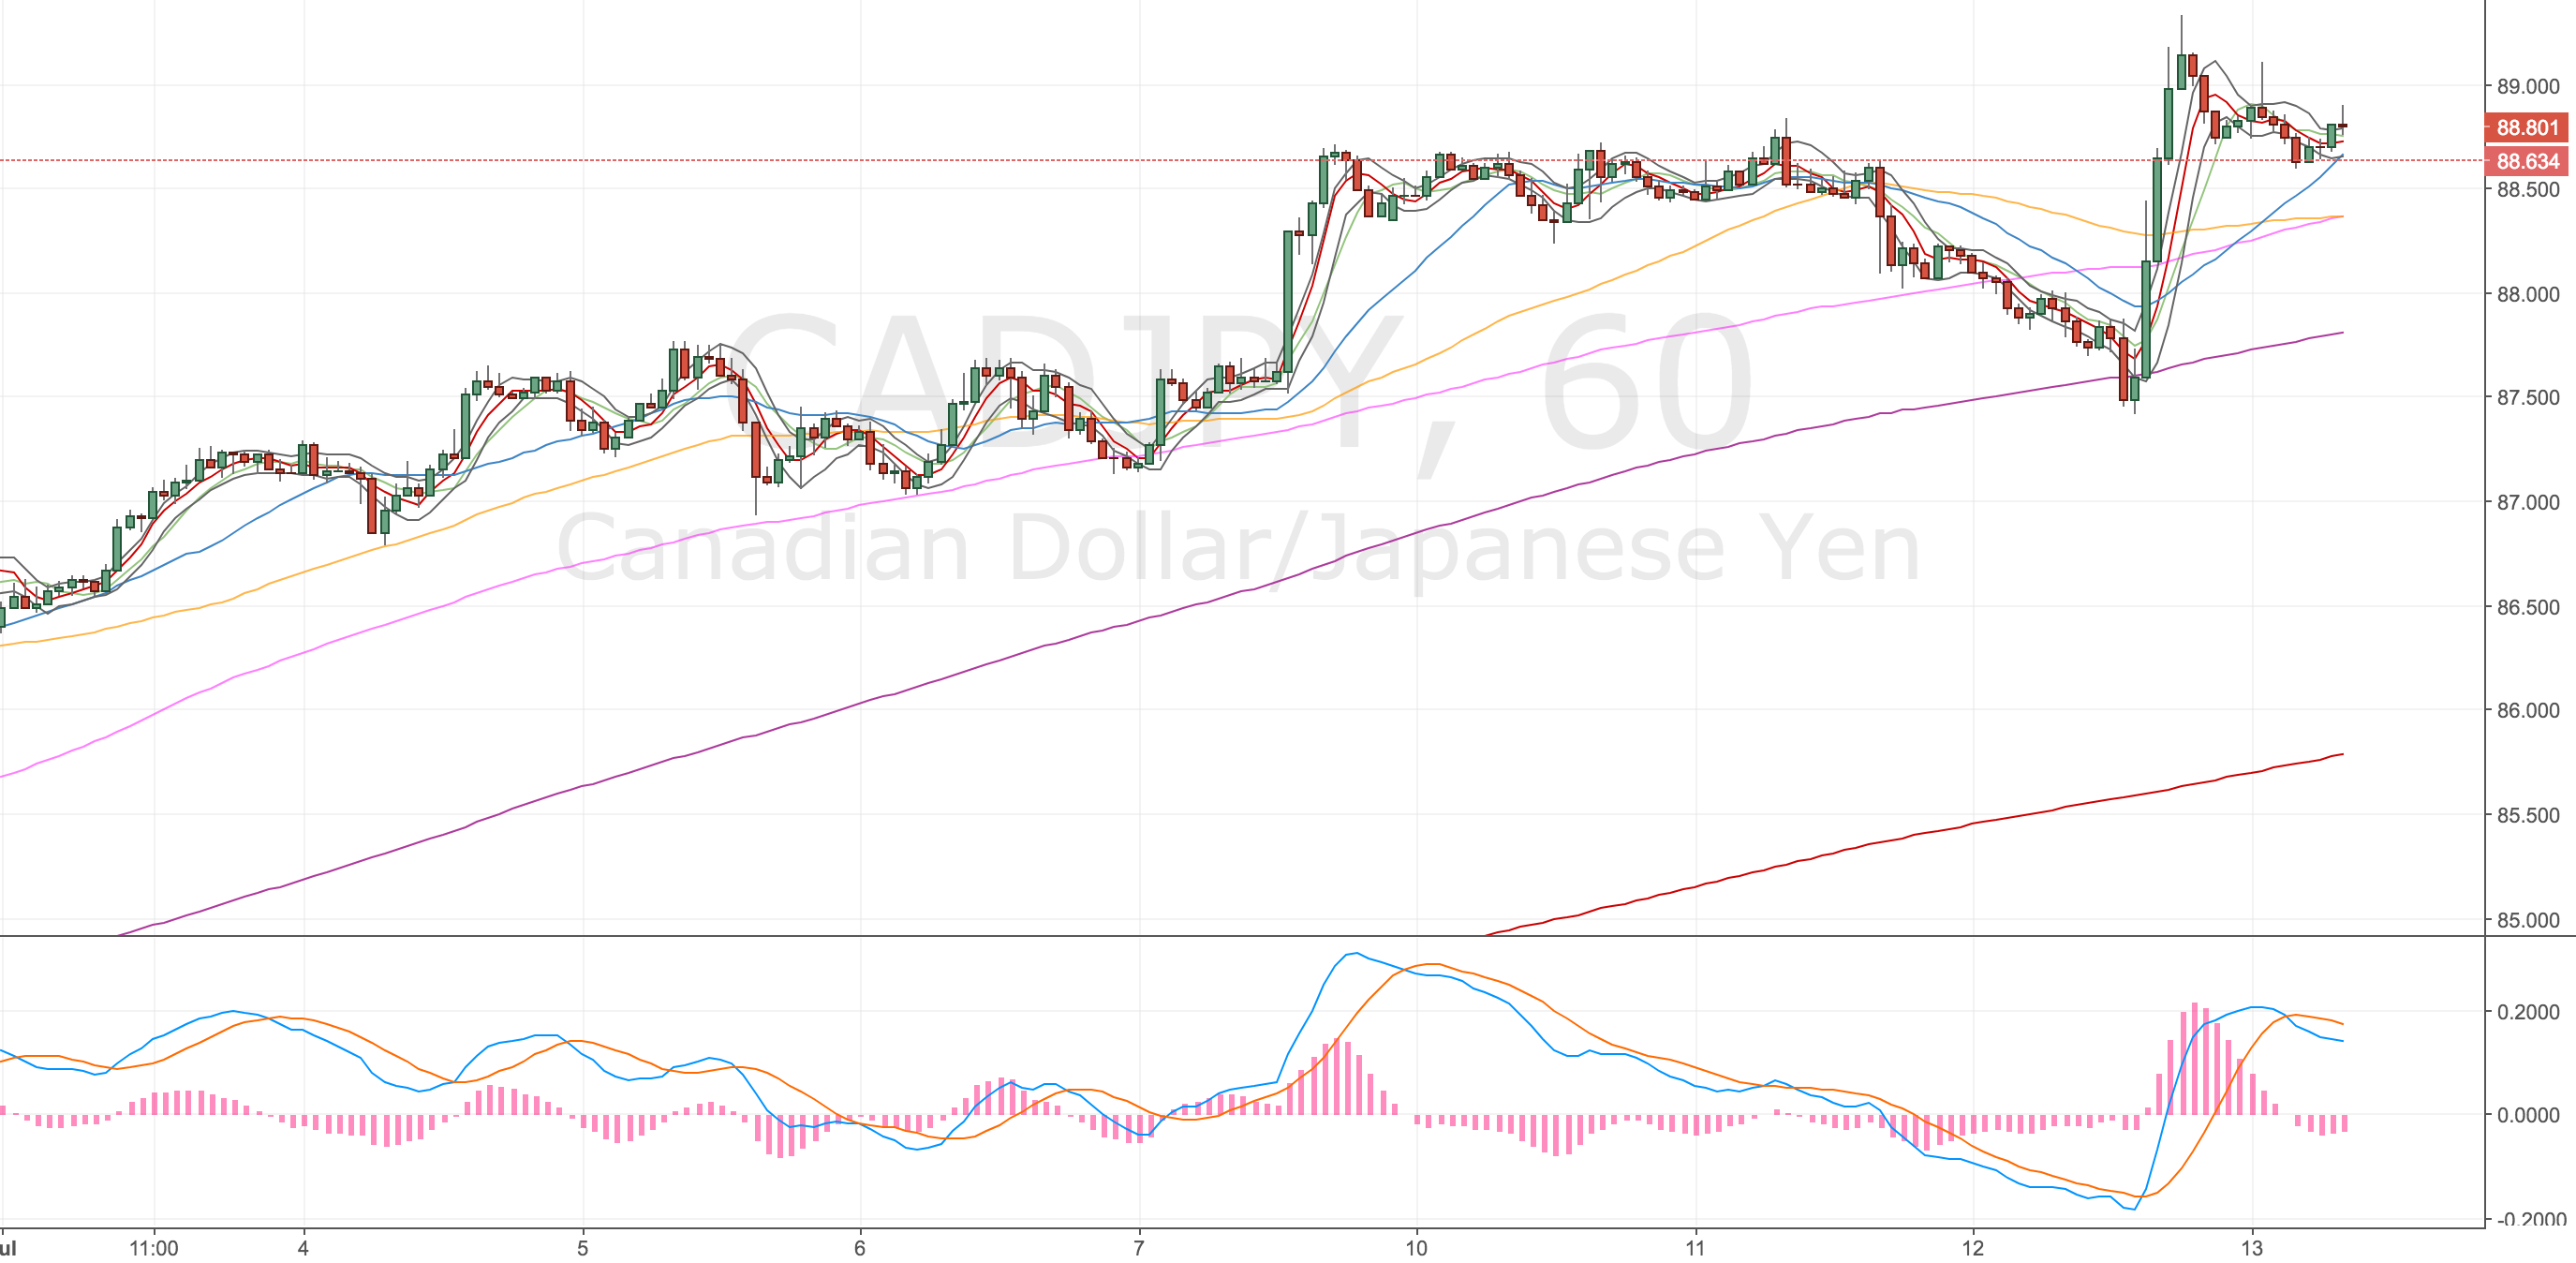
CADJPY 1H Chart – 13 Jul
Daily Chart
Aiming for the d500 or d50 – which ever is nearer at the time.
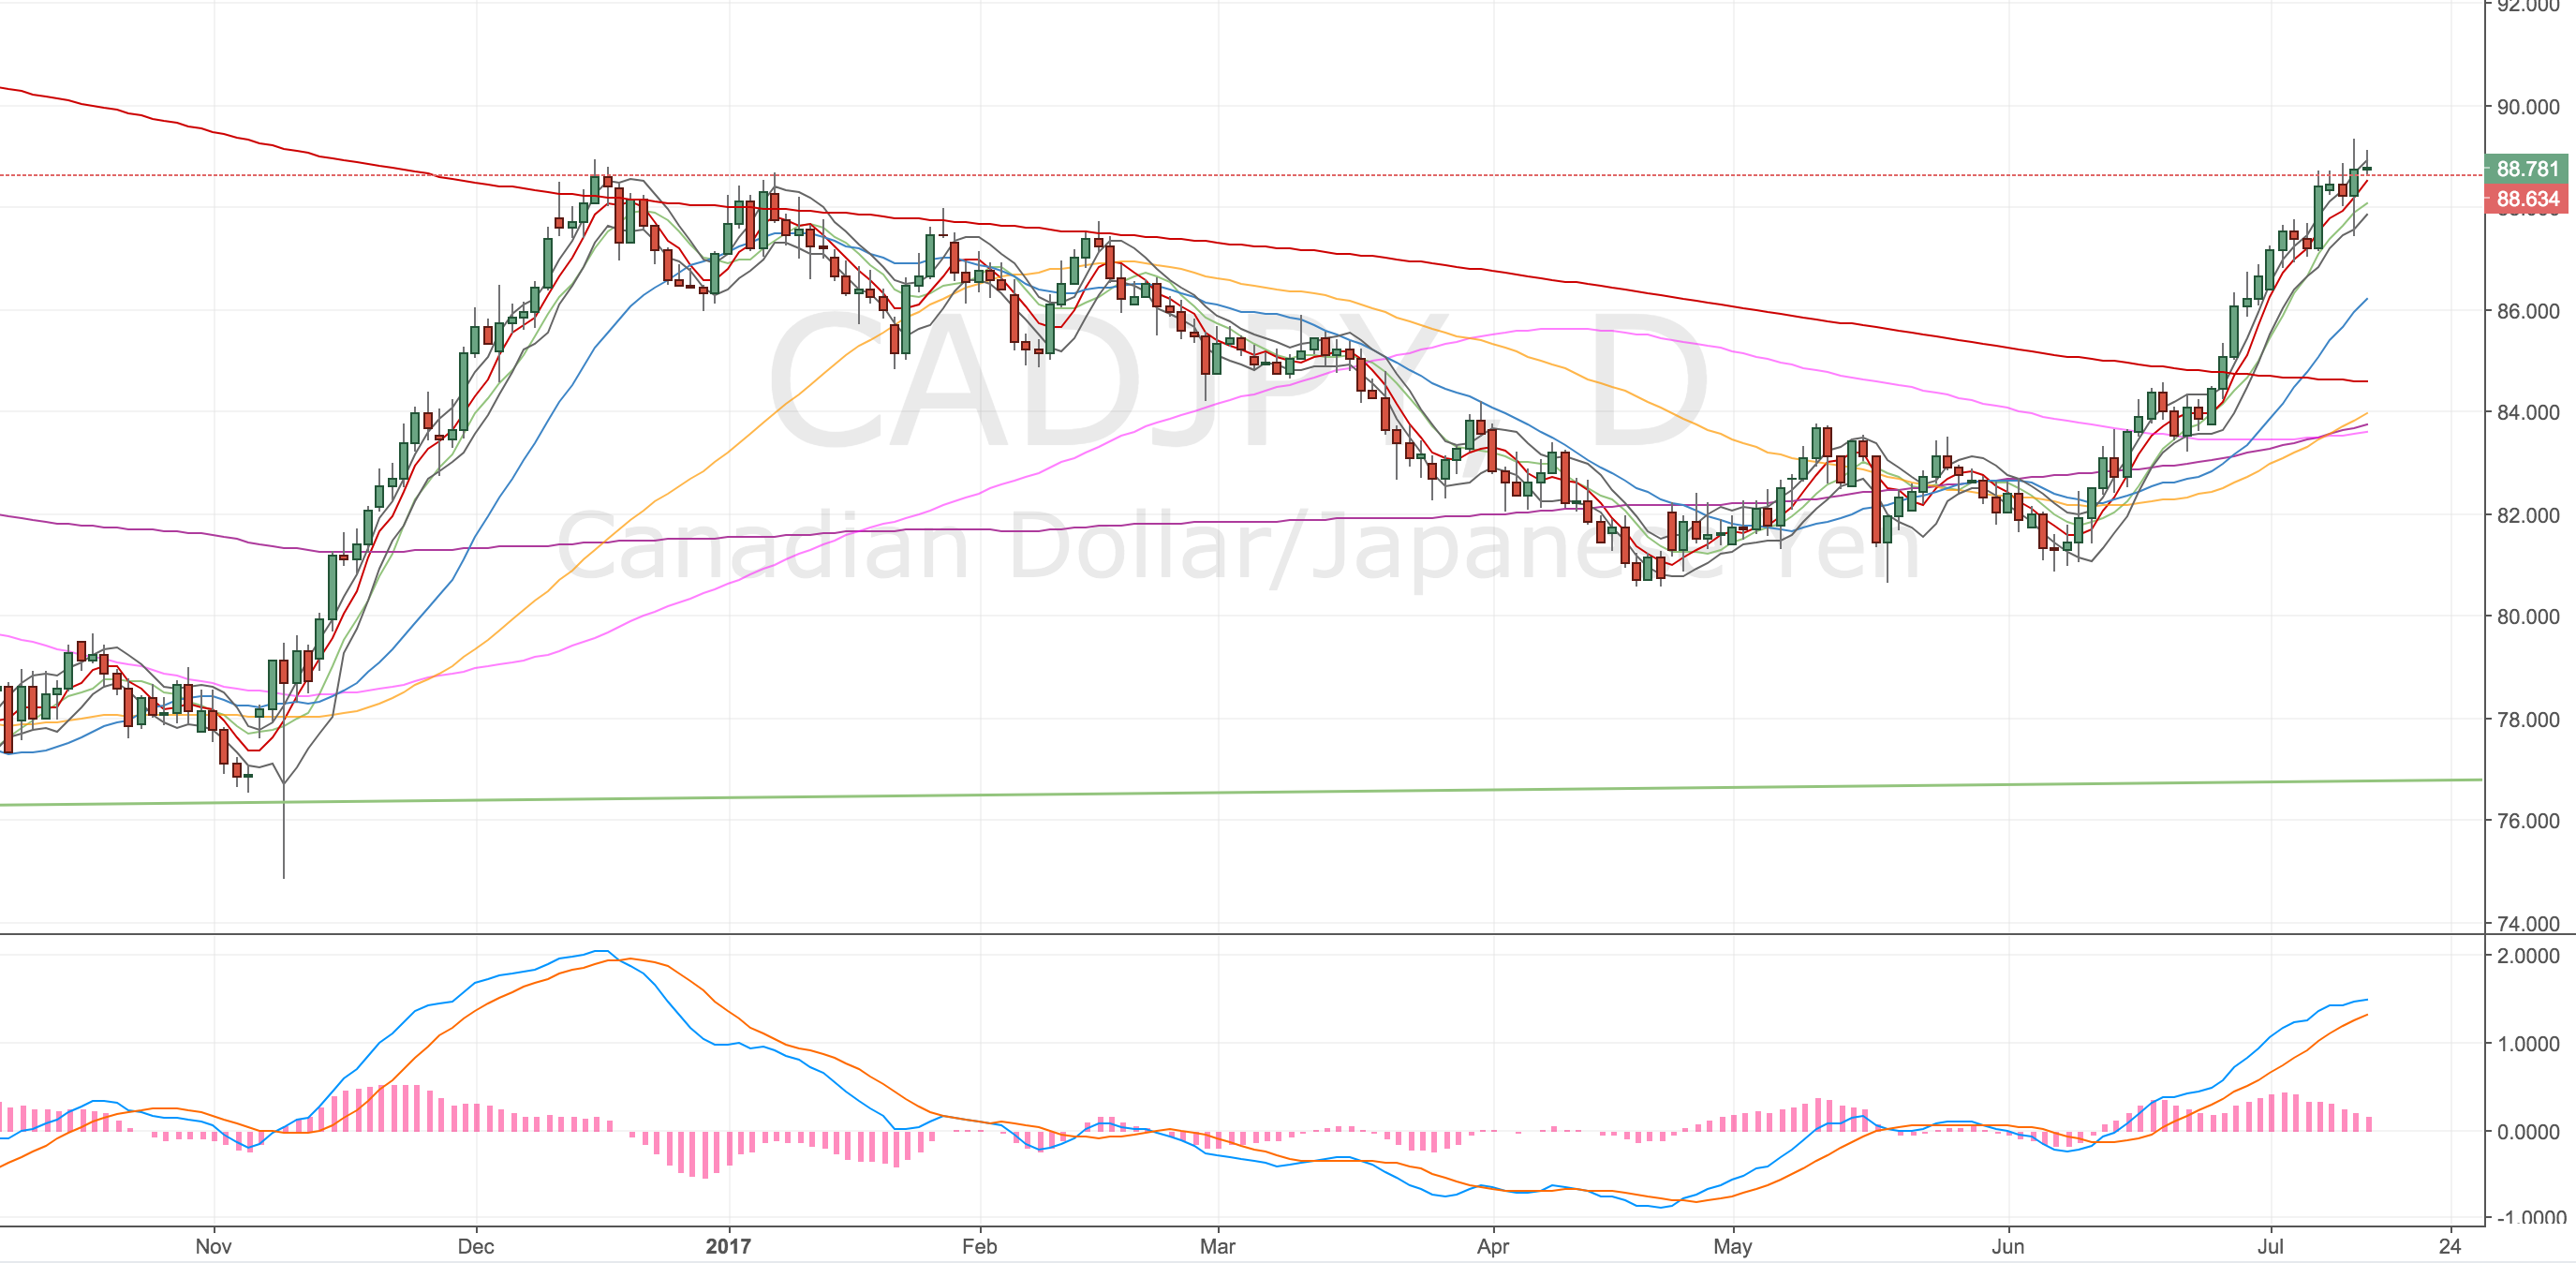
CADJPY Daily Chart – 13 Jul
Weekly Chart
Price action has run into the 500, might head to the 200, but I’m prepared to start shorting now.
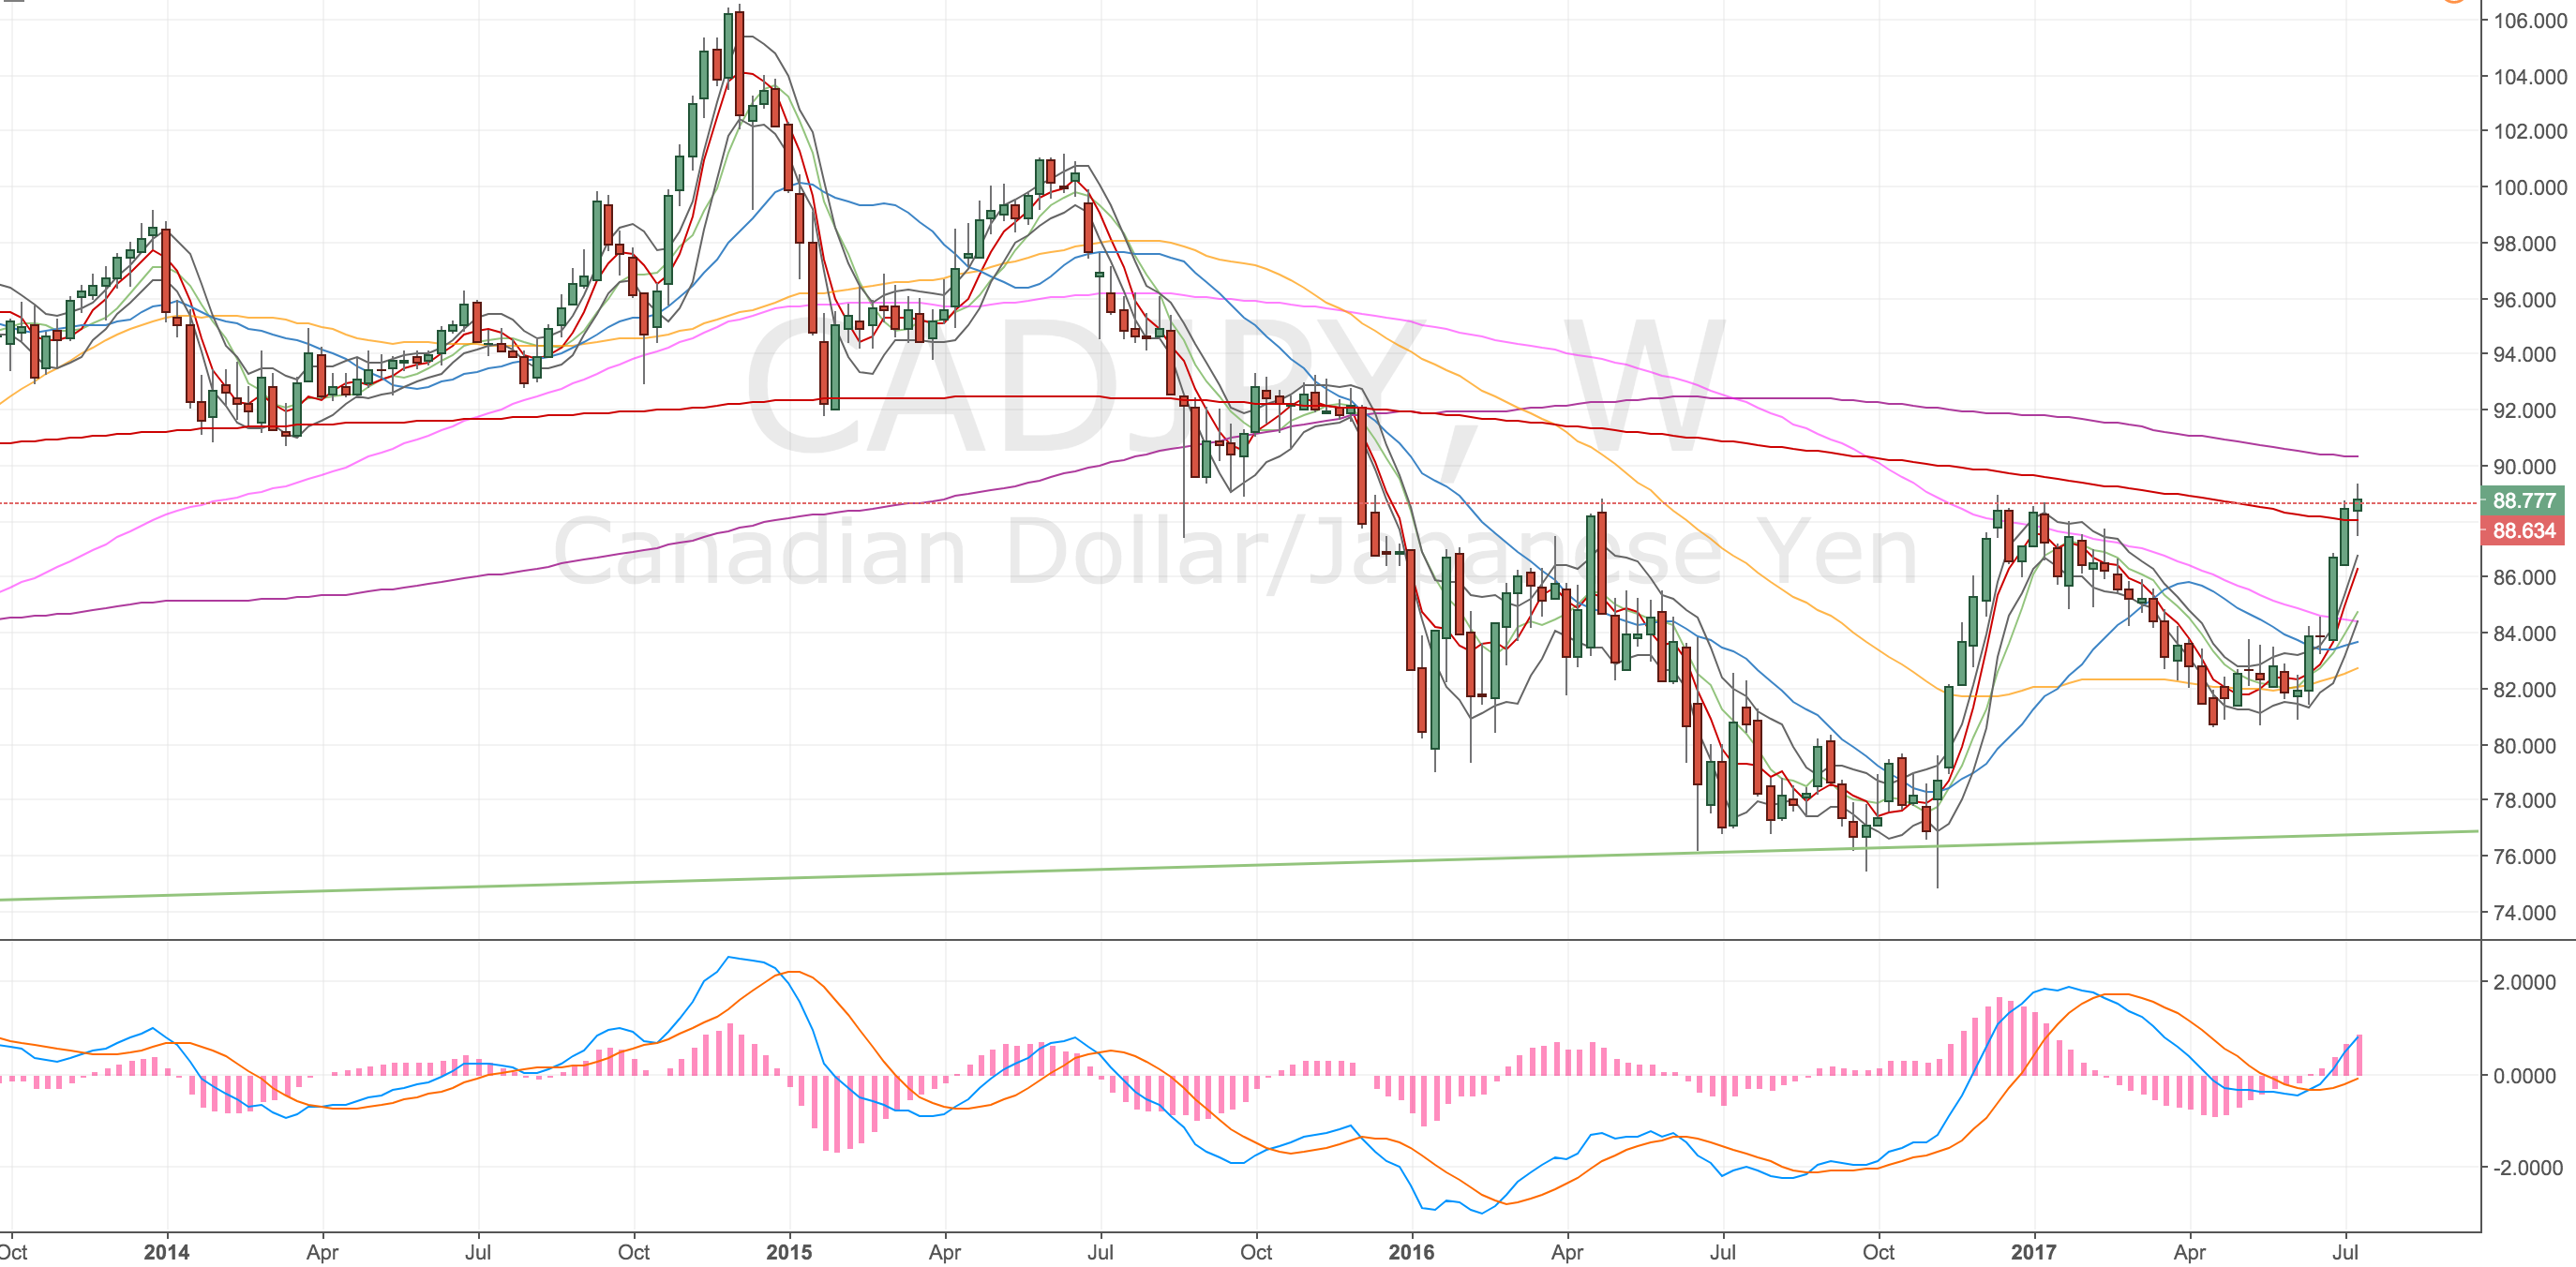
CADJPY Weekly Chart – 13 Jul
Still here waiting – 20 Jul
Just a mini update, I was quite excited about this trade but it’s gone sideways since I opened it. We’ve formed what looks like a triangle/wedge pattern to me. It looks quite bullish to me I and I can certainly see another swing high divergence forming. You’ll see all the other timeframe MAs I’ve marked on the chart, there’s a good cluster of MAs that would make a decent target if we do break down, but I’m mindful that we’ve not tested the d20 so, if we do break, I’ll need to scale out on the way down.
For the time being – I predict a stop out and another set up coming, probably next week or into August.
CADJPY 4H Chart – 20 Jul
I slept quite badly last night – not due to this – but I kept checking my phone to see how the asian session went with the Japanese quarterly report – I thought I’d finally get an outcome on this trade one way or another – but I didn’t 🙁 just more sideways price action.
Stopped out – 25 Jul
Price action just swung higher and stopped me out. Not sure where we’ll go from here – higher to the w200 – or rollover again. One of the hardest things I find is getting back into a trade, not that because I’ve lost I can’t re-enter, but that I’ll only re-enter on a valid set up so sometimes I have to let a trade idea go because it didn’t set up according to my rules.
I hate to see that.
Got another set up – 28 Jul
Well I missed a move down – as I thought I might, it happened on my birthday when I was out with family celebrating – no big deal, you’re gonna miss trades from time to time. I placed an order in the off chance I might get lucky and I did! Triggered in short at 88.95.
Acc Risk: 0.6%
Short: 88.95
Stop: 89.77 (82 pips)
Target: 86.76 (201 pips, 4h200, 2.5 RR)
Mindset: Risking more than I’d like but it’s a volatile currency and I’m on minimum position size. I can still see another stop out occuring
The w200 is still in the picture but the most recent swing high resulted in another divergence so taking the trade again. I didn’t take a screenshot because it was an order so scroll down for the result!
Trade worked out but still tinkered with it – 3 Aug
So the trade did start to break down and funnily enough, I can’t define it, but I just kind of new it was going to go my way. The price action down felt like it was going to stick this time. I guess it was consistently down, despite the retraces, each leg seemed to make a lower low.
I have a weekly divergence that I would love to trade, but it doesn’t feel part of my system, that would put the target at 84.40. I am happy to be out at the 4h200 though. I was very impatient towards the end and I thought my target level – being missed by 1 pip – was it, so I closed the trade a little higher. I was convinced the 4h200 was hit, although I didn’t check it at the time.
I’m annoyed that I messed with it, I should’ve left it to the order to take me out.
Today (7 Aug) we are trading at 87.30 which would’ve been an extra £10 to the pot. Not much but % wise it would’ve made a difference.
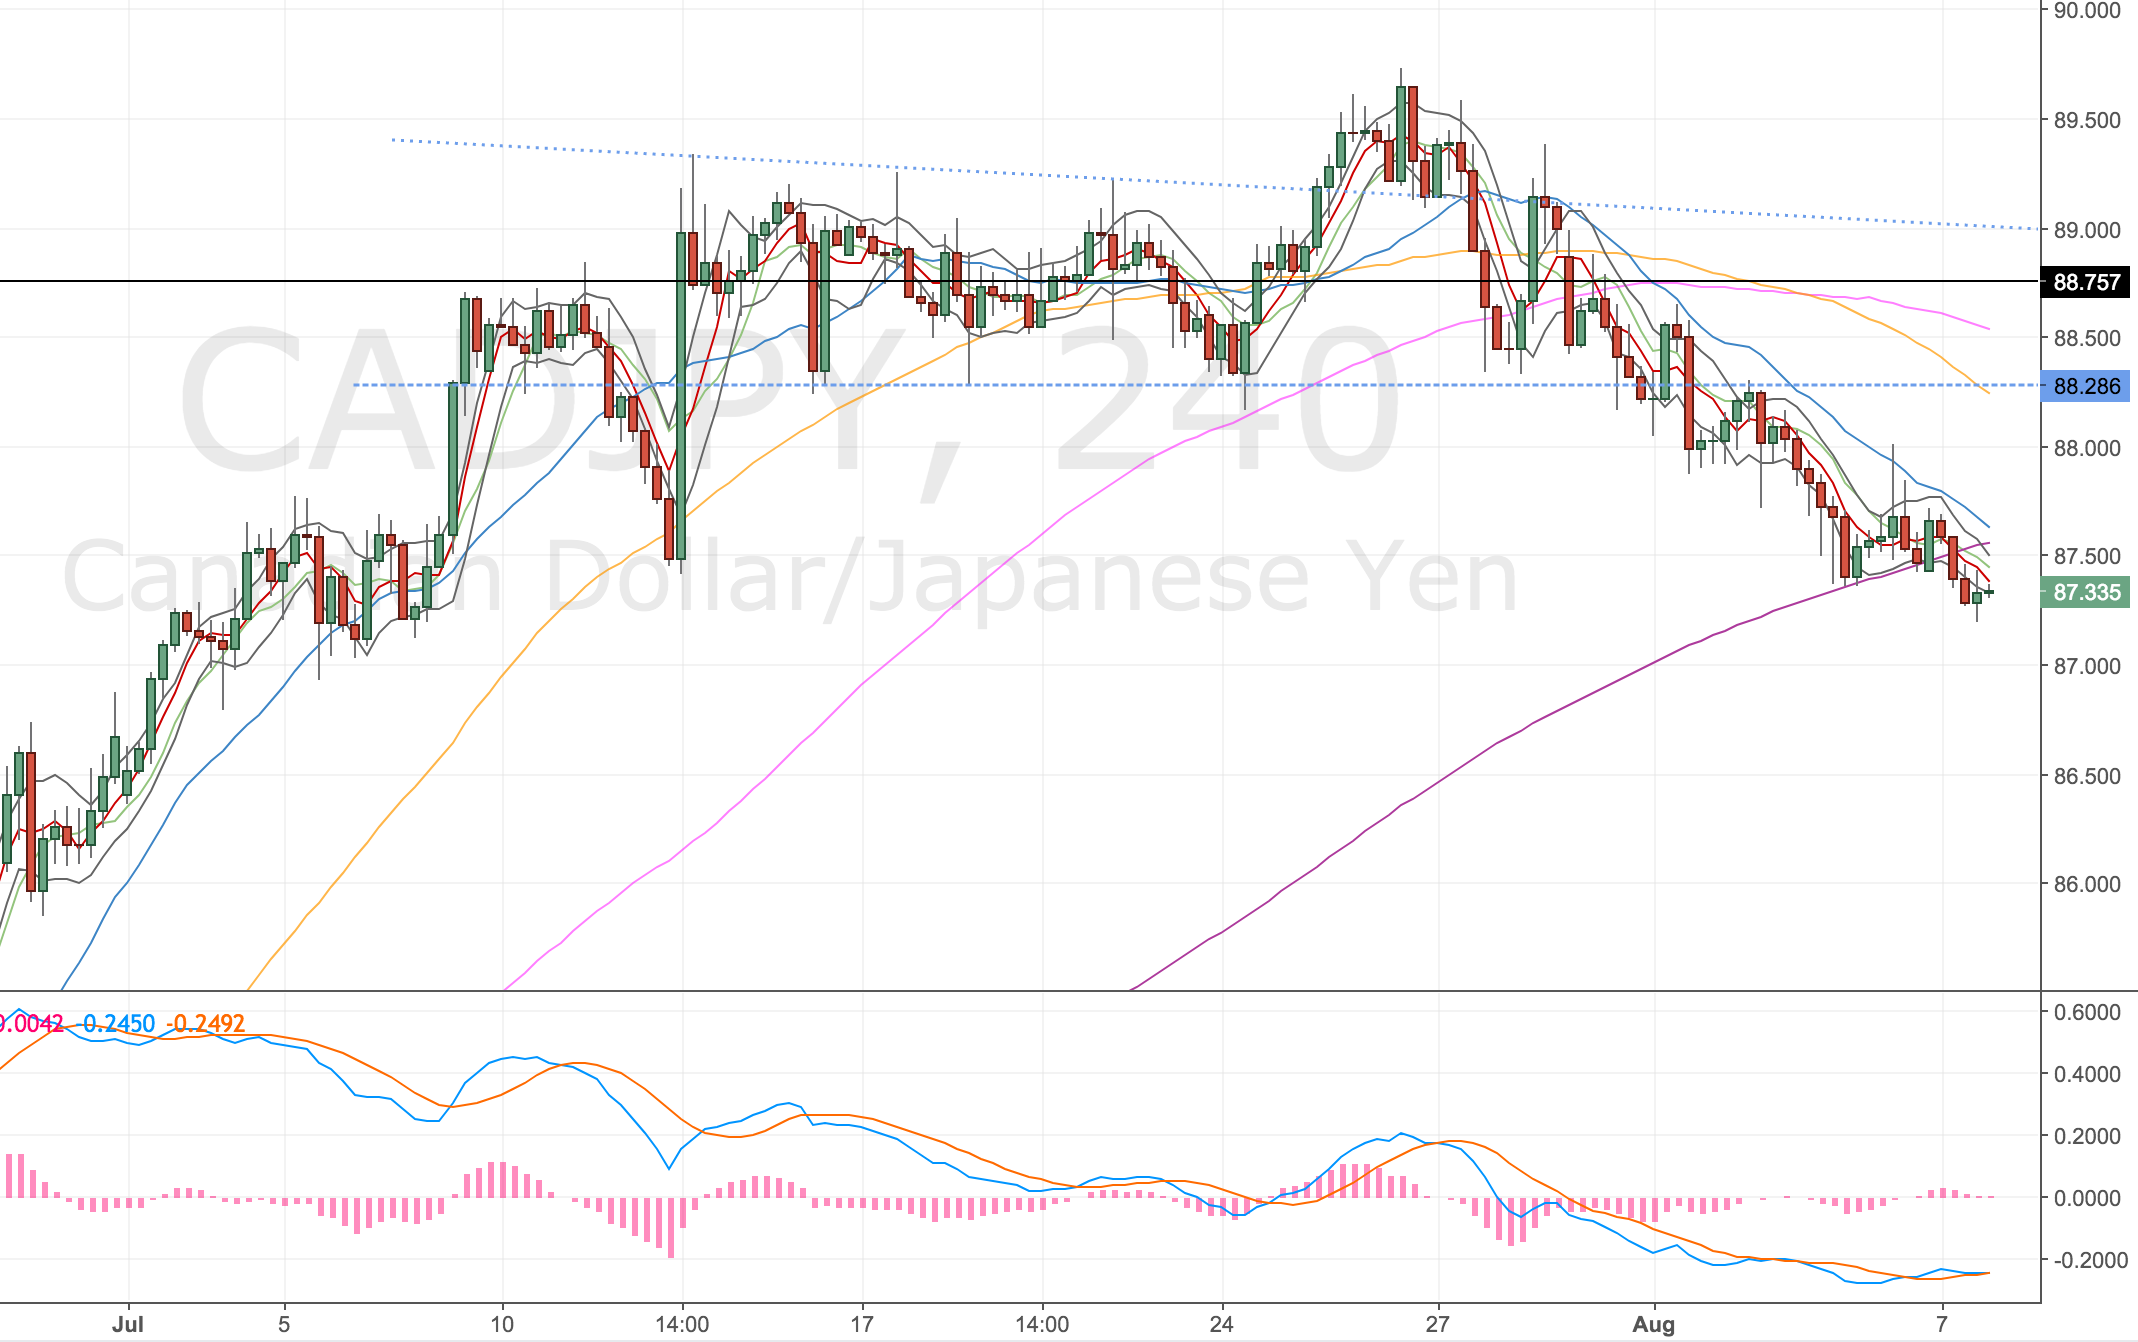
CADJPY 4h Chart – 7 Aug
You can see the price action outside the wedge that took me out and the subsequent run down to the 200. It looks like I was lucky to get my order hit on the 28 Jul for the short.
Checking in with the trade afterwards – 11 Aug
Just thought I’d update this as the trend has been strong and continued through the 200. I was hoping for a retrace to *consider* another entry. Would’ve been hard to get a set up but kept it in mind.
This chart goes to show that if you have a target in mind you should play to that target and not mess around with the exit level as you get close. Controlling your emotions really is 80% of trading.
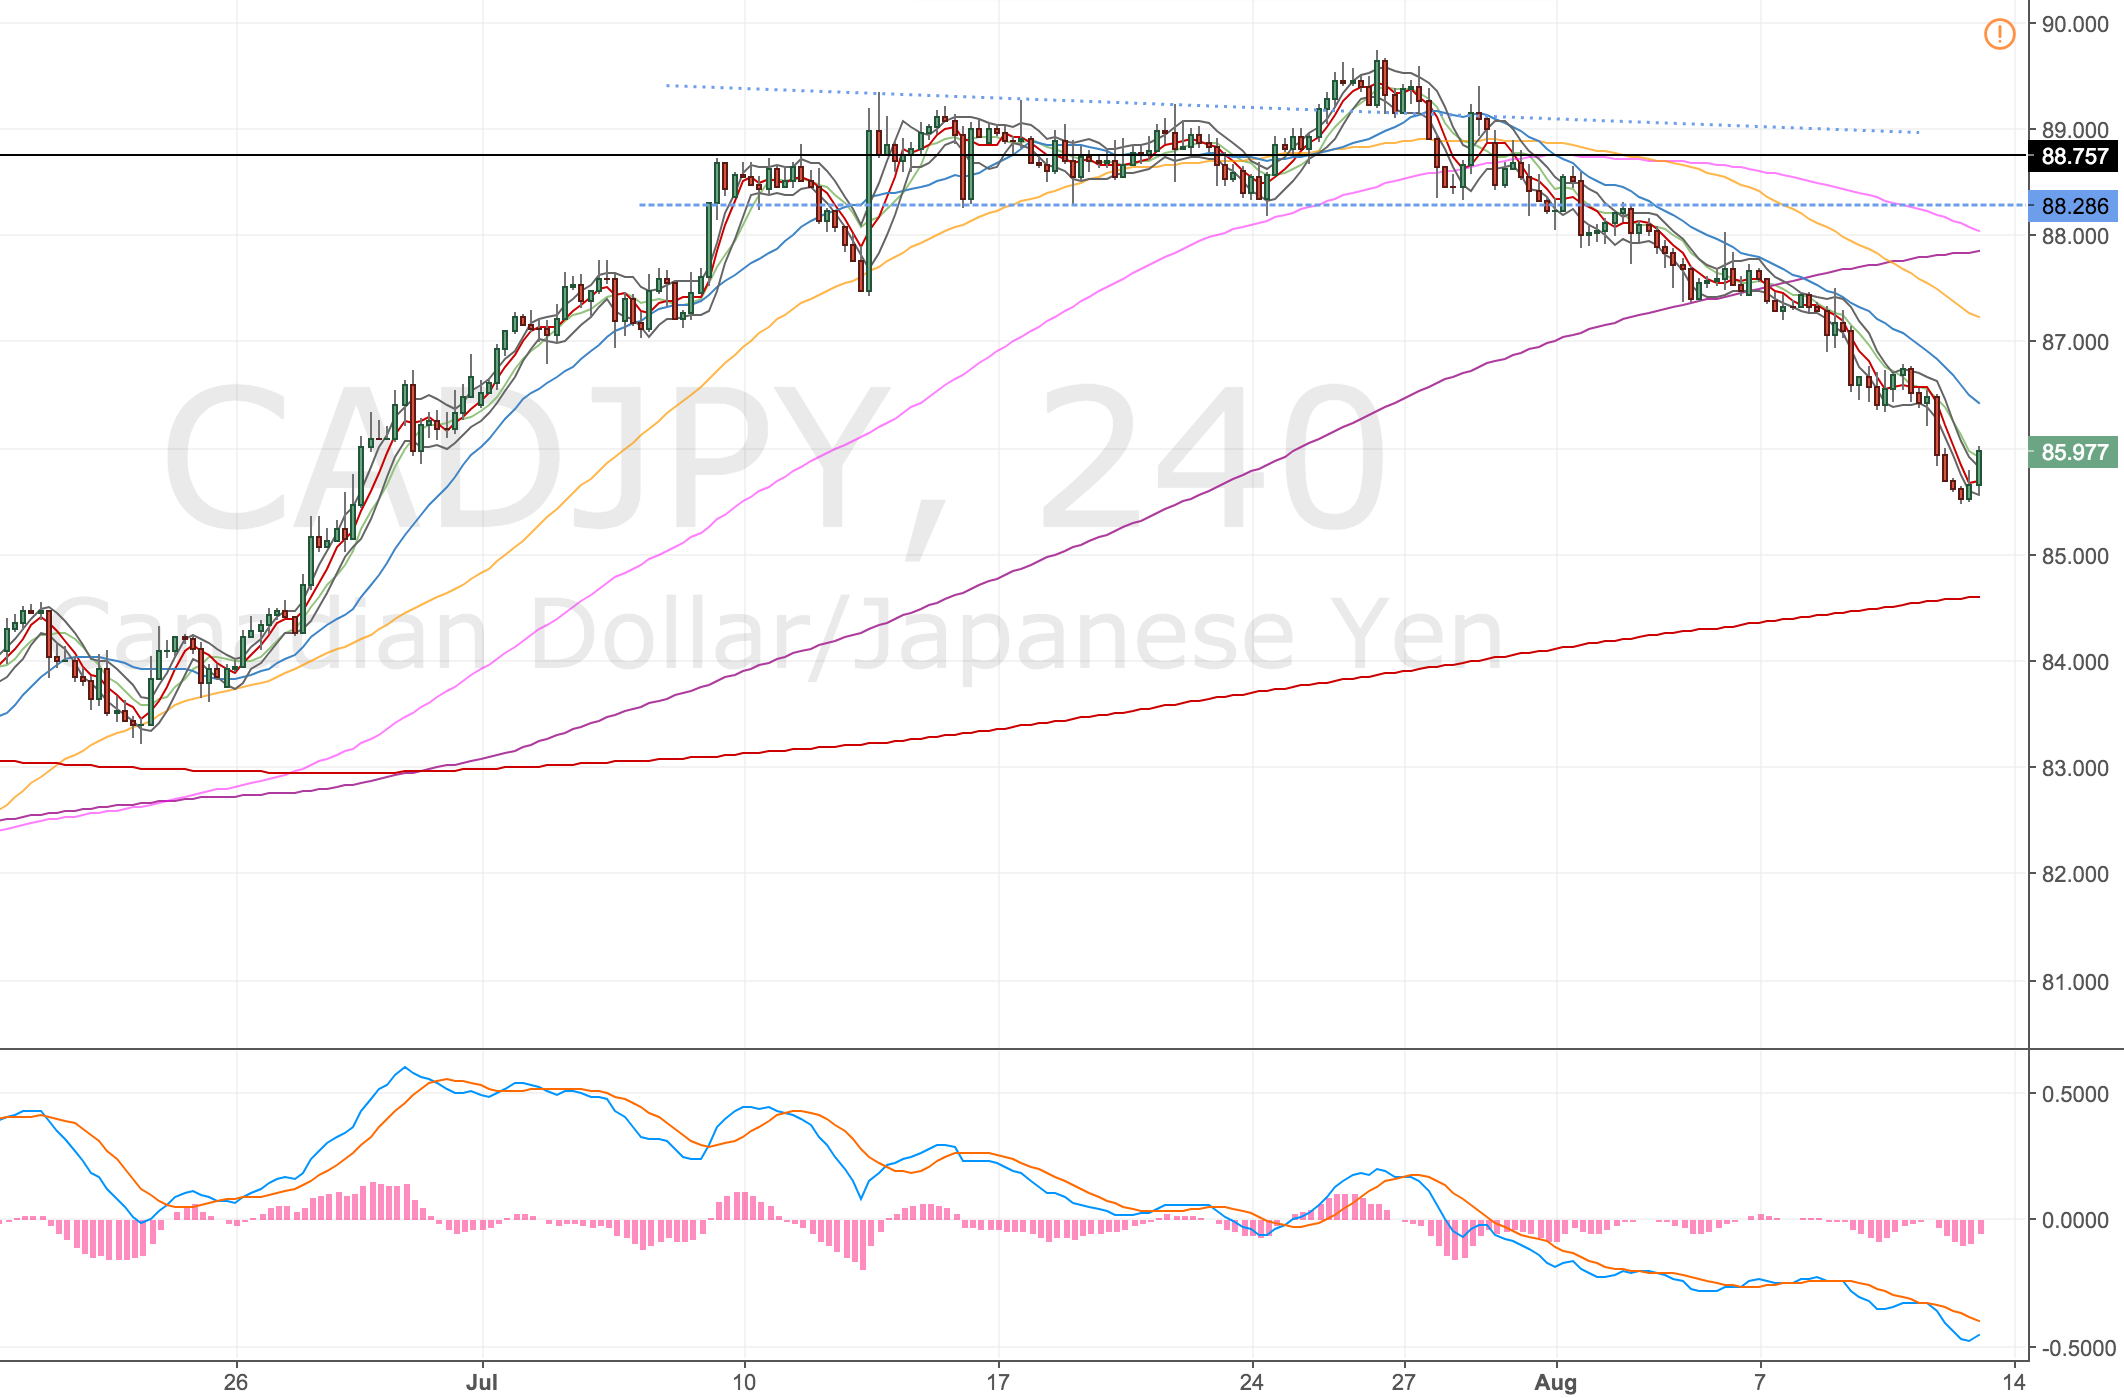
CADJPY 4H Chart – 11 Aug 17