Acc Risk: 0.6%
Short: 91.20
Stop: 91.75 (55 pips)
Target: TBC – depends if the weekly divergence forms but at least 89.80
Mindset: Mixed
Updates
Wedge forming on the hourly with divergence – 22 Sep
Closing part of the trade – 13 Oct
Taking my first hedge – 15 Oct
Ops – 15 Oct
Hedging again – 17 Oct
Seeing a lot of divergence on the JPY pairs, some stronger than others I really like this one because the daily and weekly charts are diverging. So I can see a big target here, especially as the last weekly divergence didn’t make the w50. Coming into CPI figures I’m hopeful that we’ll get some movement in my direction but can easily see this stopping me out for a 2nd attempt.
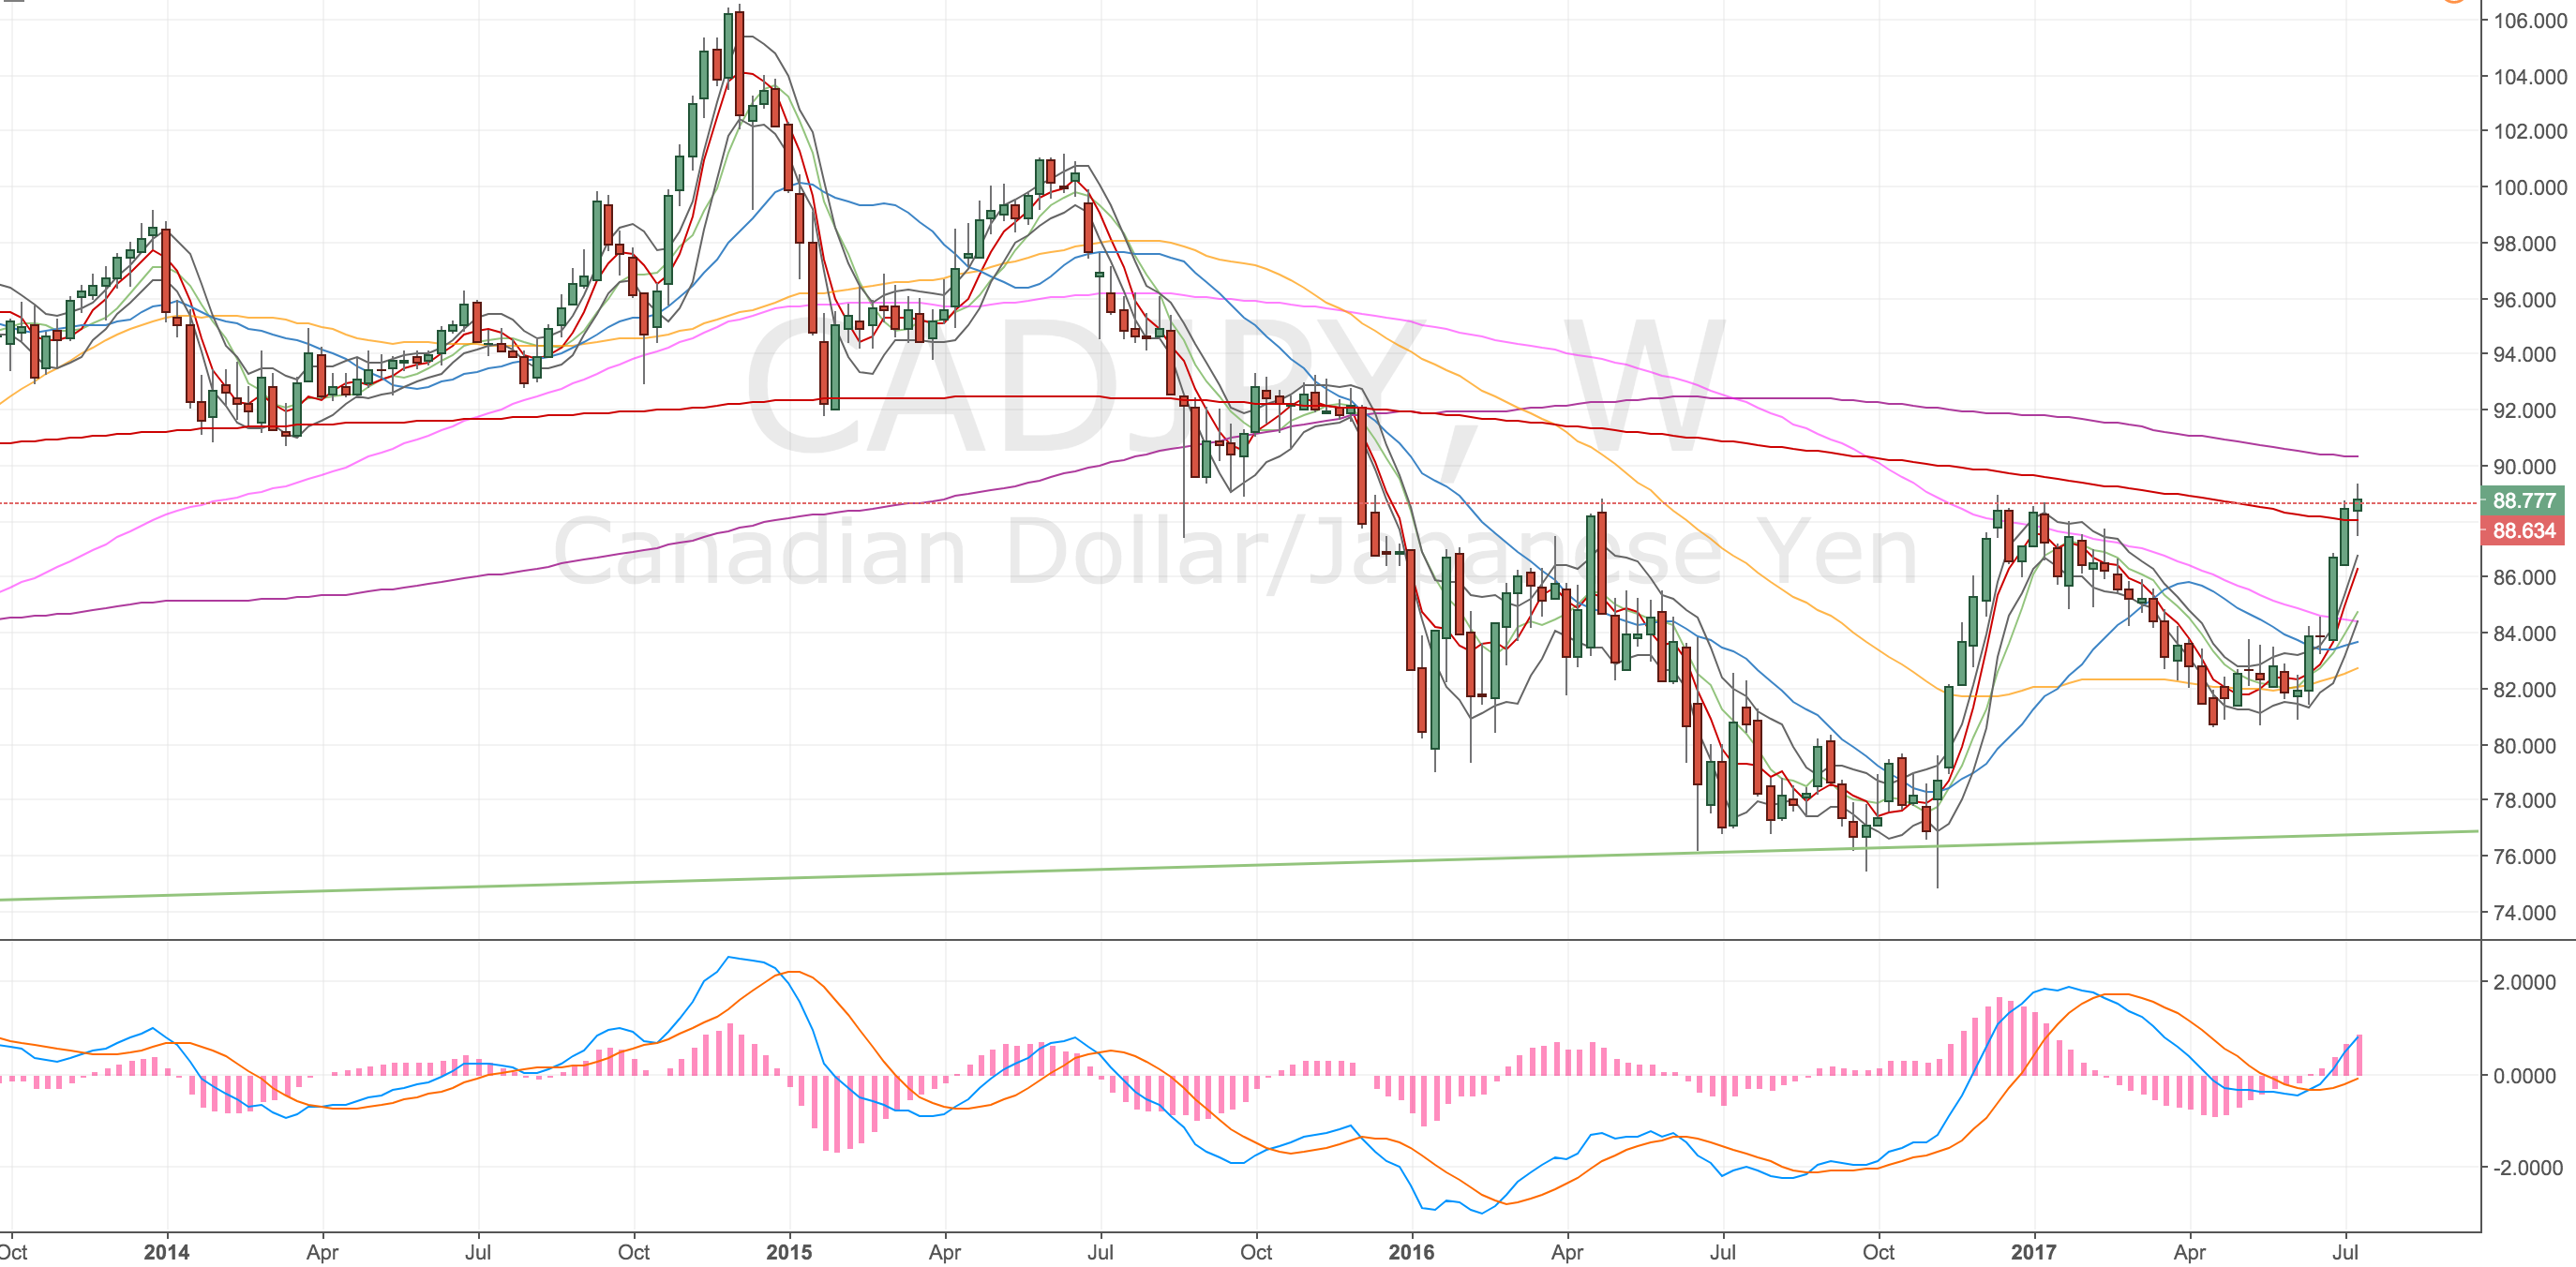
Monthly Chart
Testing the m50.
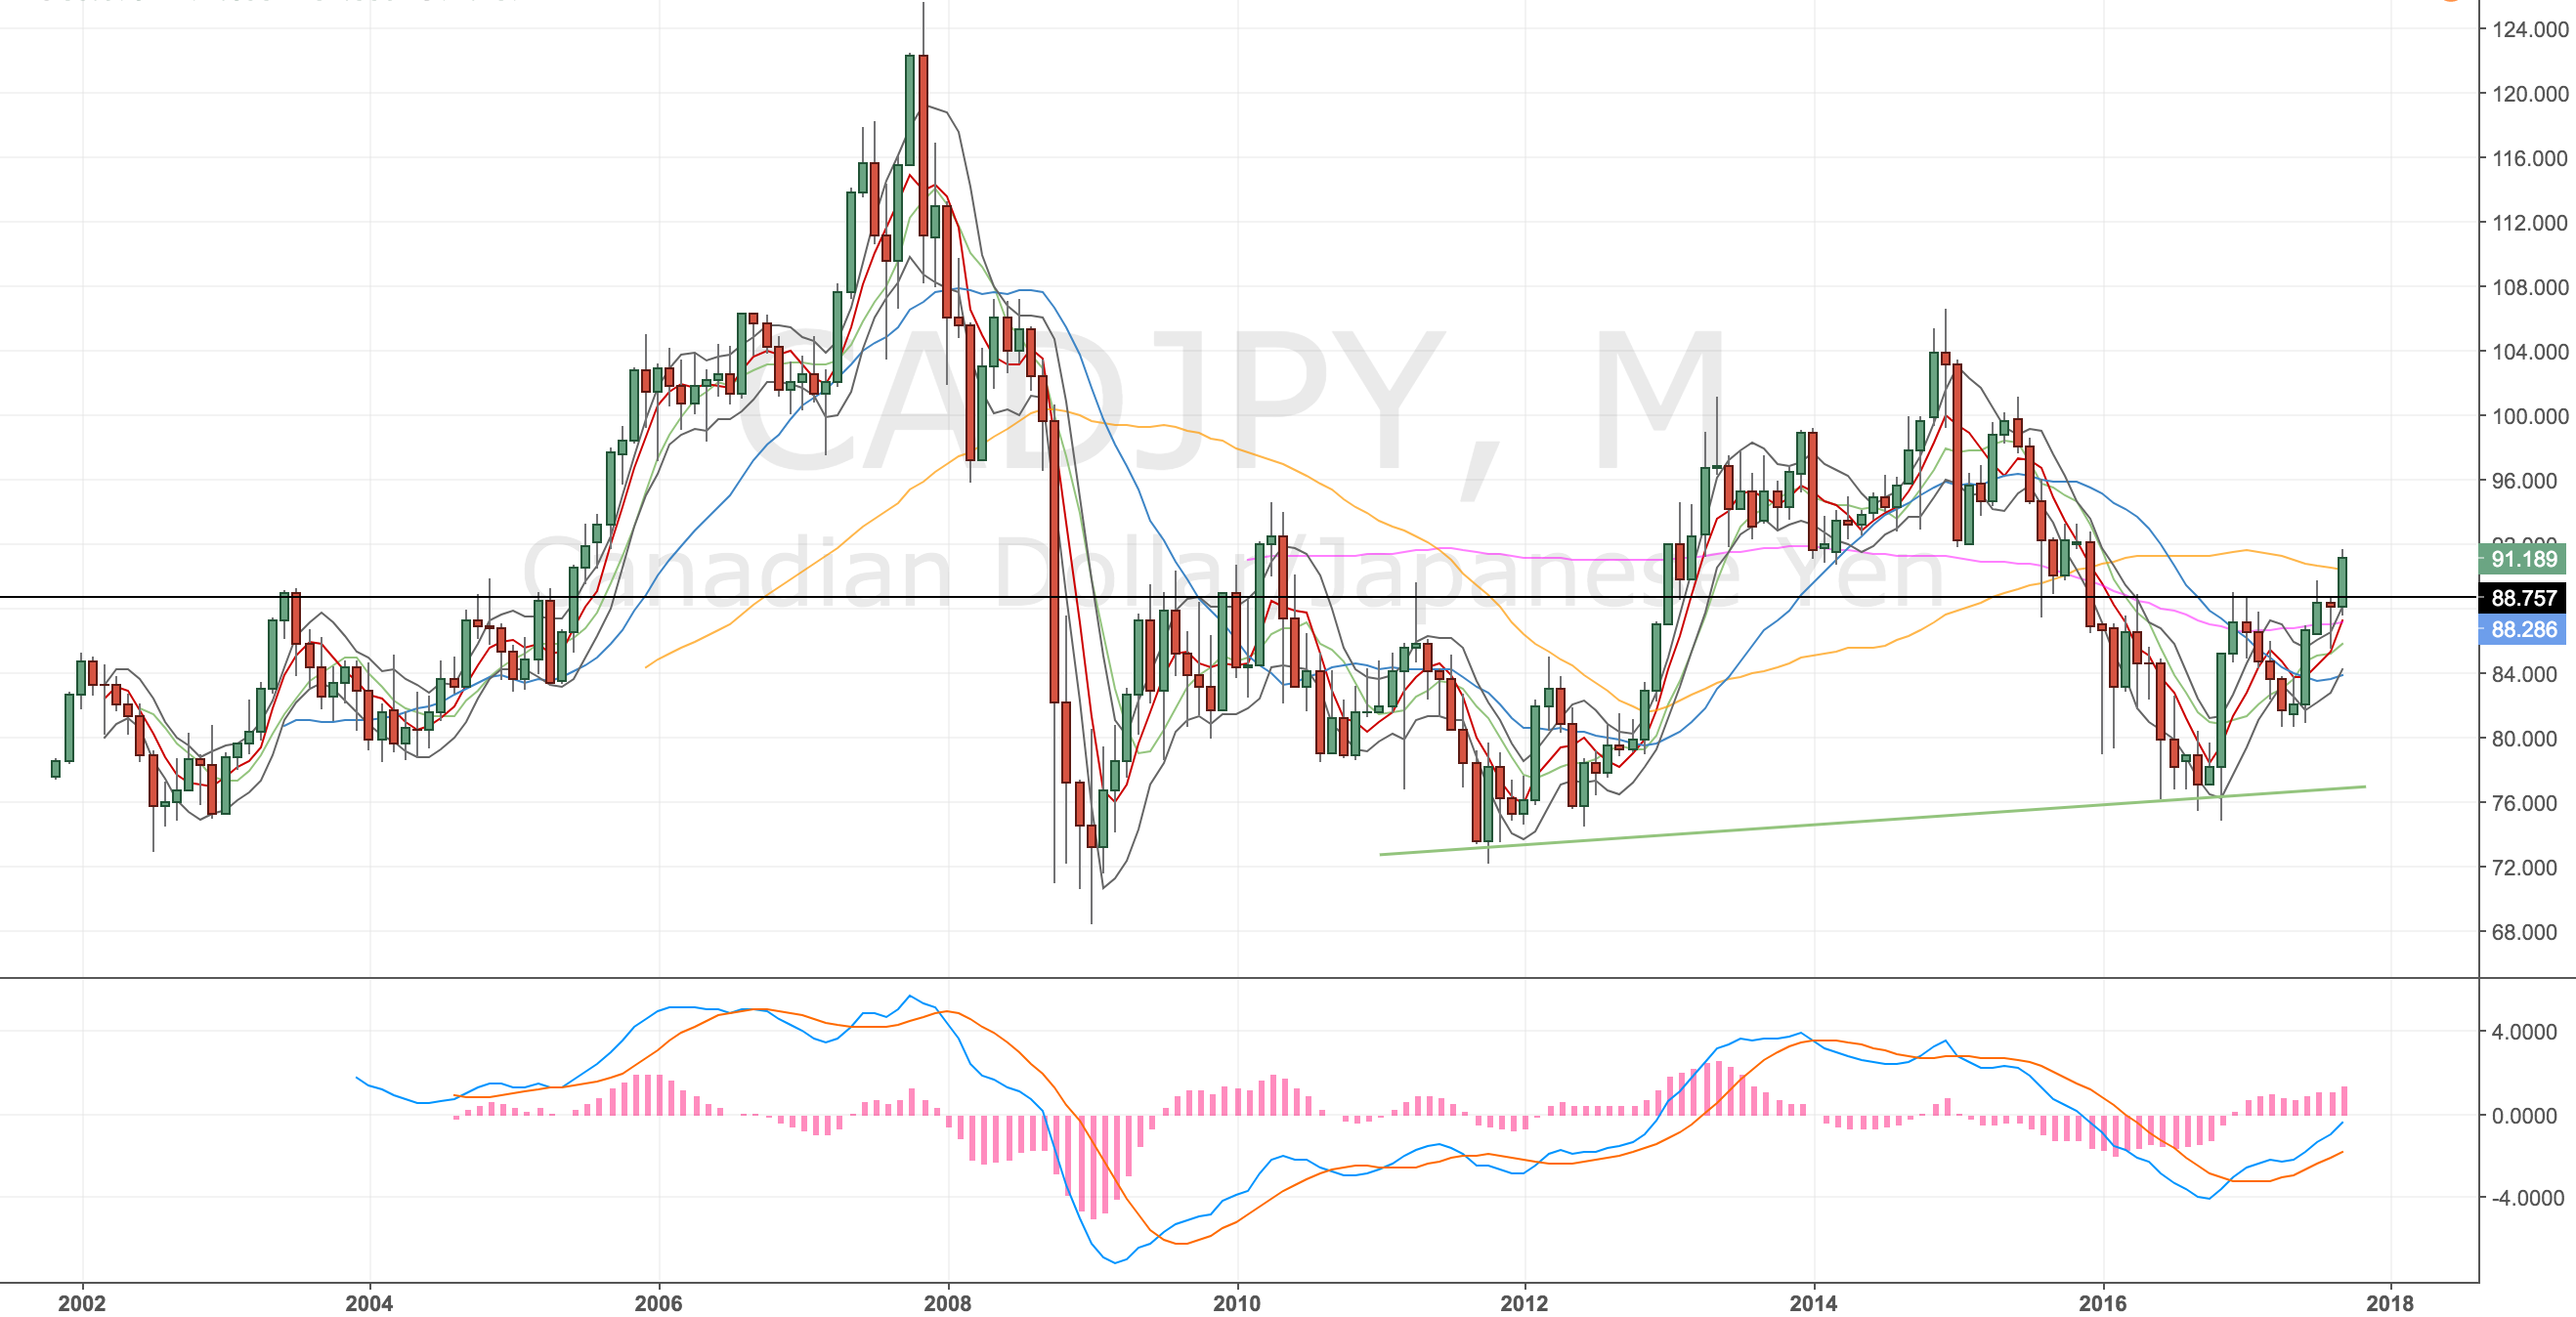
CADJPY Monthly Chart – 21 Sep 17
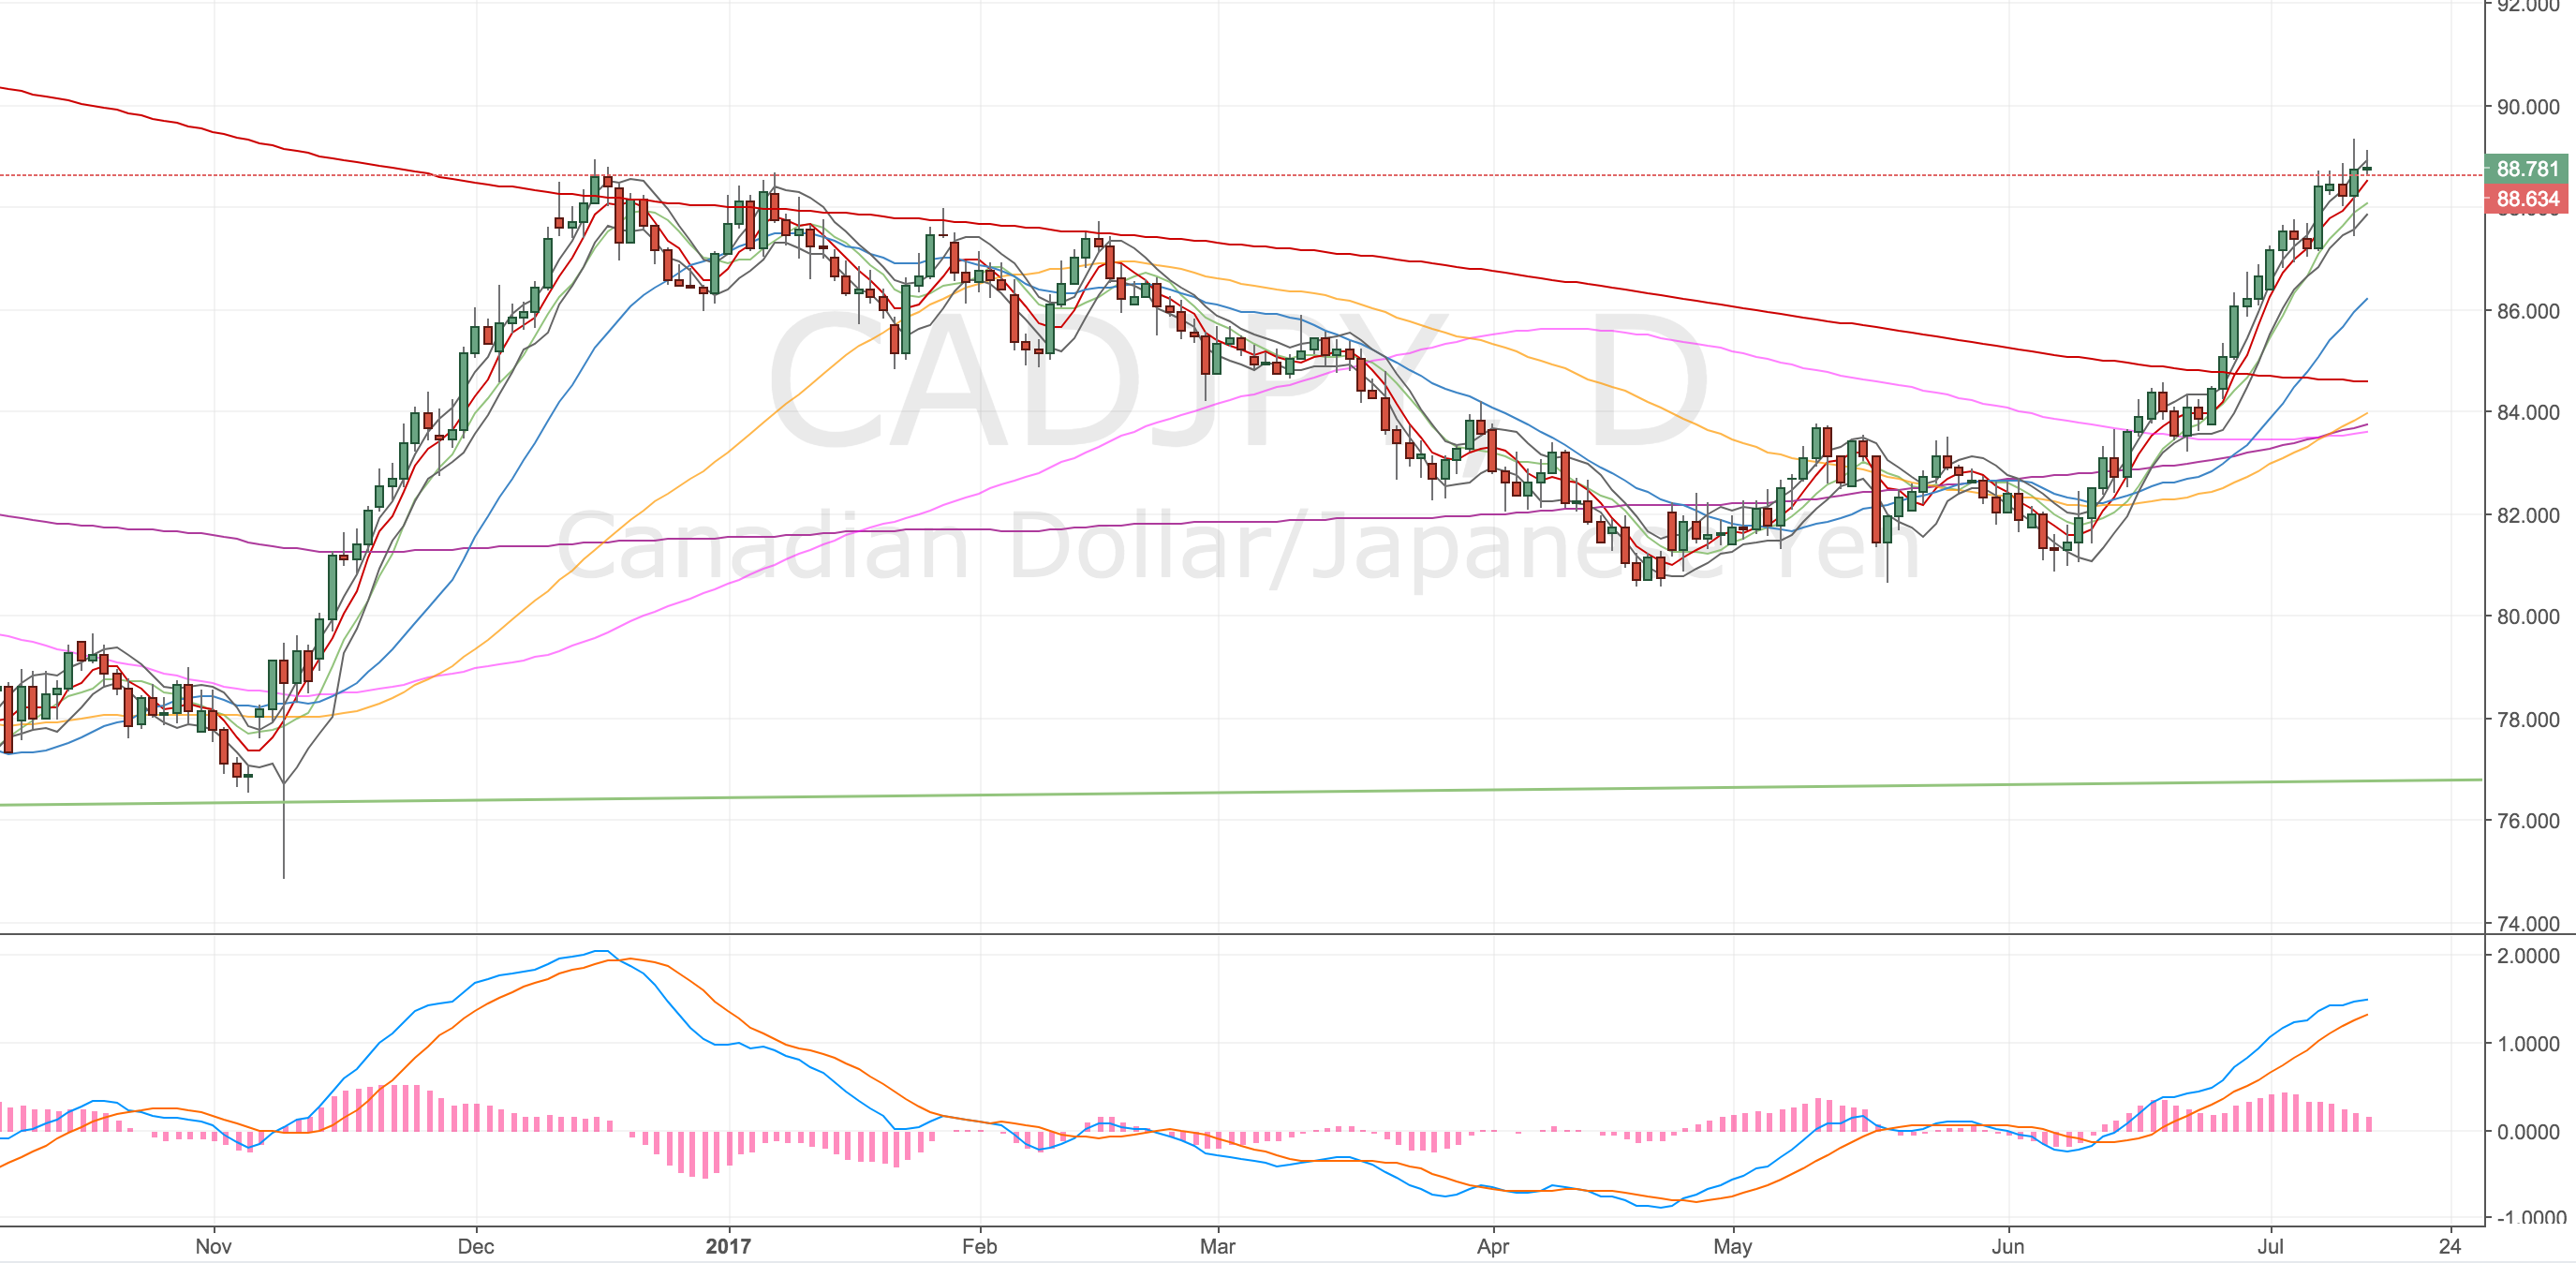
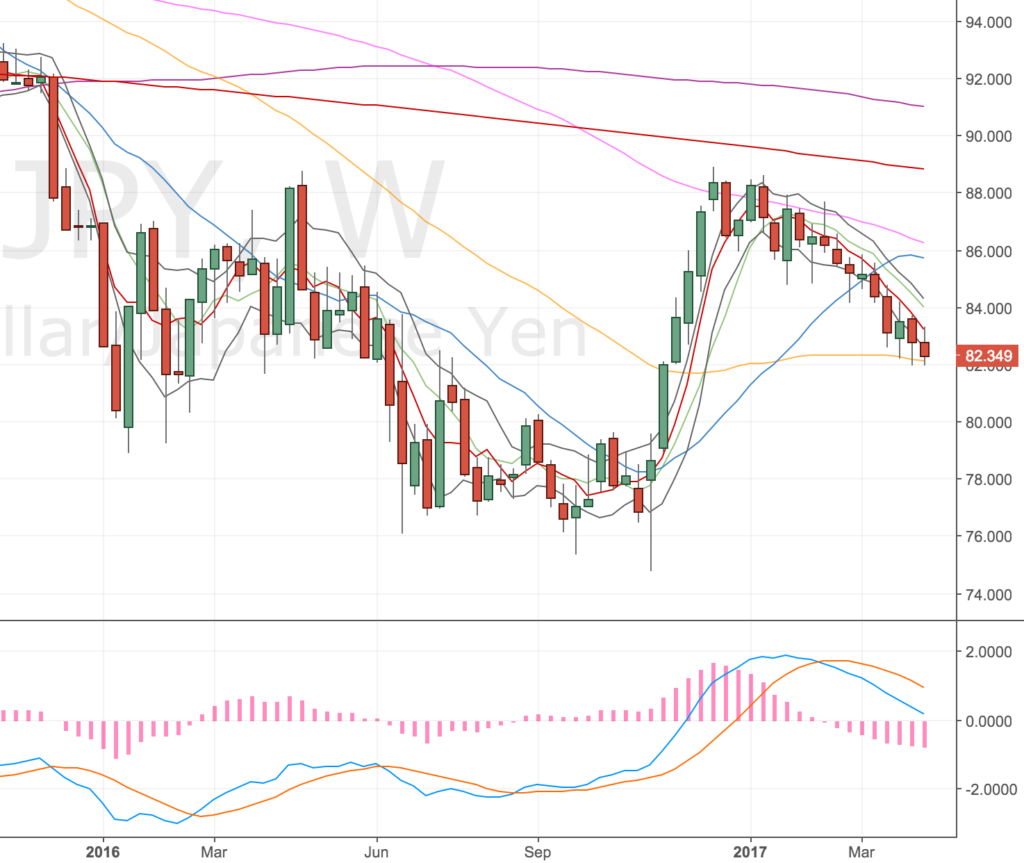
Weekly Chart
Weekly divergence has formed but not yet played out.
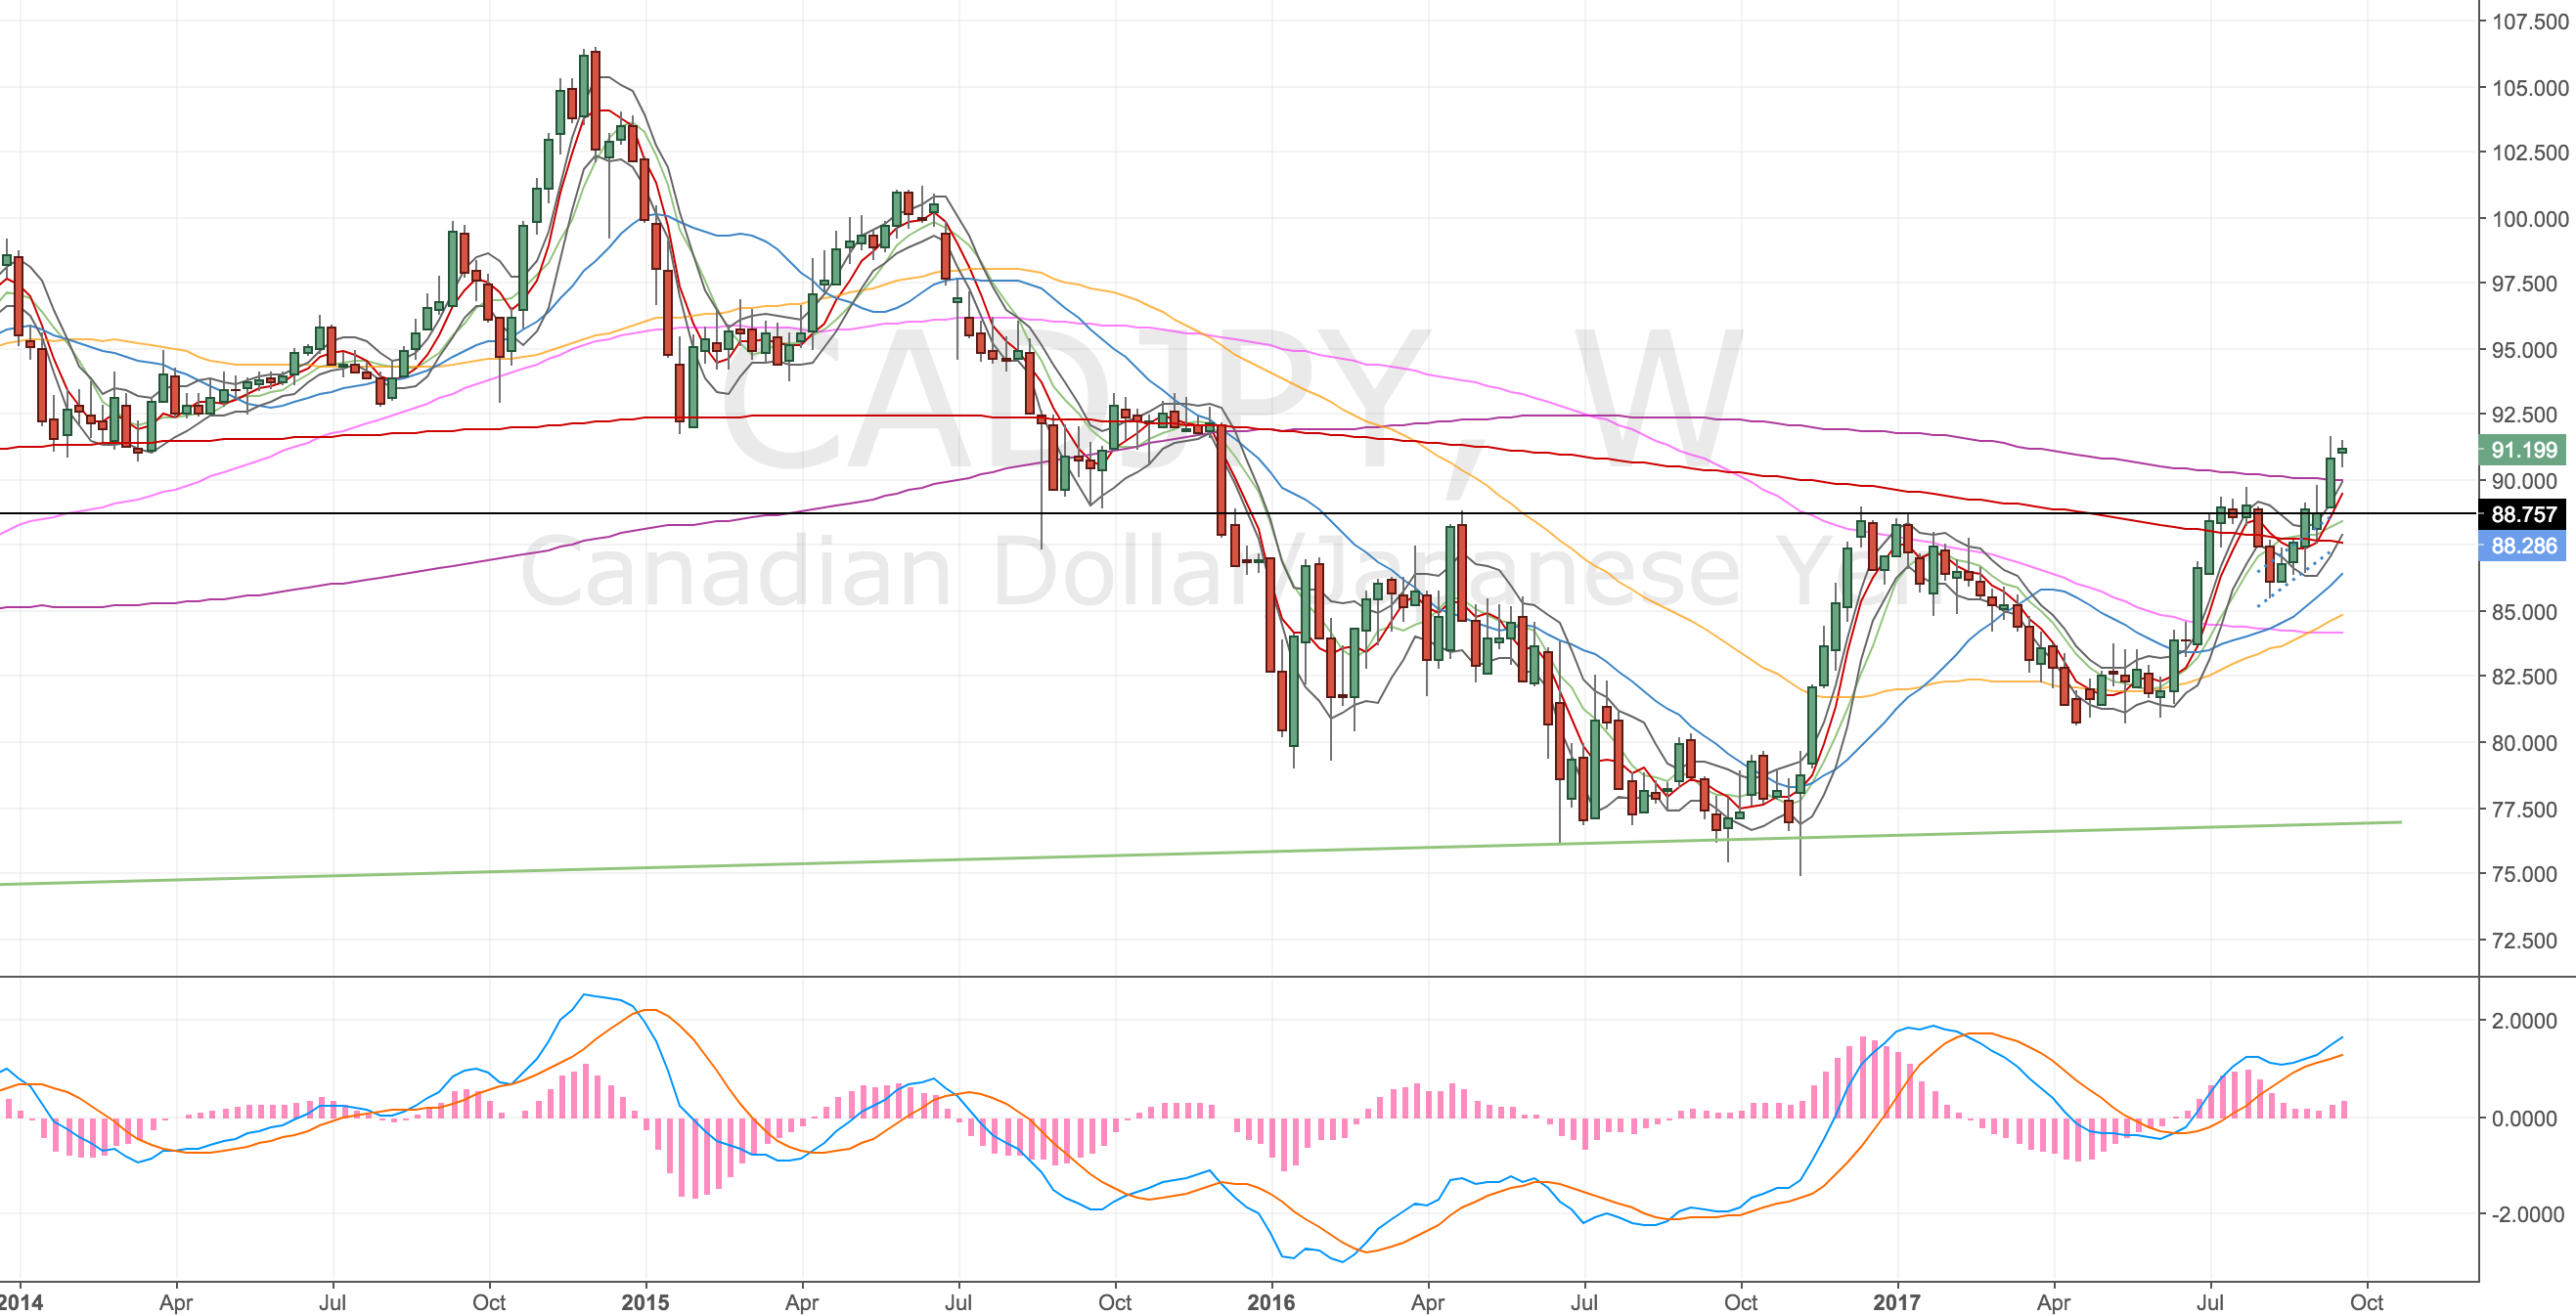
CADJPY Weekly Chart – 21 Sep 17
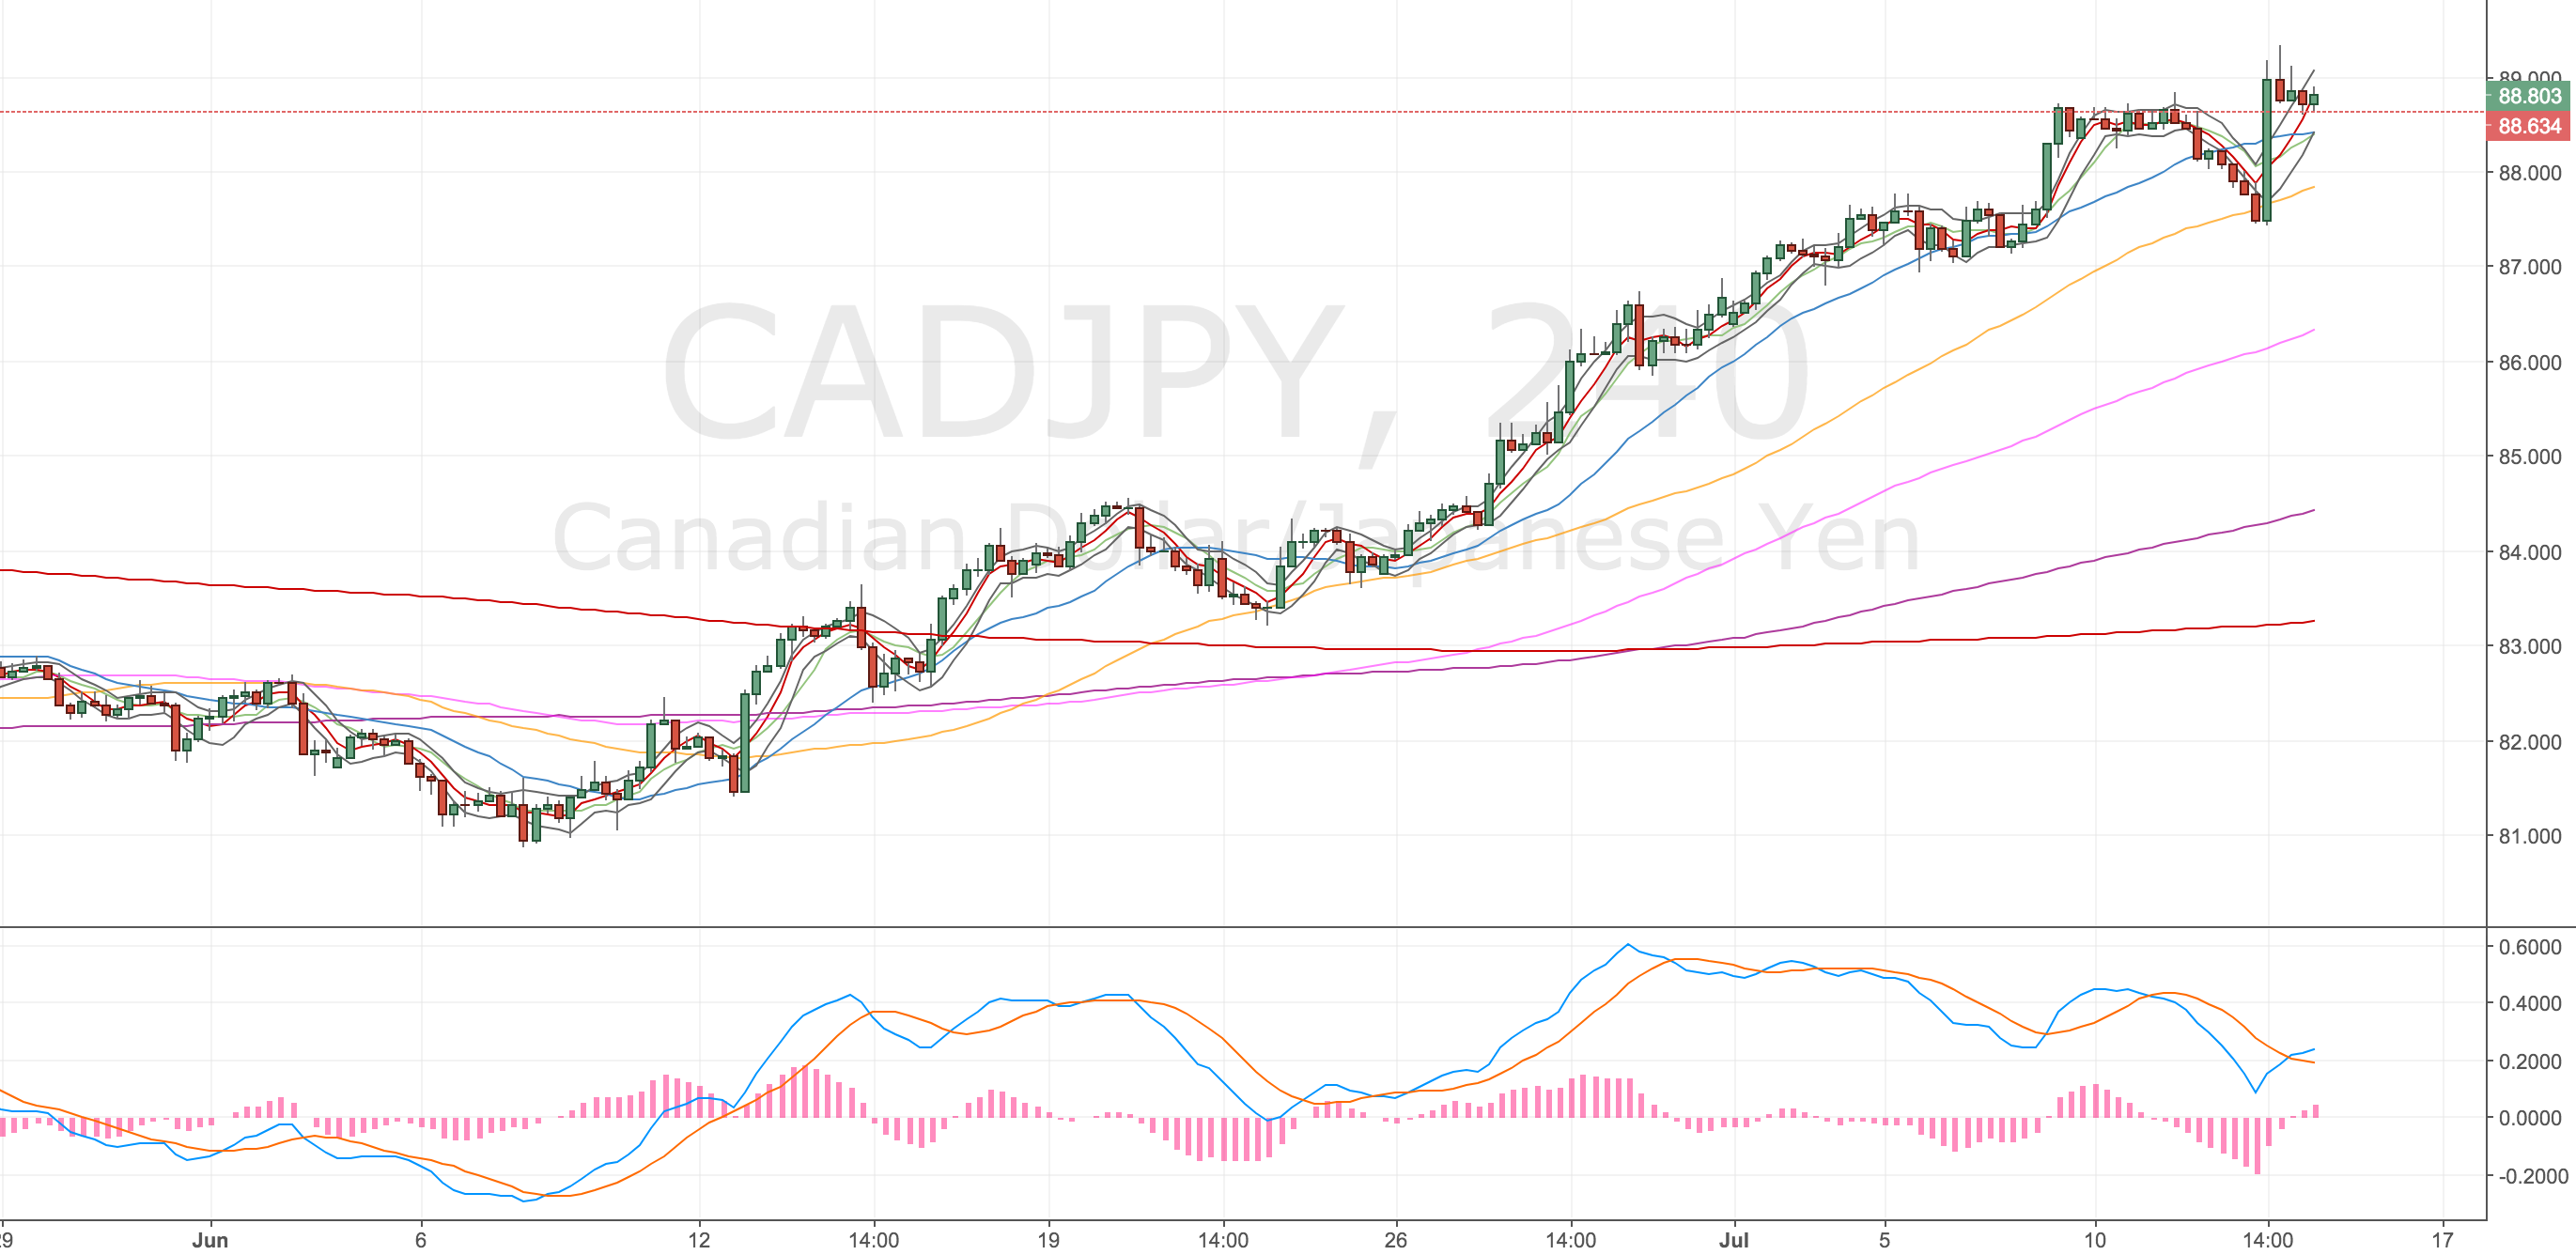
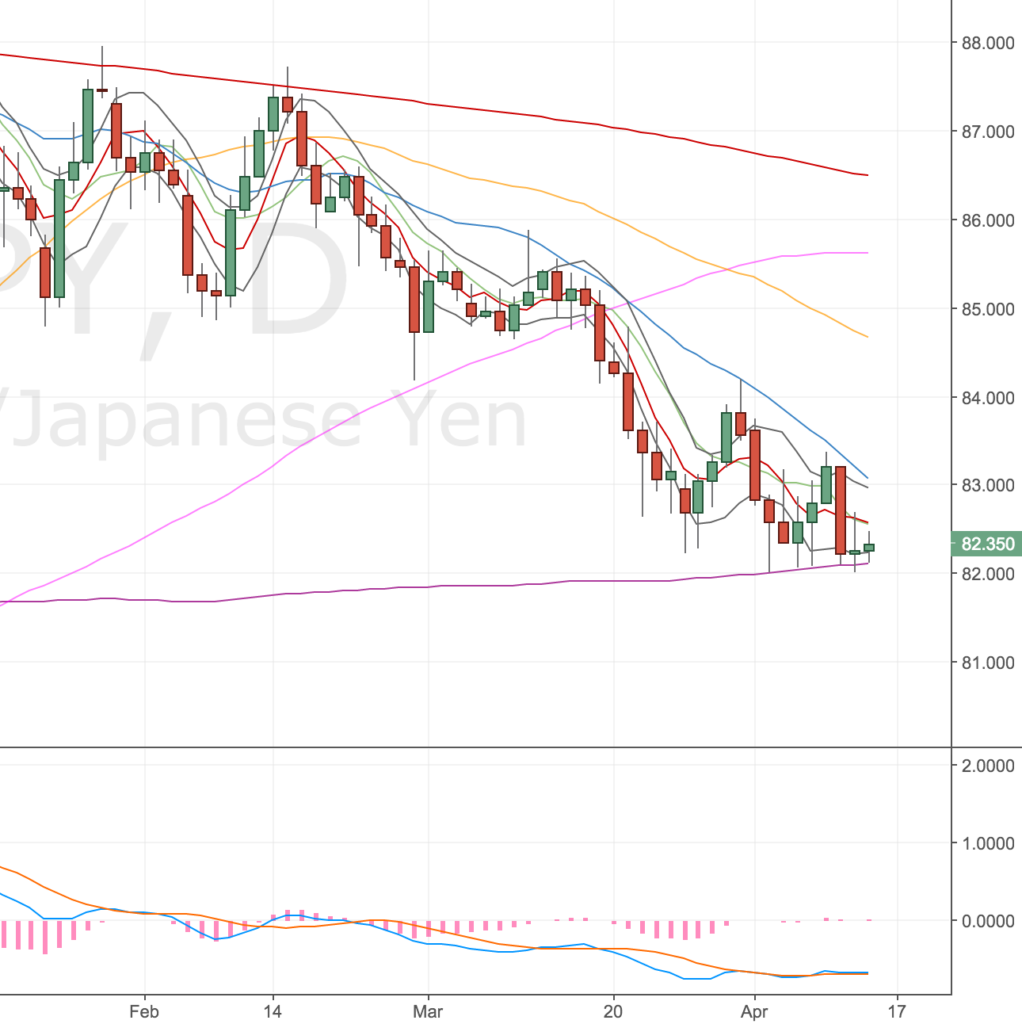
Daily Chart
Daily double divergence in play
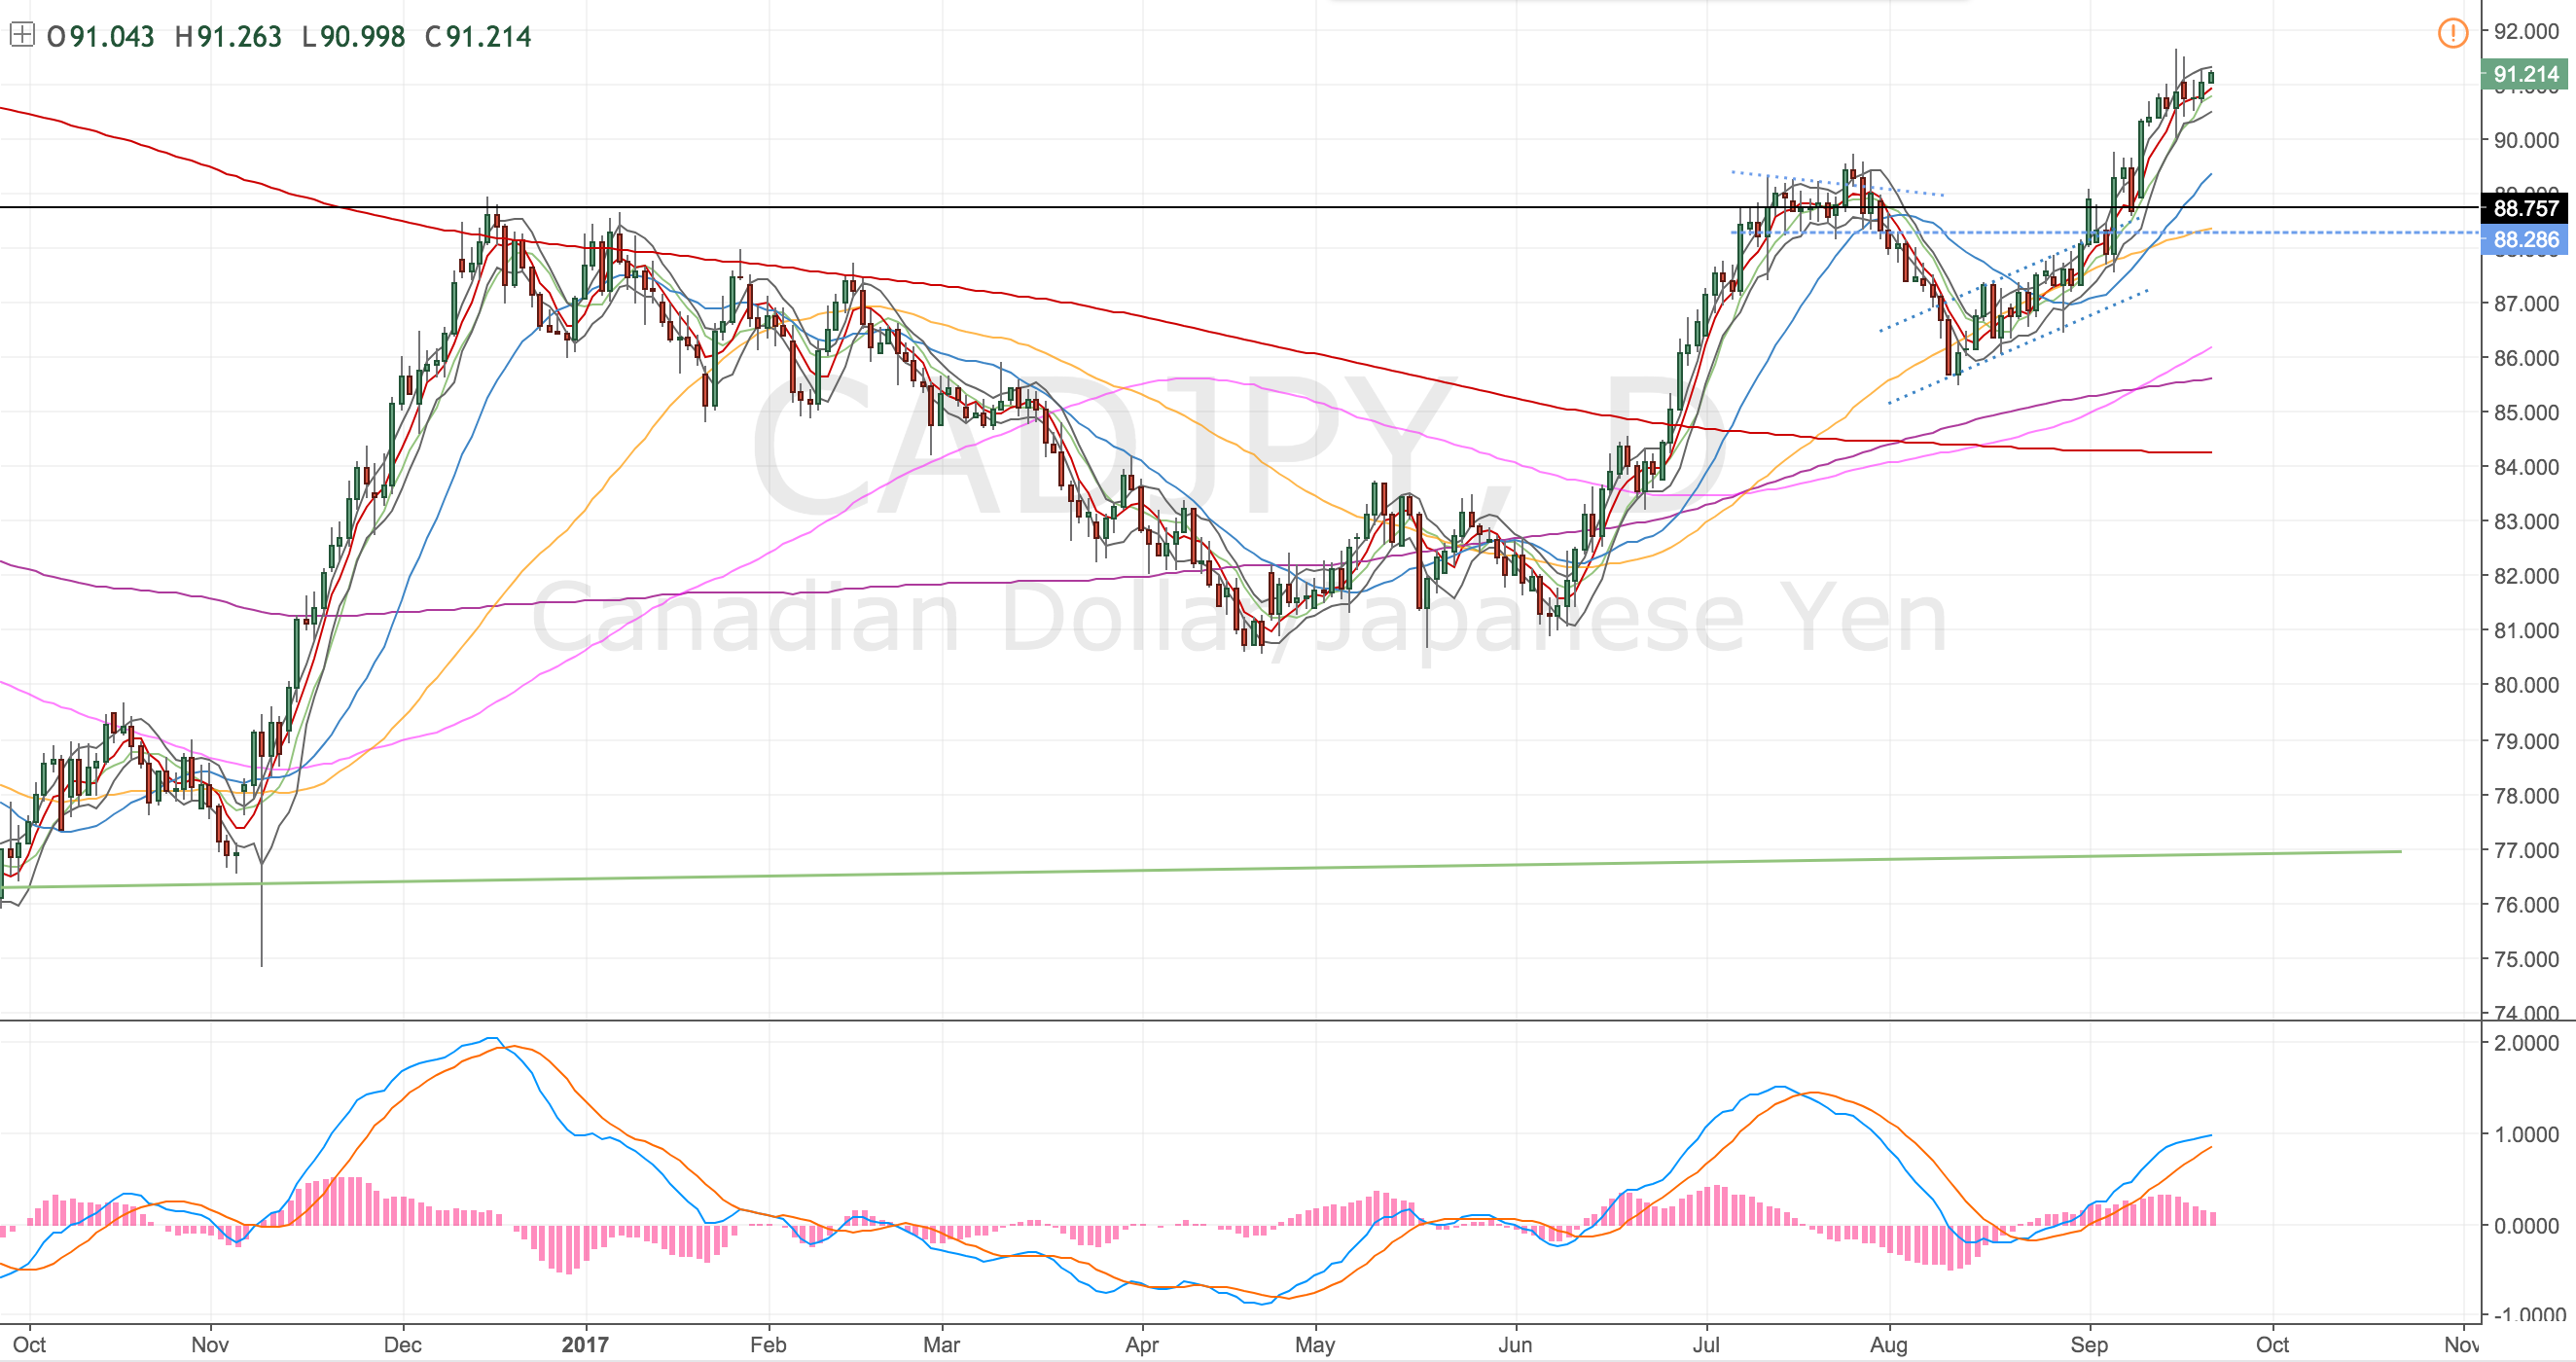
CADJPY Daily Chart – 21 Sep 17
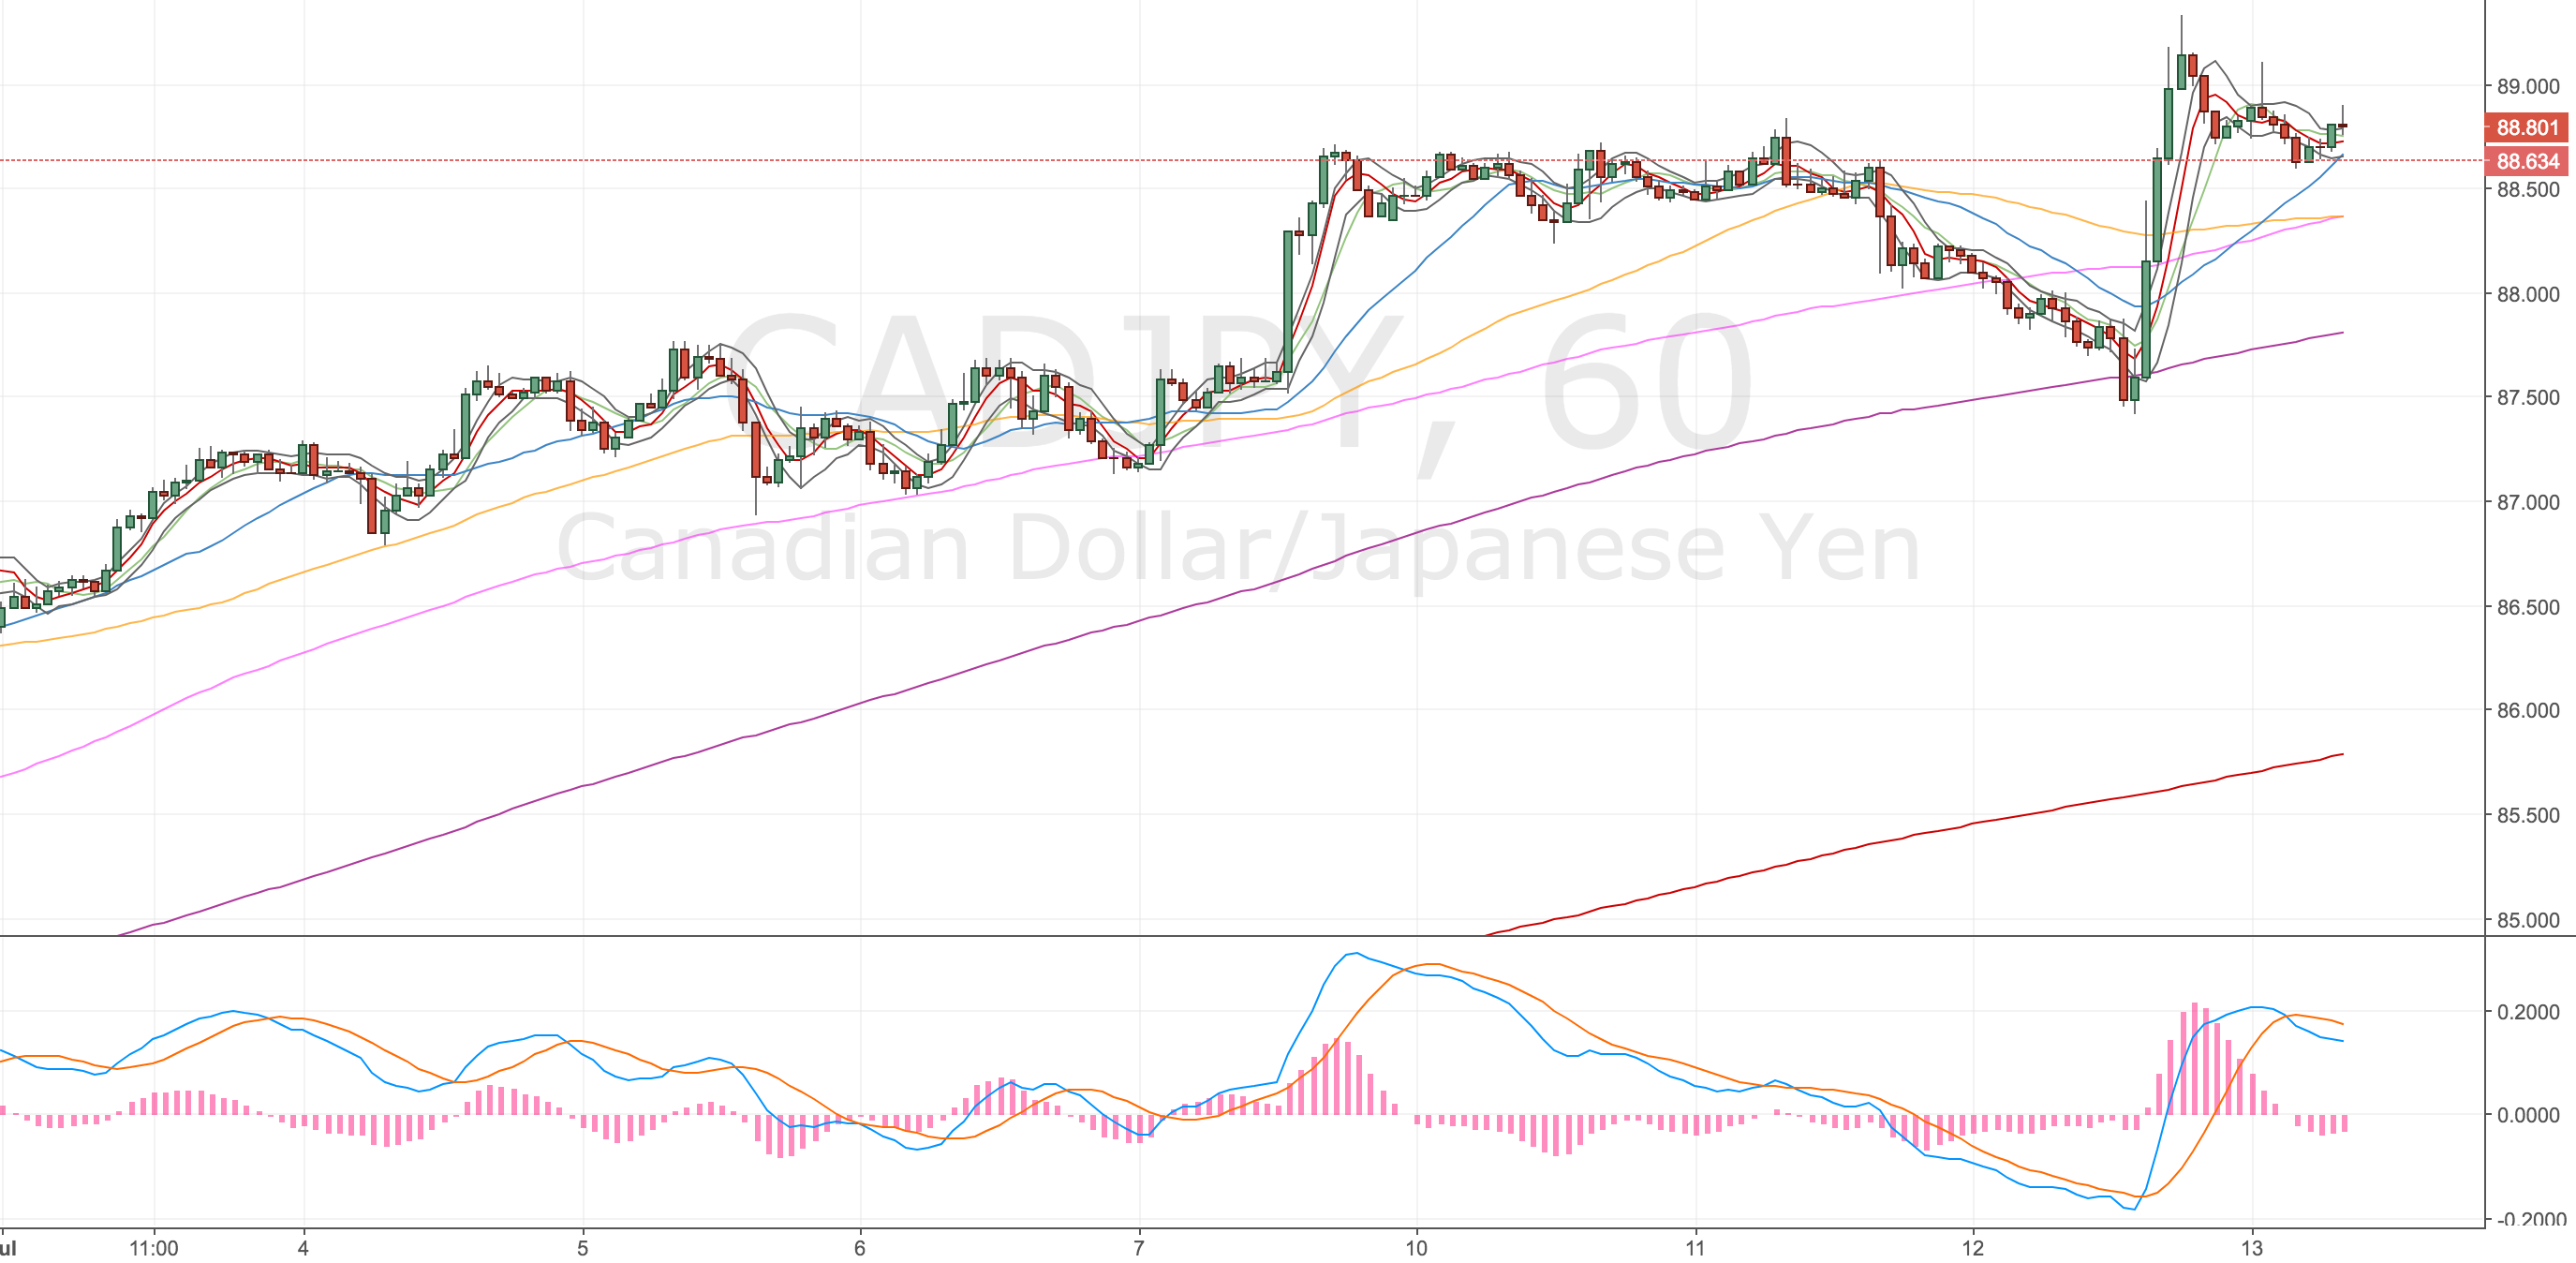
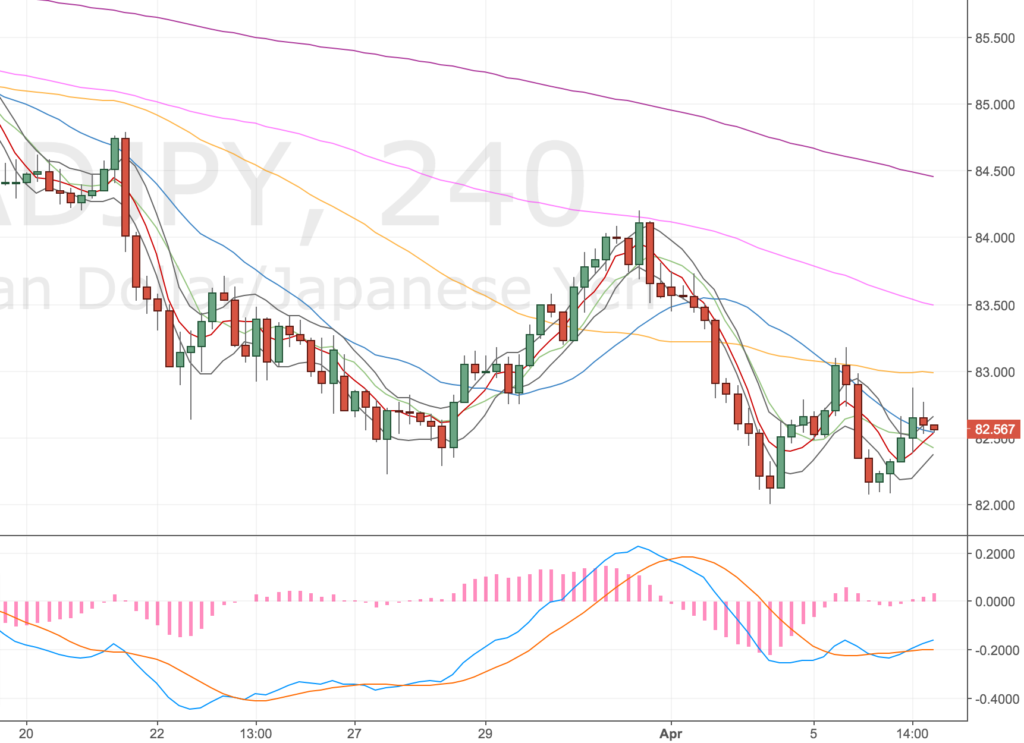
4H Chart – set up
Single divergence – possible double may form.
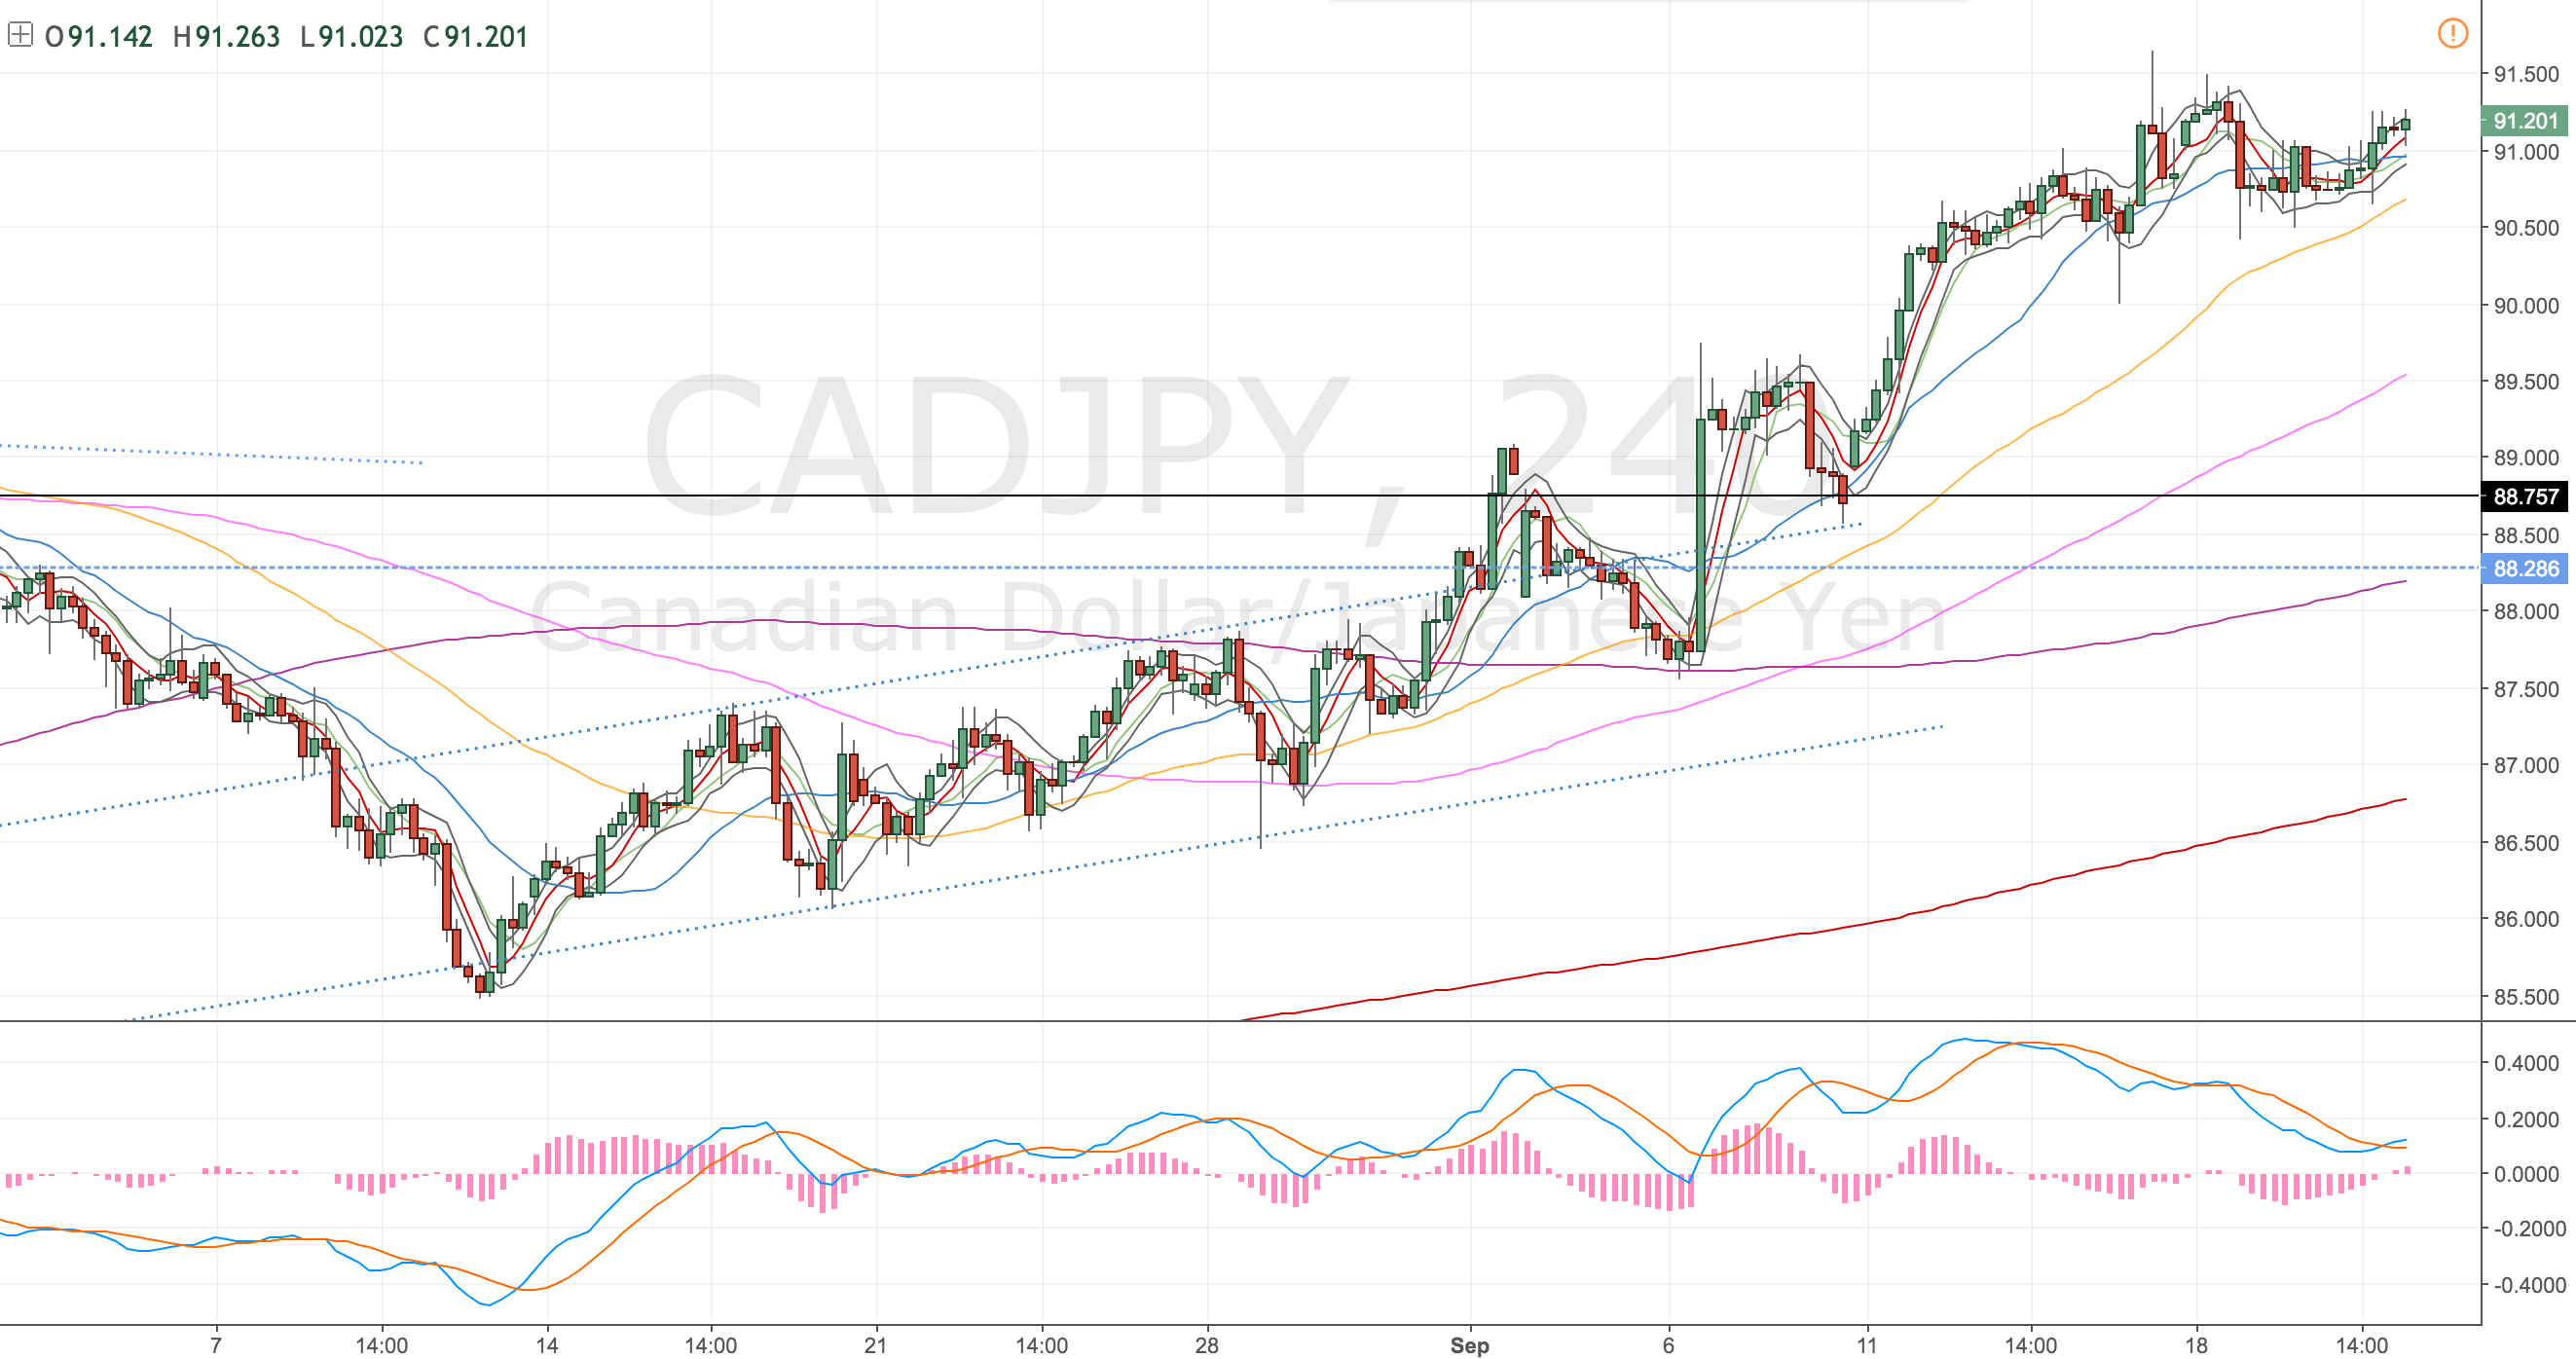
CADJPY 4H Chart – 21 Sep 17
Hourly Chart
Double divergence confirmation.
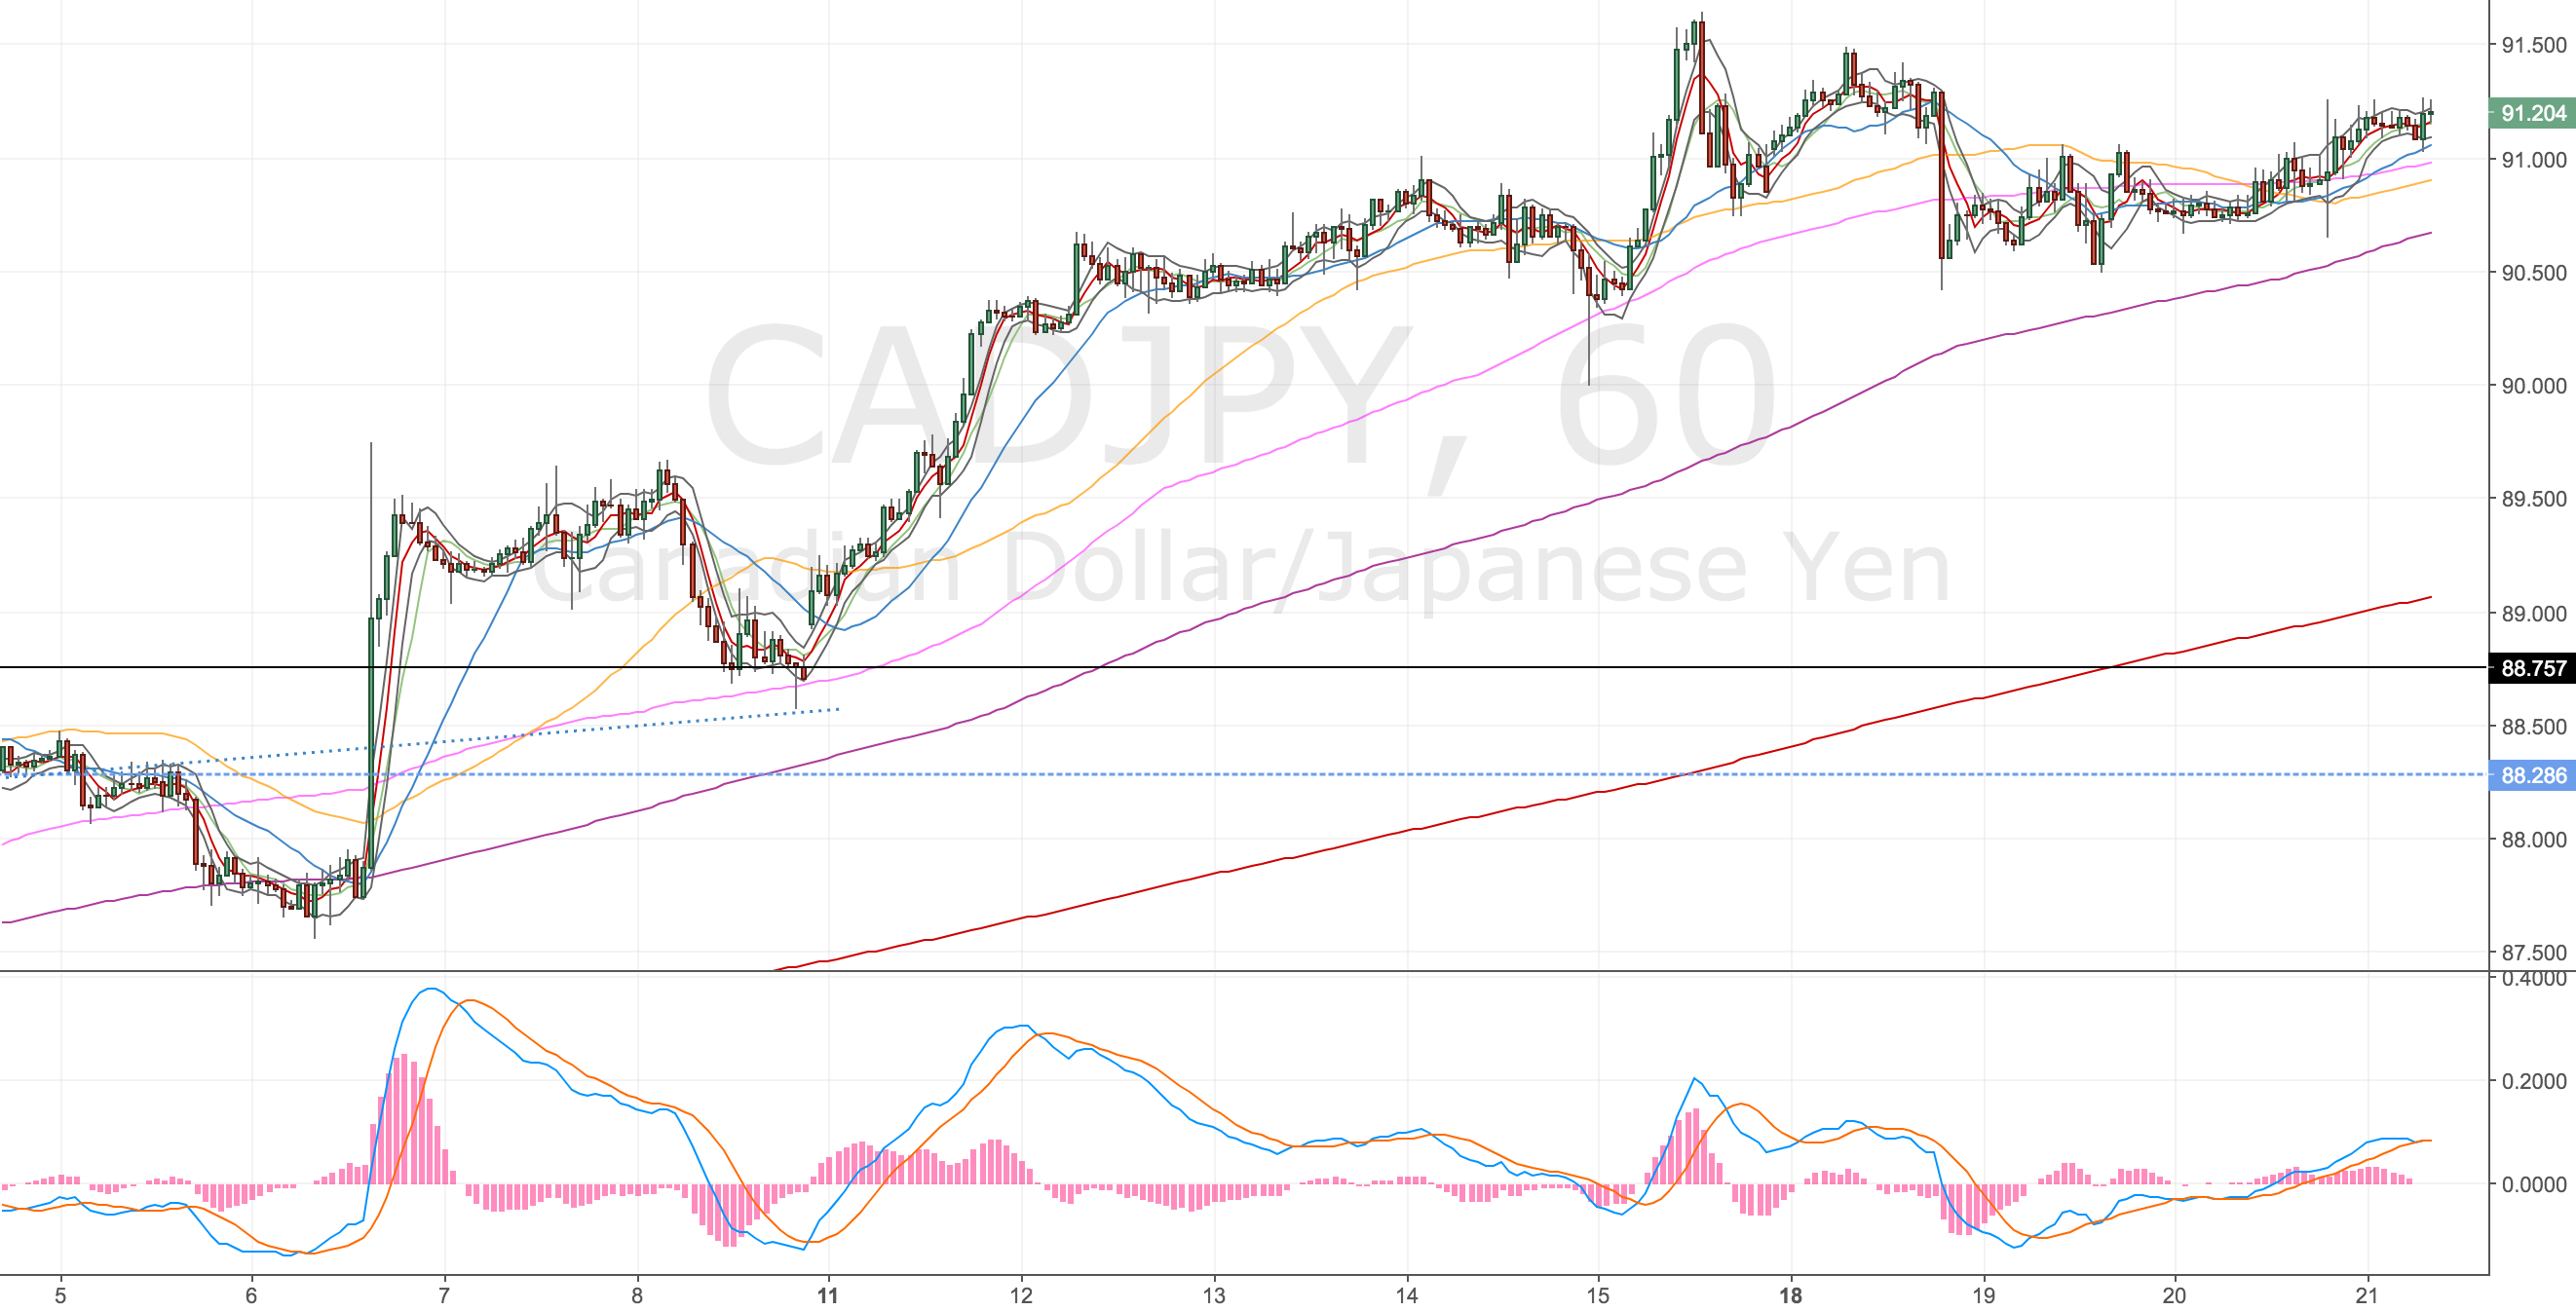
CADJPY H Chart – 21 Sep 17
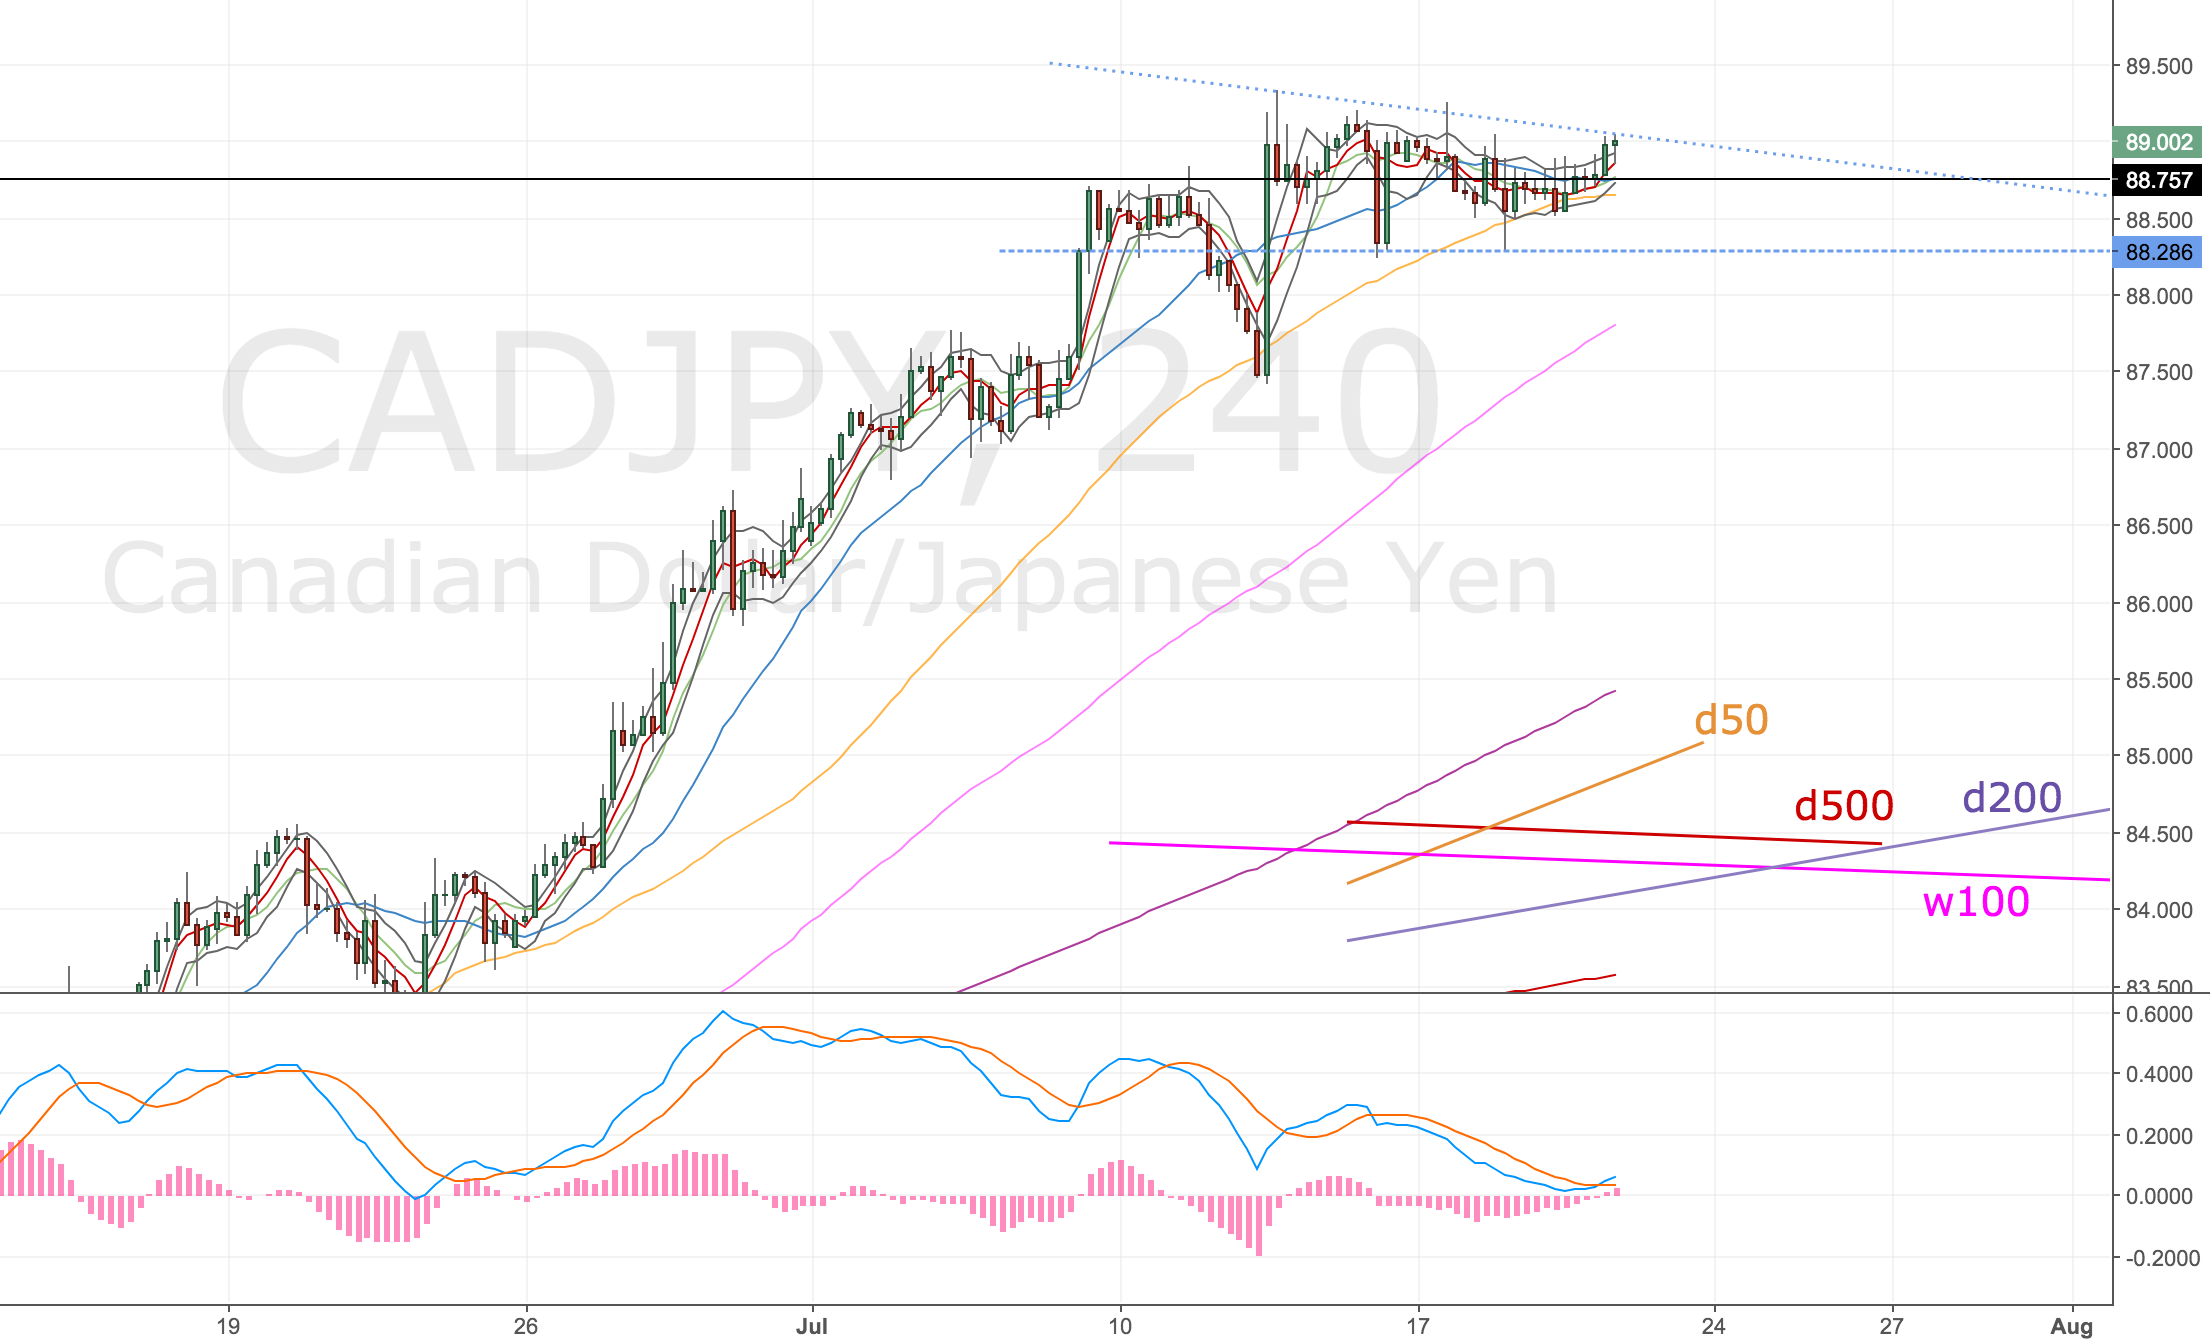
Wedge forming on the hourly with divergence – 22 Sep
Noticed there’s a wedge forming on the hourly chart – which has some short divergence. We’re heading into CAD CPI news, so I’m expecting an answer on this trade sooner or later.
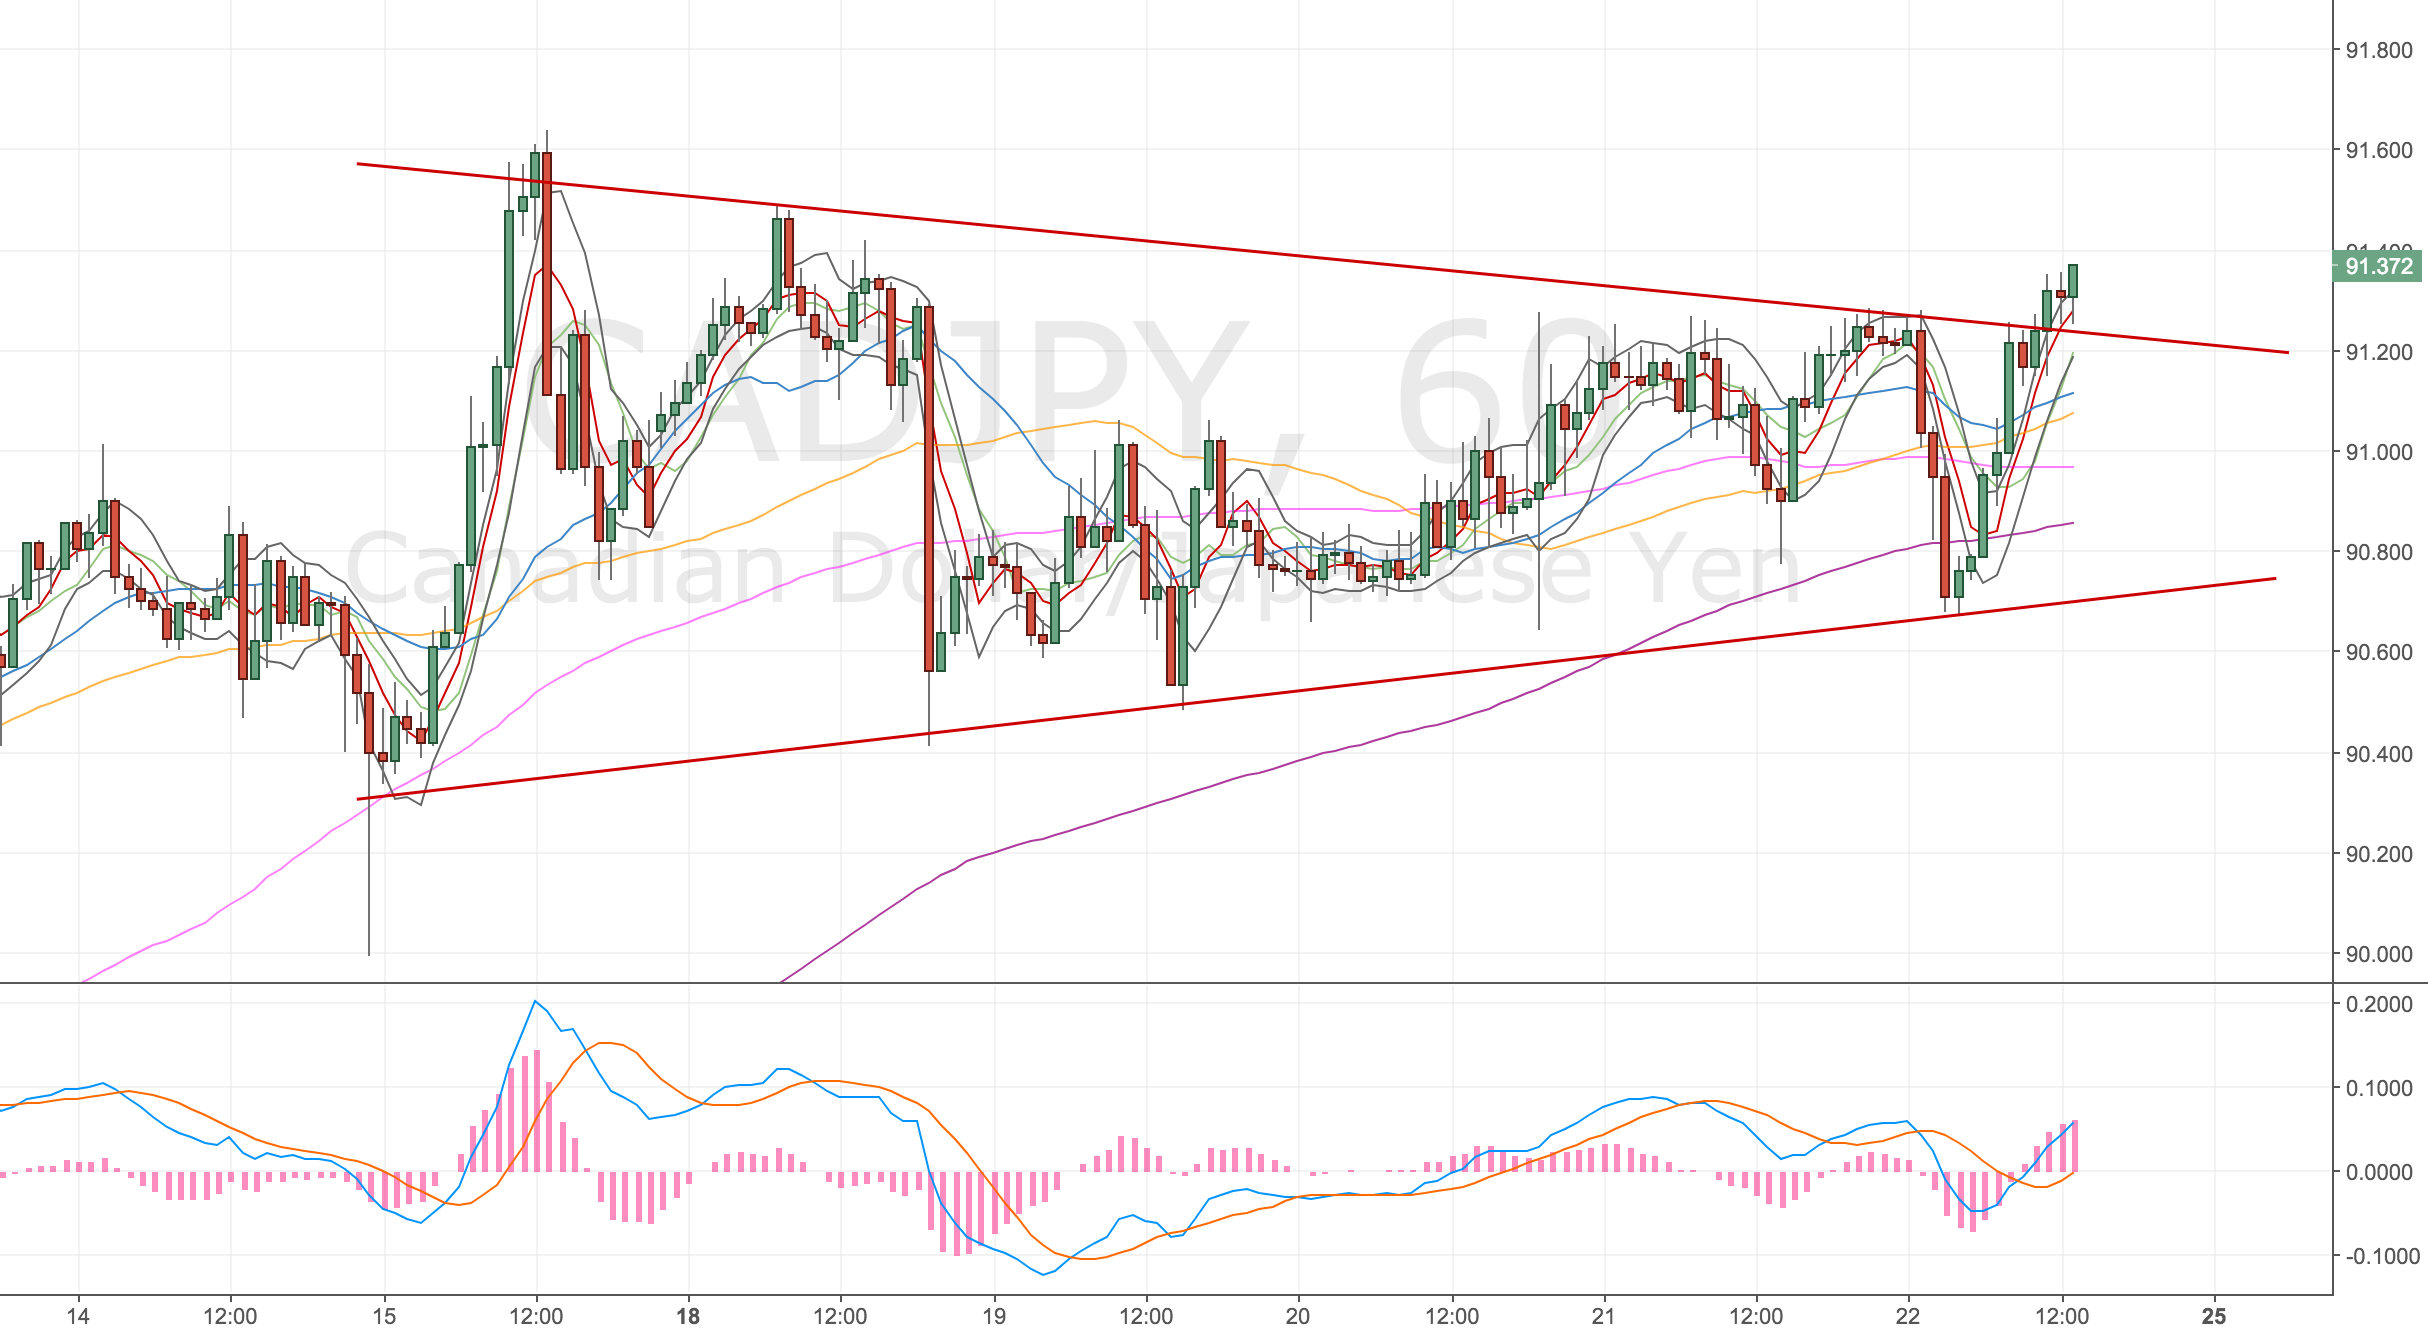
CADJPY Hourly Chart – 22 Sep 17
I’m a little nervous about holding this position over the weekend, with N Korea firing missiles over Japan it’s pretty likely we can see gaps over the weekend against me.
Closing part of the trade – 13 Oct
It’s been a while since I updated this post, the trade has been meandering down to my target, but it’s taking ages. My charges are creeping up all the time, now about 10% of the total profit is on charges alone! I might try trading a currency futures market instead of the rolling daily charts.
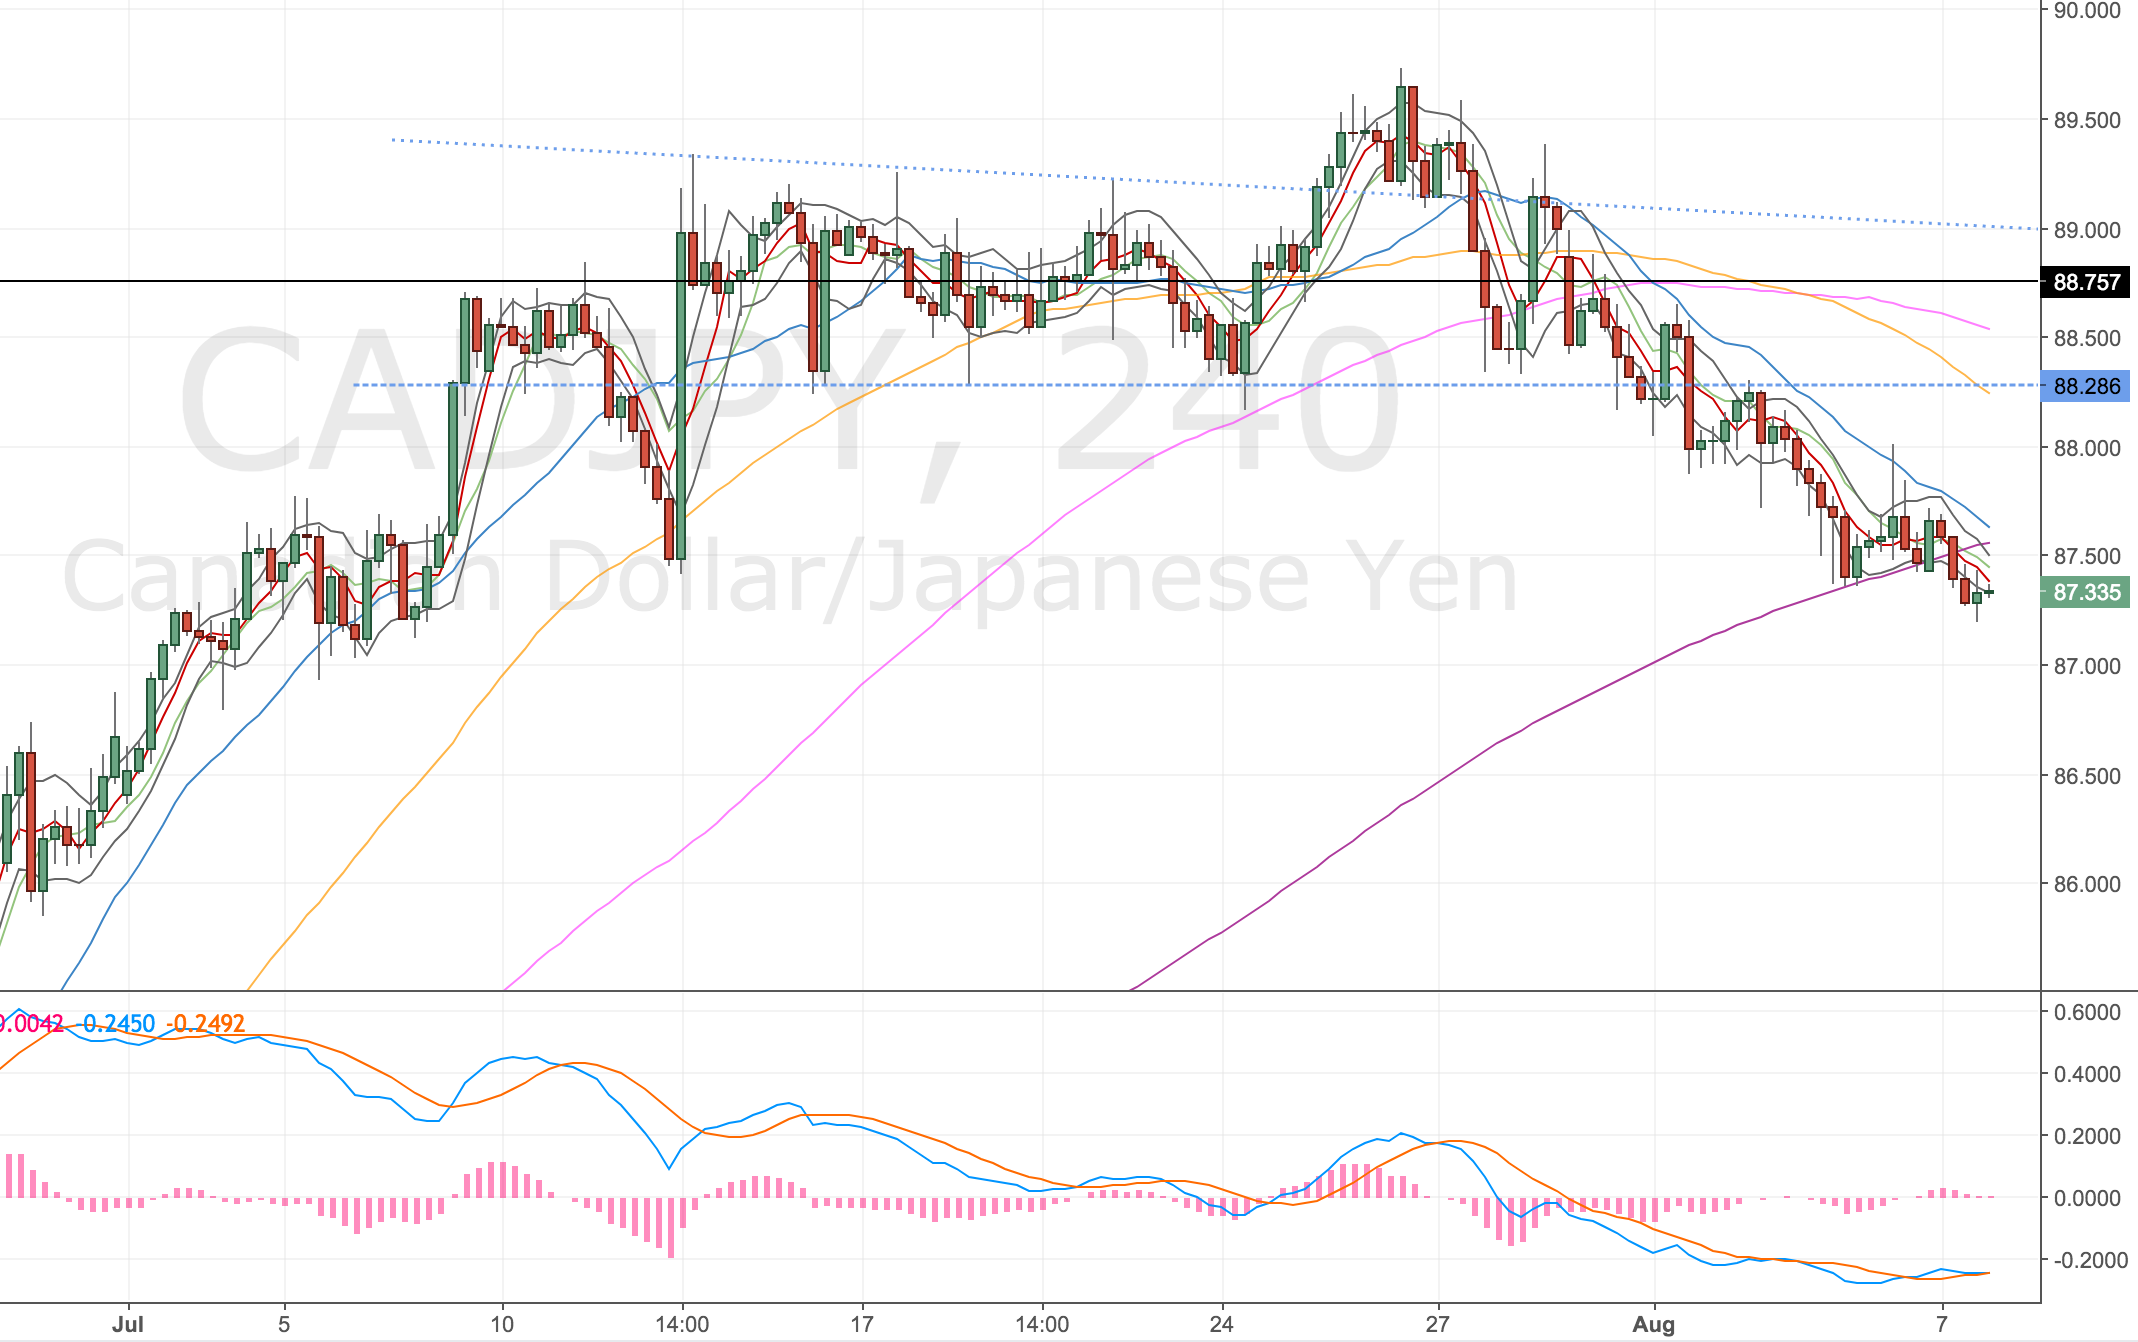
CADJPY 4h chart – 13 Oct 17
Price has come down to the 4h200 which also corresponded with a trenline, I had an oppotunity to close here earlier in the week but I didn’t choosing to hold for the d50. However I can see divergence creeping into the chart and we’ve not had a test of the upper wedge for a long time. So I’ve decided to protect my position.
I wanted to close half of my position here but minimum position sizes mean I have to close 2/3rds. So I’m banking 153 pips now. Will hold the remainder and watch price action. Still undecided about whether to target the d50 or w50/w500.
just an observation here, my indecision about my target probably means I’m going to pick the nearer one
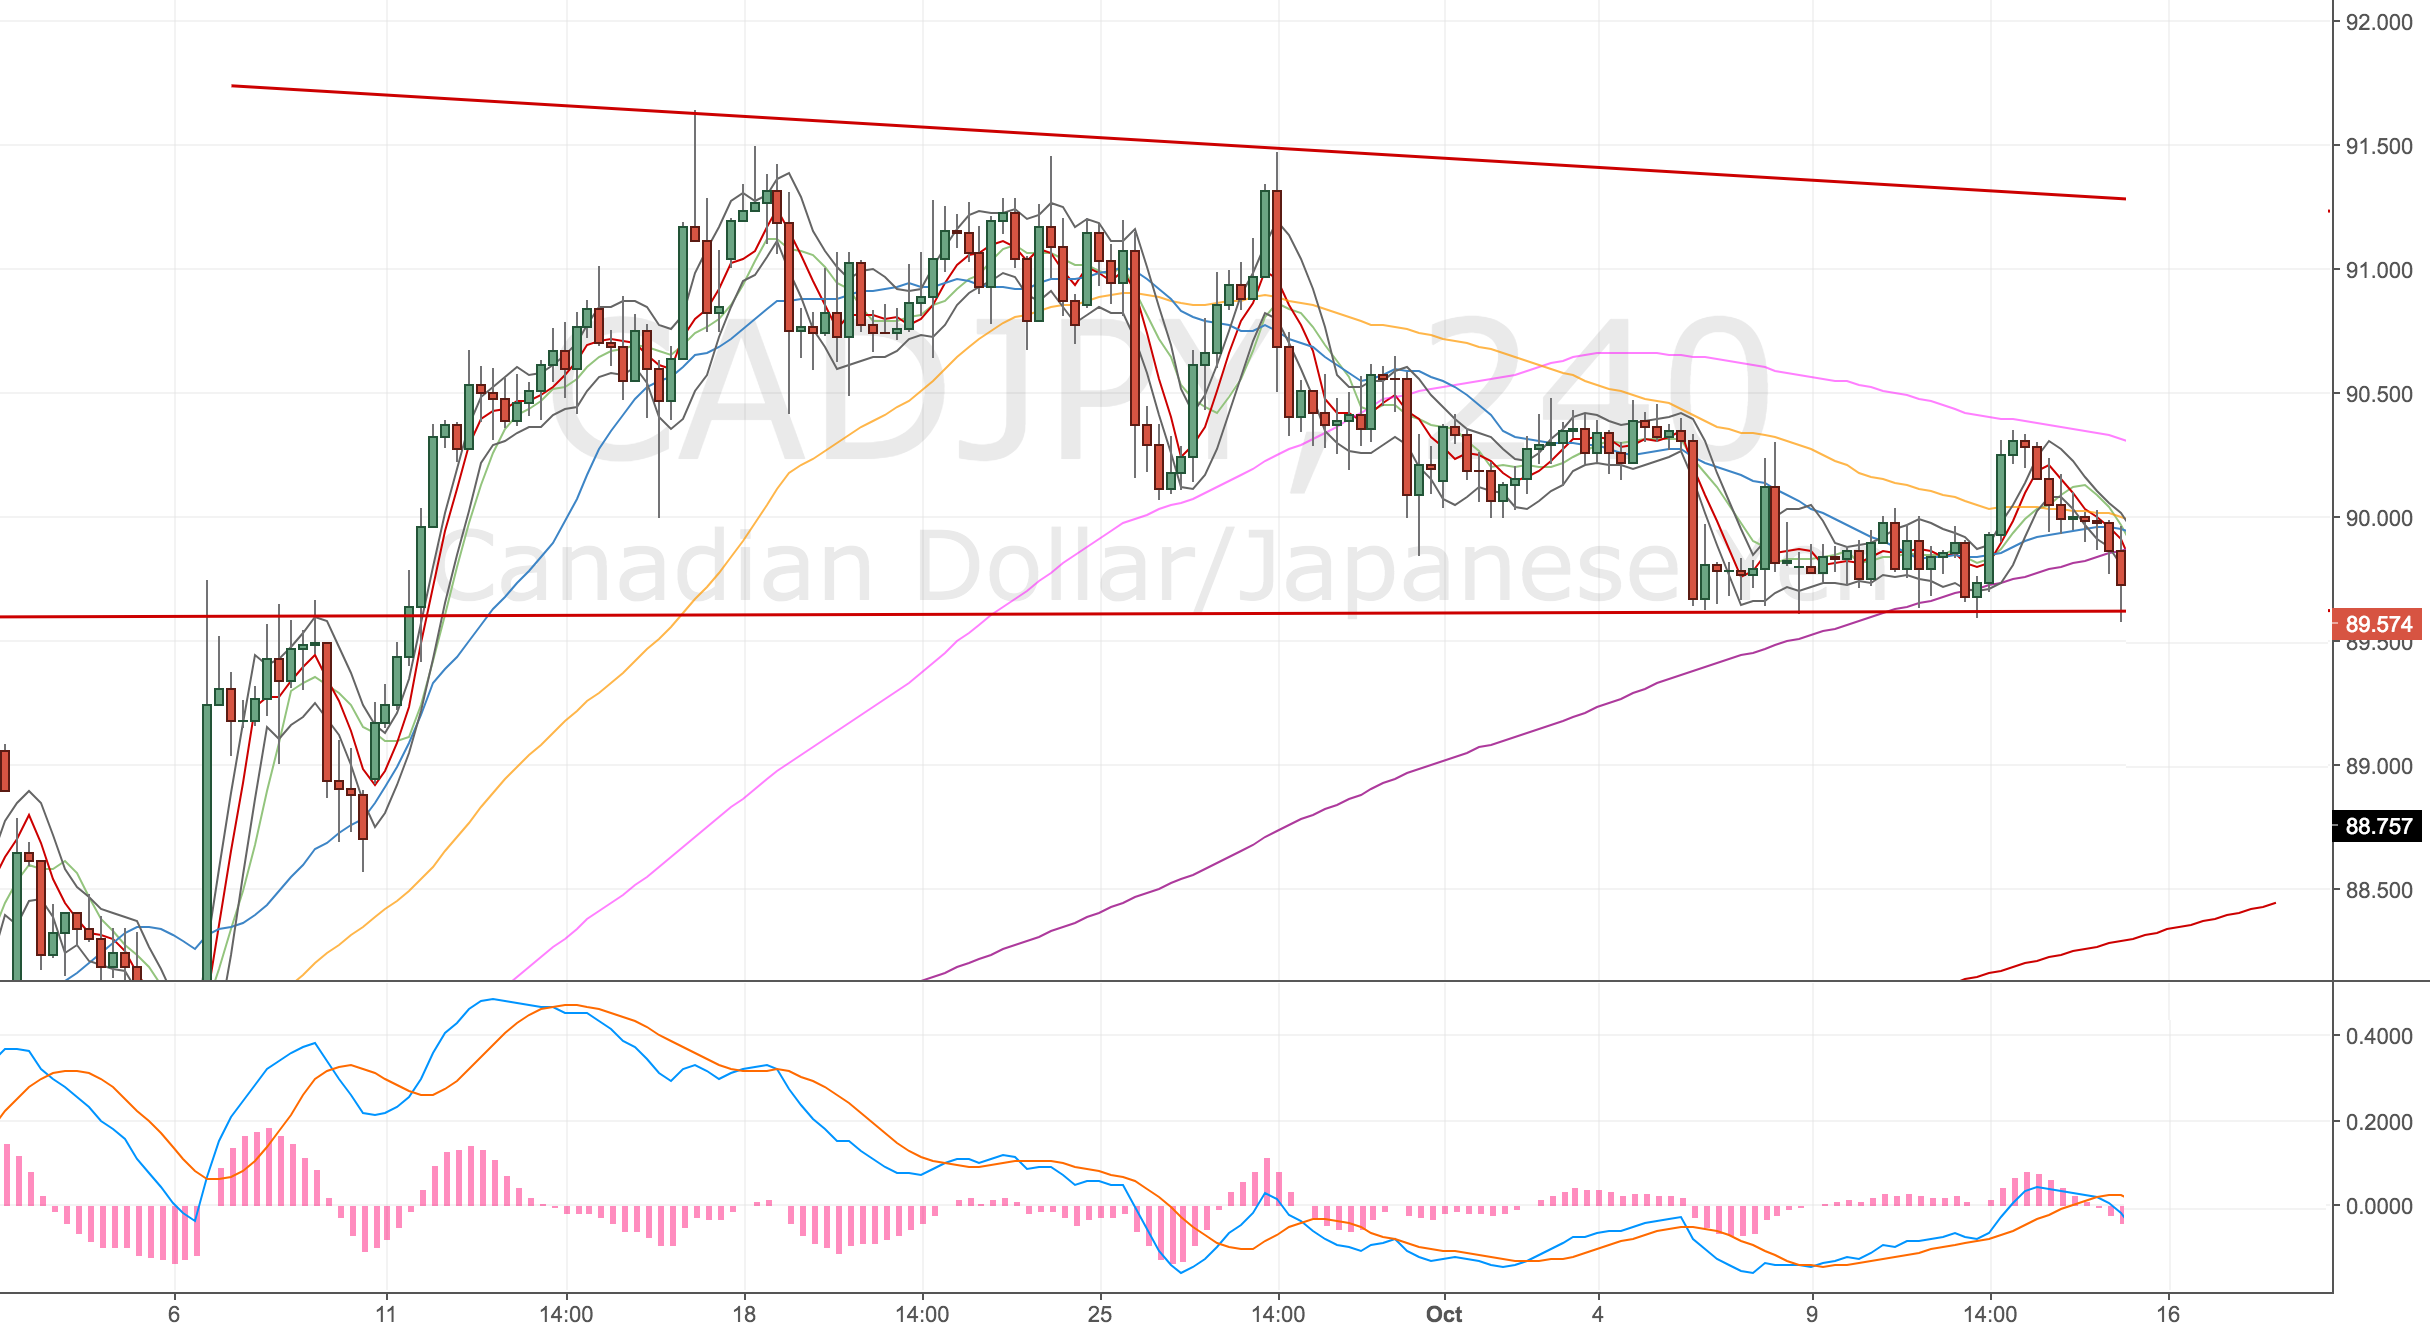
Taking my first hedge – 15 Oct
We’ve got a long divergence confirmed, we’re near the d50 but far enough away for me to take a chance. It’s pretty marginal but I find in patterns like this the divergences often get skewed. I also see this when price almost stretches down to touch an MA, the divergence doesn’t technically form but a divergence still happens.
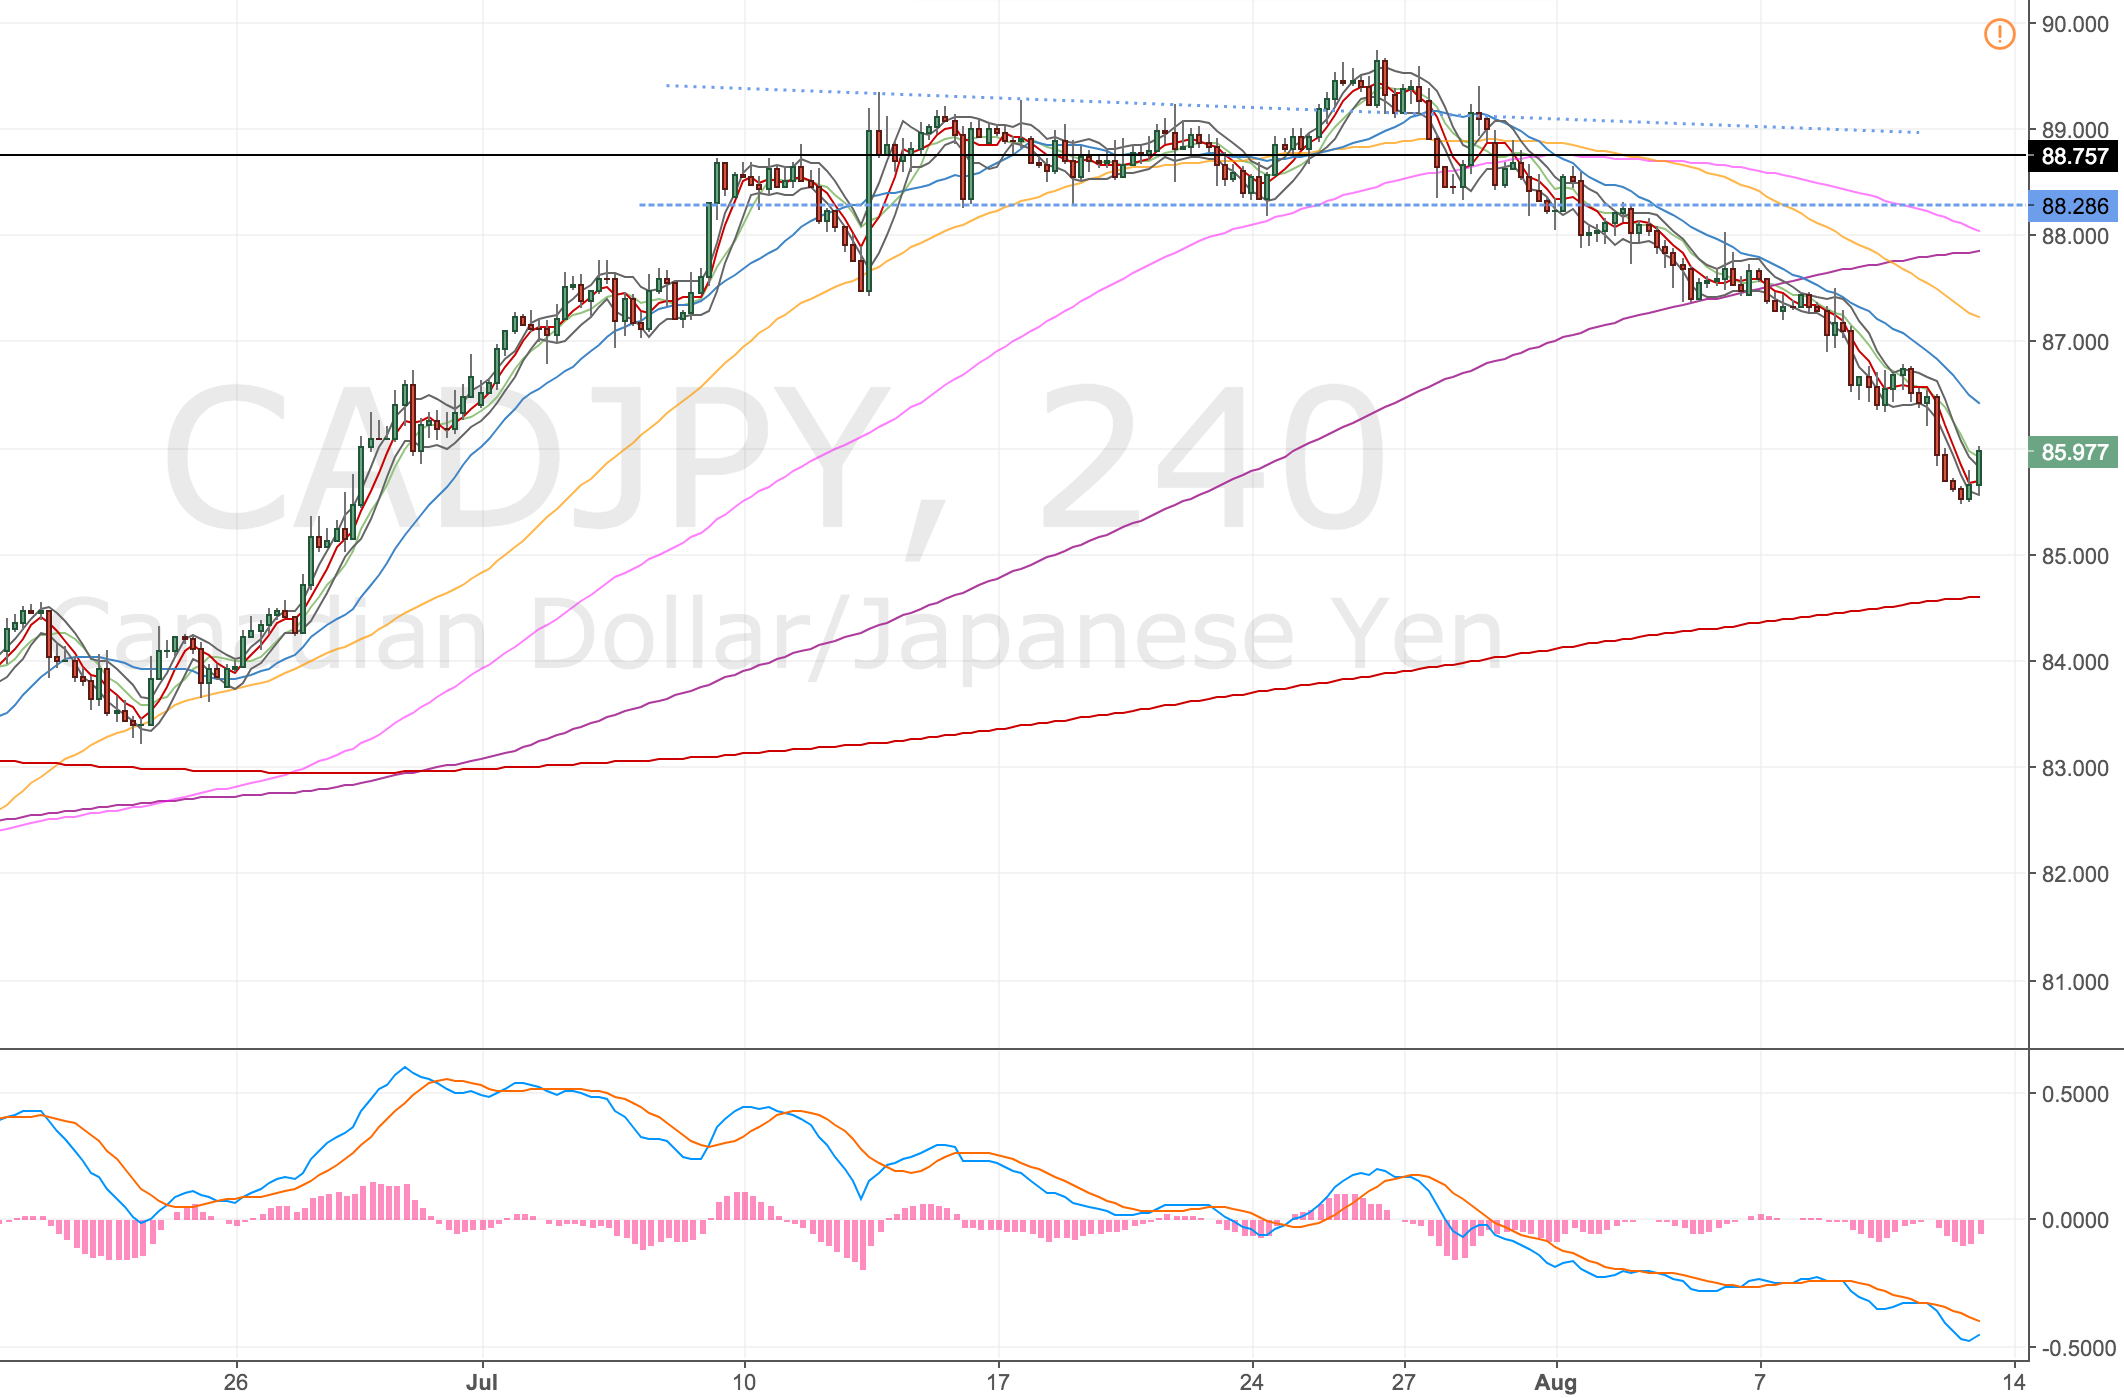
CADJPY 4H Chart – 15 Oct 17
Here’s the divergence, I’m looking to hedge my position now, taking a smaller 0.6% position size long, looking for a break of the 4h100 (as it’s been recently tested – air kiss?) and a move up to the upper trendline. I’ll keep my tiny 0.2% remaining position open.
Ops – 15 Oct
ETX didn’t let me hold two positions. It closed my short and netted out my long. Not what I wanted. I thought this might happen so I adjusted the position size slightly to compensate, but now I’m only long!
Acc risk: 0.5%
Long: 89.73
Stop: 89.25 (48 pips)
Target: TBC – 4h100/PH as a minimum (60 pips)
Mindset: Excited to be taking my first hedge!
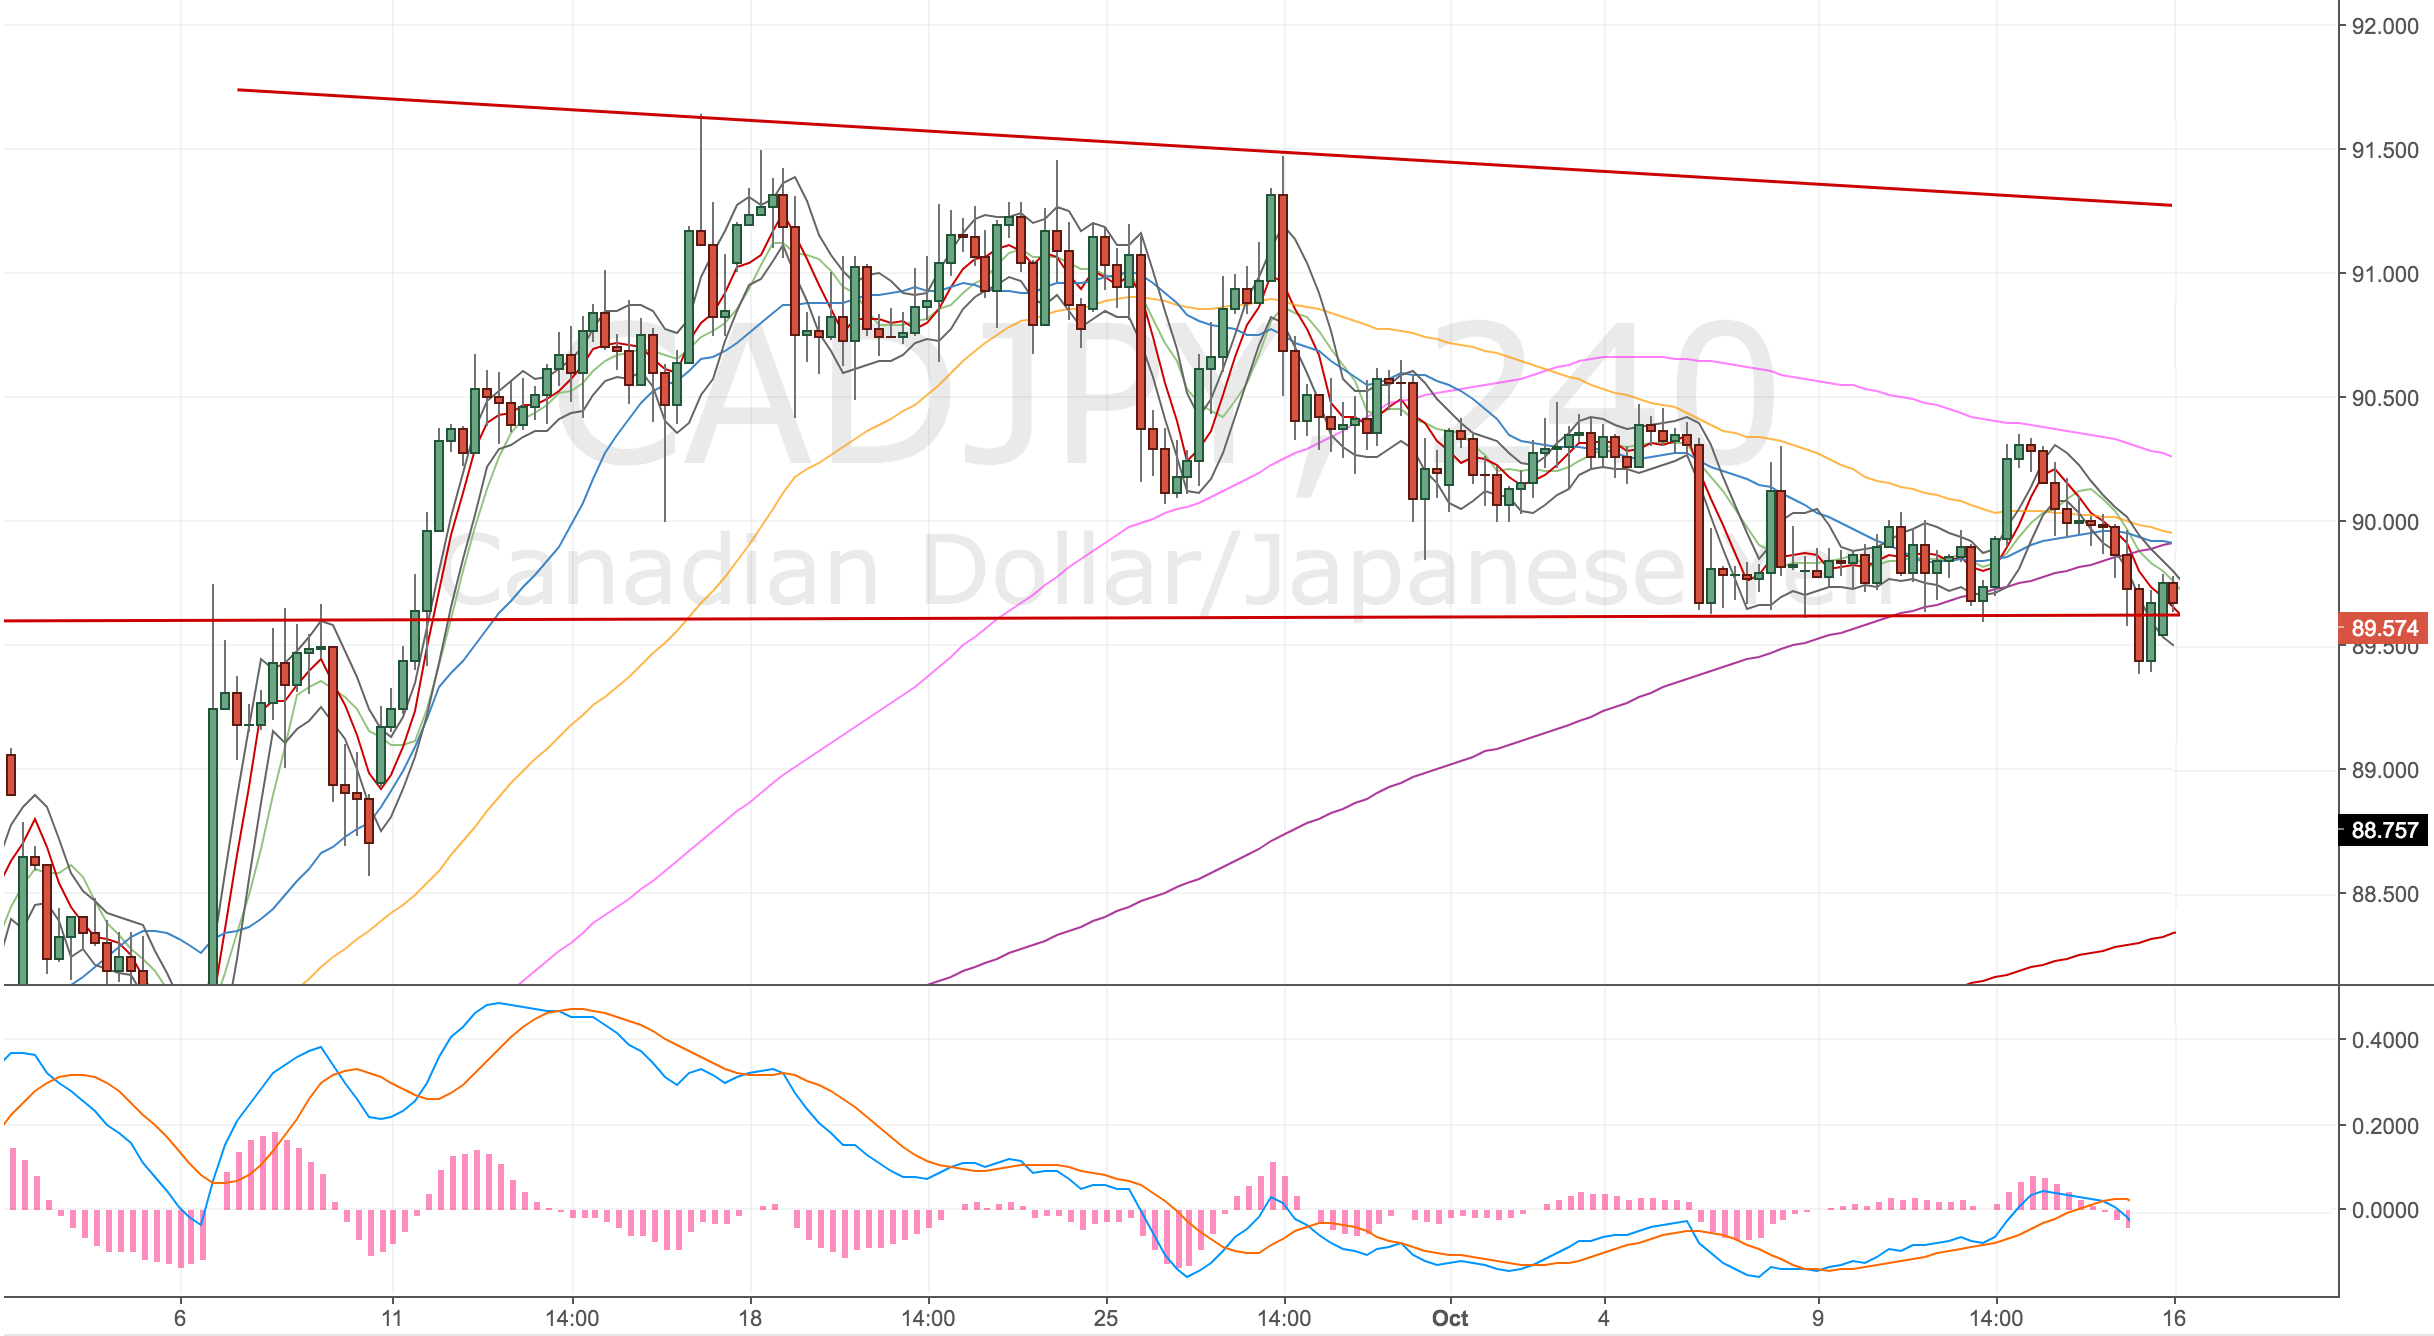
Hedging again – 17 Oct
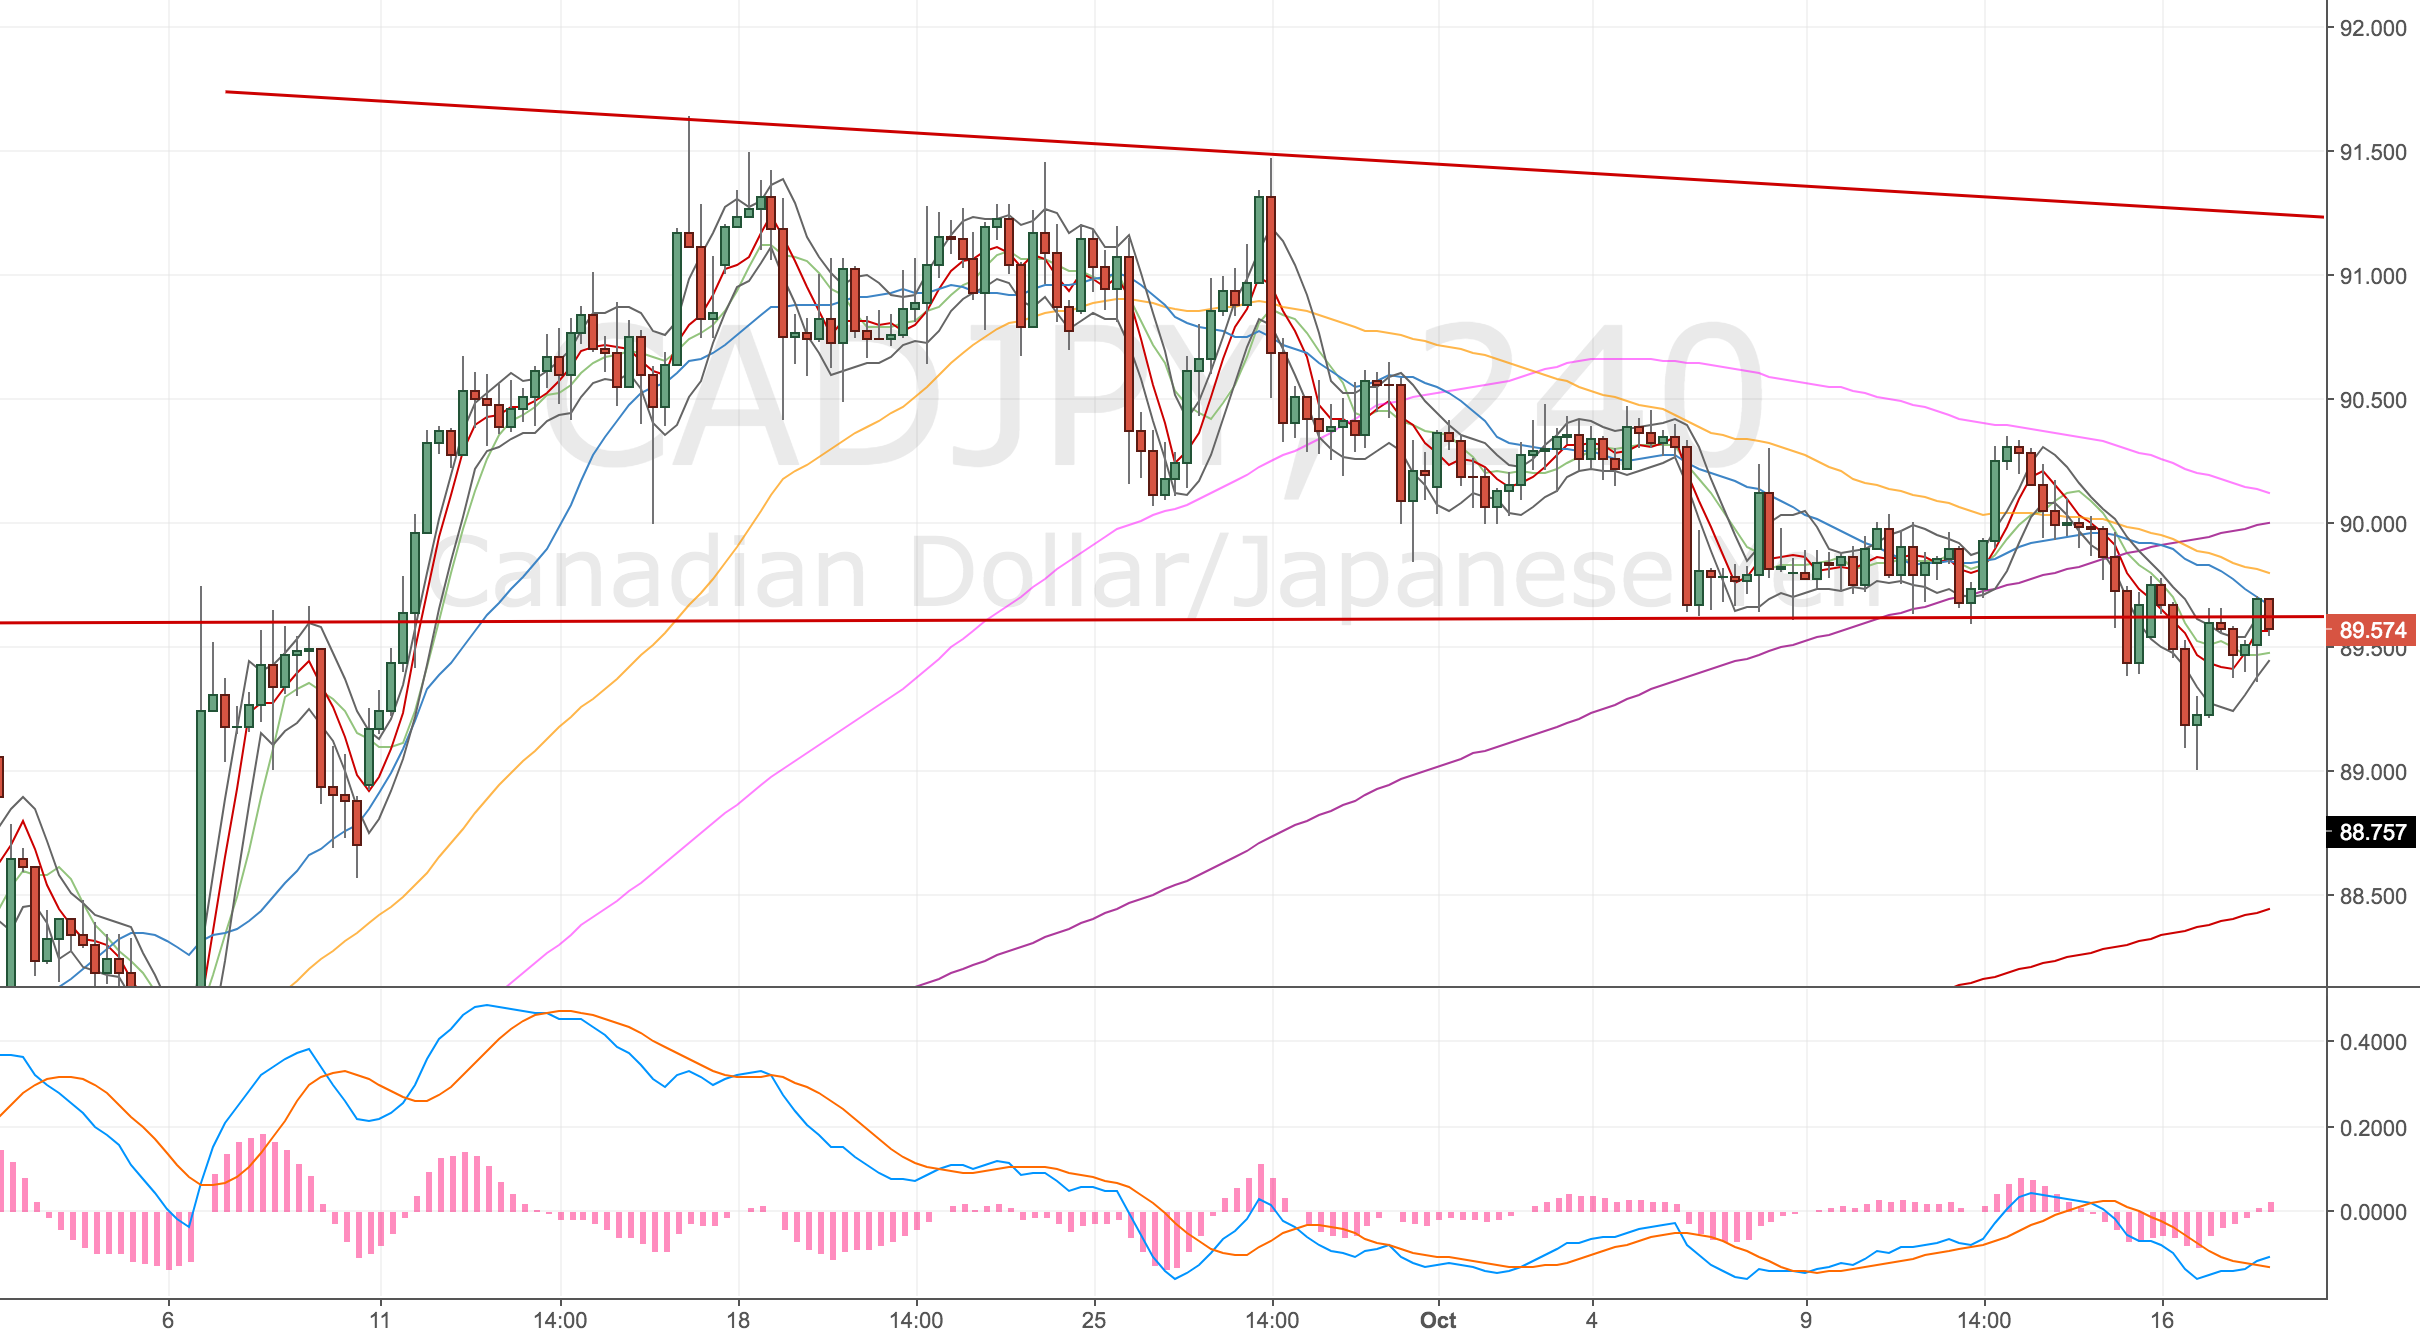
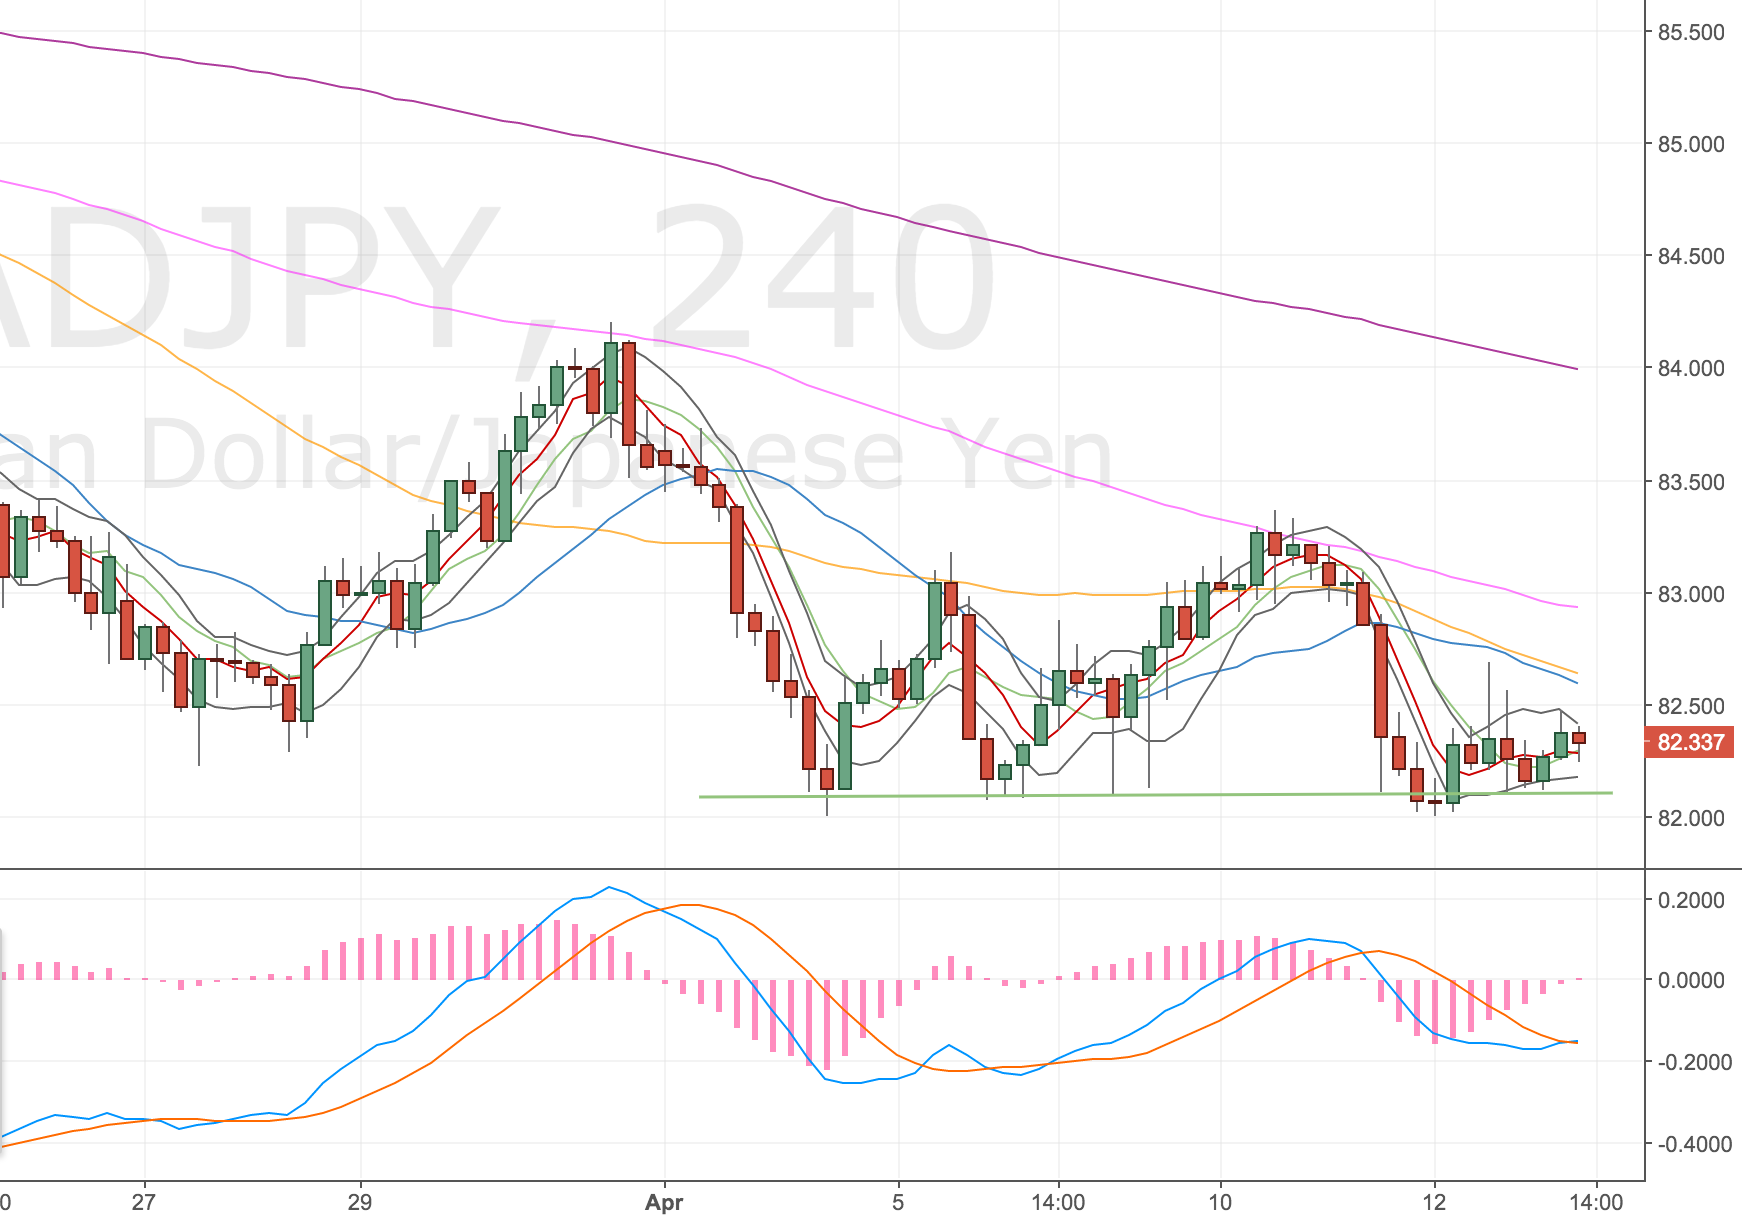
CADJPY 4h Chart – 17 Oct 17
Well got stopped out of the CADJPY long, price has now air-kissed the d50 and come back inside the wedge. The set up is still there so I think we’re good for another go at this.
Long again at 89.45 stop below the low plus the spread at 88.88. Target is for a break of the 4h100v to the prior high (PH) and a test of the upper trendline around 91.
Acc risk: 0.6%
Long: 89.45
Stop: 88.88 (57 pips)
Target: TBC – PH as a minimum (87 pips)
Mindset: Still like the set up, feel more positive about this one.
From here I’ll look to get short again, daily might well set up for another divergence short. Weekly chart might not though!