Acc Risk: 0.45%
Long: 1210.4
Stop: 1204.1 (63 pips)
Target: 1230.3 (199 pips, d500, 3.15x RR)
Mindset: Think we’re heading for an upper test of the monthly trendline
Update – Closed my trade manually again – 12 Jul
Update – Price hit original target – 16 Jul
Saw a Tip TV Gold analysis video by Alessio Rastani that matched a DST set up I was looking at, so I was feeling more confident.
As for targets the analysis on the daily chart makes me think we can hit 1230. I often see price action ping pong between the two nearby major MAs. so I’m looking for a d200 test.
4H Chart – setup
Pretty textbook entry down to the lower trendline.
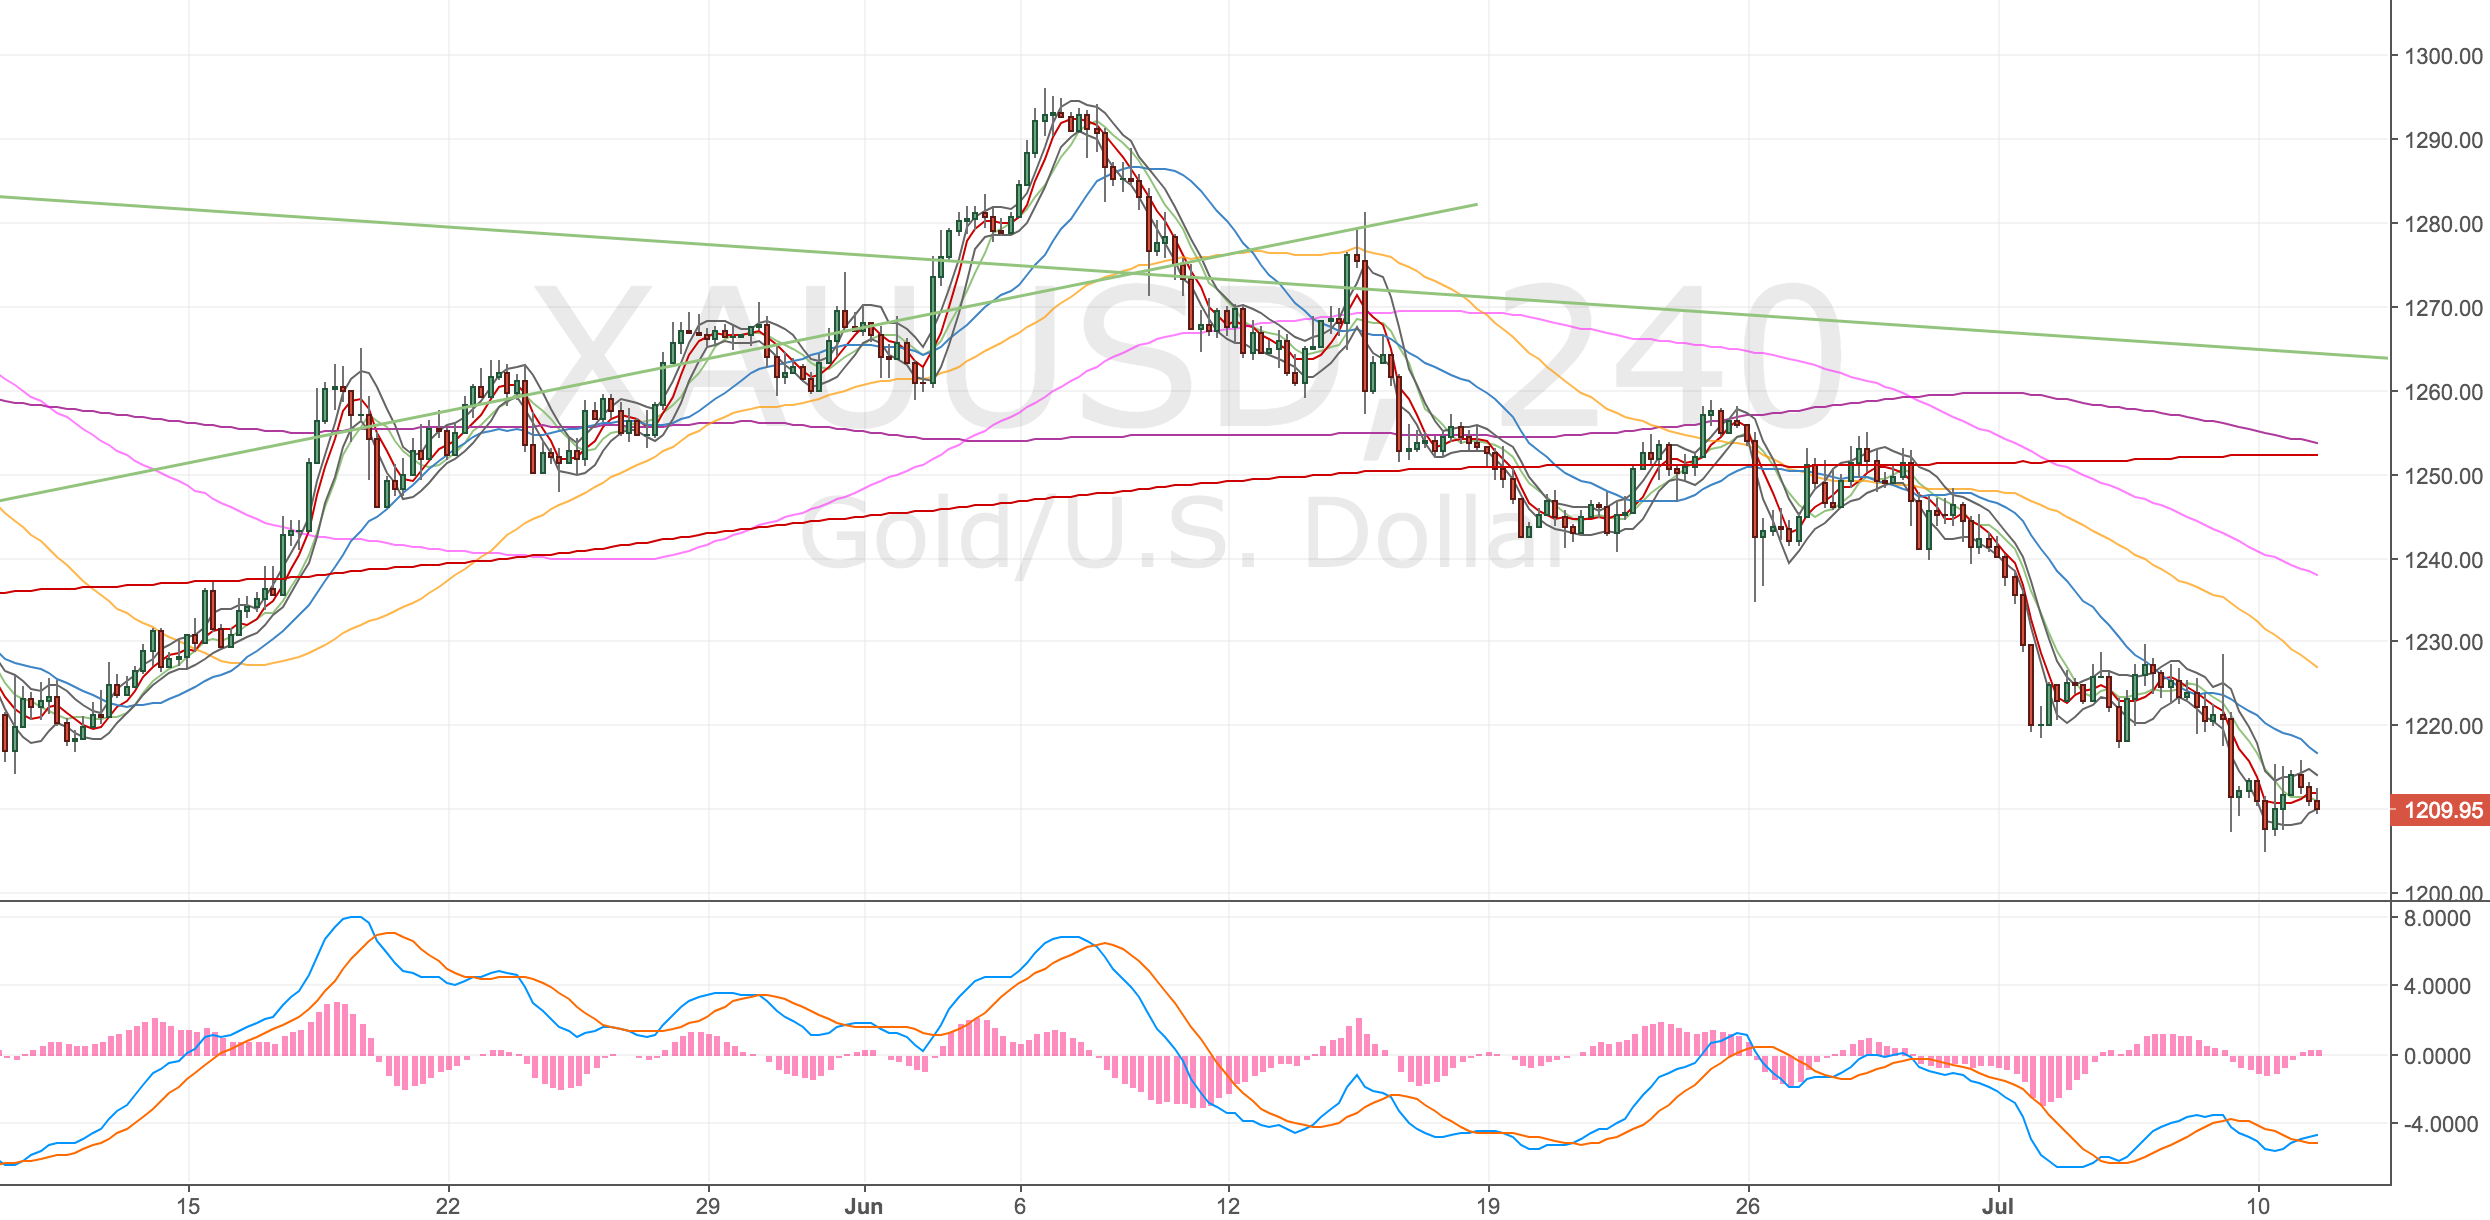
Gold 4H Chart – 11 Jul
1H Chart – confirmation
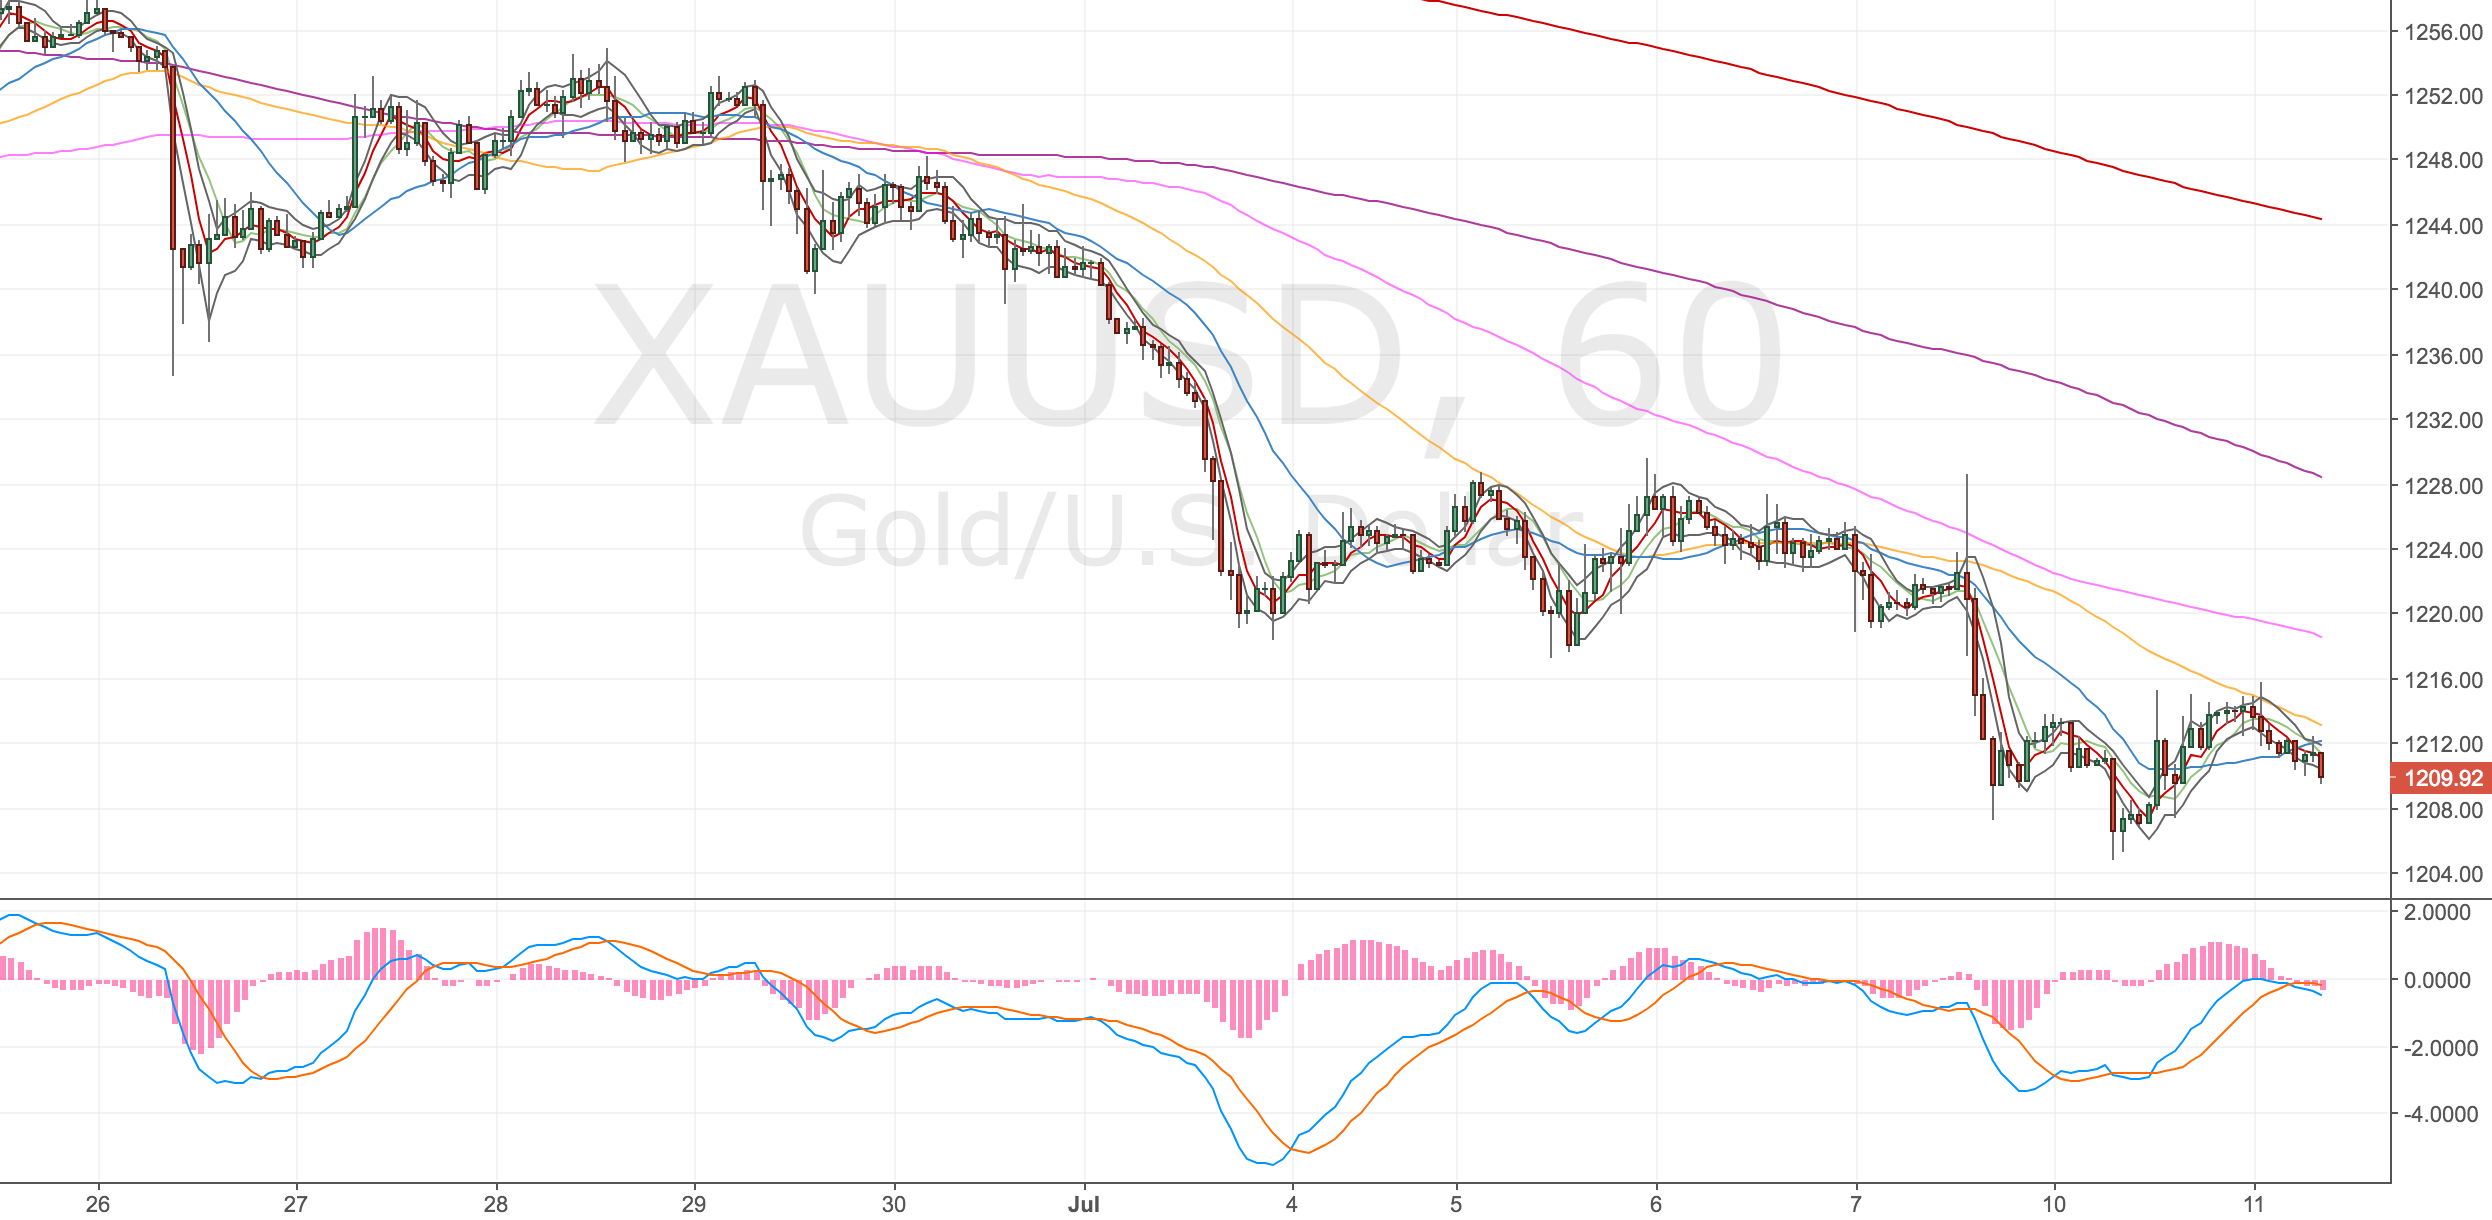
Gold 1H Chart – 11 Jul
Daily Chart
Looking for a d200 test after bouncing around the d500.
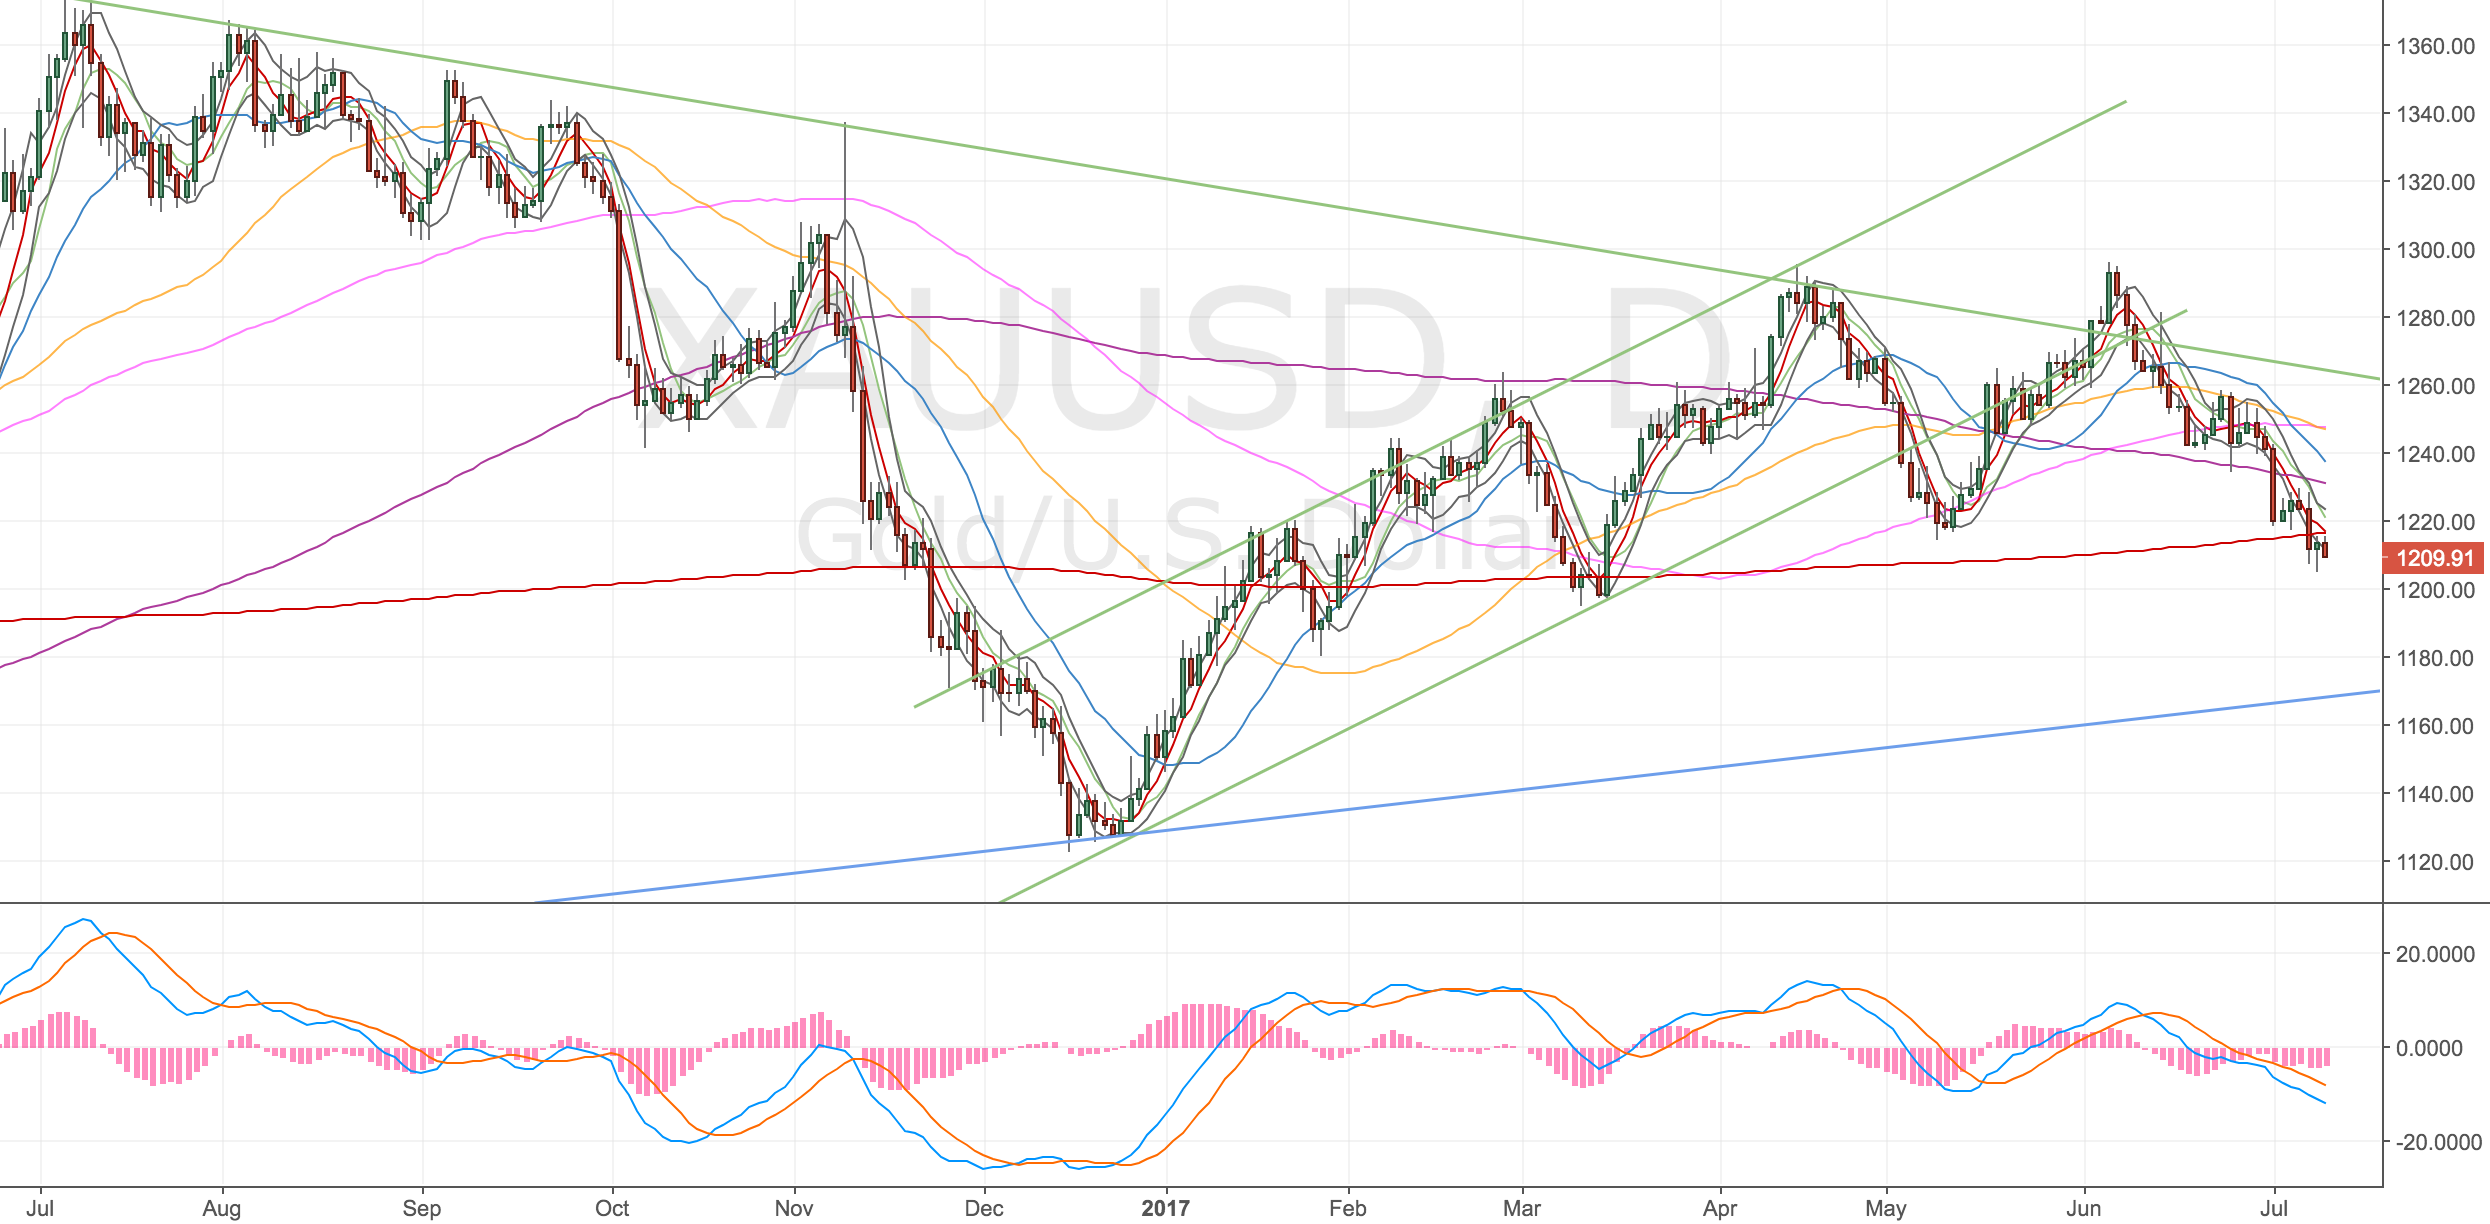
Gold Daily Chart – 11 Jul
Closed the trade manually again – 12 Jul
Just closed my trade manually @ 1221 (110 pips, 4h50, 1.74x RR).
I realised I wasn’t trading my system properly, I was trading my opinion bolstered by watching a youtube video! If I don’t trade my system properly I can’t be sure if my profitability or lack of it is justified.
Until I build some serious experience, I shouldn’t be trading my opinion. So I closed the trade at the 4h50 because I have a single divergence.
I still think price could head higher but that’s for someone else to worry about.
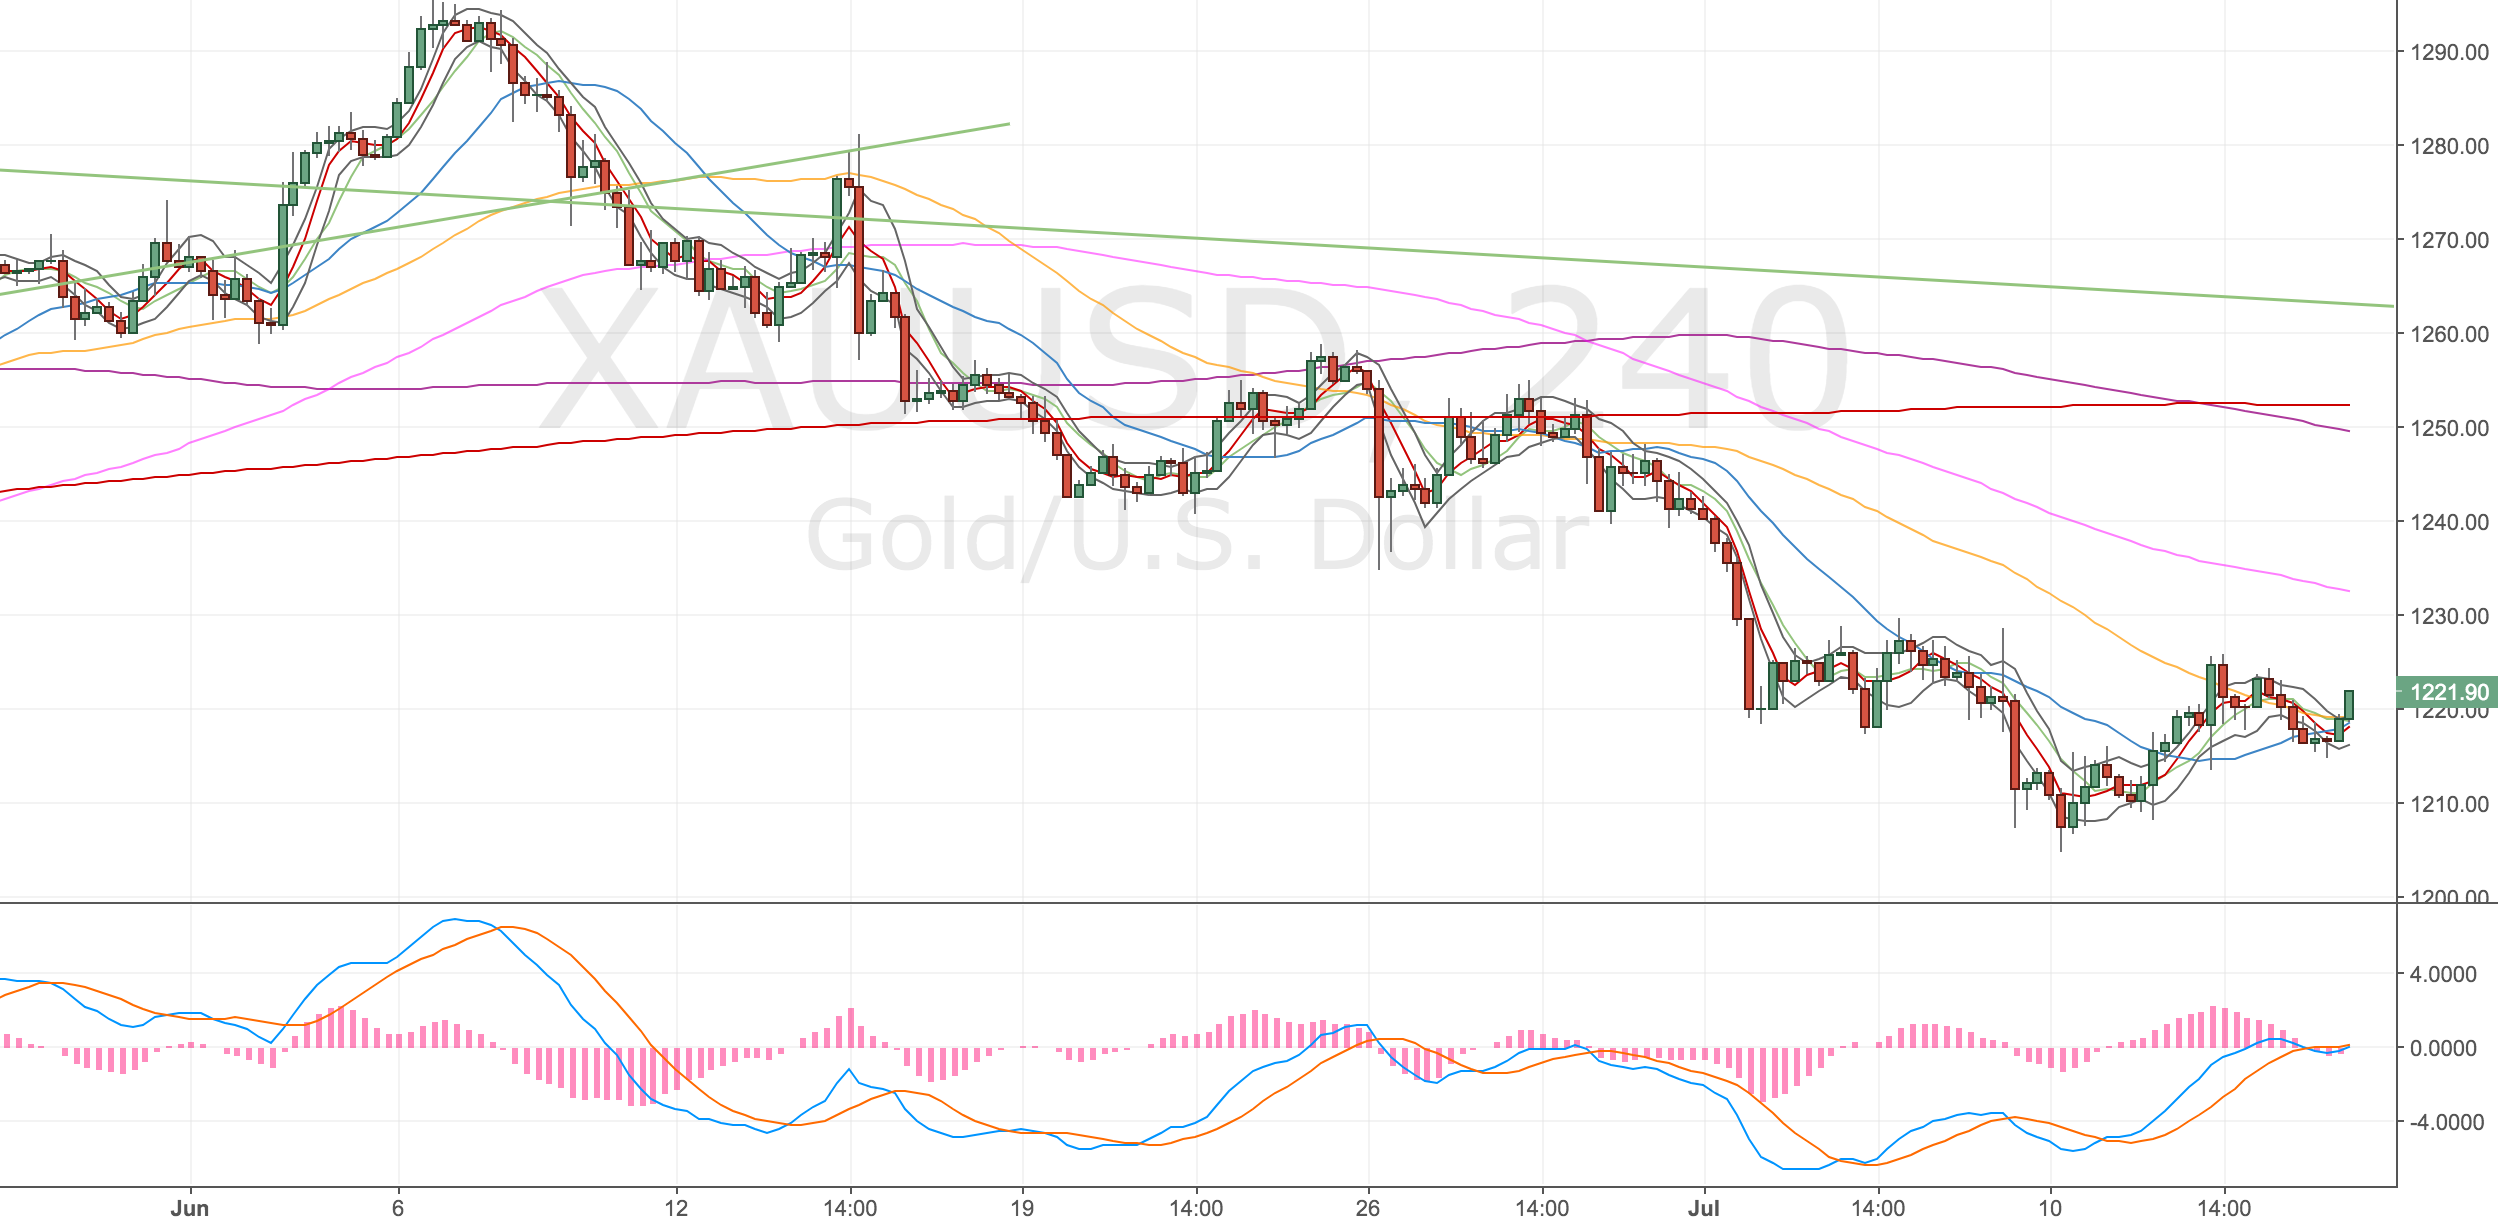
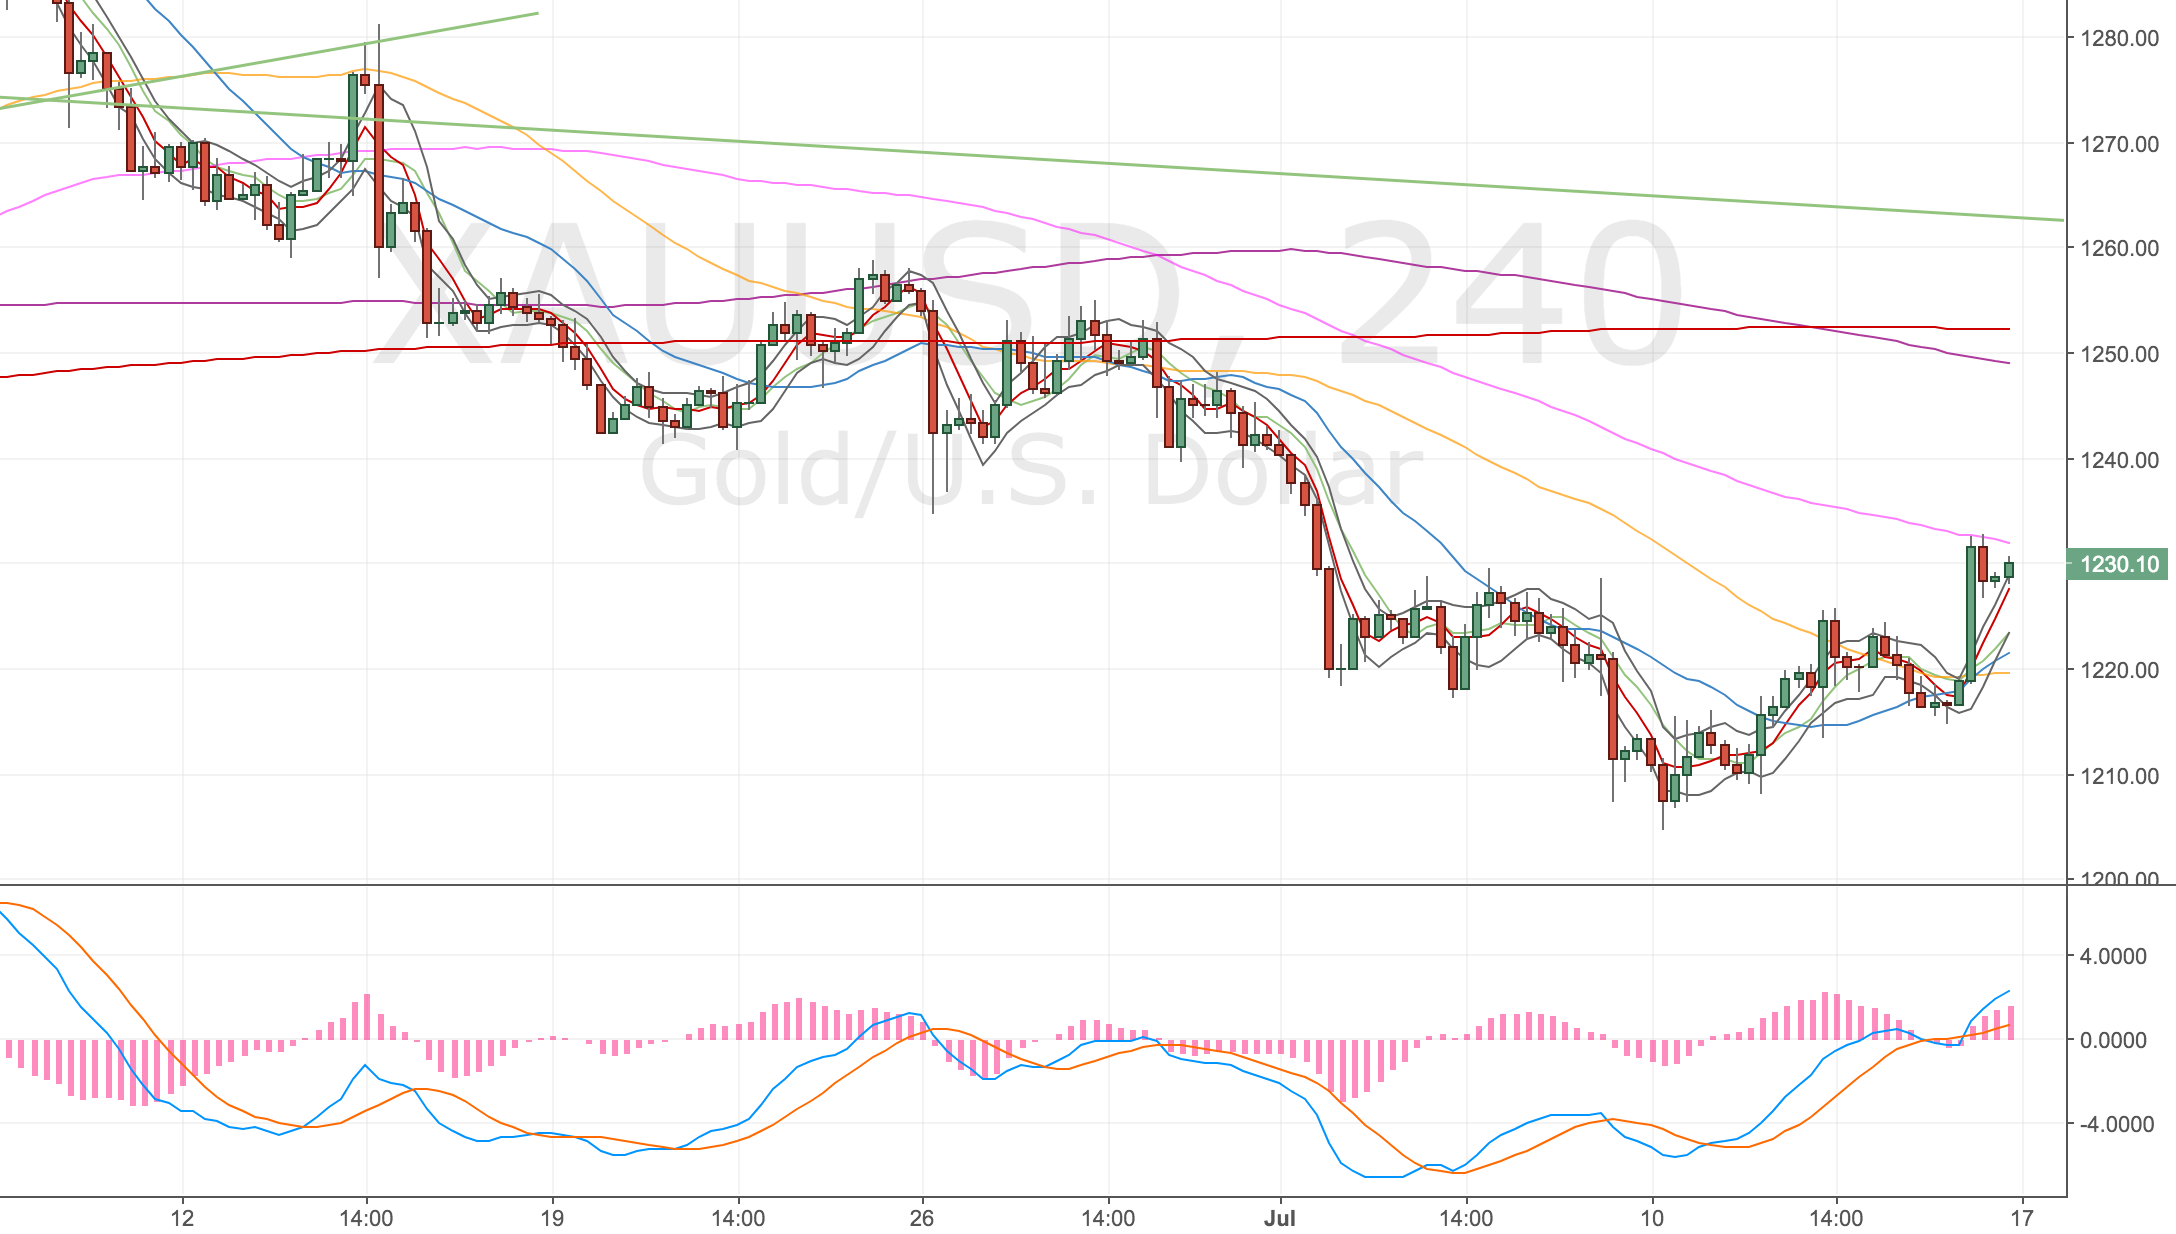
Gold 4H Chart – 14 Jul
Update – Price hit original target – 16 Jul
Not sure if this matters, part of me was thinking I should’ve kept to the original plan, but I’m glad I kept disciplined. Just have the doubt about whether I could’ve actually held on to this trade. I was very keen to close it.
Gold 4H Chart – 16 Jul