Long: 1.2974
Stop: 1.2941 (34 pips)
Target: 1.3181 (206 pips, 4h50, 6x RR)
Mindset: Like the divergence, love the RR. Optimistic on this.
Attempts: A couple
Updates
Stopped out – 4 Jul
Going in again – 5 Jul
Conversation with Charlie – 5 Jul
Stopped out again – 7 Jul
Switching to the AUDCAD set up – 10 Jul
Taking another set up – 17 Jul
Stopped out an hour later – 17 Jul
I’ve been watching the USDCAD for a while now, CAD has been really strong and has broken the trend channel, so I’ve been watching for divergence to set up and then a retest of the lower trendline (this time as resistance rather than support).
I may be a little early on this trade – both charts show bars that haven’t closed yet! So they might disprove the entry, I’m taking the trade because of my timing (I’m at work on lunch) and the fact that the 15M chart has a mega divergence in play 3x.
USDCAD 1H Chart
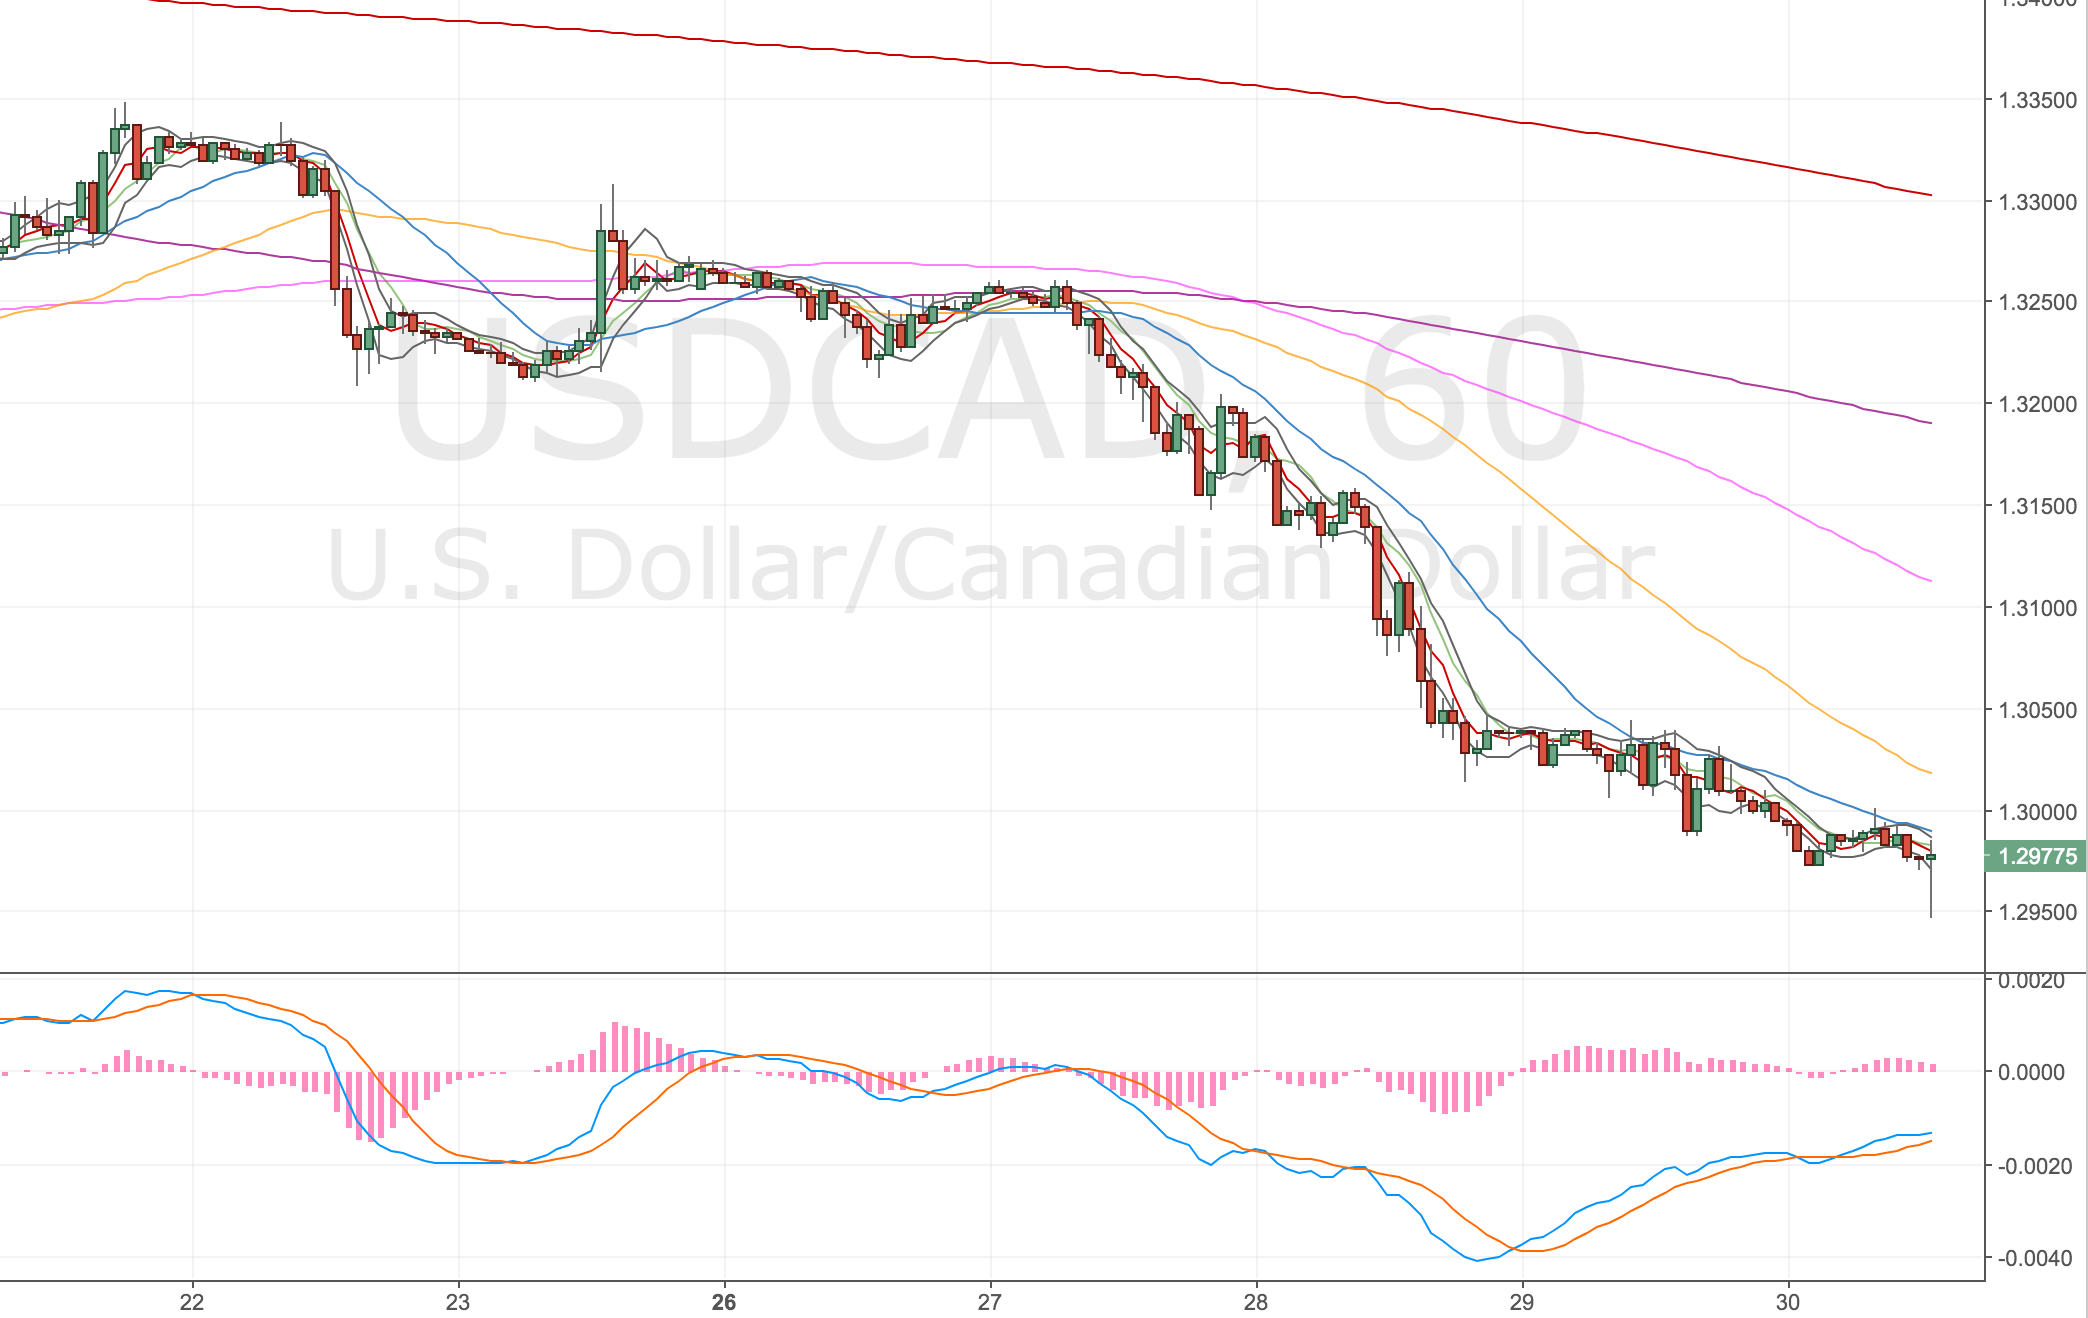
USDCAD 1H Chart – 30 June
USDCAD 4H Chart
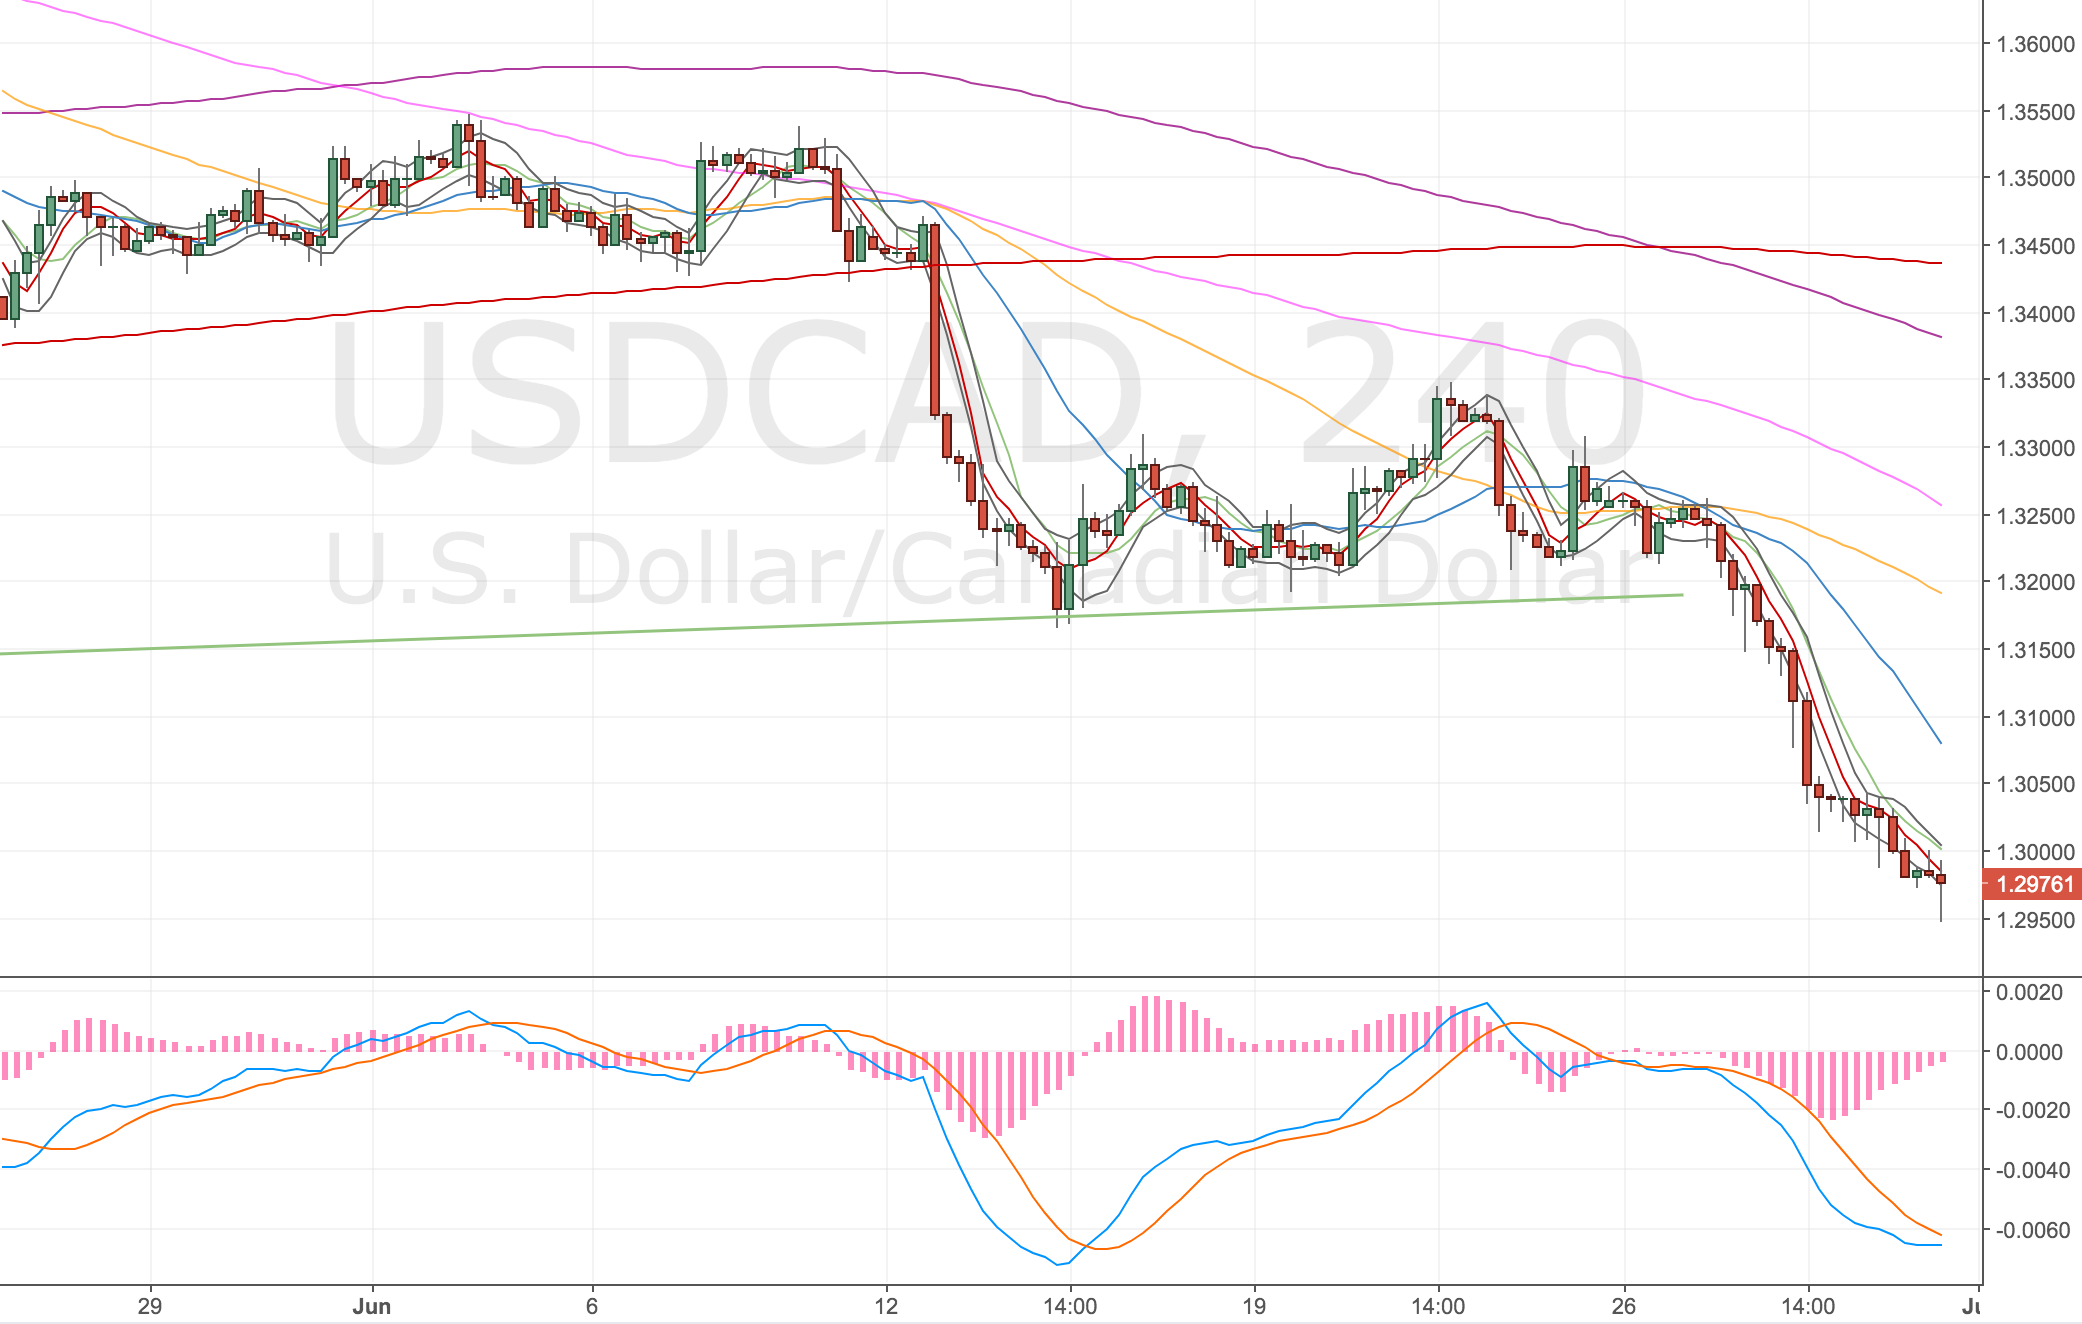
USDCAD 4H Chart – 30 June. Lower trendline in green.
Stopped out – 4 Jul
Just been stopped out – thought this trade might stick but price has rolled over. The divergences are still there so looking for another setup.
Going in again – 5 Jul
Long: 1.2949
Stop: 1.2907 (42 pips)
Target: 1.3156 (207 pips, 4h50, 4.92x RR)
Mindset: Slightly wider stop so the RR isn’t as good, but I still like the trade.
Attempts: Can still see this getting stopped out
I’m going in again, the divergence is still in play. Price has drifted back inside the bands but talking with Charlie he said that he isn’t overly worried about price action when it comes to set ups.
4H Chart
Screenshots were taken later in the day!
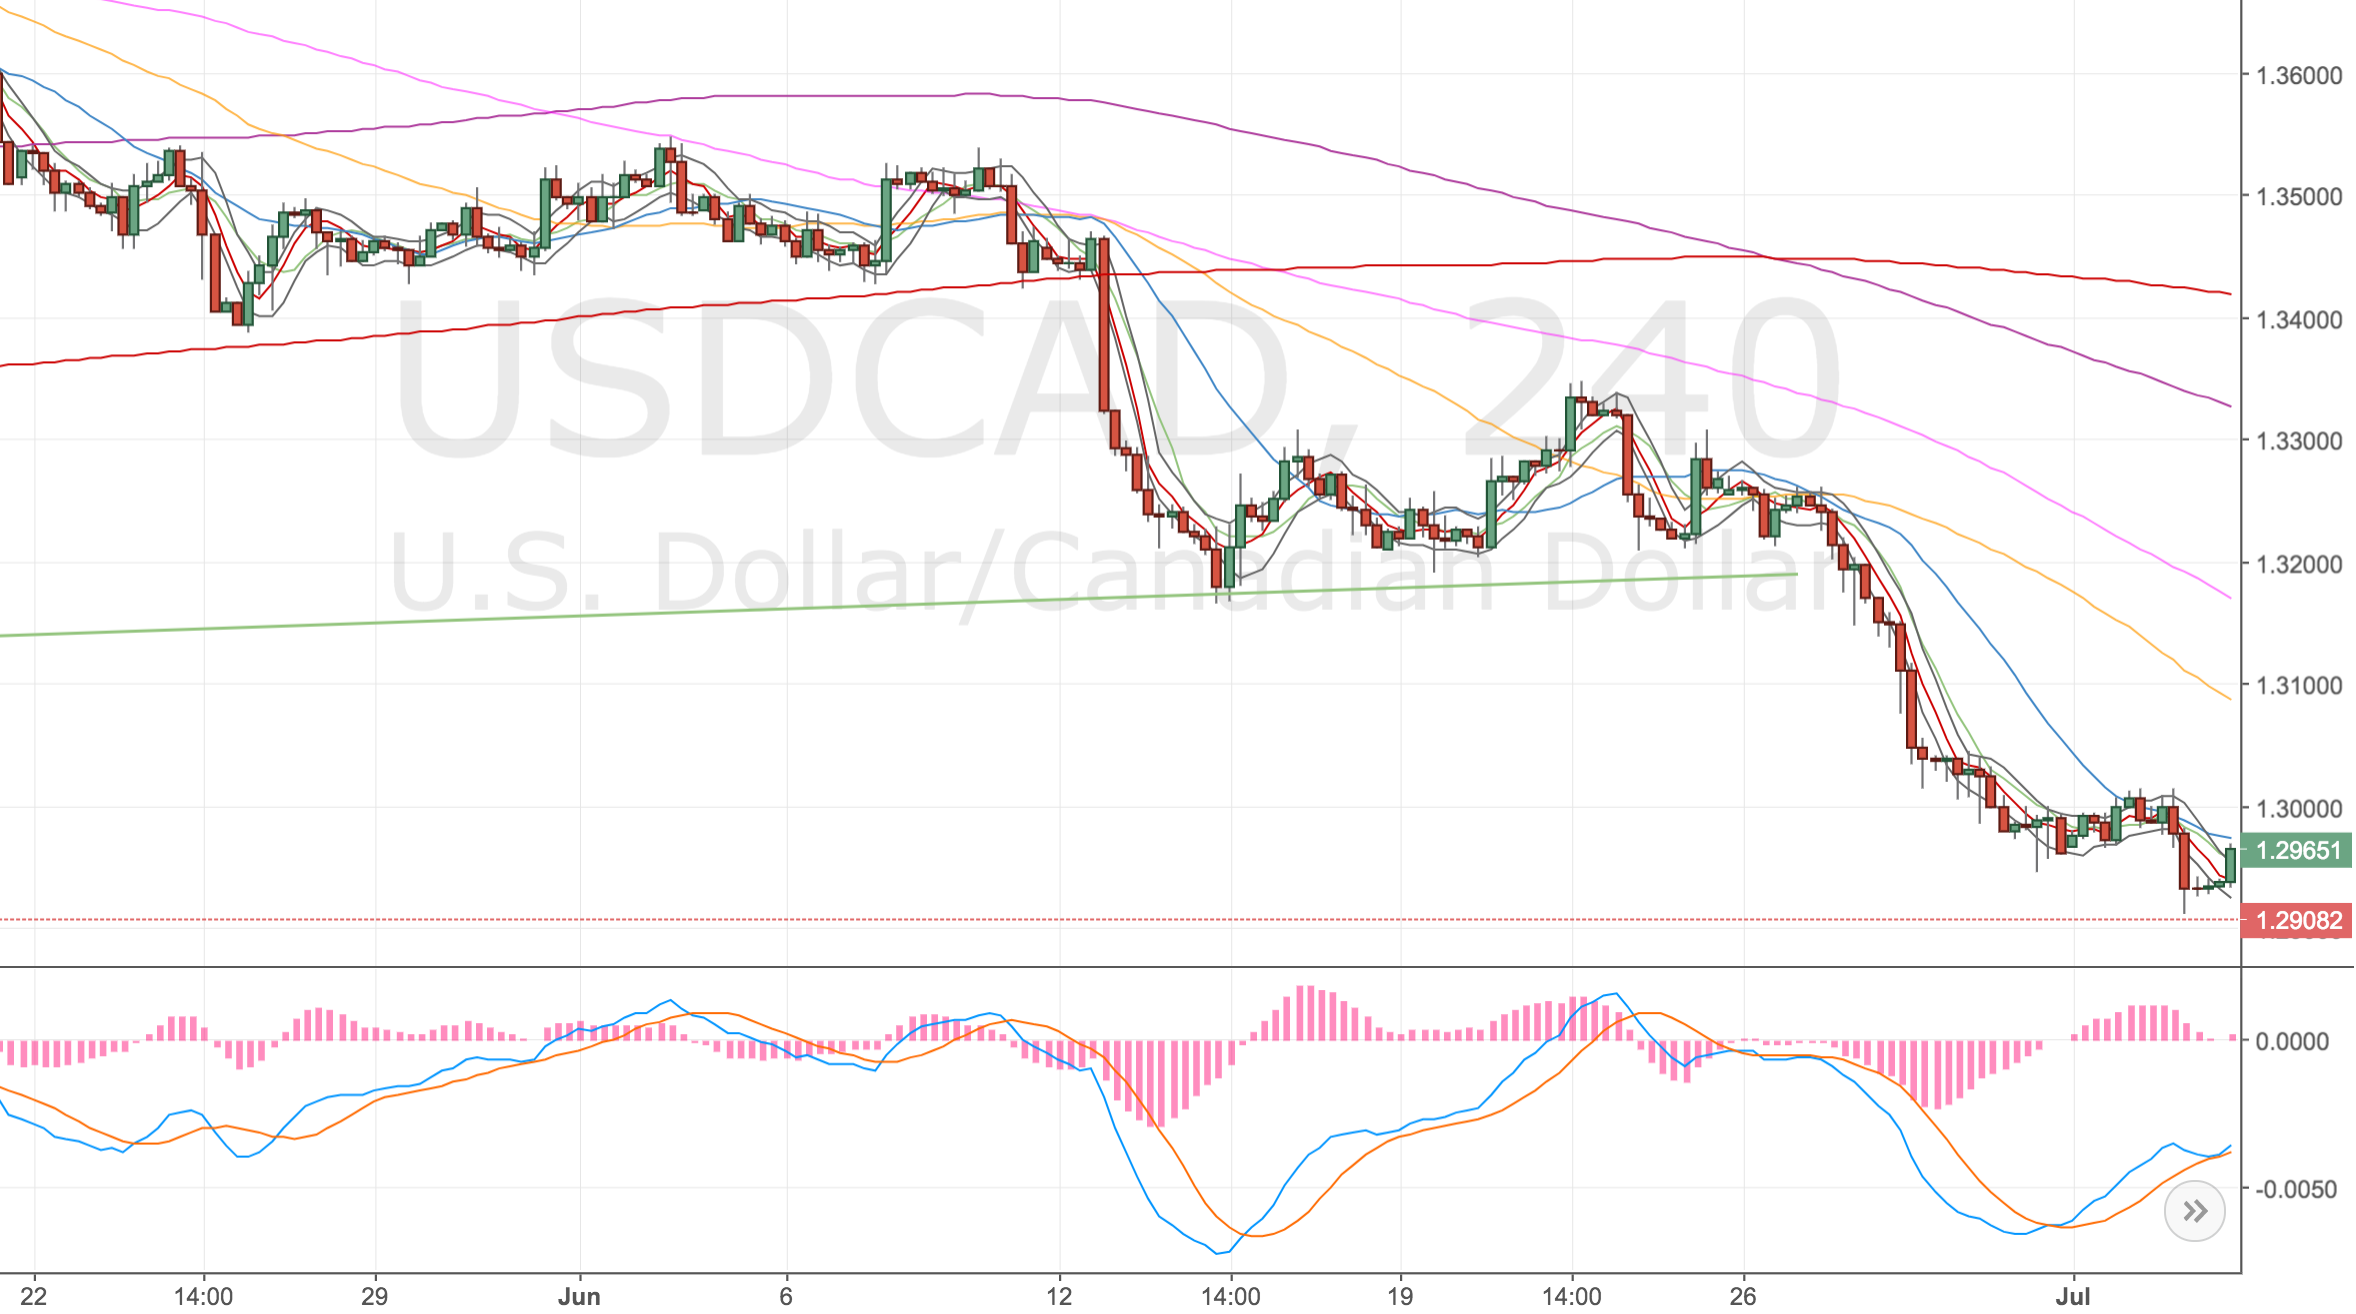
USDCAD 4H Chart – 5 Jul
1H Chart
Screenshots were taken later in the day!
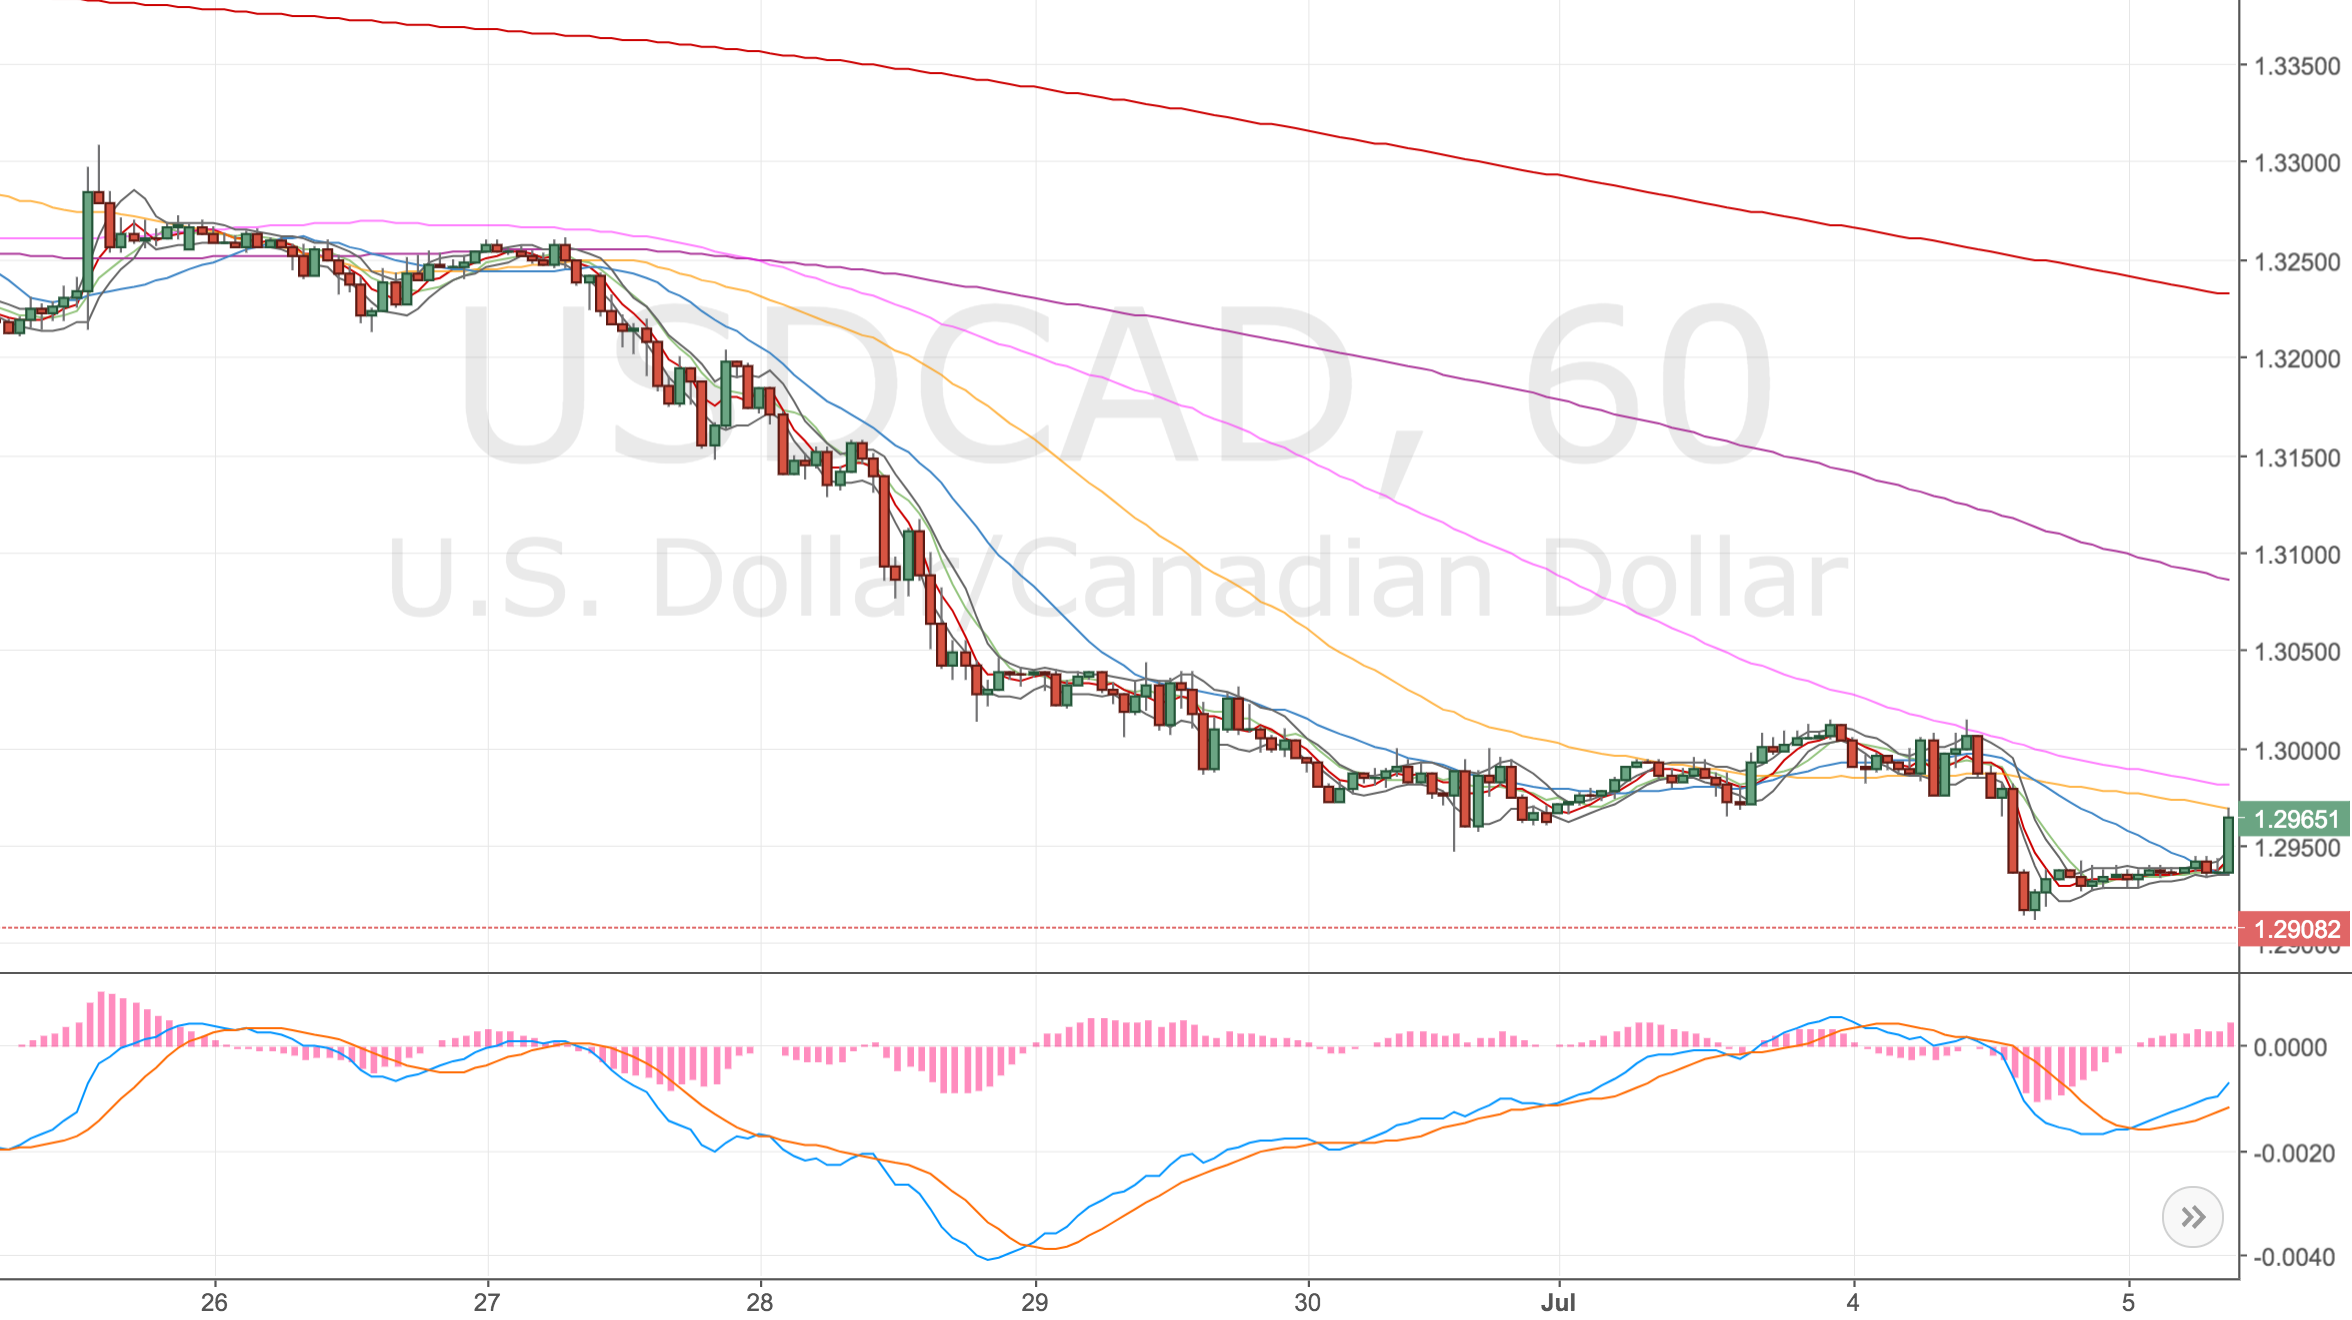
USDCAD 1H Chart – 5 Jul
Conversation with Charlie – 5 Jul
Quick update, I had my monthly review call with Charlie. It was a good call, I asked him to review this trade and my Oil trade. He liked the Oil set up but not this one so much. His POV was that the divergence had formed in space with no obvious technical levels to support price action.
It’s a good point, I’ve not been great at checking the higher timeframes regularly. This is definitely something I need to make more effort to do in future.
Stopped out again – 7 Jul
Price has stopped me out again, a little disappointing. I thought I might be onto a winner. I will keep an eye on this, I will definitely go in again, if the set up occurs, but this time I’ll look for more technical reasons to.
However – a triple divergence or higher will be hard to resist.
Switching to the AUDCAD set up – 10 Jul
Just thought I should update the post to note that I’ve switched to the AUDCAD. I think the CAD is due a turn (divergences occuring on different markets) and the Aussie looks good for a move higher against the dollar.
So it’s a bit of triangular set up AUD – USD – CAD, but if I’m interested in going long USDCAD and the Aussie is looking strong against the dollar, and both set ups are valid (occuring on two timeframes). I think it’s OK to switch to AUDCAD.
One point that Charlie pointed out from my April review was that I was jumping too many markets. However I think this is justified as the set up looks better.
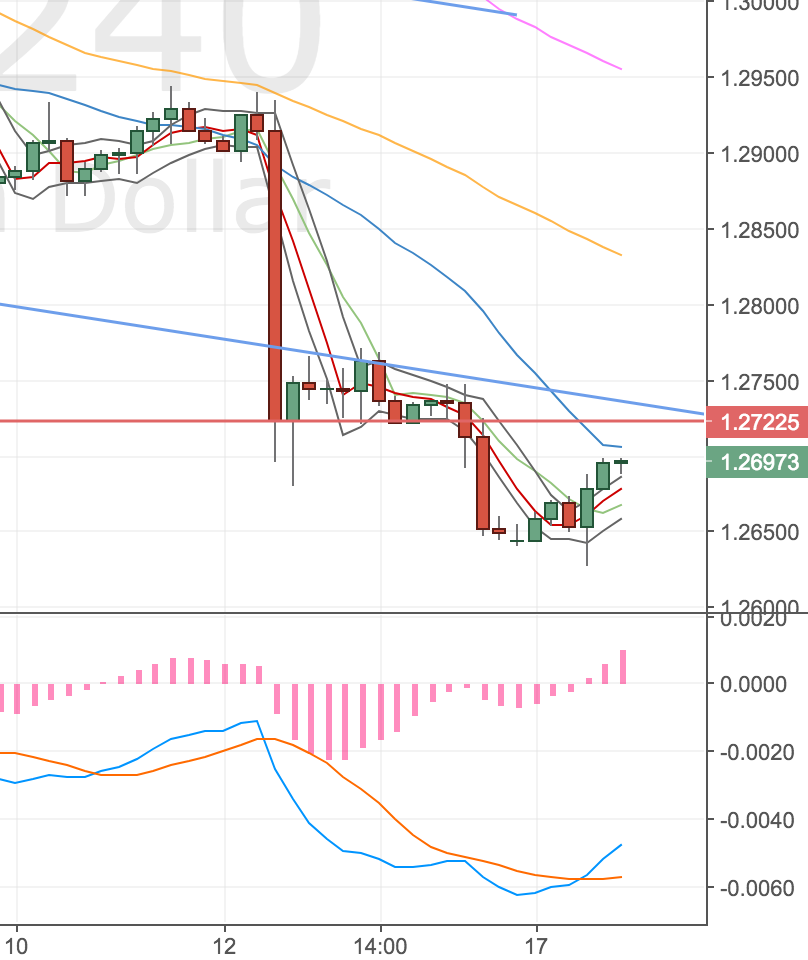
Taking another set up – 17 Jul
Acc Risk: 0.5%
Long: 1.2655
Stop: 1.2633 (22 pips)
Target: 1.2830 (175 pips, 4h50, 7.95x RR)
Mindset: Reticent to take the trade but (very) excited about the RR.
Had a rare opportunity to do a market scan at lunchtime spotted the divergence on the 1H and 4H charts that I liked the look of, USDCAD is now into a S&R zone formed of the prior highs and lows from early 2015 and early 2016.
Whilst there is an element of catching a falling knife, I feel that a double 4H divergence and a 1H confirmation is worth a shot. AUDCAD & GBPCAD look like they might start to make higher highs, although only the AUDCAD has so far.
The rest of the pairs are showing a divergence.
4H Chart
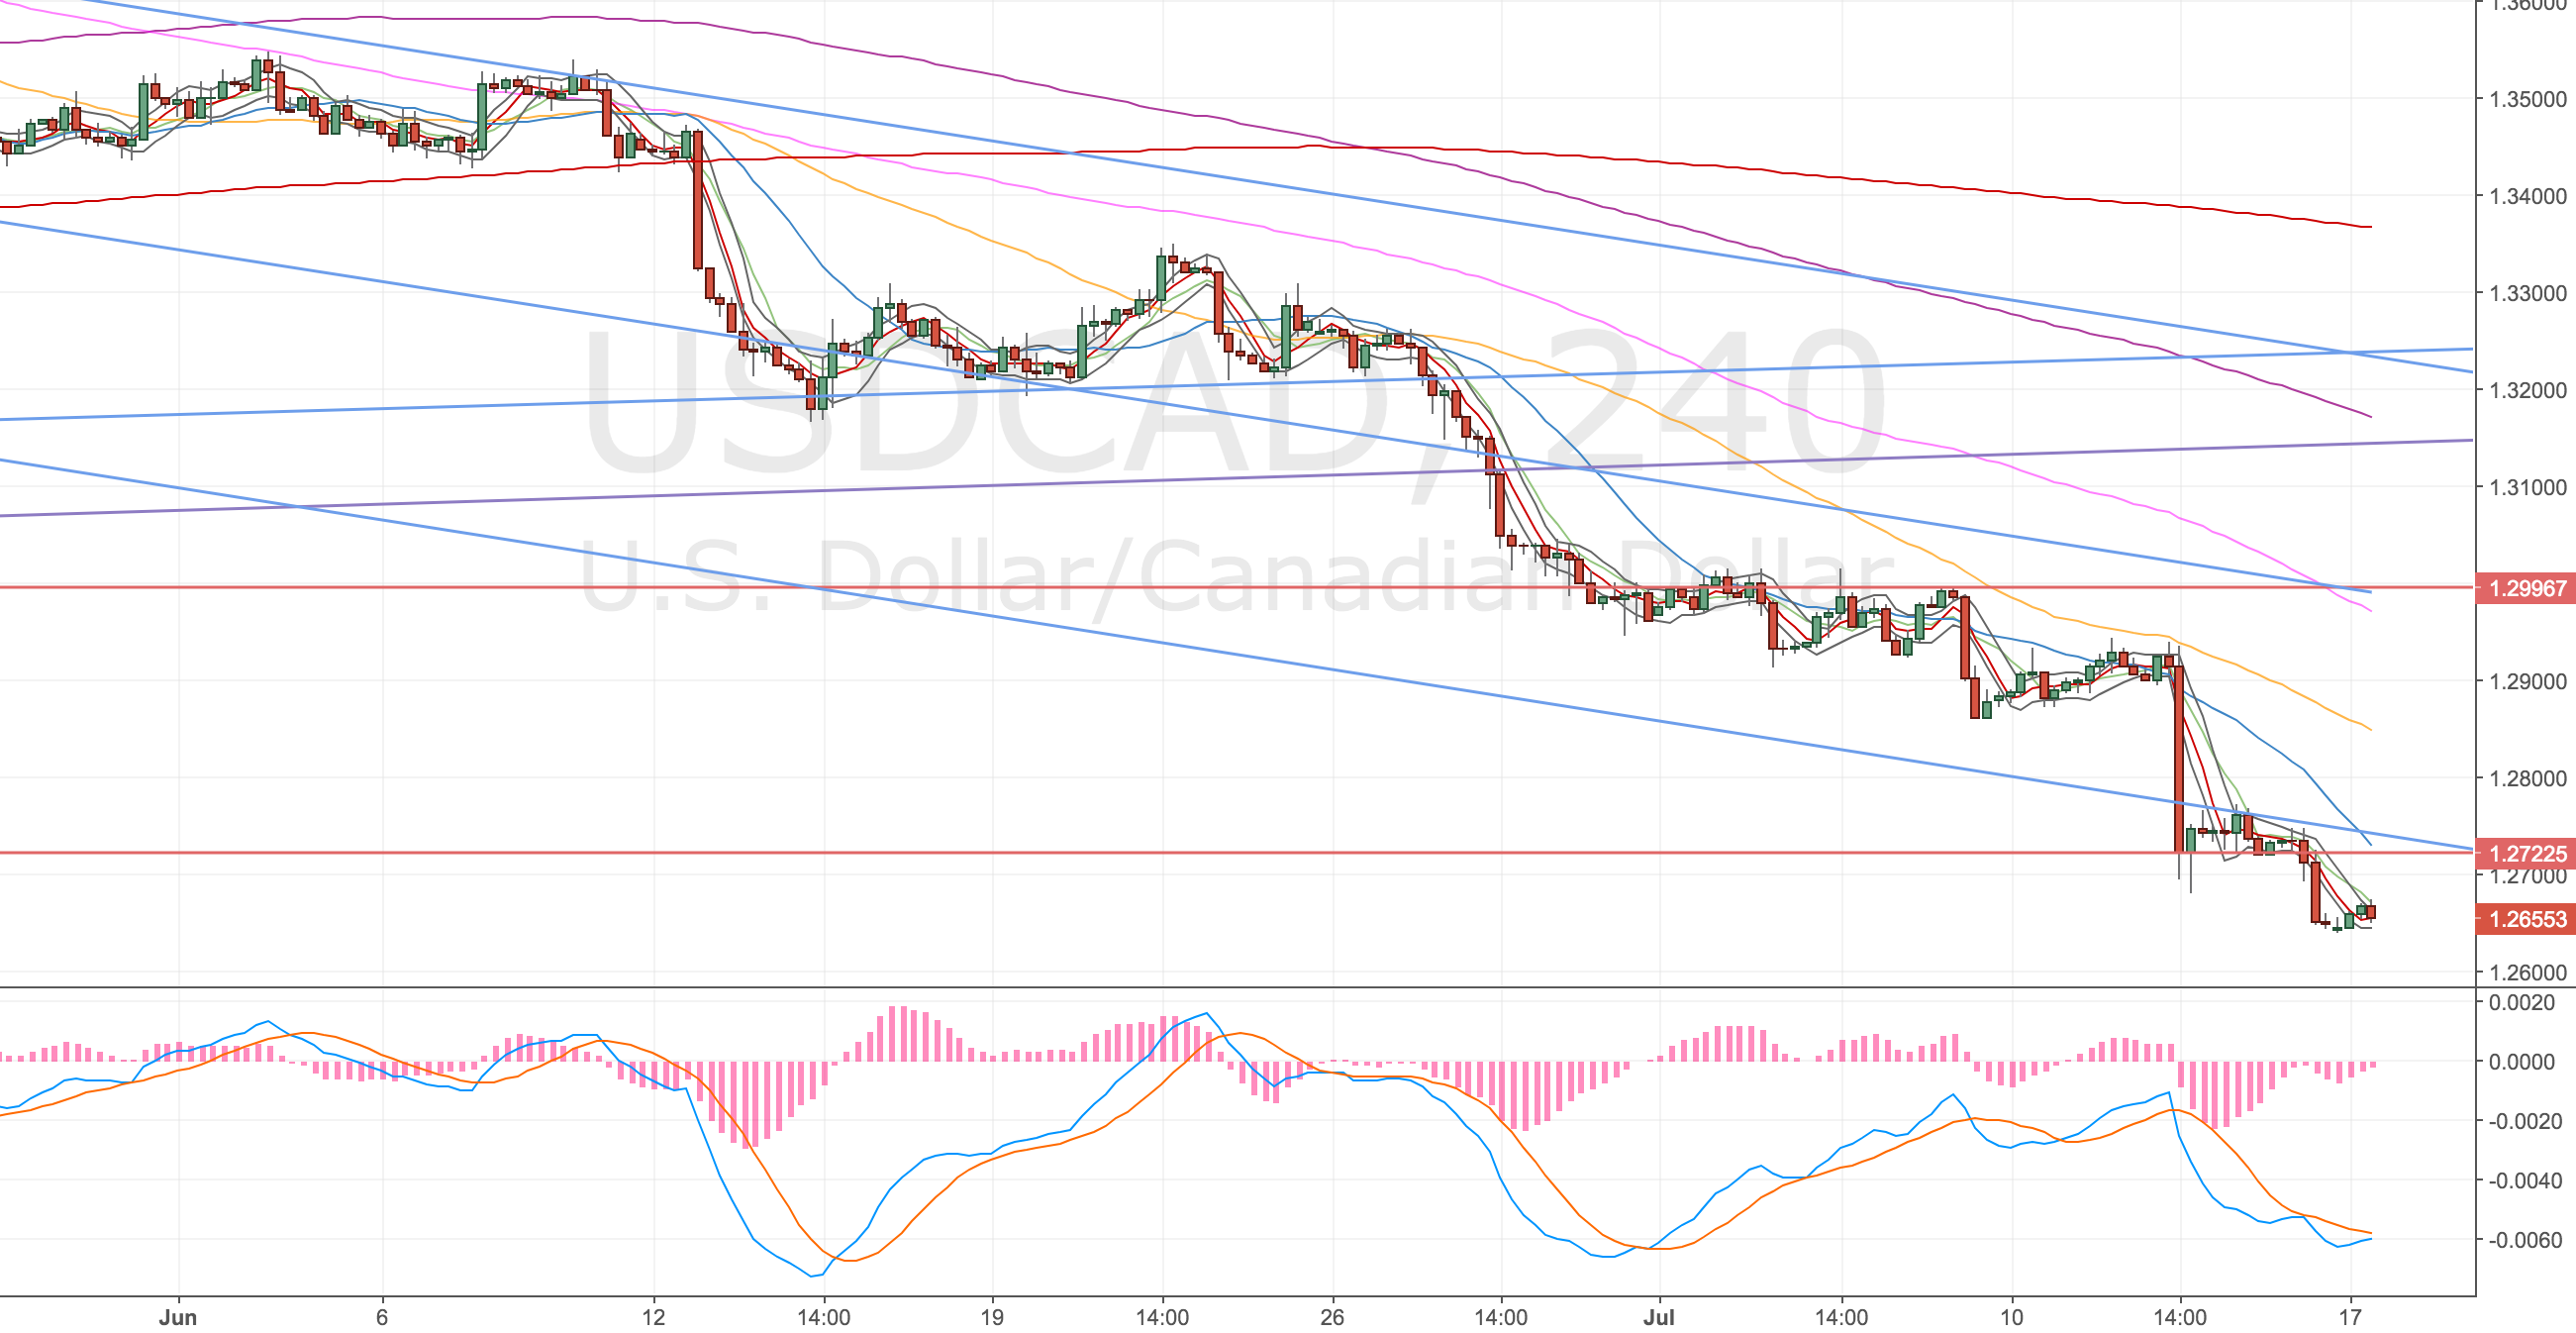
USDCAD 4H Chart – 17 Jul
1H Chart
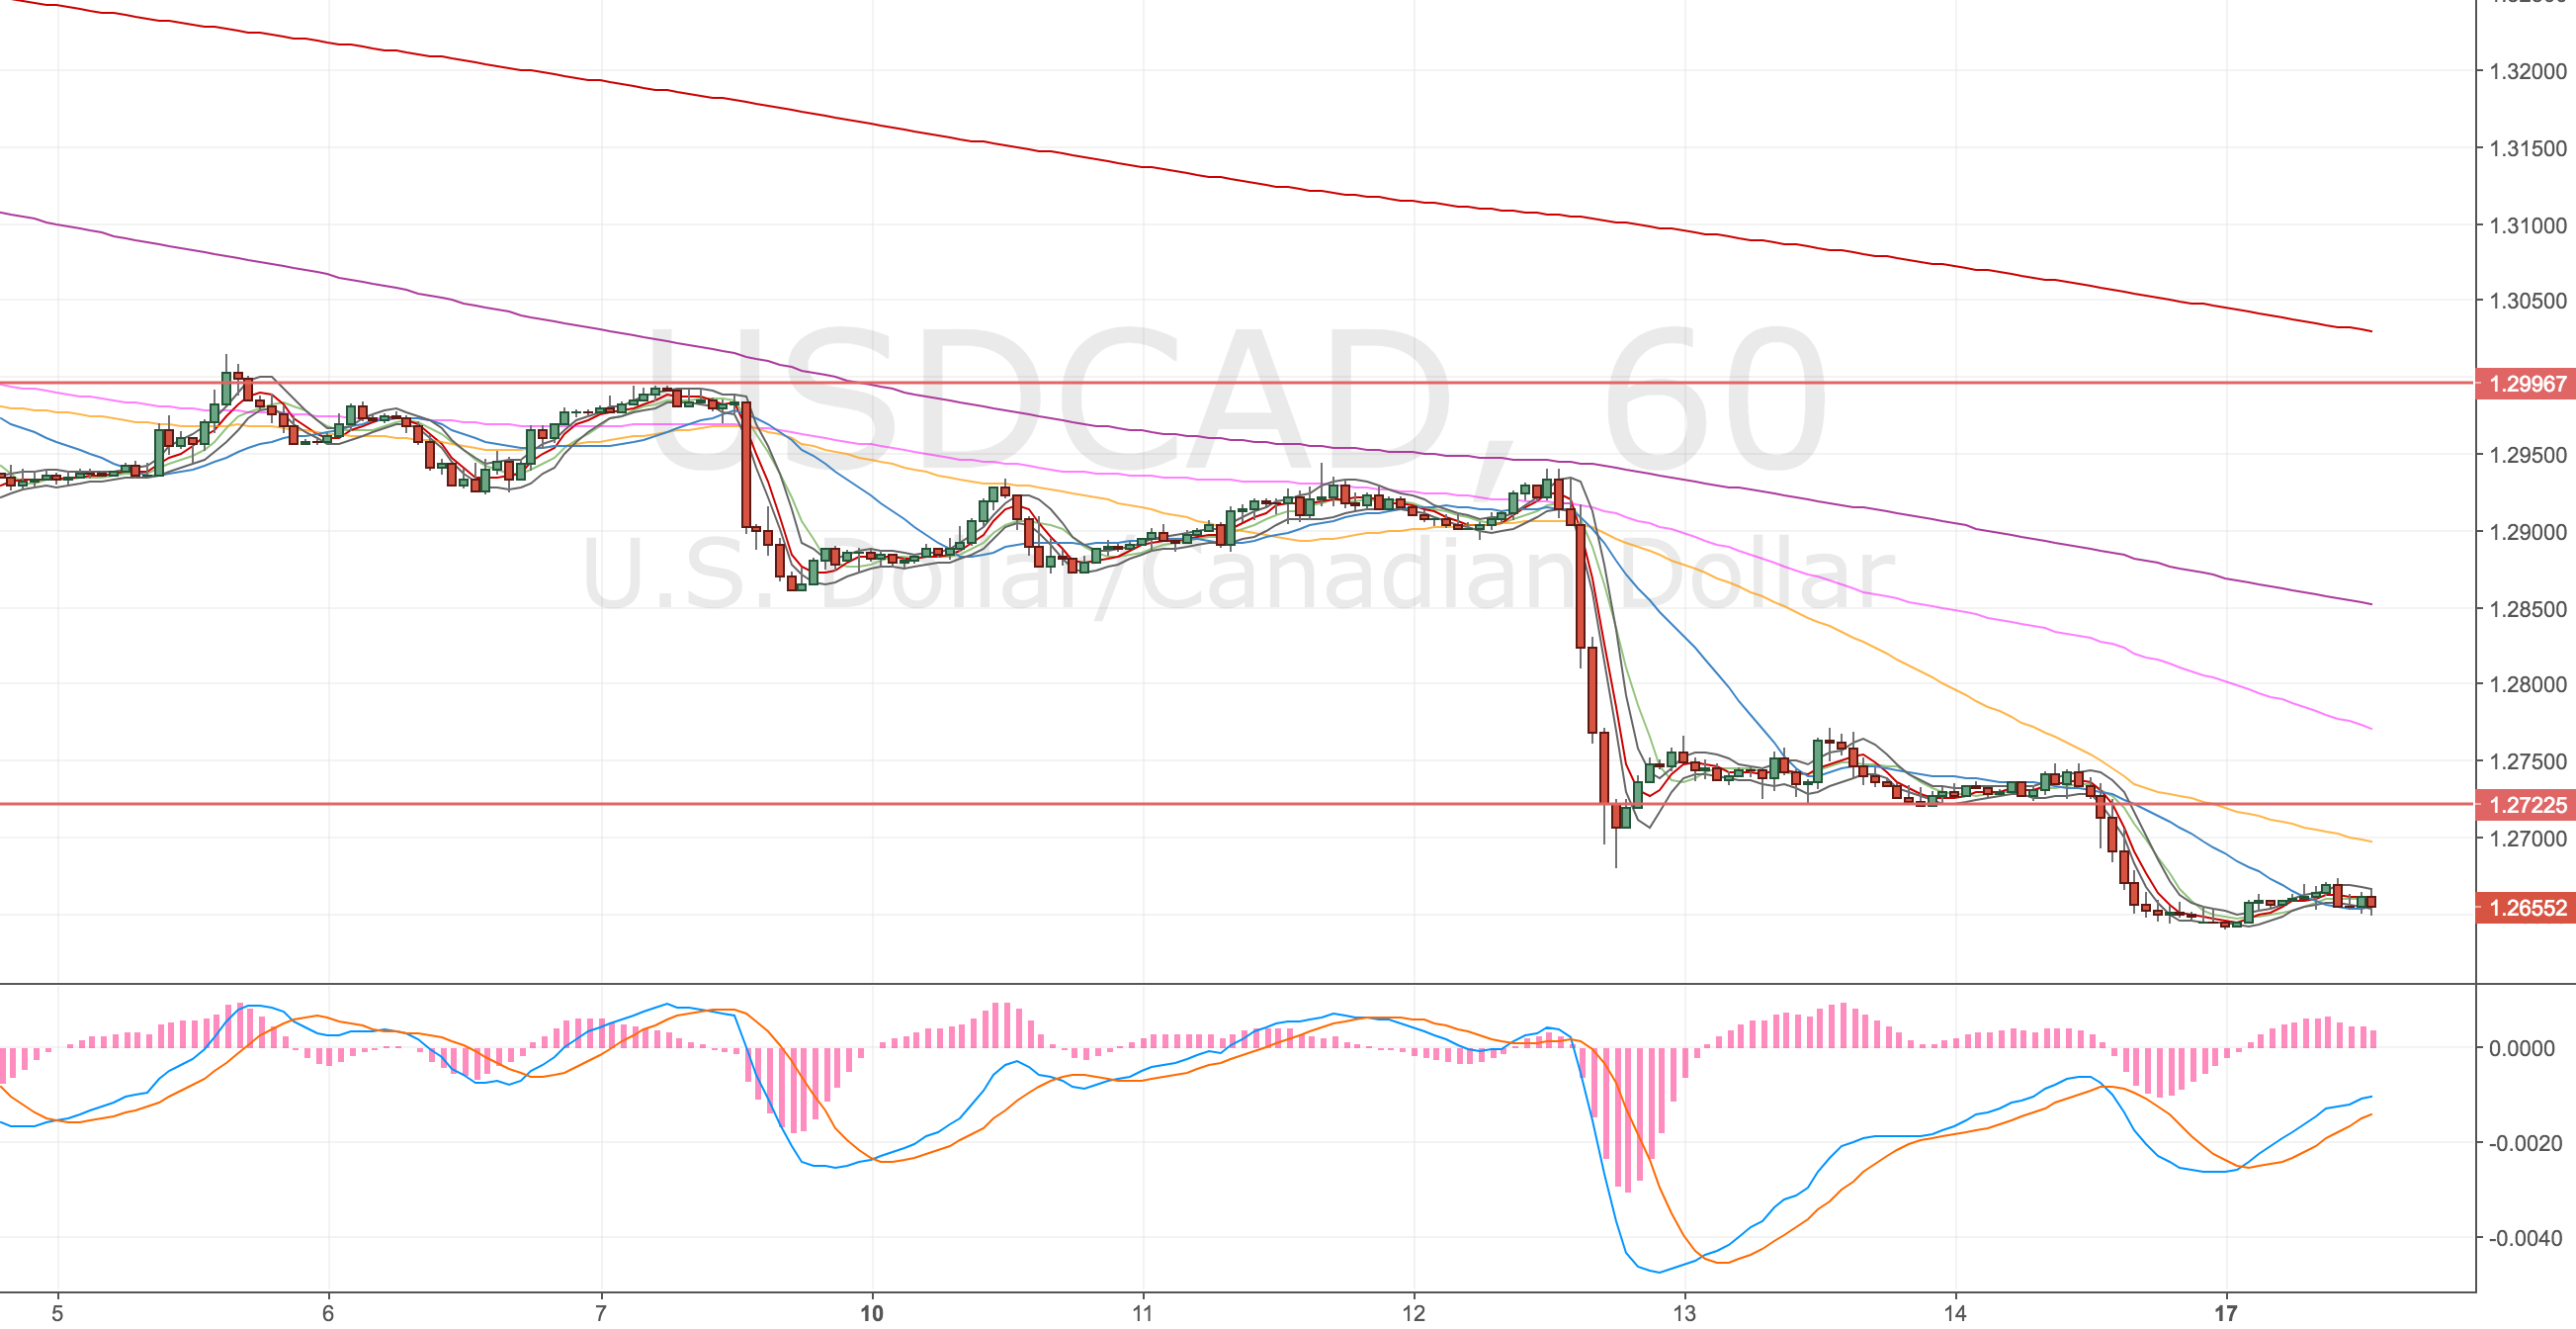
USDCAD 1H Chart – 17 Jul
Daily Chart
No divergence in site, it’s a great run down.
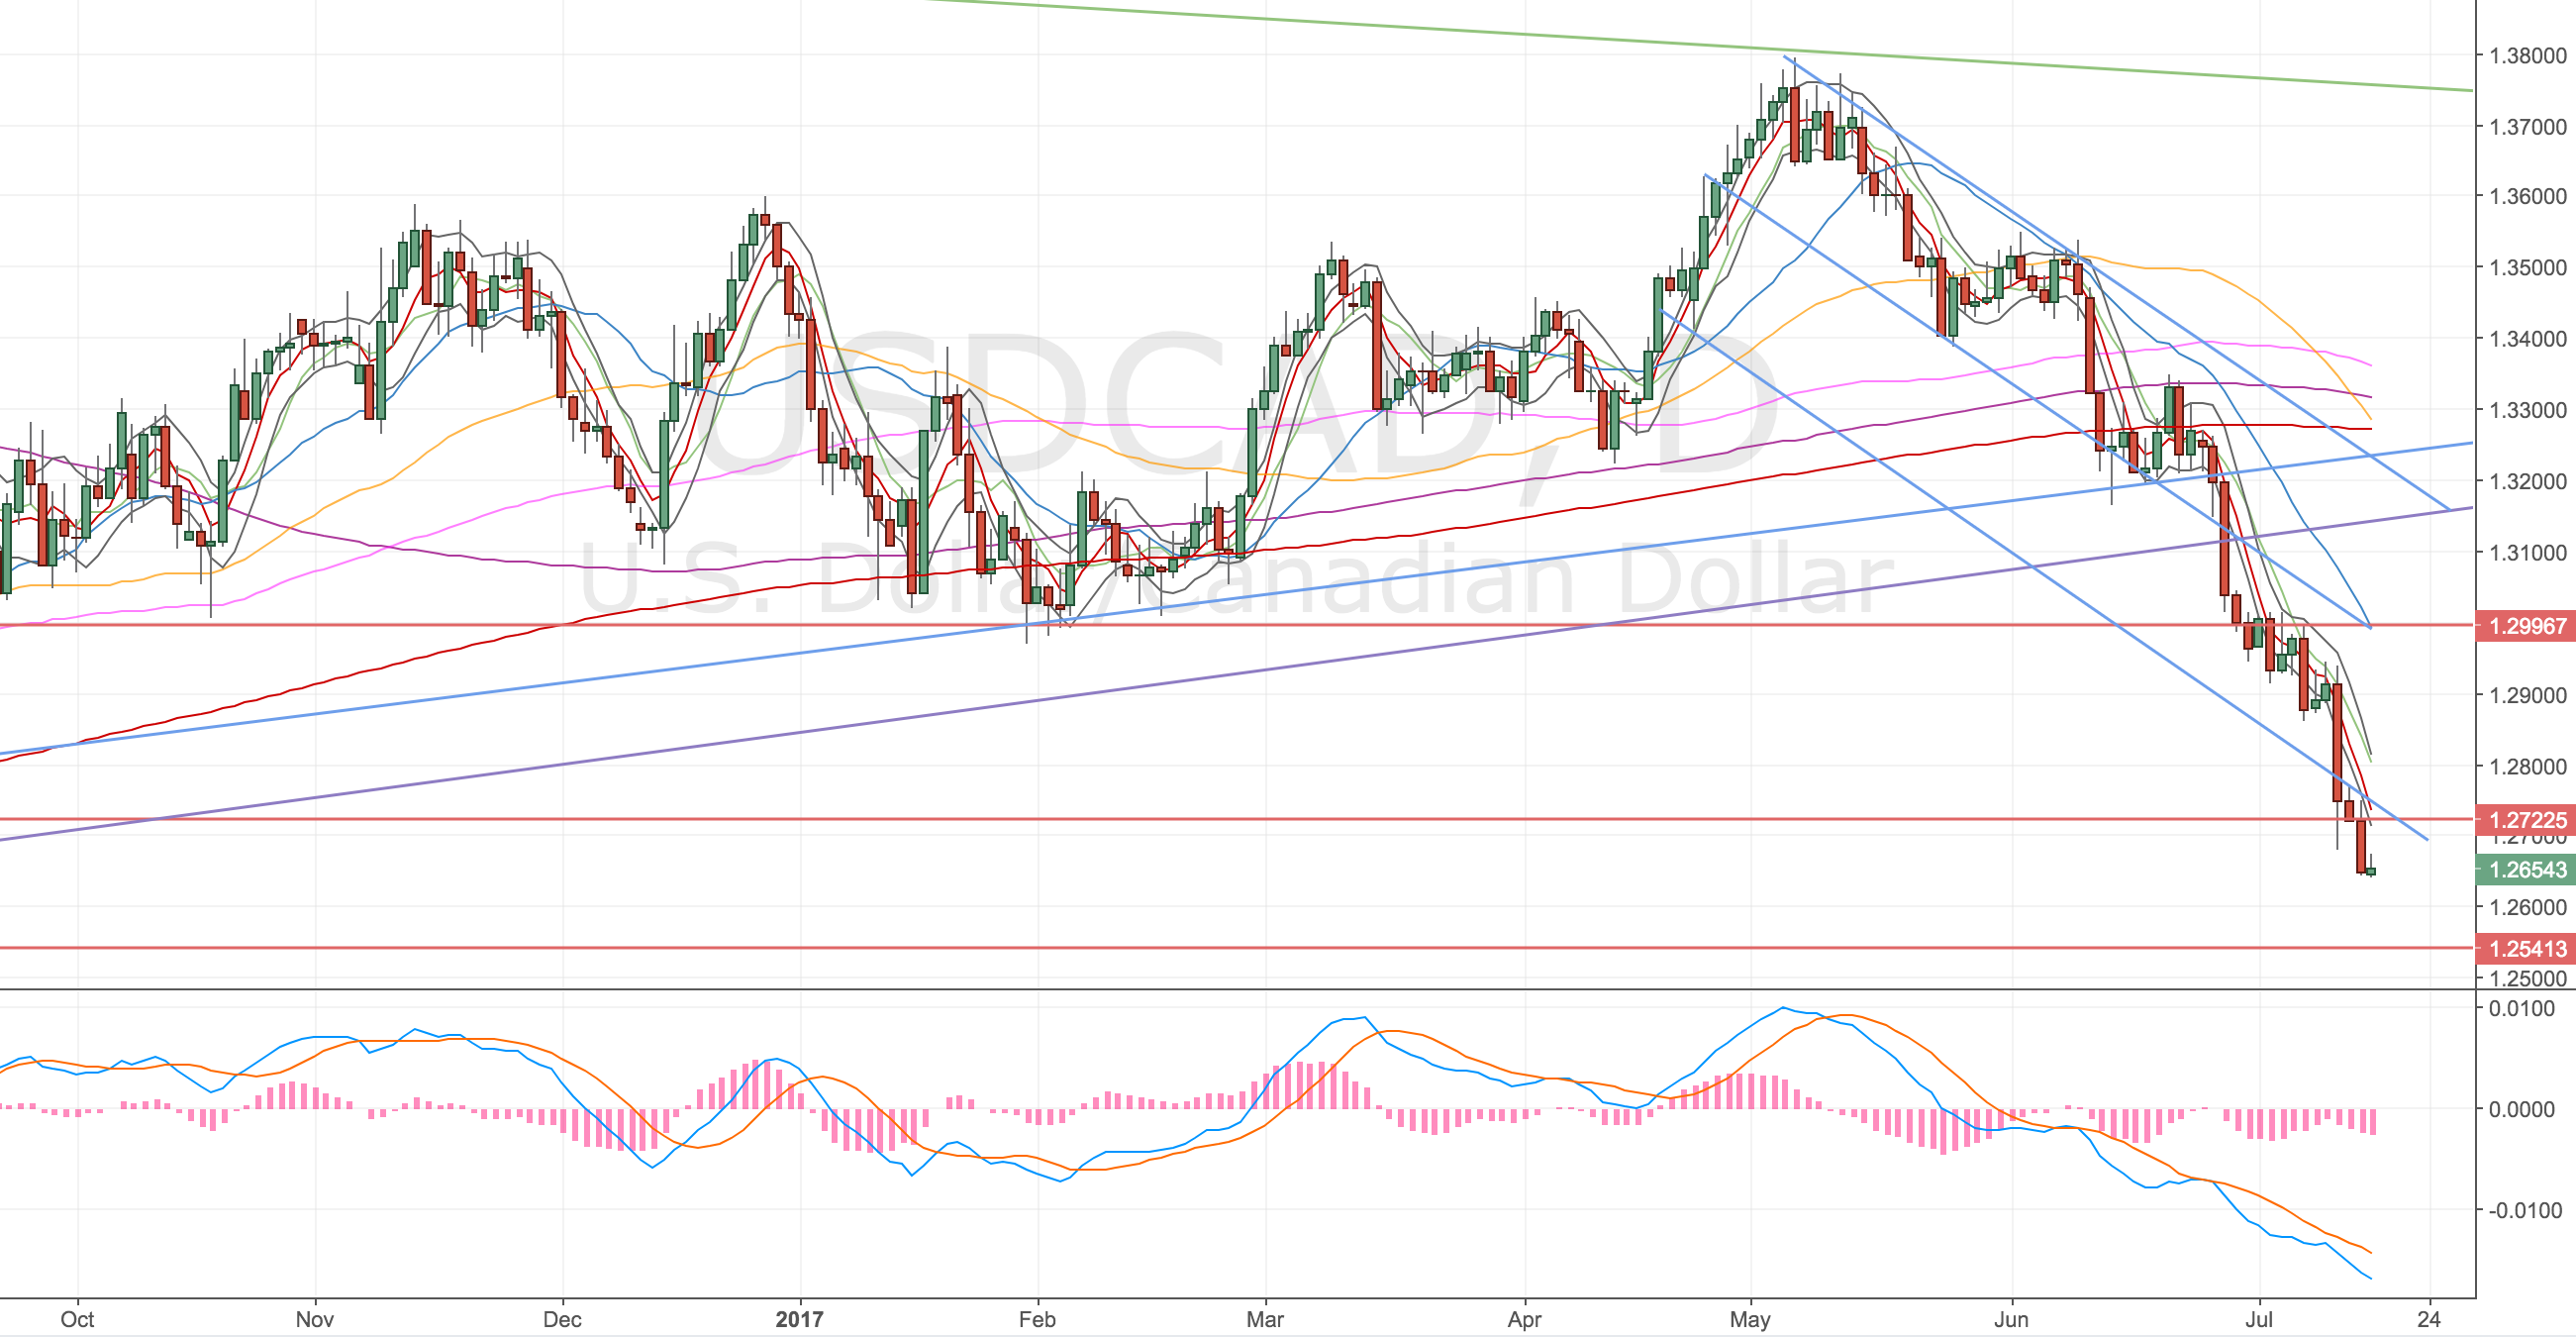
USDCAD Daily Chart – 17 Jul
Weekly Chart
We’re near the 200MA but I’m happy to try starting a long now.
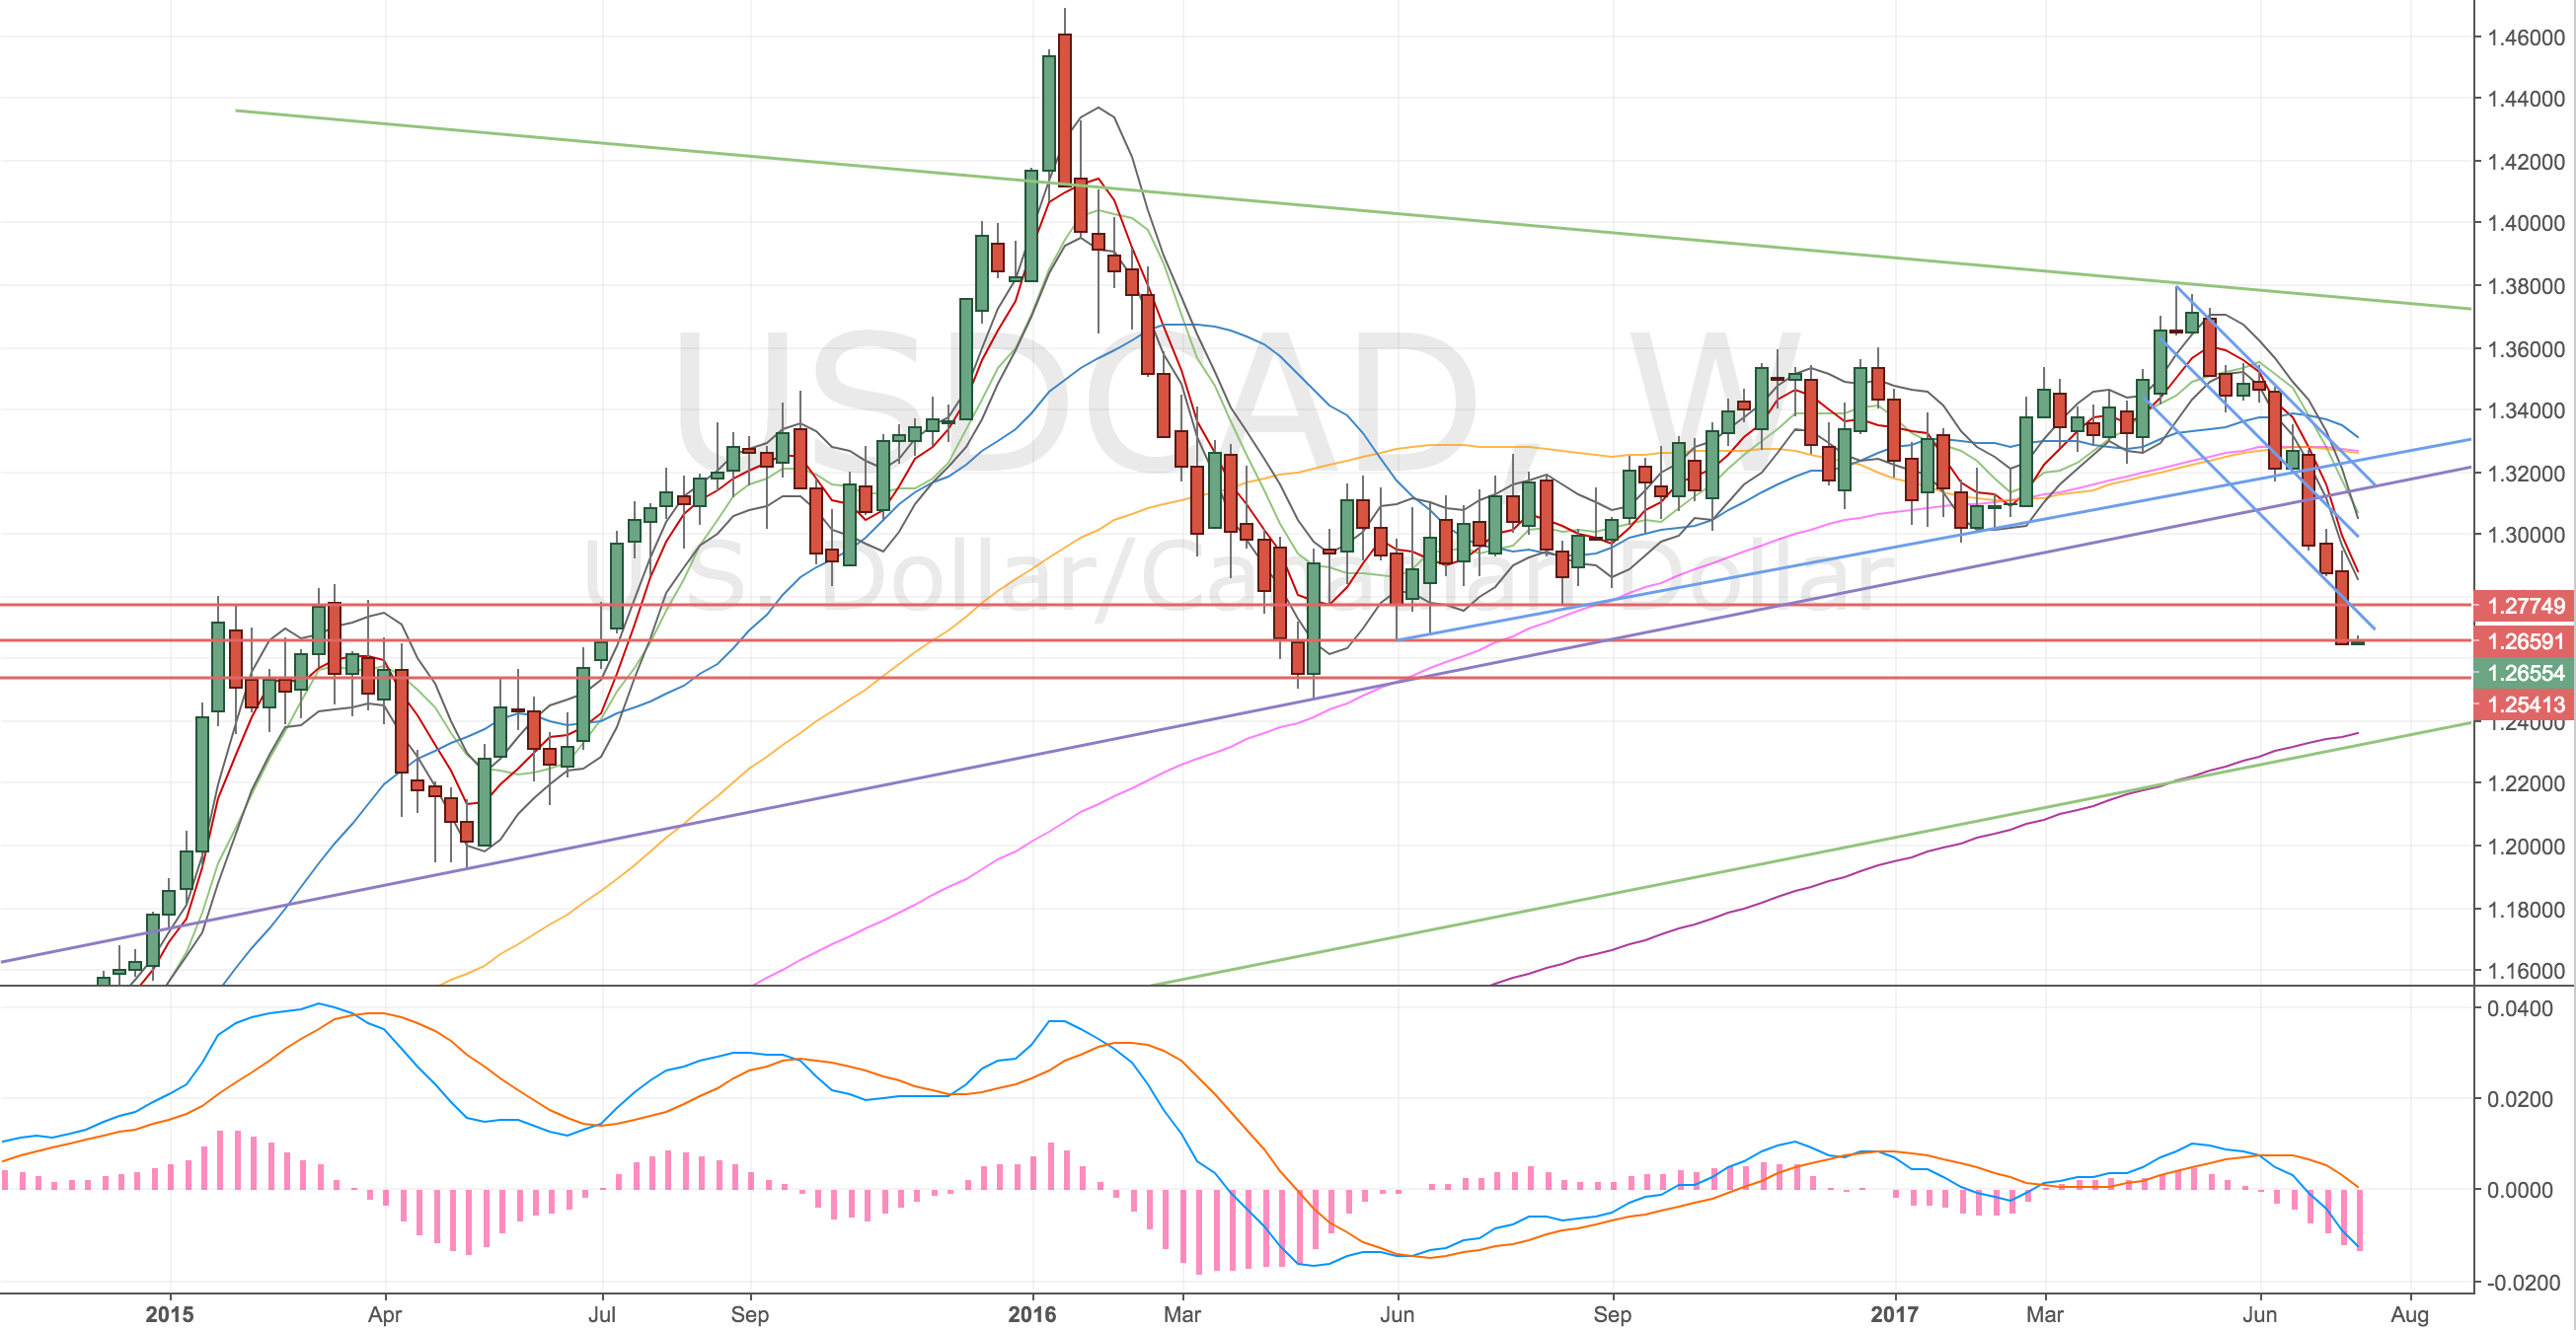
USDCAD Weekly Chart – 17 Jul
Stopped out an hour later – 17 Jul
USDCAD 4H Chart – 17 Jul. The most recent spike low took me out.
Just got stopped out, and price has immediately reversed again! Frustrating. It’s got me thinking more about stops, a couple of ideas that I feel I should test out.
- Trauma stops – set a trauma stop of say 1x Max ATR and reduce to a regular stop once a swing high – low has formed.
- Set the stop off the higher timeframe. However any close below the low should close the trade.
- Exponentially reducing stops – up to a limit. Maybe use some fibonacci thing 🙂
Just ideas for now.