Category Archives: Trades

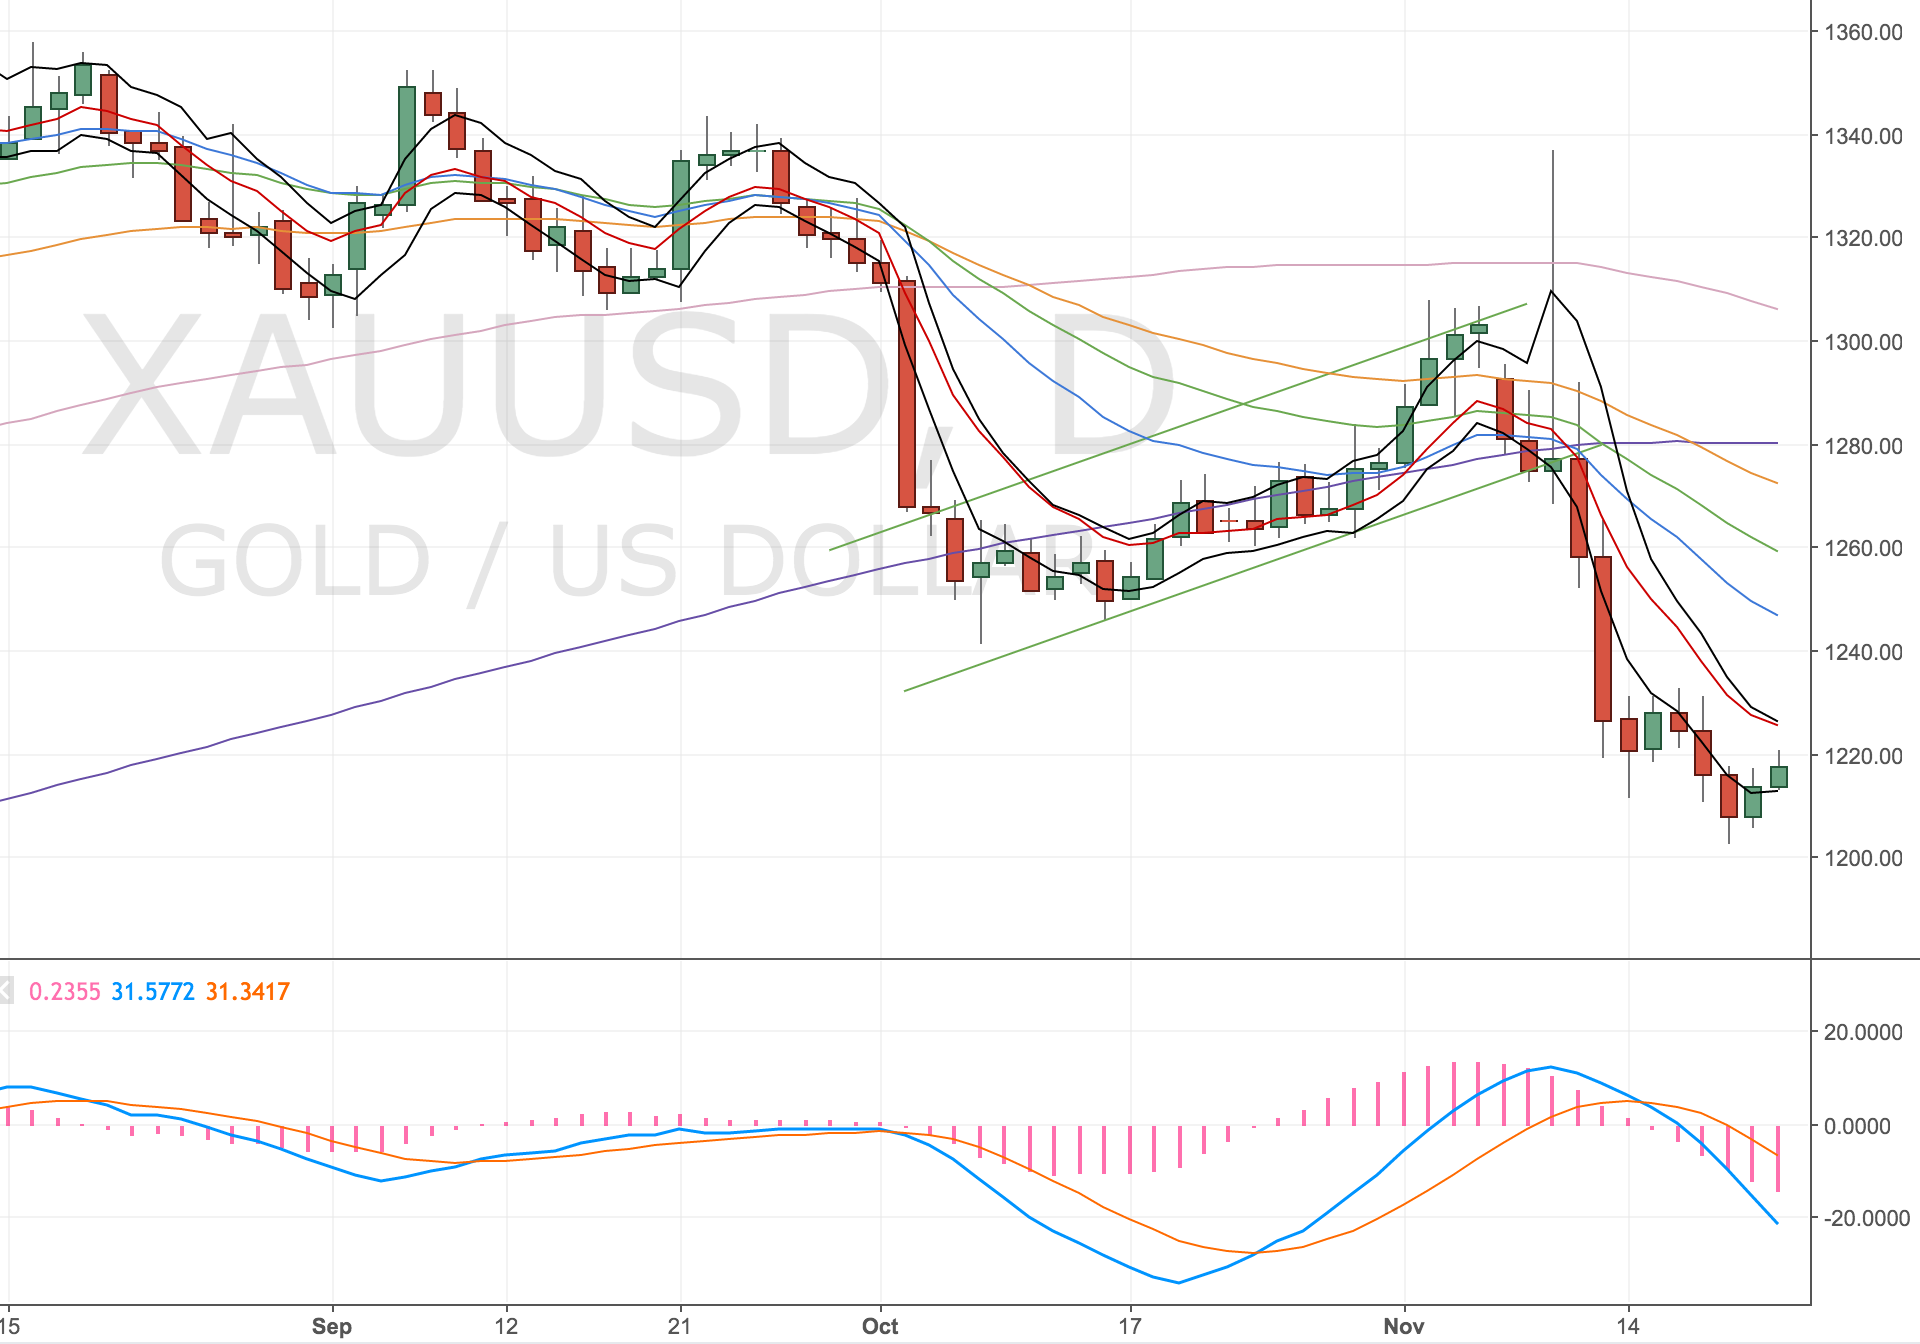
Gold Trade – 22 Nov 2016

Buy @ 1218, Stop @ 1198 (200 pips), Target 1247 (300 pips). Two positions @ 2% risk.

Entering back into the markets after my great performance on election night. The entry I’ve taken is on a DST set up. The entry isn’t perfect – I’d like it tighter – but my back testing tells me it’s better to get in to the trade once inside the bands than wait for perfect price.

Gold Daily Chart - 22 Nov 2016

The set up is on the daily chart at the lows, which have run into prior support at 1205. The Weekly chart also shows support at the 100SMA.

My target is the daily 50SMA, which also coincides with the Monthly 21EMA.

So how do I feel about this trade? Trepidation!
bruce-willis-unsure
I haven’t had a winner for a while but at the back of my mind are the stats and the probability that it will work out in my favour EVENTUALLY. Hopefully over the next 10 trades my performance will turn-around and I’ll start to see some consistent returns.

Update 23 Nov 2016

Just got stopped out on this trade on a big move down. Not sure why, but that’s fine. Will look for another entry if the divergence sets up again.

Oh no! US Election night troubles

I can’t believe it, I managed to break pretty much ever rule in the book, I gambled.

breaking_bad_oh_no

So I traded with my opinion, thought I saw something people had missed (amatuer mistake – retail traders are the last to know what’s going on), didn’t calculate my downside risk, traded with too wide a stop, traded when the market was technically over extended, thought I knew better (I think I mentioned that, but I really did) etc.

I managed to wipe 15% off my account in a couple of trades on US election night. Here’s a run-down of the mess I created.

Ummmm :-|

Ummmm 😐

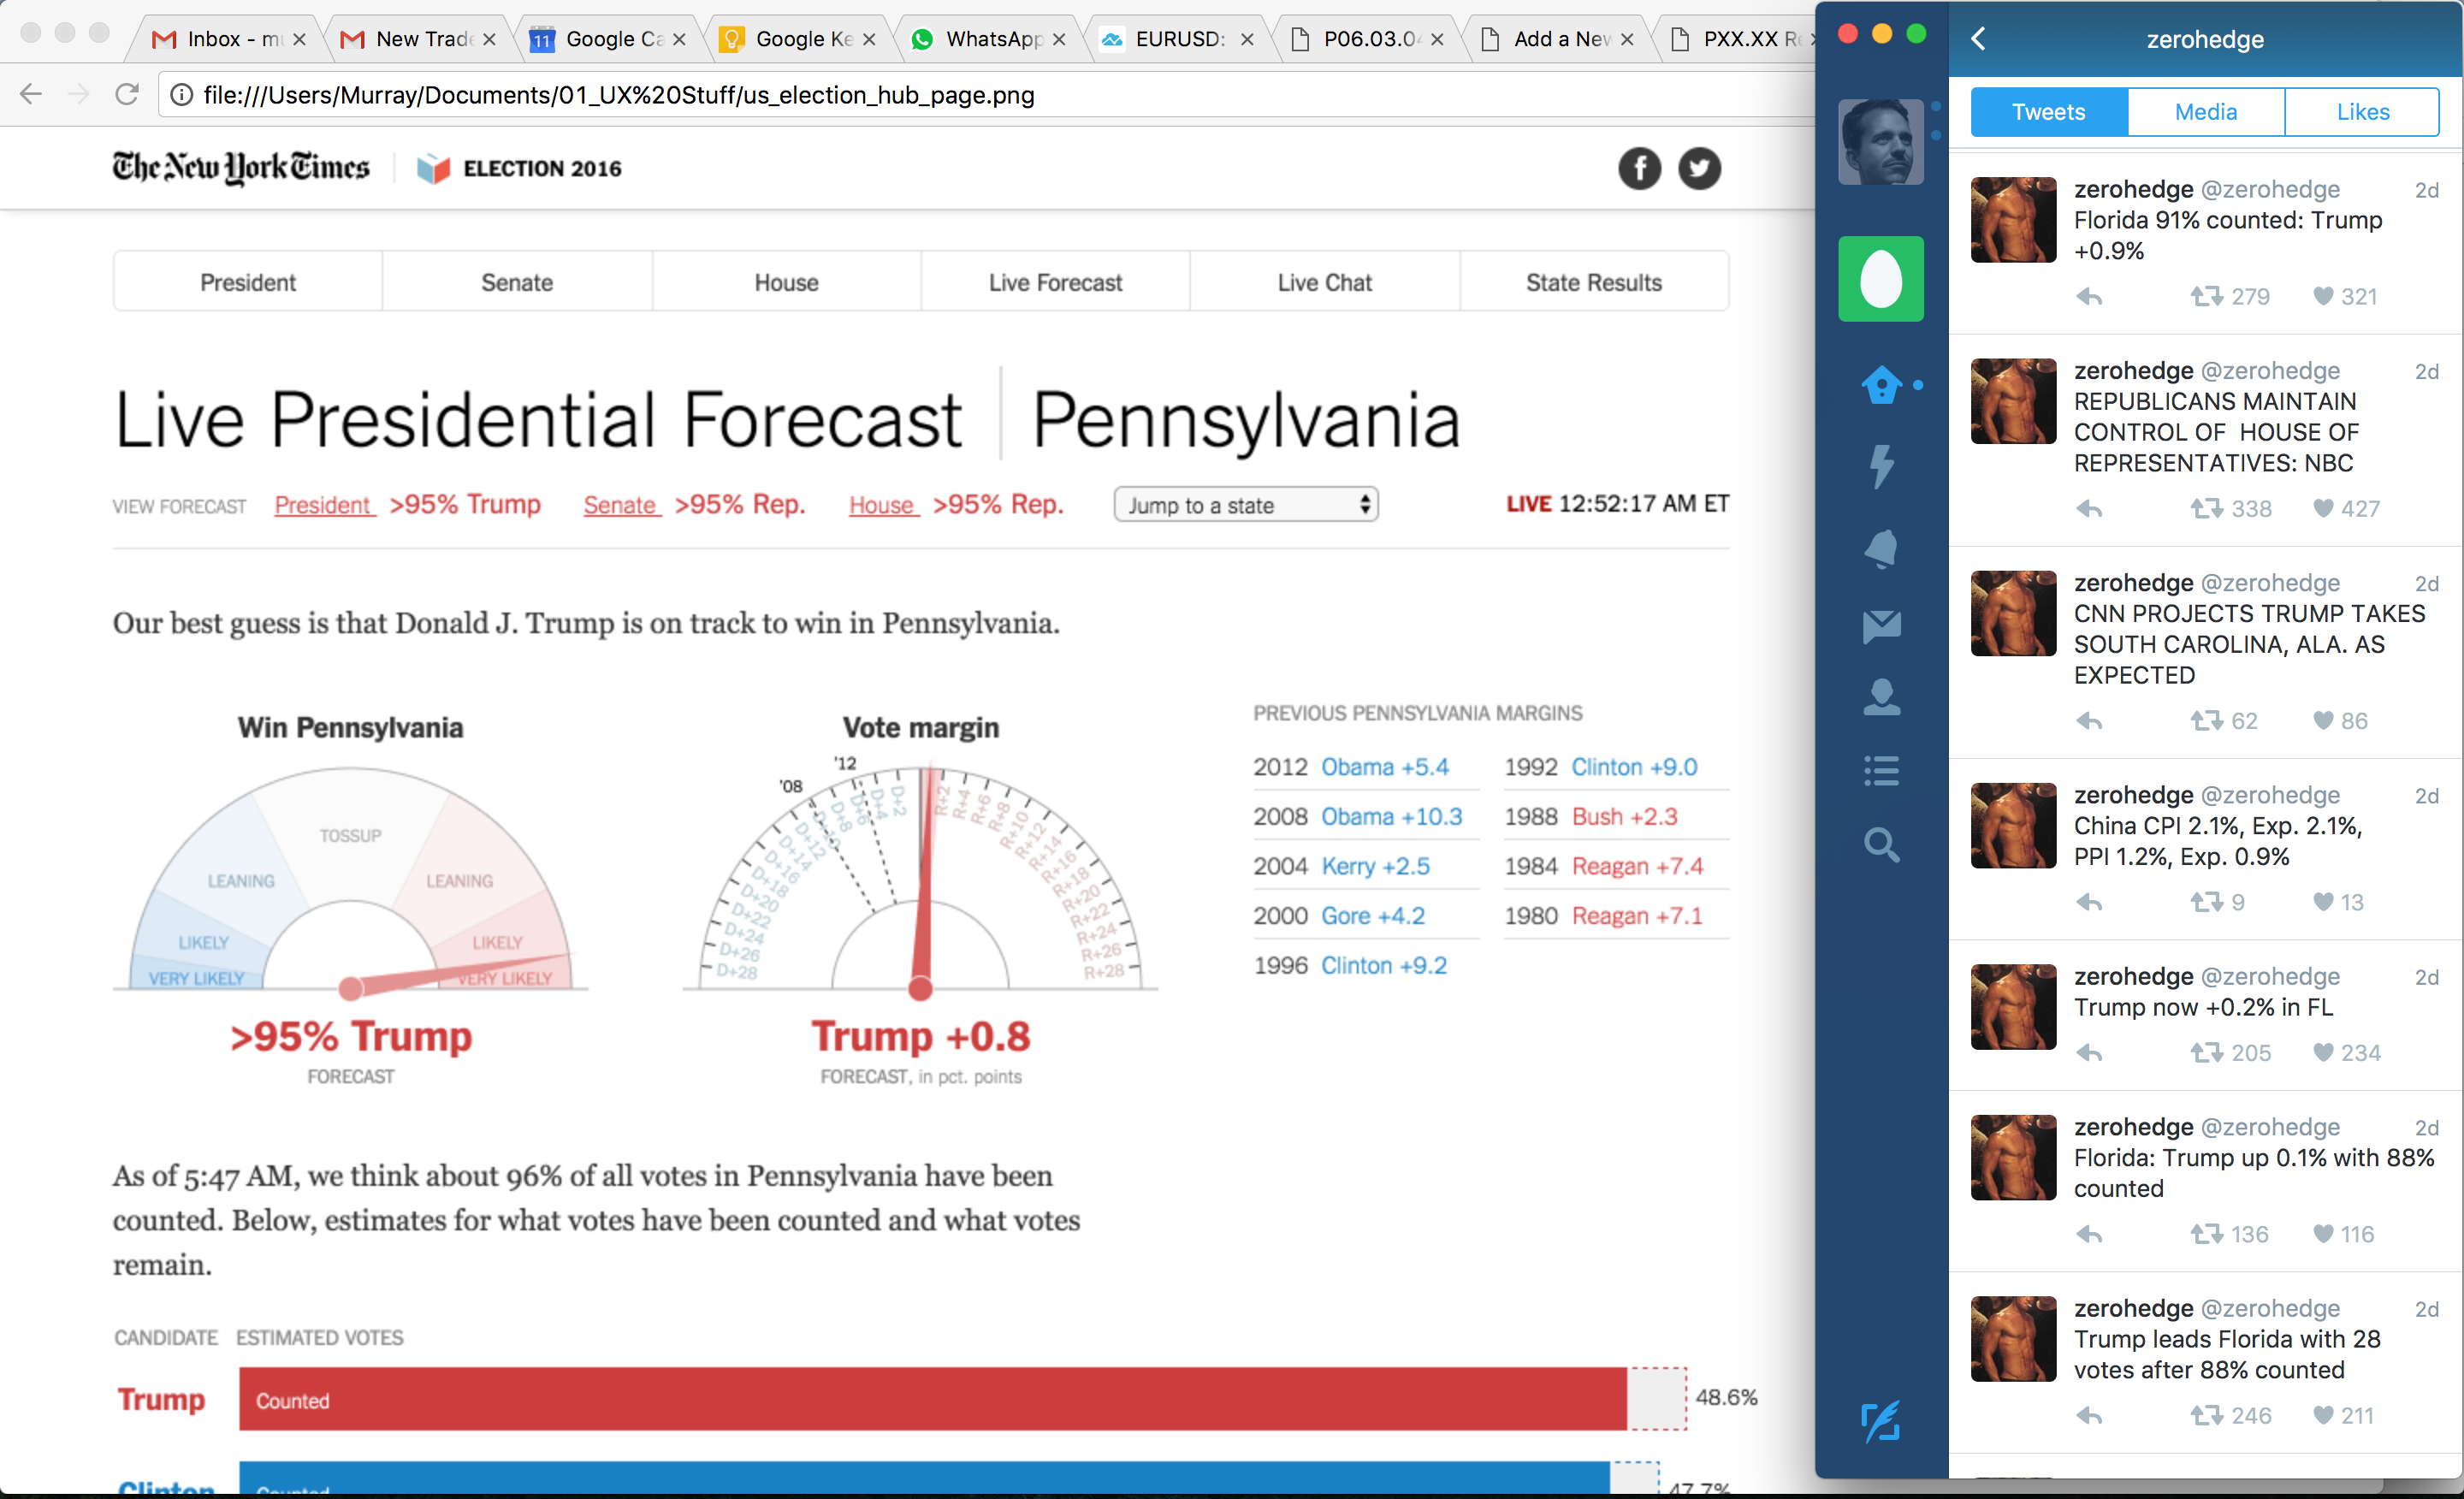
Live voting counts were indicating that Trump might be leading in several key states and the market started to move up. For a while I was basing my opinion on the exit polls so I was sitting on my hand to see if it was really going to happen.

Getting caught up in the election real time.

Getting caught up in the election real time.

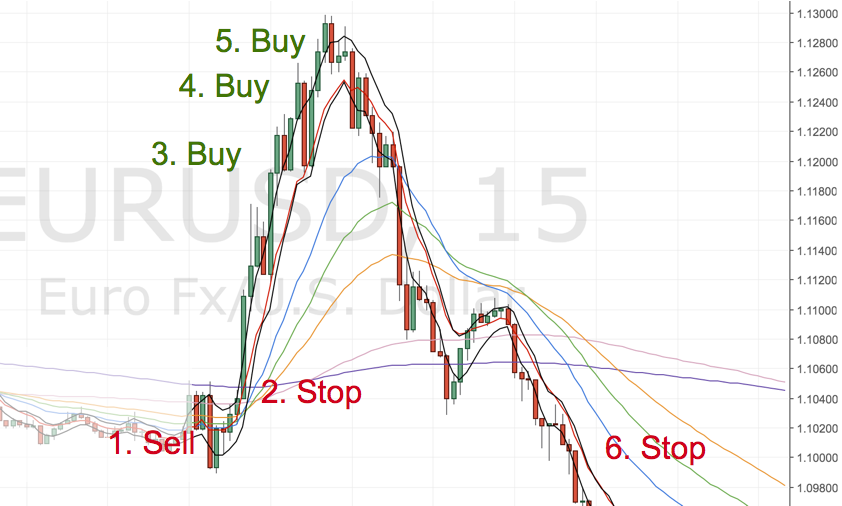
By the time I was convinced, the market was going to sustain the move higher I bought the EURUSD for a small position and put a stop at the lows (~200 pips away – so a wide stop – but ok given the volatility). This trade was fine, although my risk at this point was 2% of my account, more than my typical 1%.

This is where I should’ve stopped!

The market continued another 70 pips in my direction. so I continued to buy the market arbitrarily (1st mistake – chasing the market) convinced that when the final announcement came that Trump was president we’d make another pop higher and confirm the new trend. (2nd mistake – trading on untested assumptions).

I should’ve remembered markets often price in news. That is to say that all info leading up to an event is factored in. So when trump was officially declared the move had already happened because rolling counts were being published during the night.

I retrospectively set my stops at the lows (2nd mistake – could’ve got caught out). No target in mind (3rd mistake – no idea of risk reward). This put my total risk at 11% of my account size (4th mistake – over leveraged).

I also bought some gold as a Trump presidency was an unexpected and unknown right at the top. Again on opinion alone (5th mistake) stop at the lows. Risking another 3% of my account to take my total risk to 15% (6th mistake – even more risk).

The market then reversed on the news and sold off. I was out of all my trades by the end of the day.

breaking_bad_oh_no_2

It has taken me about 20+ trades to build my account and I’d reversed all of those gains in one go over 12 hours.

I didn’t wipe my account out and my account is small to my overall wealth, so the loss wasn’t devastating but it still hurt. All that time and effort spent over the summer! With the exception of moving my stops, I broke every rule I can think of. What’s most concerning though is that I didn’t realise it at the time.

Lessons learnt burnt:

  • Leave your opinions at the door.
  • Big moves look tasty but go both ways quickly. To stay in a position you have to trade small with wider stops. Therefore you’re less likely to make big money.
  • Big volatility leads to slippage, prices/orders don’t always get honoured, again reducing ability to make money.
  • Gaps often occur in price. No one gets out of a gap. (This is particularly common in stocks where price rerates.)
  • Mainstream media don’t drive markets. They report what has happened and attribute events to moves.
  • Don’t swing trade a week before and a few days after a major market event. There’s often hysteria building before the event (opinion polls, rumours, etc.) Again you’ll be the last to know. I needlessly got stopped on a previous gold trade taken about a week before the election.
  • Extreme volatility messes up the charts and is likely to give you false signals.
  • Only ever trade a methodology you’ve backtested and are comfortable with the risk and probability parameters
  • It’s better to miss a move and live to fight another day then to lose a chunk of money and set yourself back months. Time is money and trading is a business.

Gold Analysis – 31 Oct 2016

Short gold now (@1275) for a small position (due to the uncertainty around the US election). Stop above the prior support, now resistance @1305. Target @1205 (Daily 500MA and prior lows). Risk-Reward: 2

Monthly View
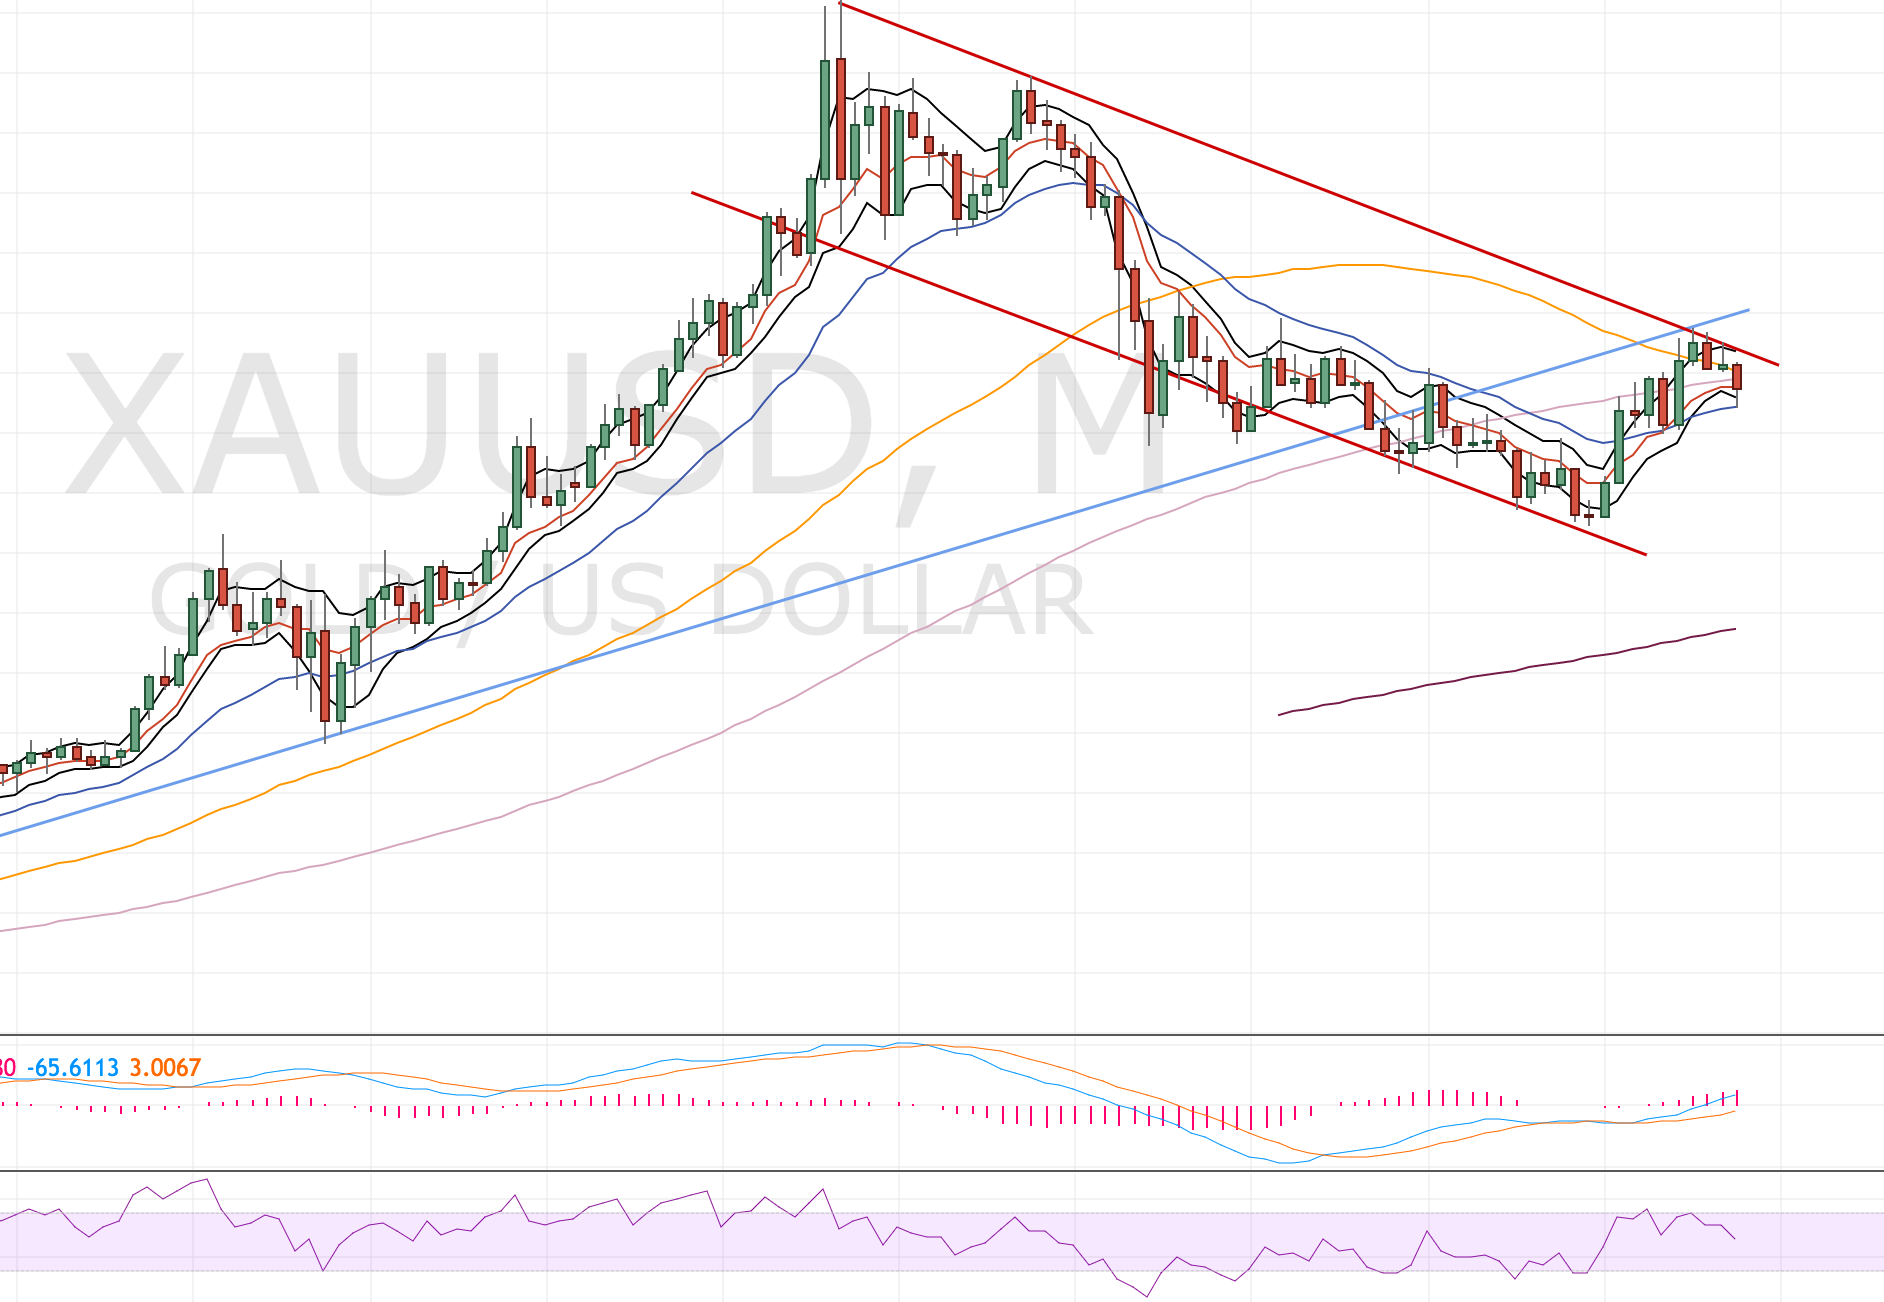
Gold Monthly Chart - 31 Oct 2016

  • Price has started to move away from the upper trend line.
  • RSI shows divergence at the recent highs
  • 50MA (yellow) about to cross the 100MA (pink)

Against that view, price has held the upper trendline for a few months so might indicate more upside. Price also tested but didn’t break the lower band.

Weekly View
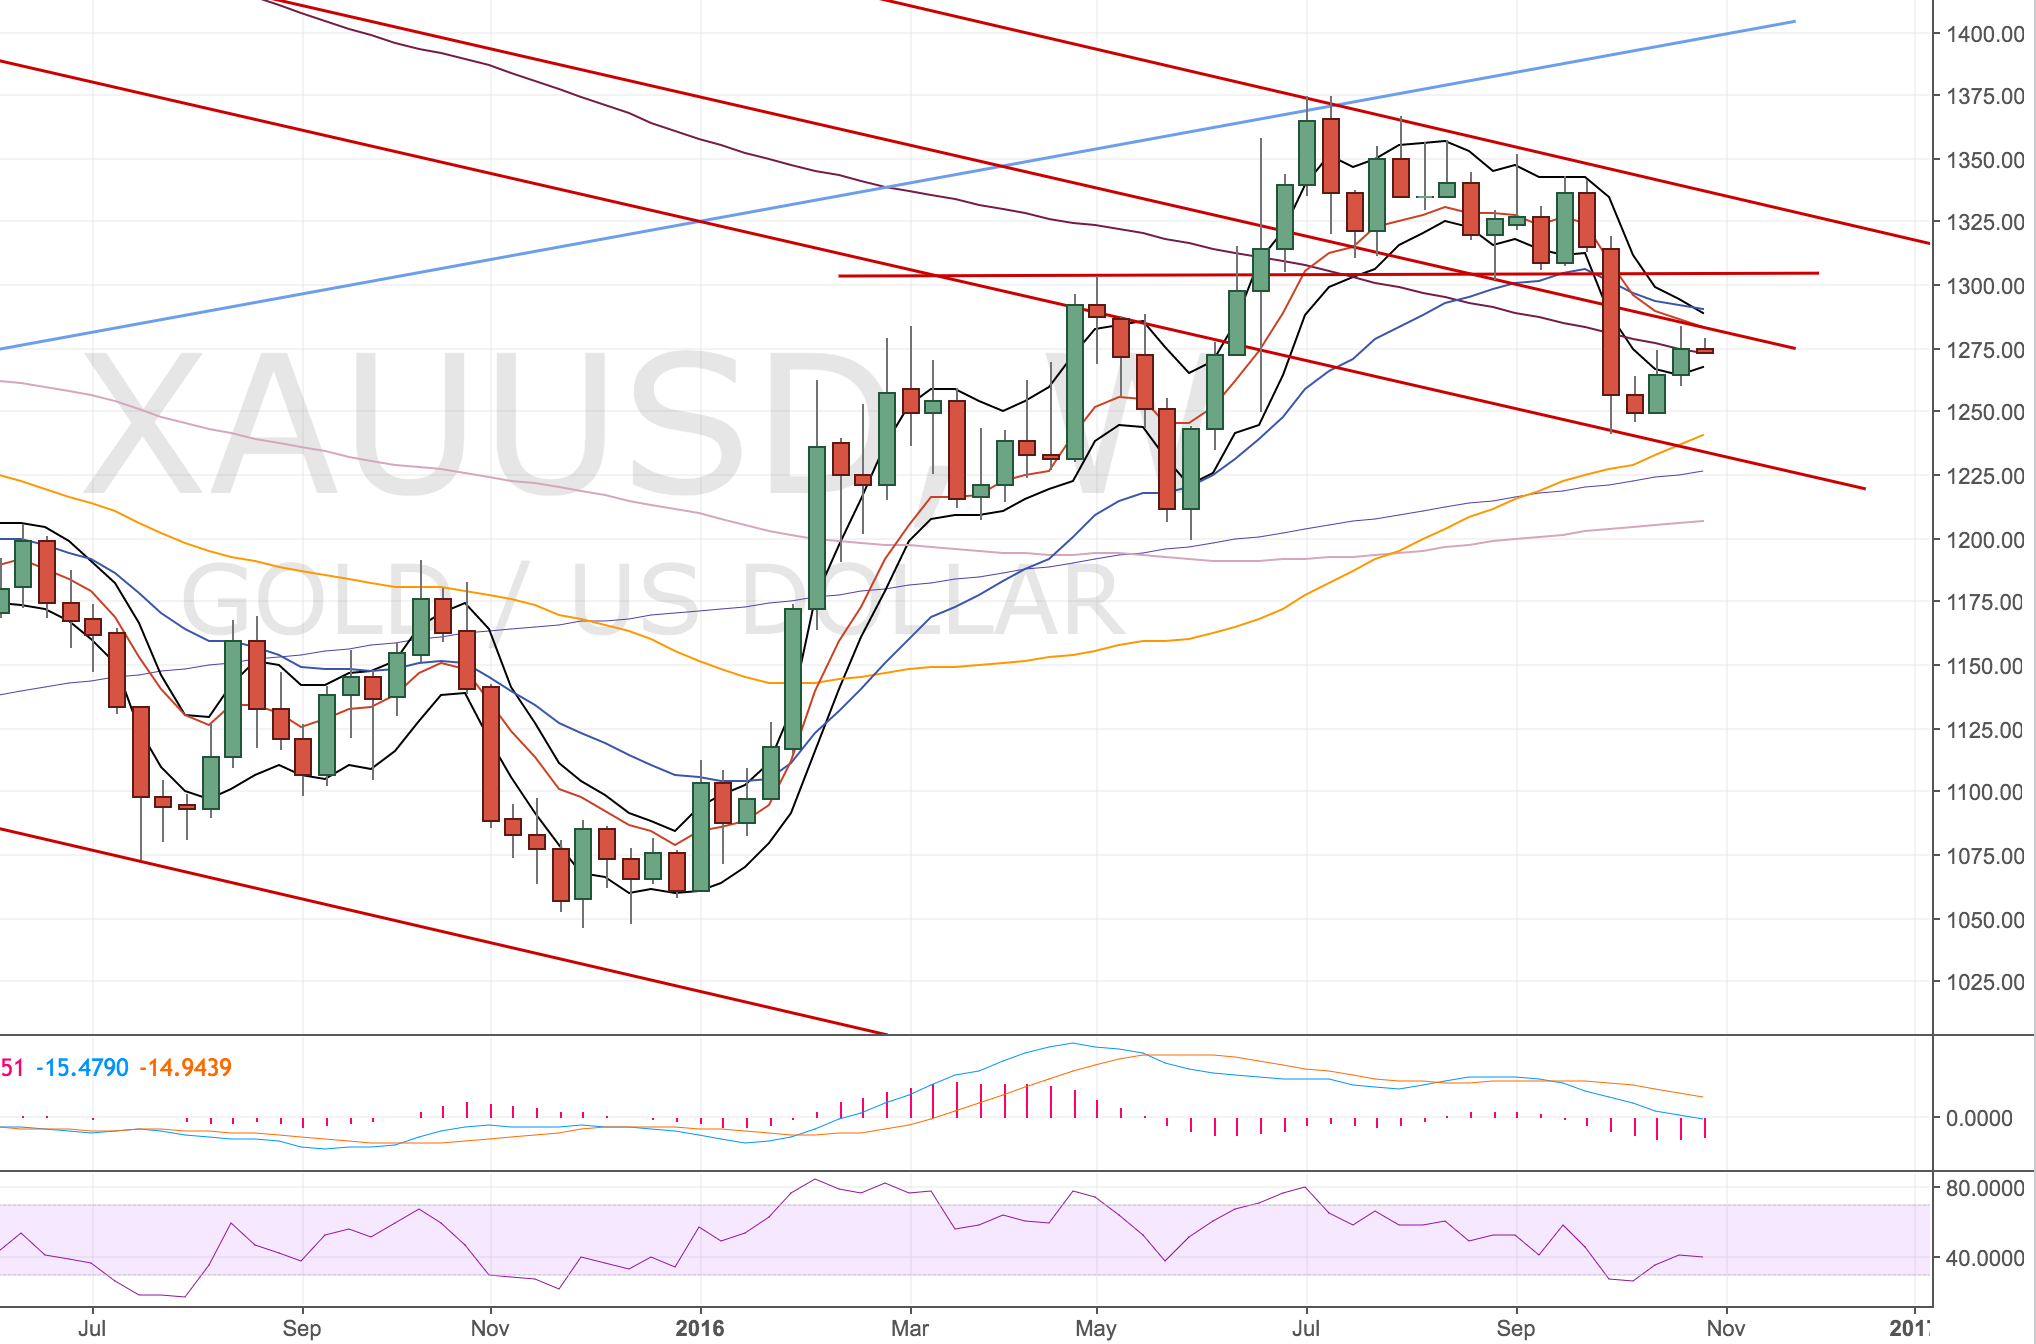
Gold Weekly Chart - 31 Oct 2016

  • Price has broken through a downward trend channel and is now coming back up to test it.
  • That trend line coincides with the 8EMA (red) (which has just crossed the 21EMA – blue)
  • The upper band is also near these short term MAs.

A few points against, there’s rising long-term MAs which will offer support 50 (yellow), 100 (pink) and 500MA (purple). The 50MA has just crossed the 500 and 100 as well.

Daily View
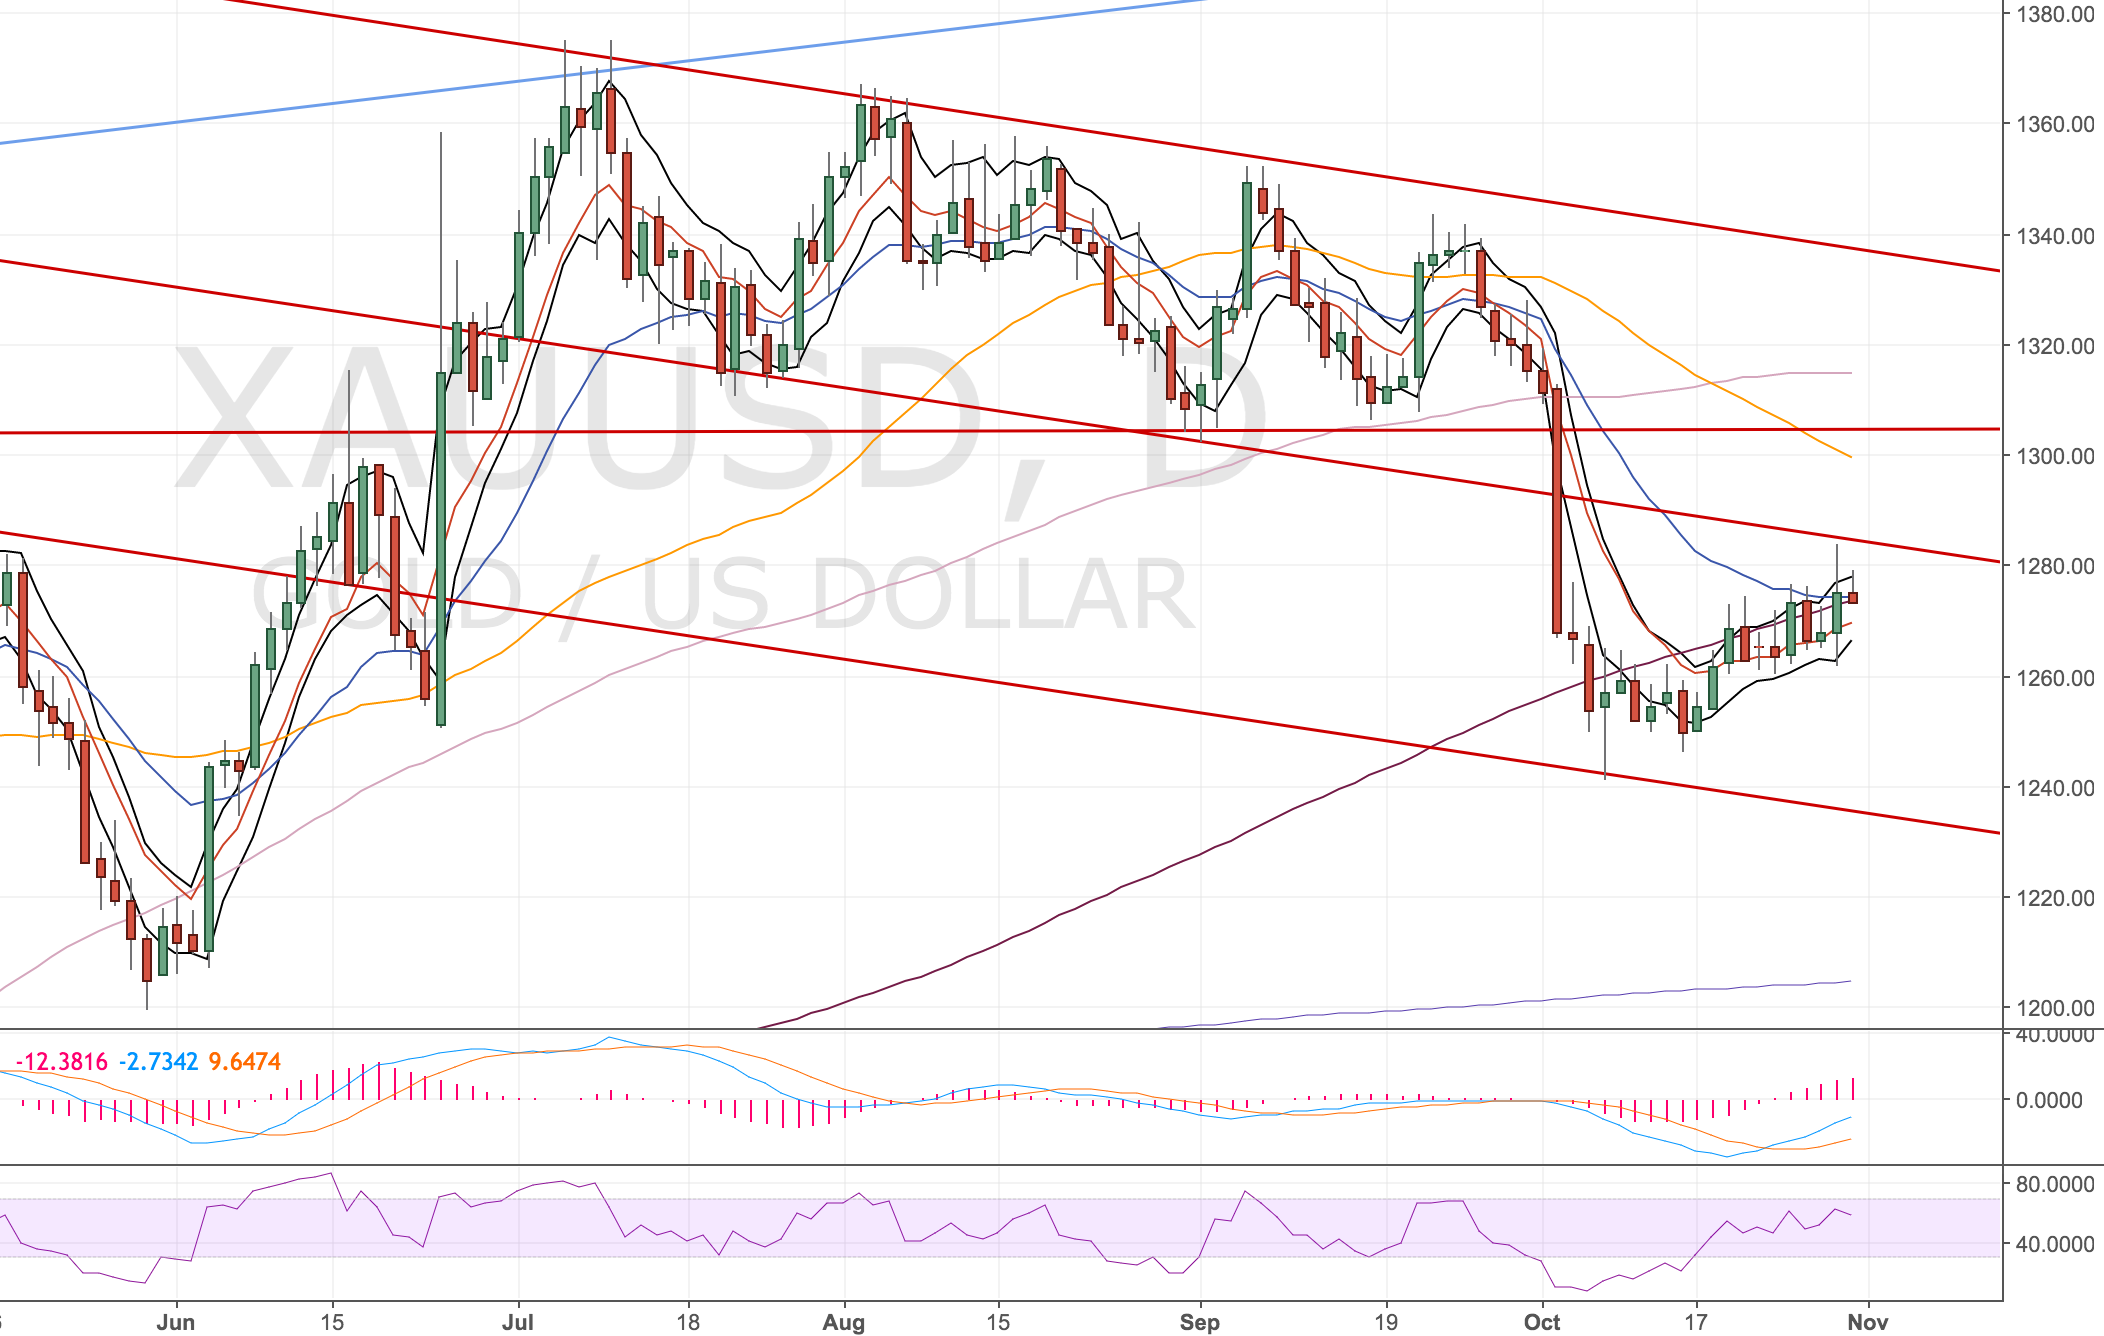
Gold Daily Chart - 31 Oct 2016

  • Price has come down to hug the 200MA (purple), so would expect a follow through.
  • The next MA is the 500MA (purple) at 1205 (nice target?) Quite far away but does coincide with prior lows.
  • There’s a bearish flag pattern so would expect more downside.
  • The current daily price range is very tight

Against those points, there’s no real sign of waning of momentum at the moment on the RSI or MACD.

Other thoughts

Look at the multiple moving averages:

  • Weekly: Price looks to be working through the long-term moving averages to the downside (was a bounce off the Monthly R3).
  • Daily: Price has gone below and is now testing the slower moving averages.

Overall

Weighing up the points I think there’s enough to be short gold for a small position for now. I’m not sure about the affect the US election will have so playing safe. I don’t see why another Brexit style spike couldn’t happen if Trump wins.

Update 4 Nov 2016
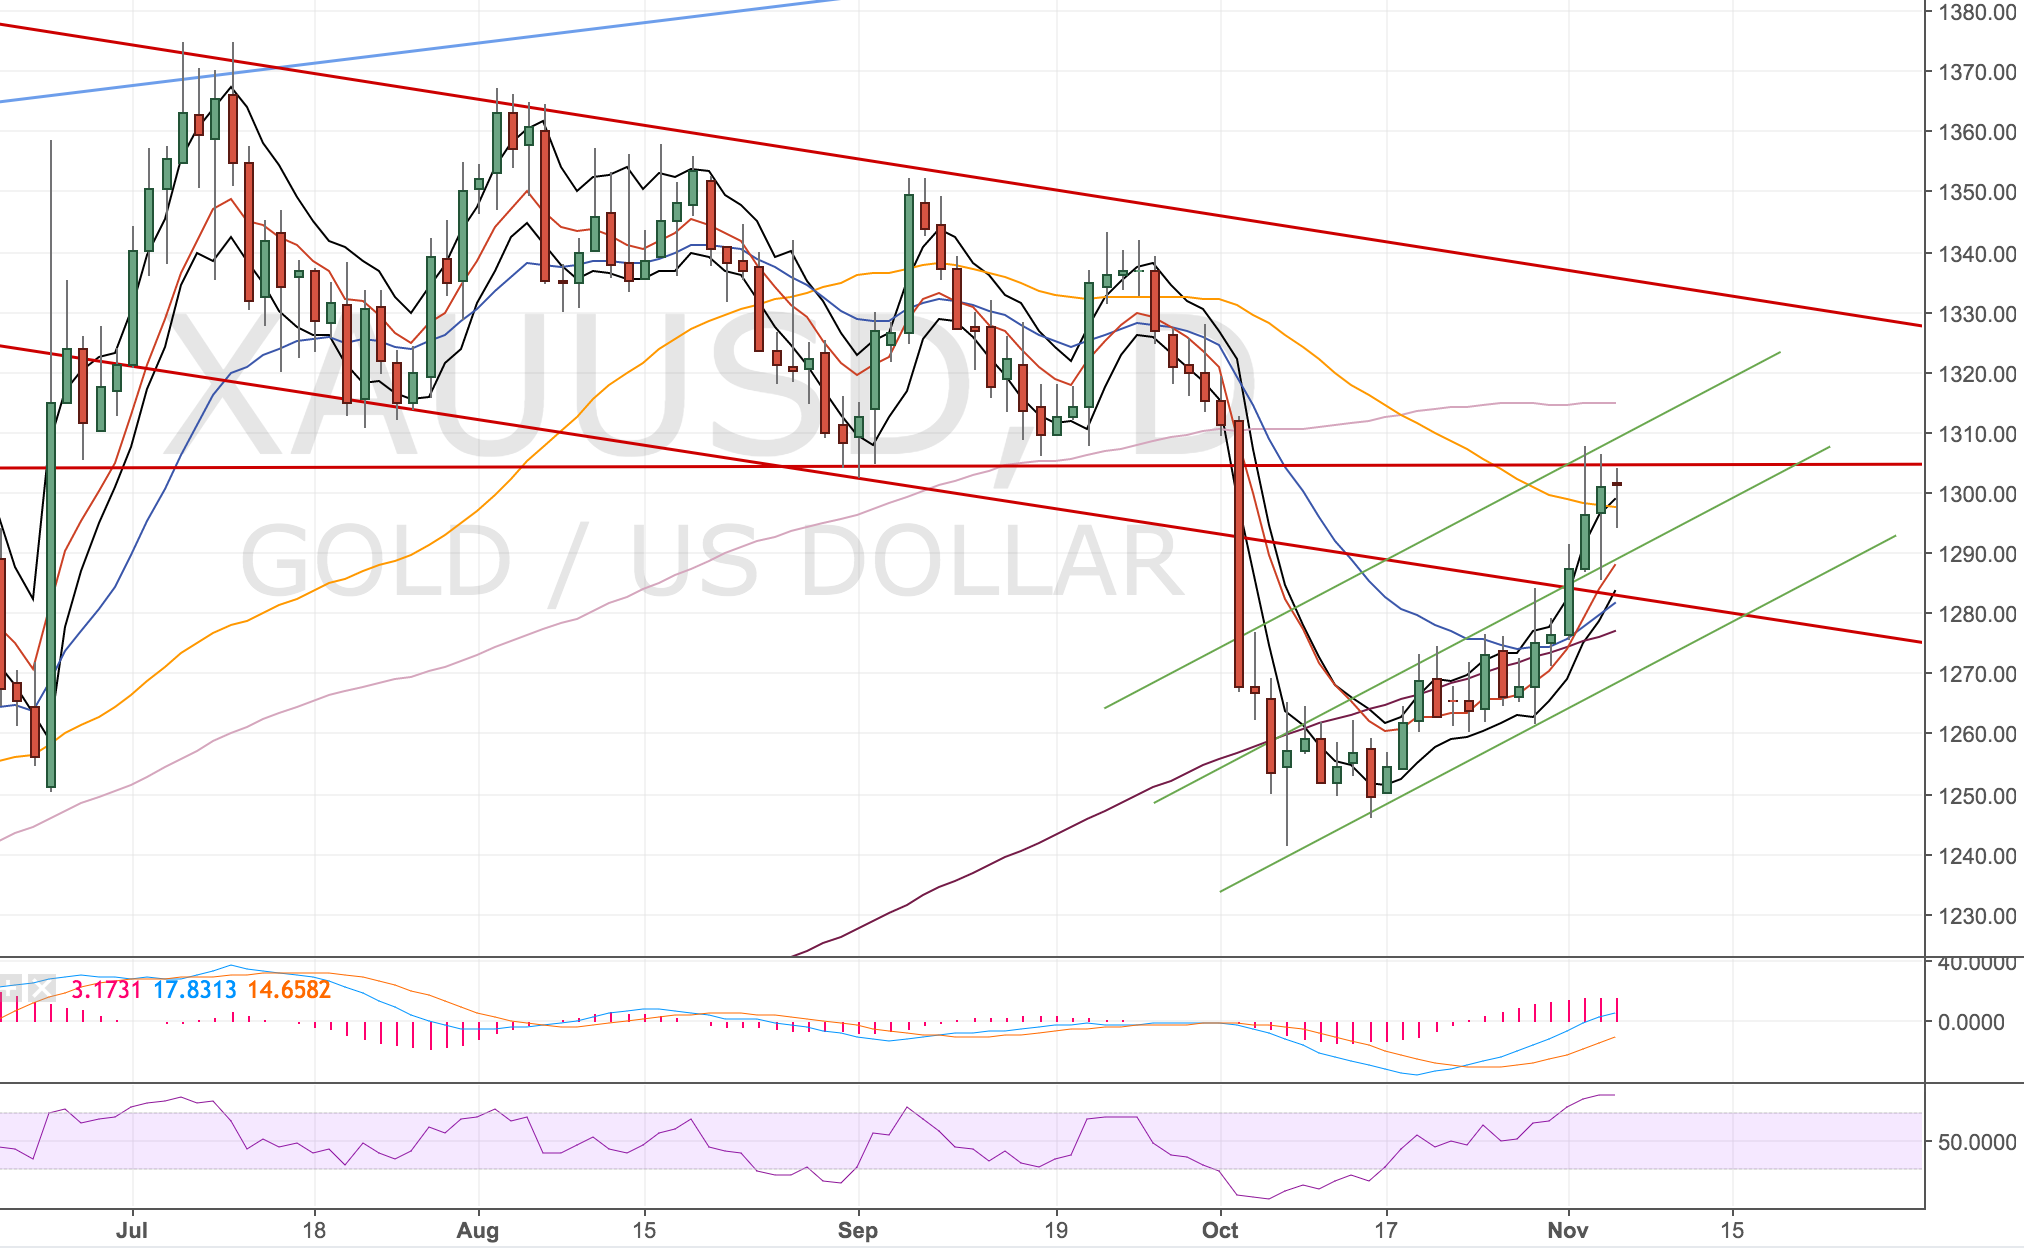
XAUUSD - Daily Chart - 4 Nov 2016

Just been checking this trade, since we placed it and price action has moved higher. For now, it seems to have tested the resistance at 1300s and is holding … for now. I actually tweaked my stop slightly! The 1305 level I identified previously was right on a cluster of prior lows and so I moved it a little higher to 1311.

I’ve also added another trendline double the width of my last one. This was a technique I picked up from MoneyWeek about using a prior trend channel to project the next target. You copy the trendline and create an adjacent trend channel. Seems to hold fine.

We’re going into NFP today, and we’re currently sitting @1300 so I can see my stop getting hit if there’s another miss on figures. It’s a small position so I’m happy to sit on this. I’ve invalidated a few of my previous reasons to get short but I can still see downside potential in this.

Hopefully price will move away from stop so I’ve got some more breathing space, if Clinton wins the election, I can see some good downside potential.

Update 11 Nov 2016

So Trump won and gold has fallen quite dramatically – the opposite to what I was expecting. The initial rally in Gold over election night was all bark and no bite.
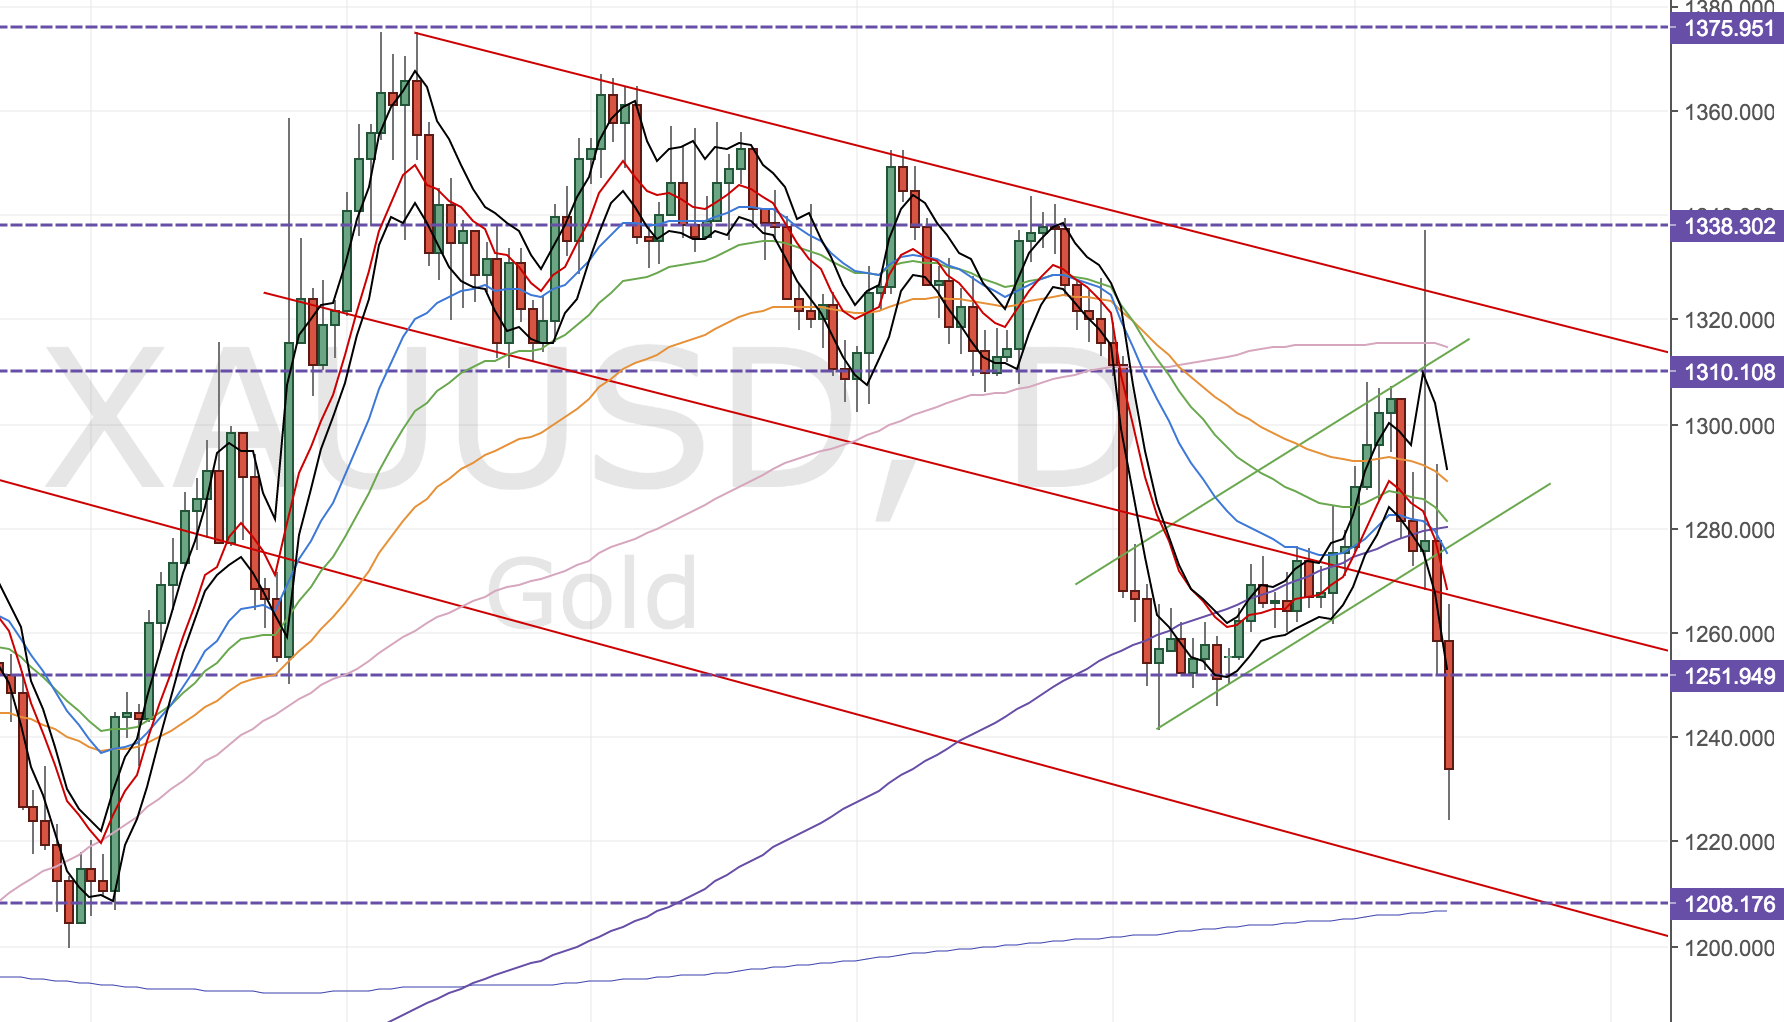
US Election night stopped me out

US Election night stopped me out

Anyway, my short trade was a loser. I was stopped out @1311 on election night with the surprise news that Trump was going to win. I’m fine about this, I knew it was a risk and it turned out to be true. The position size was small and it looks like – for the time being – I was trading in the right direction. So I will look for another reason to get short.

I could’ve not traded, knowing that it was likely to be affected by the election but that was the reason I kept my position size small. It was a small lose just under 1%.

So I’m looking for another short set up, but in the meantime I can see a retest of a prior low which hasn’t been tested for a long time. I’m interested in the retest of this level @1208 level. It’s a first test since June and I’m considering another small position buying at that level for a bounce to the 21EMA using the bands. Will think about it over the weekend.
GBPUSD Trade – 23 Sep 2016

Long @ 1.3004, SL: 1.28364 (168 pips, just below collective lows), TP: 1.33864 (382 pips), Risk:Reward: 1:2, acc risk: 1.7% (Again will look to add if we move up.)

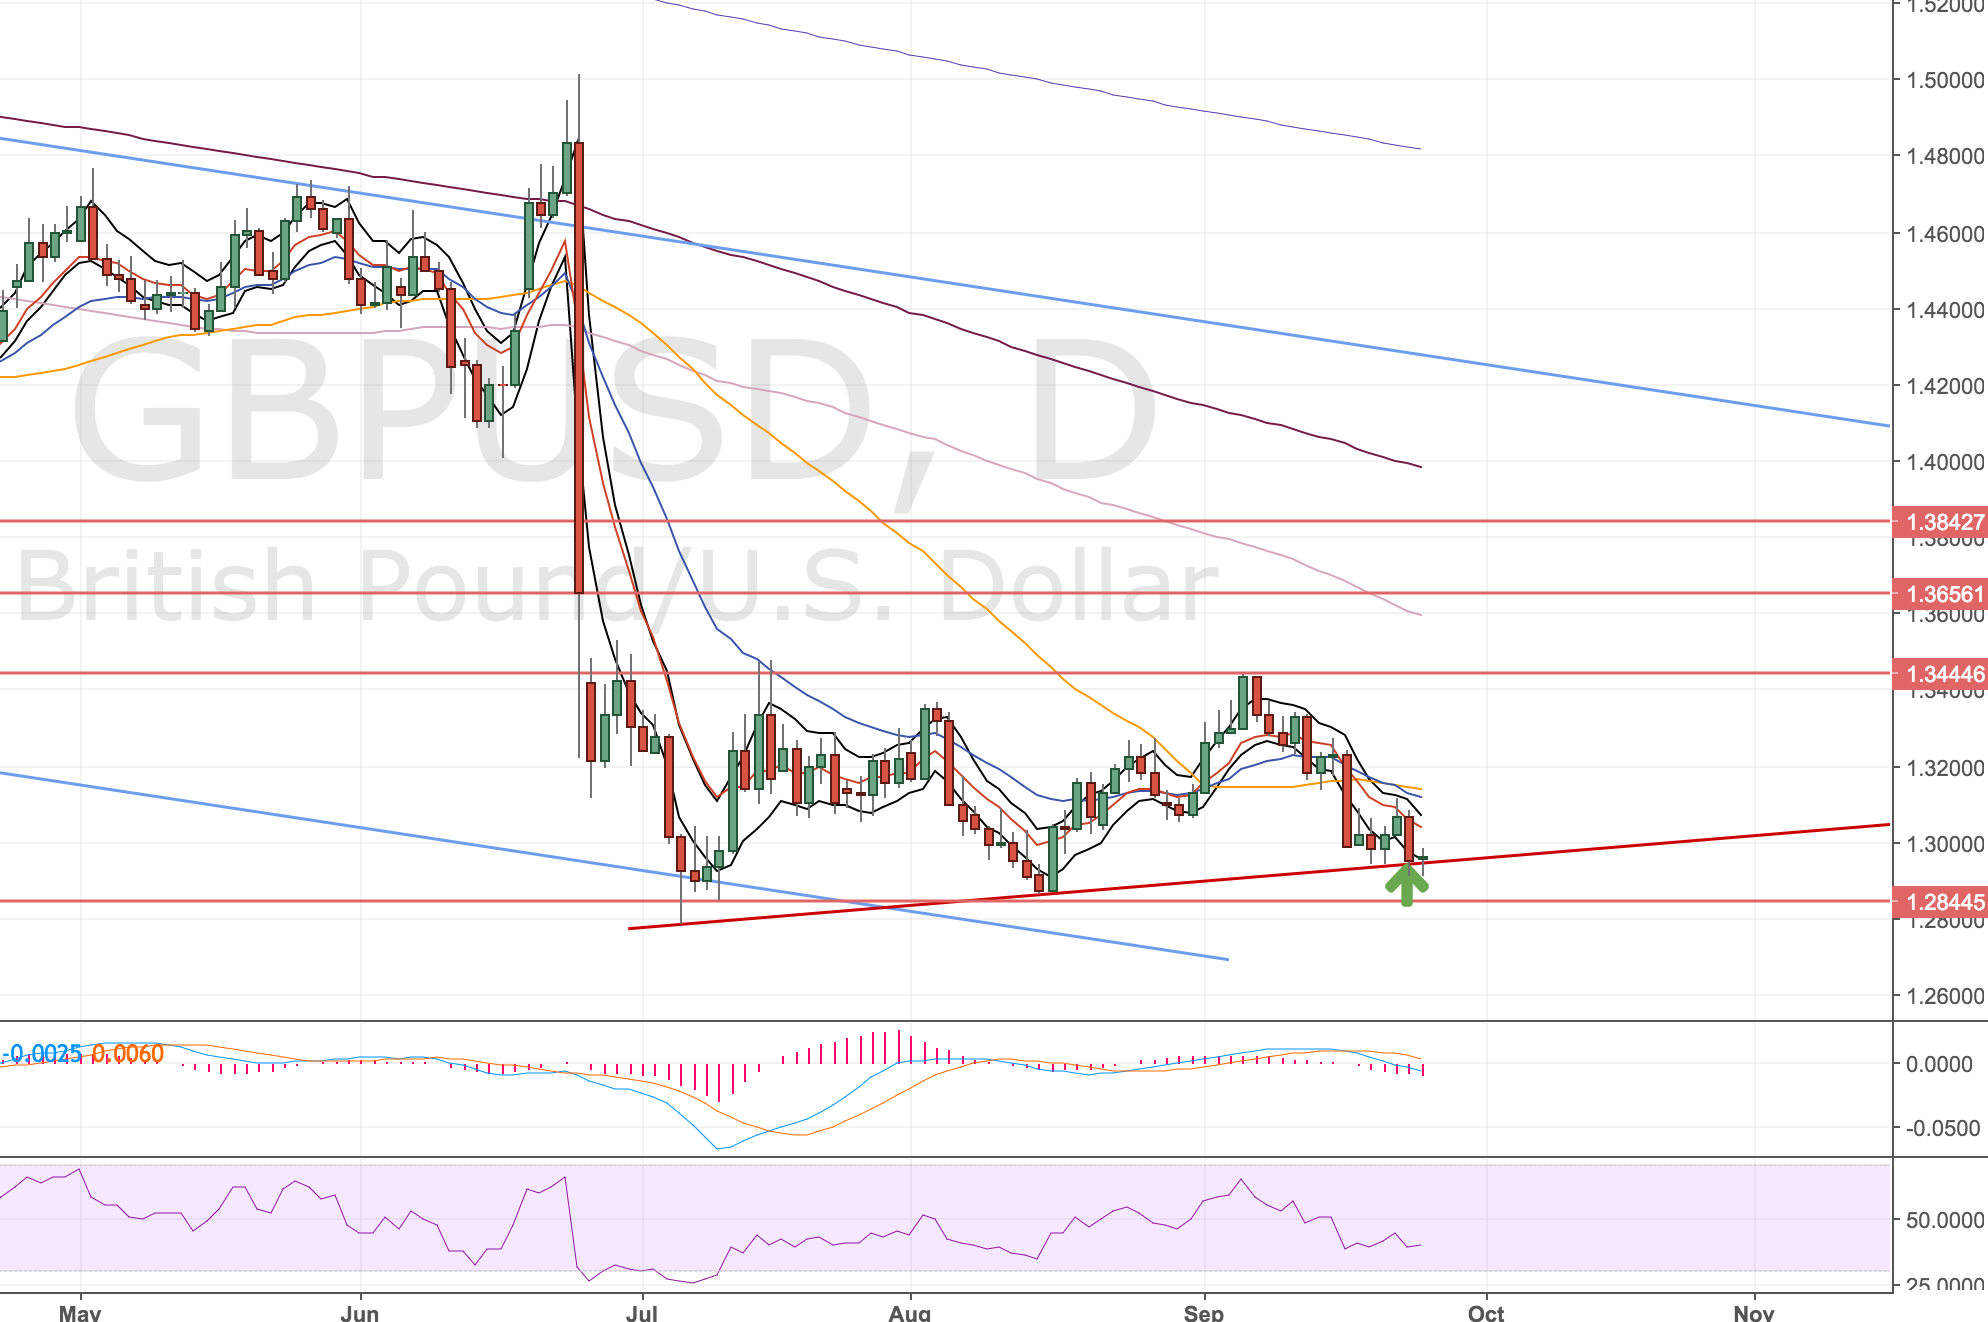
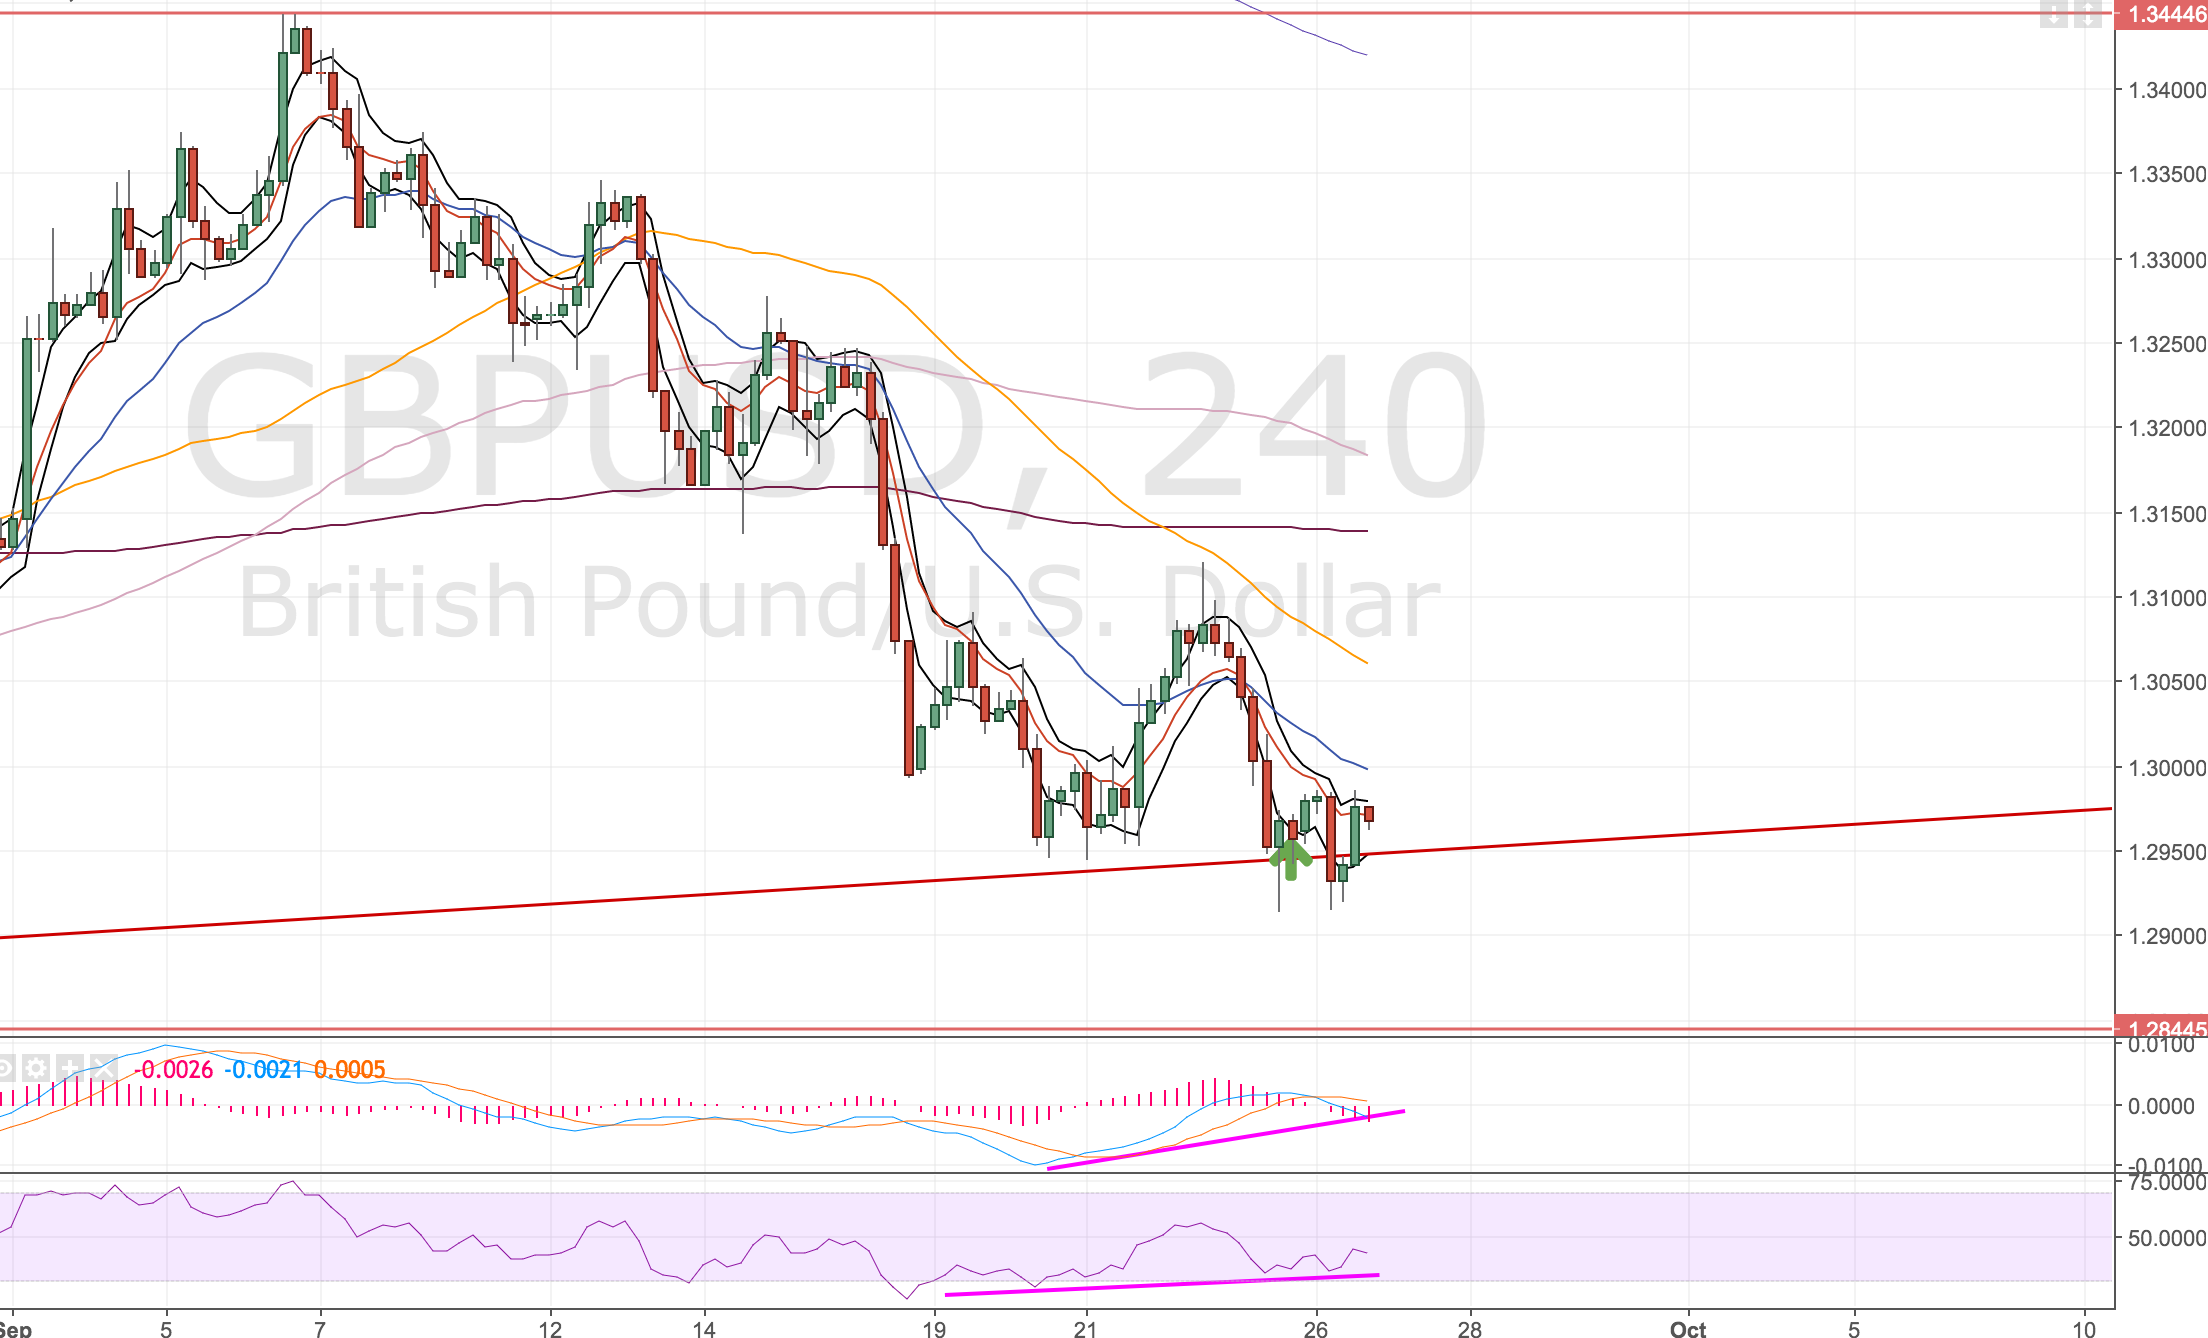
Another day, another attempt at the GBPUSD long 🙂 This time we have closed inside the bands, come down to the lower side of the channel and the bands have flattened out. We’ve got 4 hour divergence and so I’ve gone long to at the trendline and lower band to hopefully get a run up to close the gap.

Daily Chart

Long into the trendline and lower band. Divergence on the 4h.

Long into the trendline and lower band. Divergence on the 4h.

Four Hourly Chart

Divergence at the lows.

Divergence at the lows.

One thing that makes me nervous about this trade is the crowd behaviour. I think this is a crowded trade. It’s about 75% long on Oanda and 66% long on Saxo.

Update 3 October

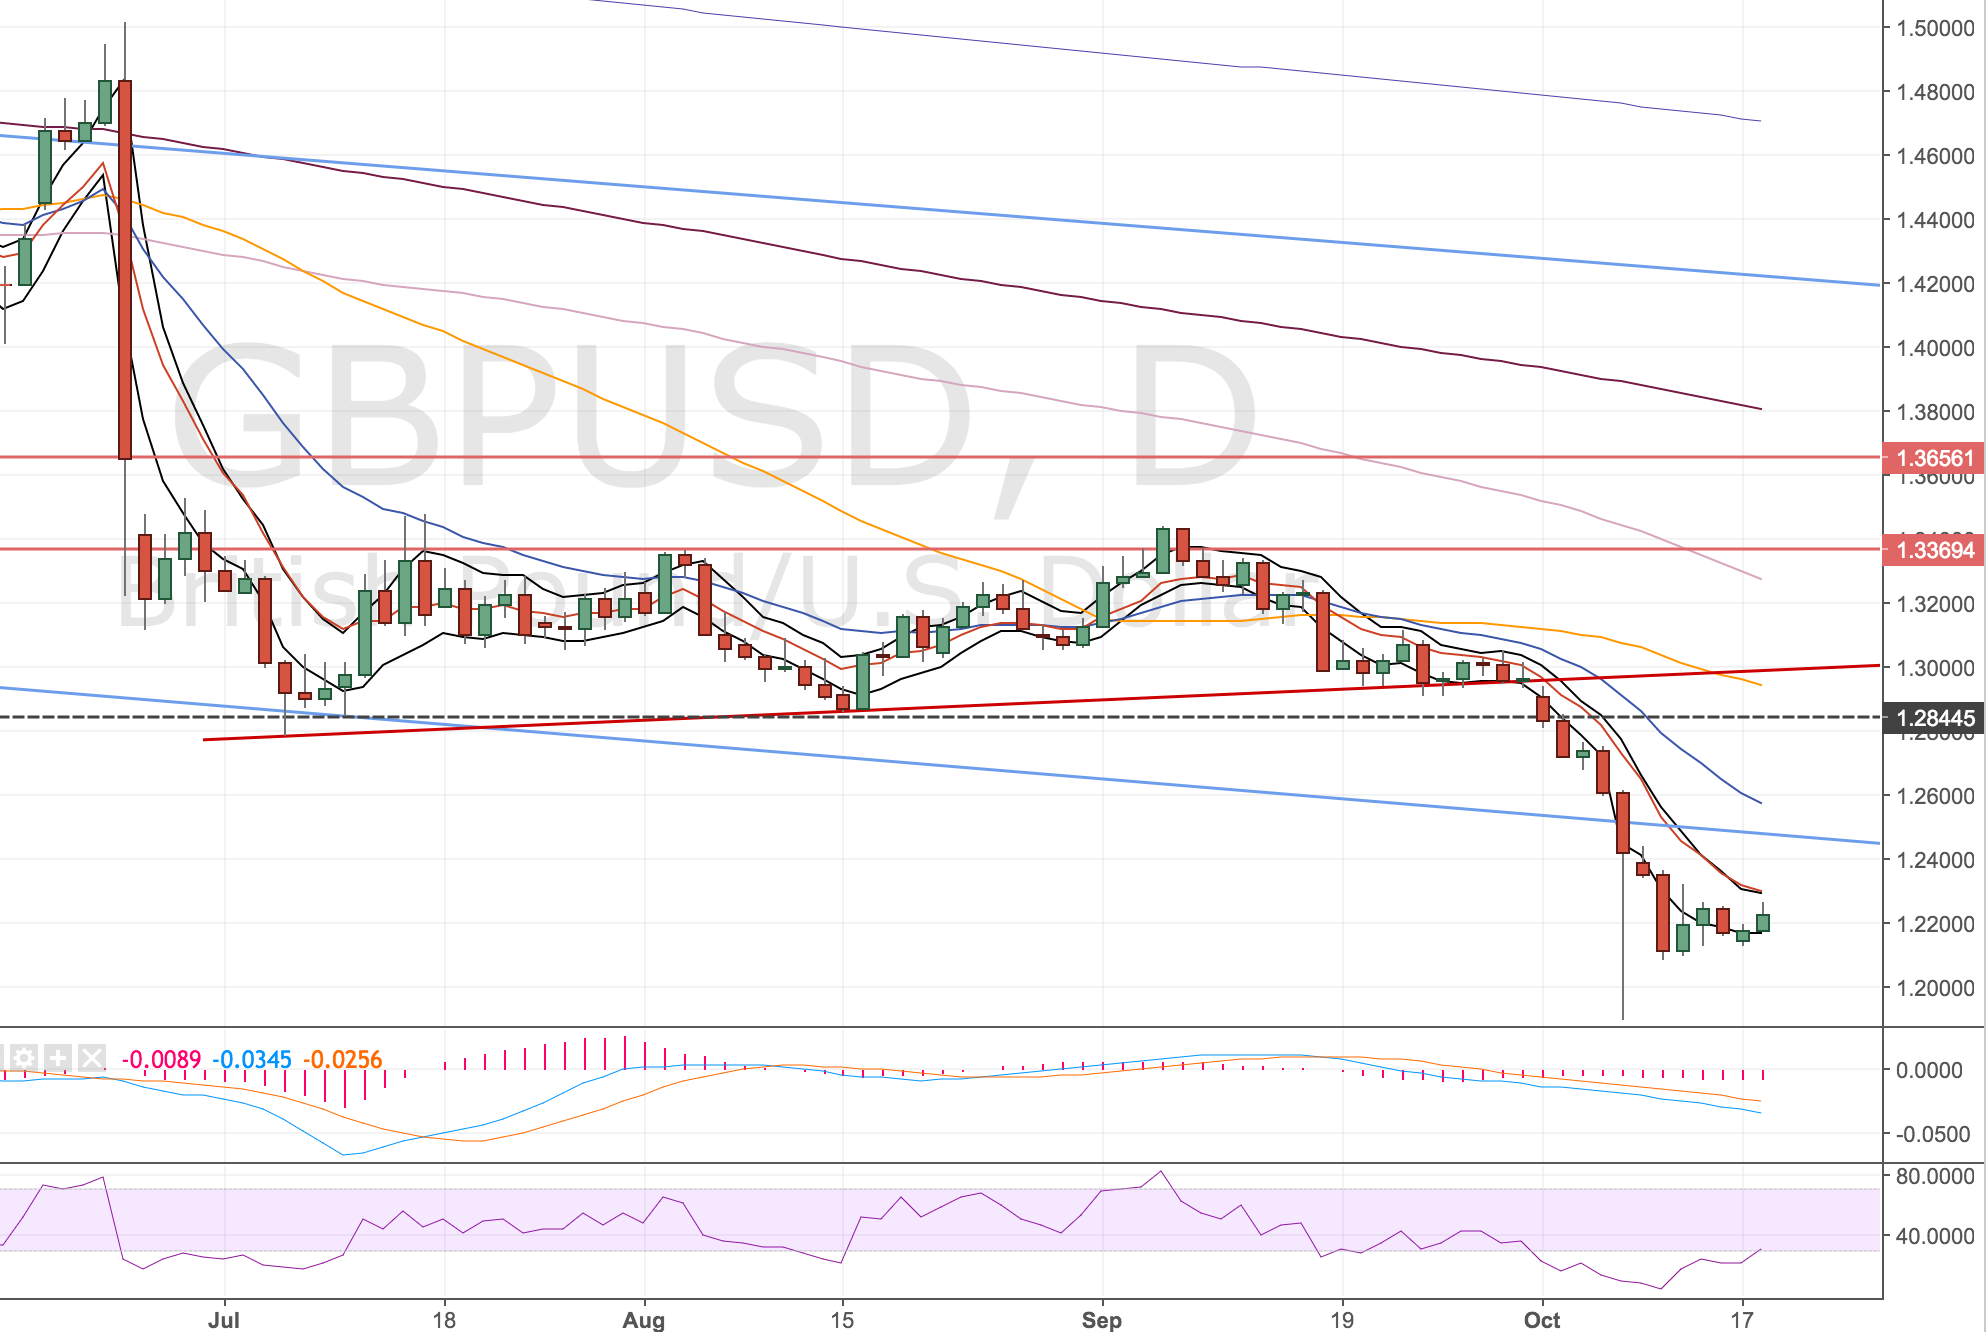
So I got stopped out again. I’m not sure if I’m as happy about this one. Started to wonder if I got in too early here. The market moved against me and continued in a pretty big way. The stop was in place so I only lost my original stake. For now I can’t really see where this will end so stepping aside to wait for more price action.

Got stopped out on the grey dotted line.

GBP moved against me and I got stopped out on the dotted grey line.

GBP moved against me and I got stopped out on the dotted grey line.

Gold Trade & Analysis – 20 Sep 2016

Long @ 1313.00, SL: 1290.00 (230 pips), TP: 1350 (370 pips), Risk:Reward: 1.6, acc risk: 1.9%

Thought I’d do an update on gold, my last post had some long term technical analysis which seemed bearish to me on the monthly timeframe, but definitely at a decision point, so thought I’d keep tabs.

Monthly Chart

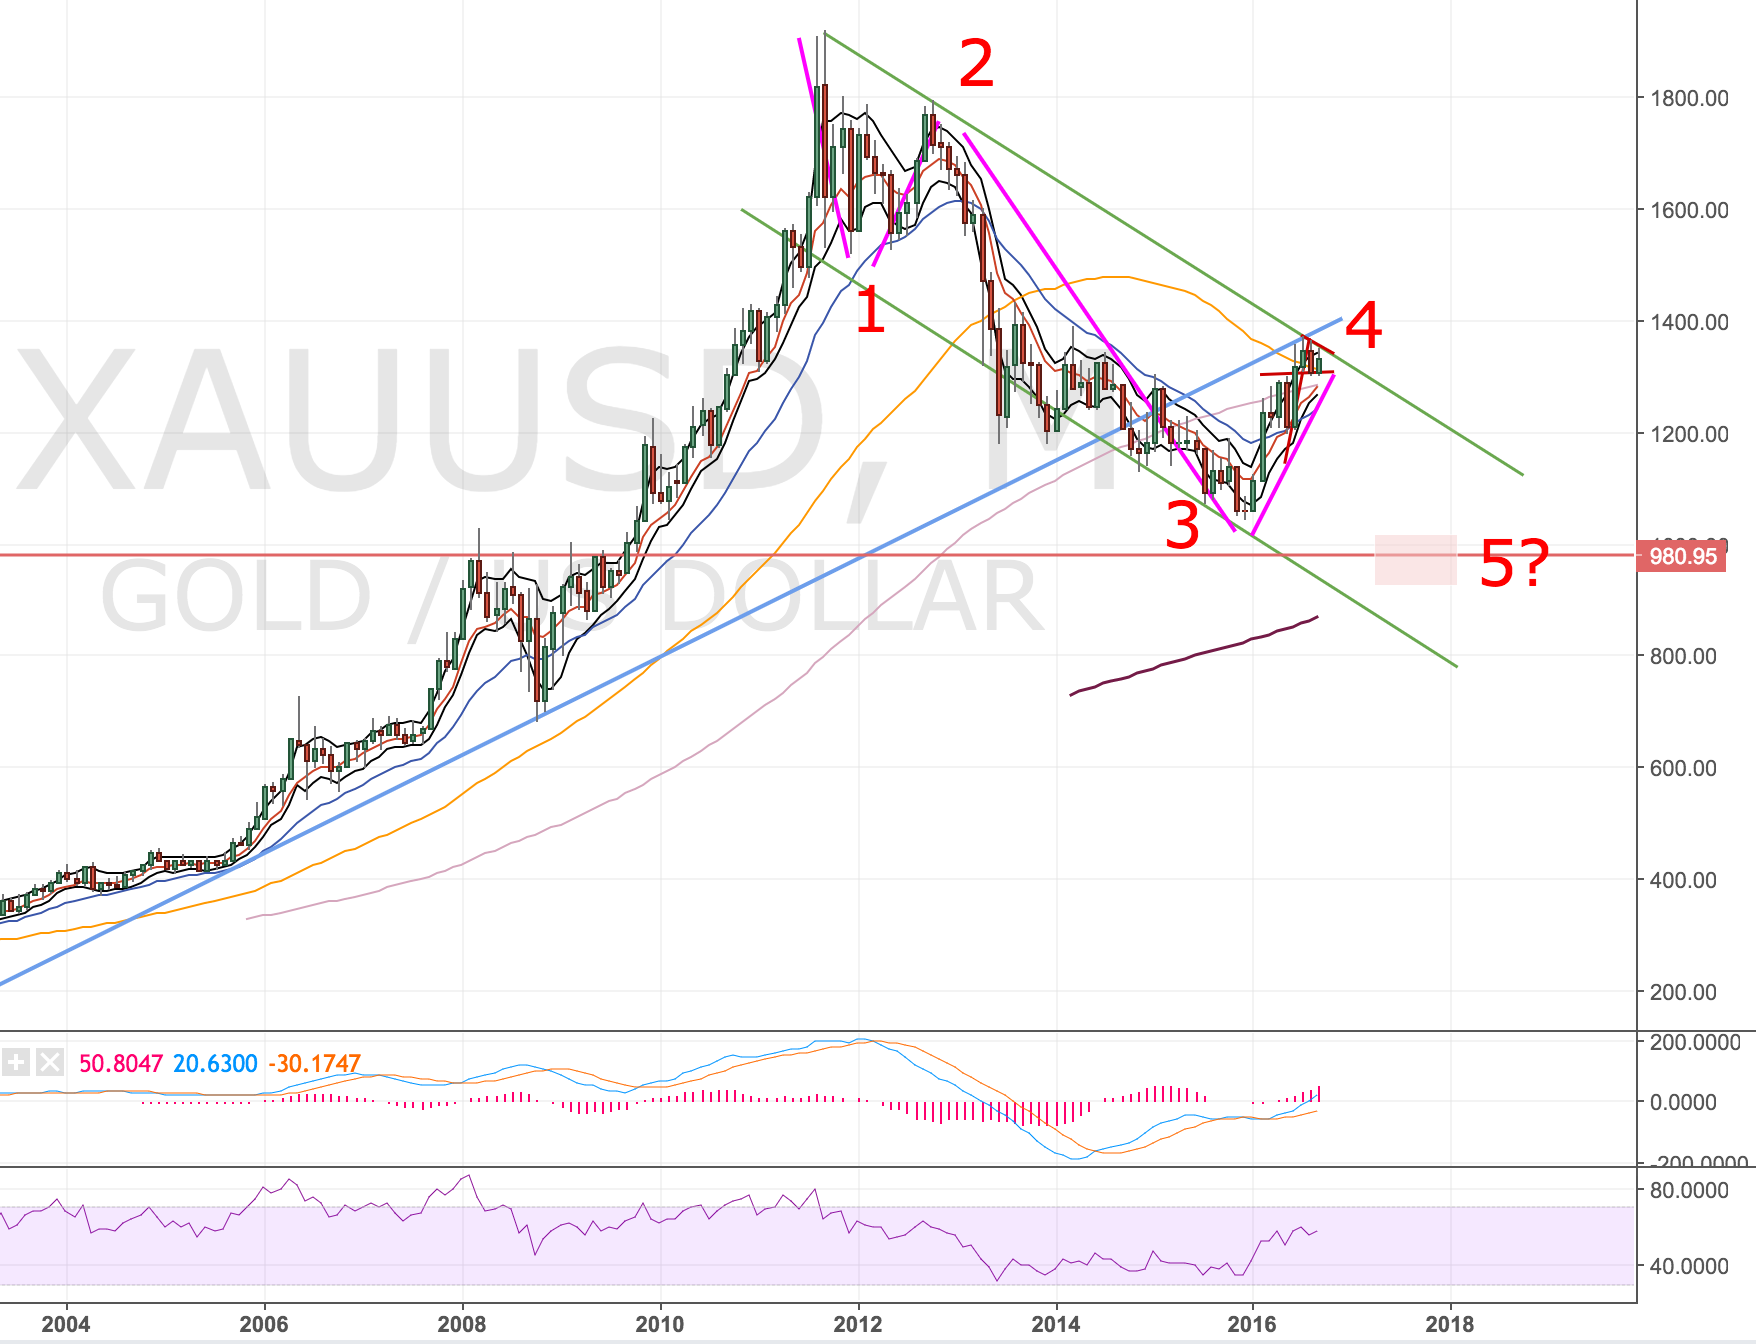
On the monthly chart we are retesting two trendlines, long-term in blue (was support now resistance) and the trend channel down in green. This is a point of decision for the market whether to break-through or fall away. So far the green trend channel has held up ok.

Potentially another leg down to come.

Potentially another leg down to come.

I’m not a confident on elliot waves but I think I can count a fairly realistic 4 of 5 waves down. Based on this I’ve marked a potential target area at 980 for the final wave 5. There is also prior resistance from 2008/2009 but might also nicely coincide with the rising 200MA coming into view. I can see price getting to my target zone by mid to late 2017 into early 2018.

Weekly Chart

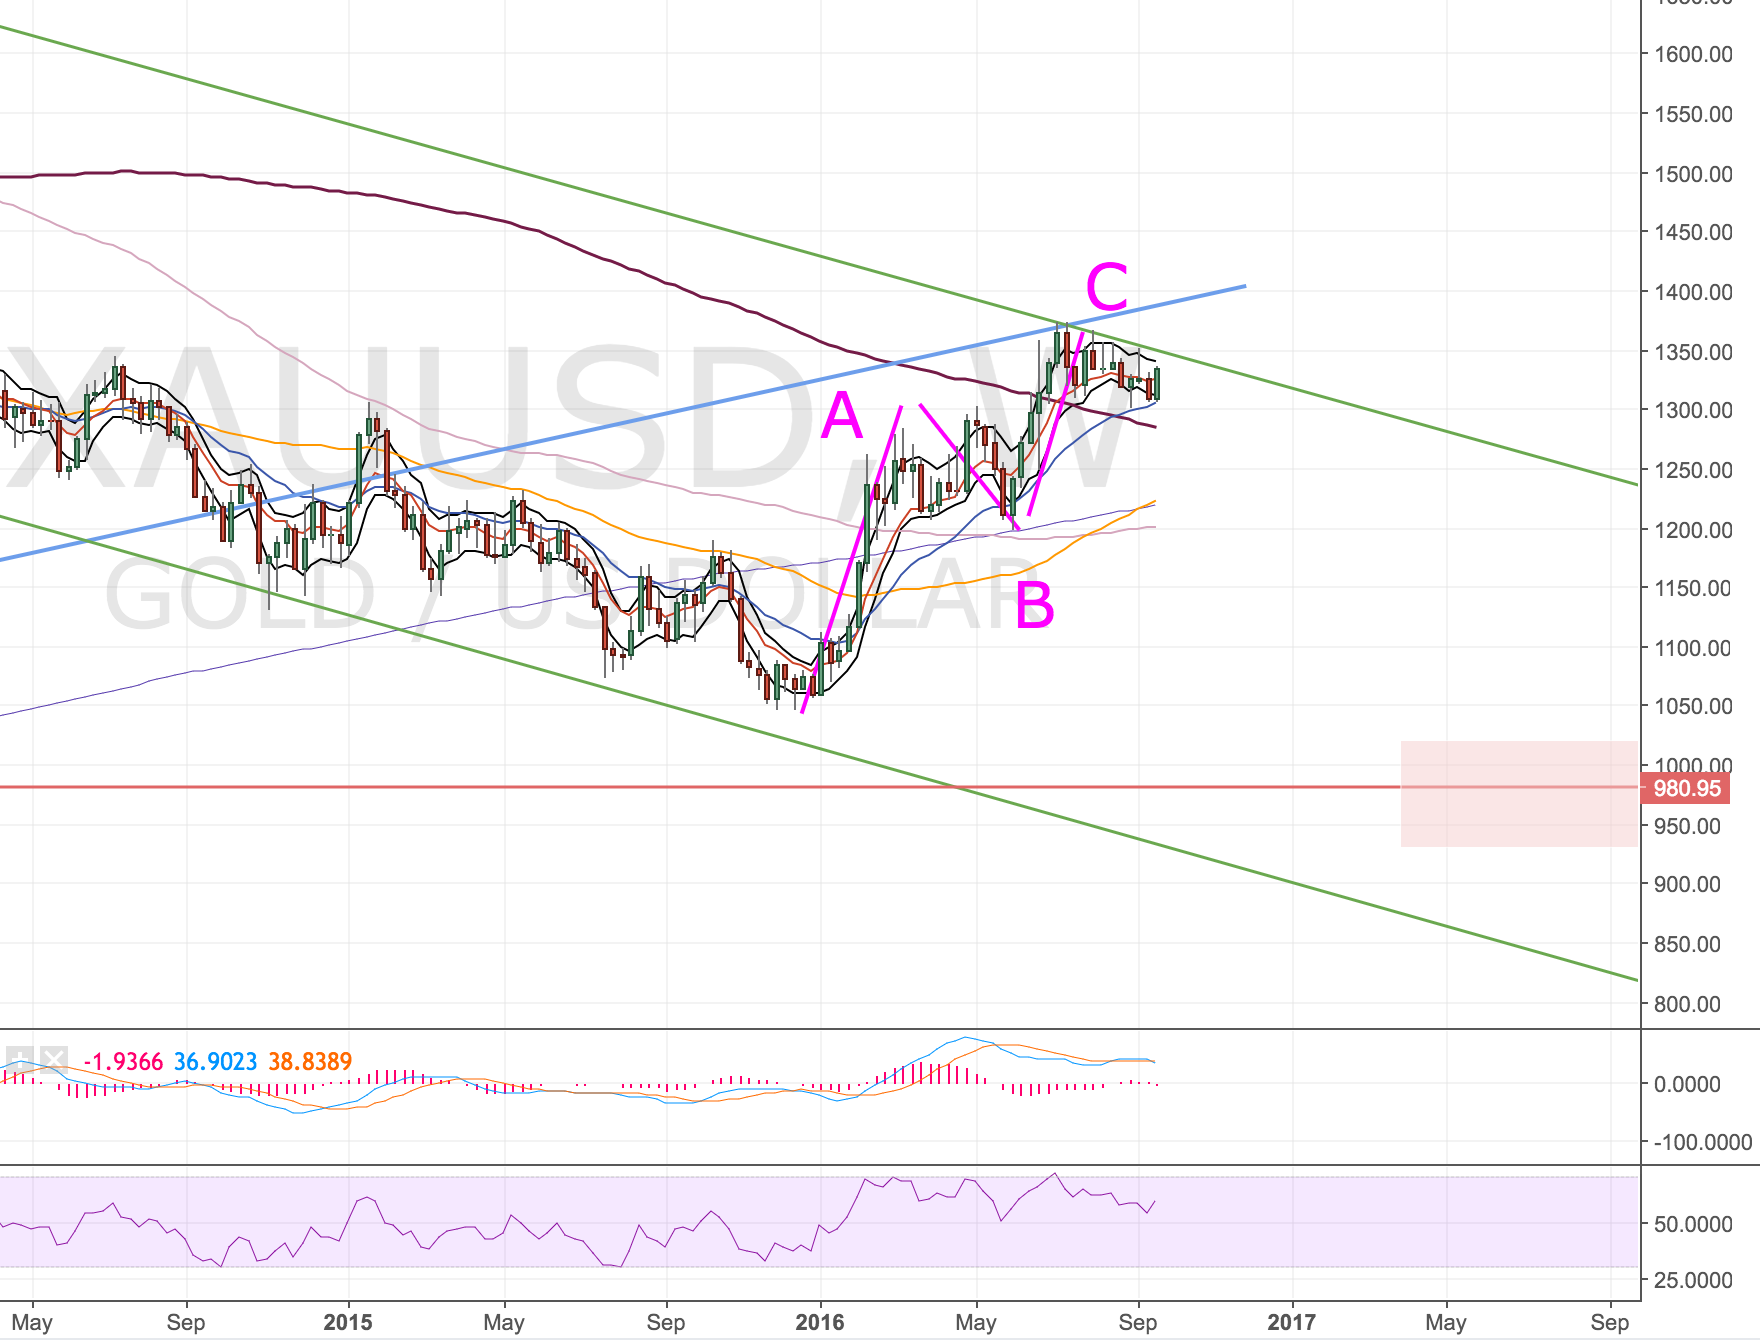
This move down might be in the early stages now. I can also see an ok A-B-C retracement to the upper trendline on the weekly chart. However there’s a couple of points of caution that point to more up-side:

  1. Crossed above the weekly 200MA
  2. MAs are pointing up
  3. Hand-railing of the upper trendline

Gold Weekly Chart - 21 Sep 2016

Daily Chart

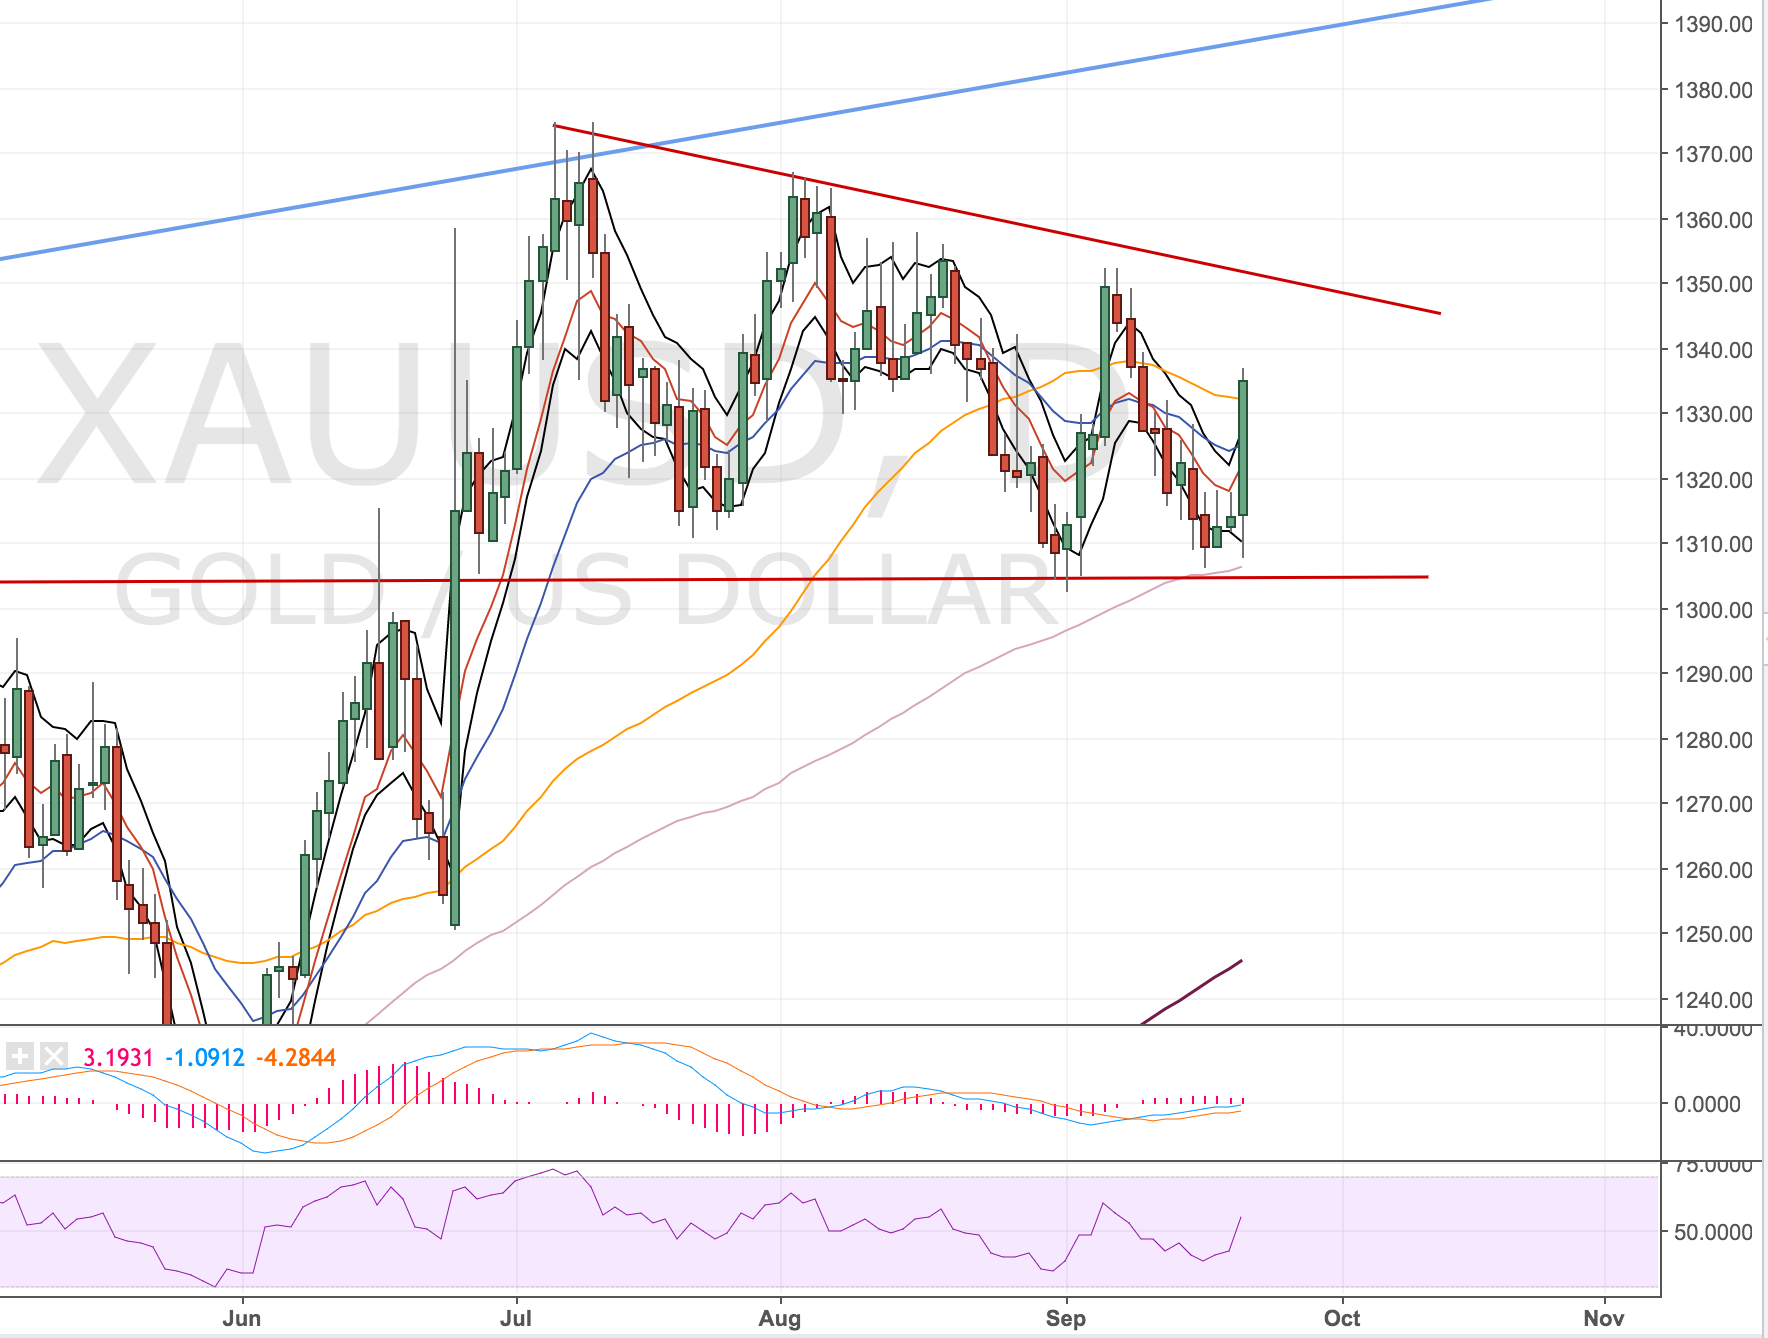
So this is probably questionable trading but I actually saw a long trade that I’ve taken into resistance @ 1350.

Gold Daily Chart - 21 Sep 2016

The test of the lower line of this wedge came with rising RSI which indicated to me it wants to go higher. This entry lined up nicely with the lower band being tested and the 100MA. So I took the trade long @1313 with a stop @1290 just below prior resistance.

It’s worth noting, this trade was the day before FOMC (which is the most recent up bar for today) which may have been a stupid trade. However, I felt with pretty mediocre data lately it wasn’t too stupid. Not sure if this is classed as gambling? It’s hard to know what is sensible when swing trading – there always seems to be a news event that could scupper you. For now it is in my favour but sure it’ll take a few days to work up to 1350 if it does get there.

Update 27 September 2016

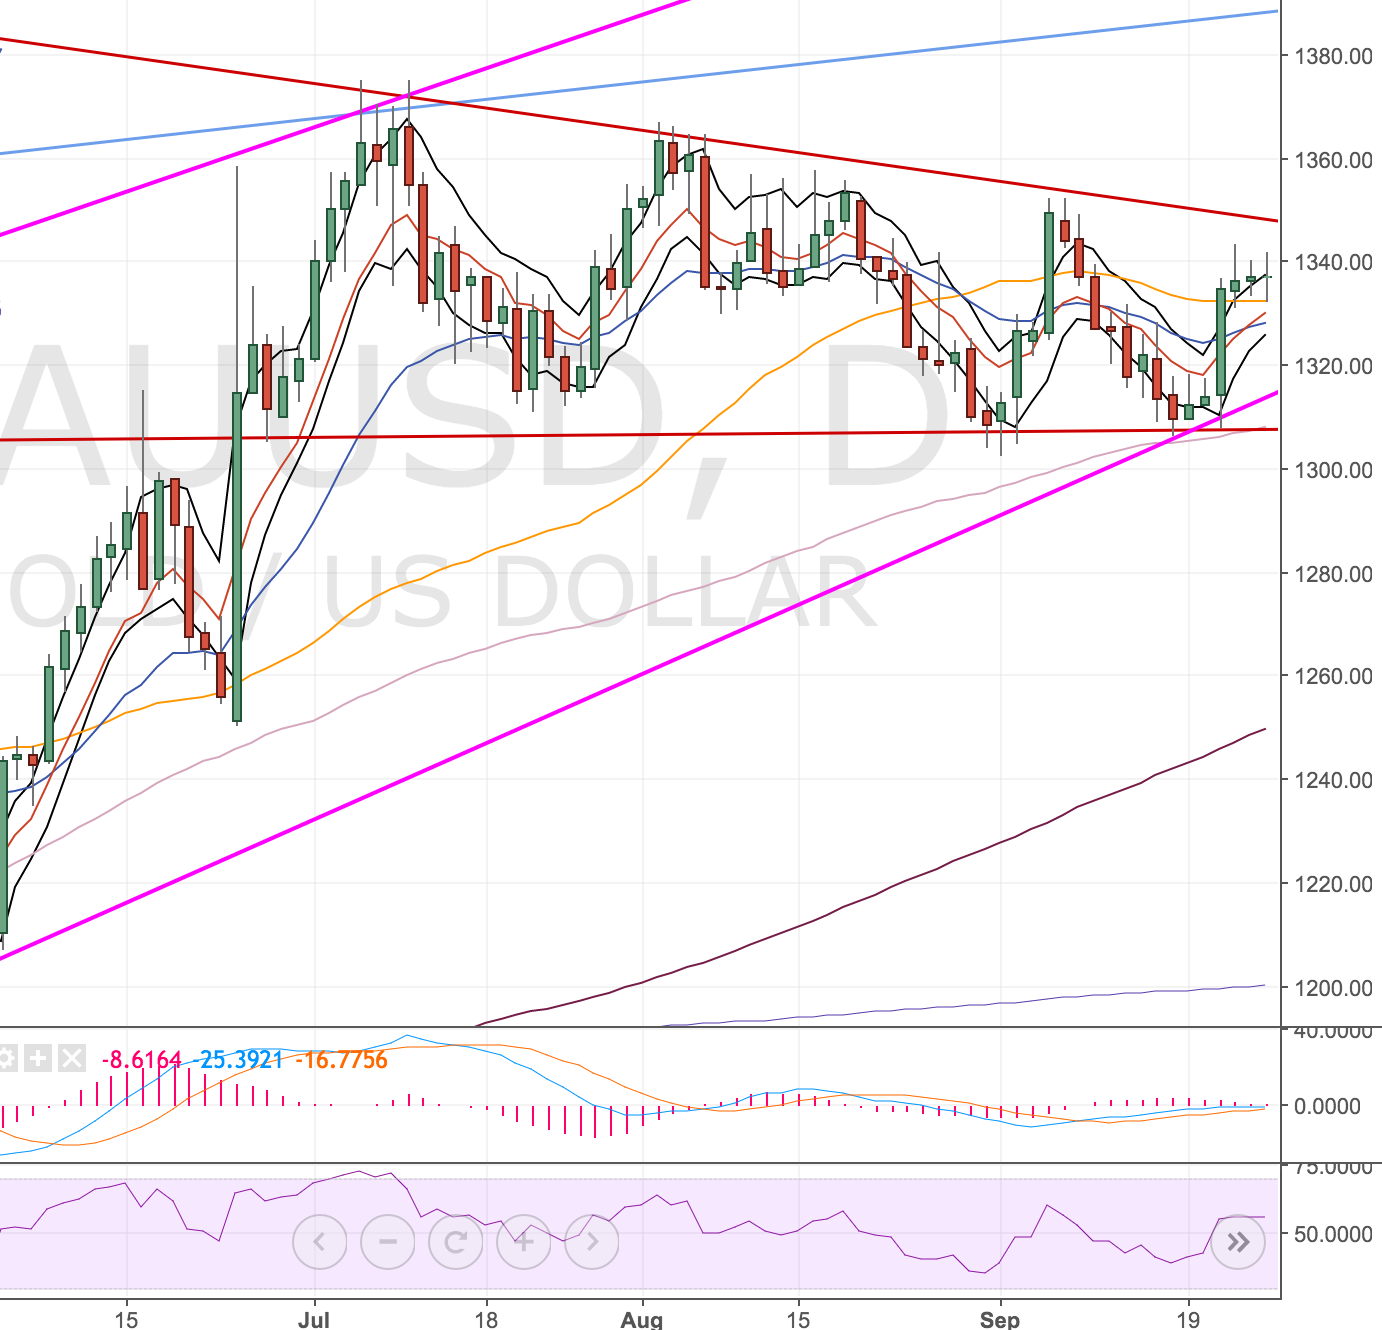
Price seems to have faltered to me so I closed my trade on the retest of the recent highs at 1340. What got me nervous was the series of daily spinning top candles into the bands hugging the 50 MA.

Gold Daily Chart - 26 Sep 2016

I often wonder whether I should always let stops take me out rather than arbitrary decisions? Probably yes, you never really know which way the market will go.

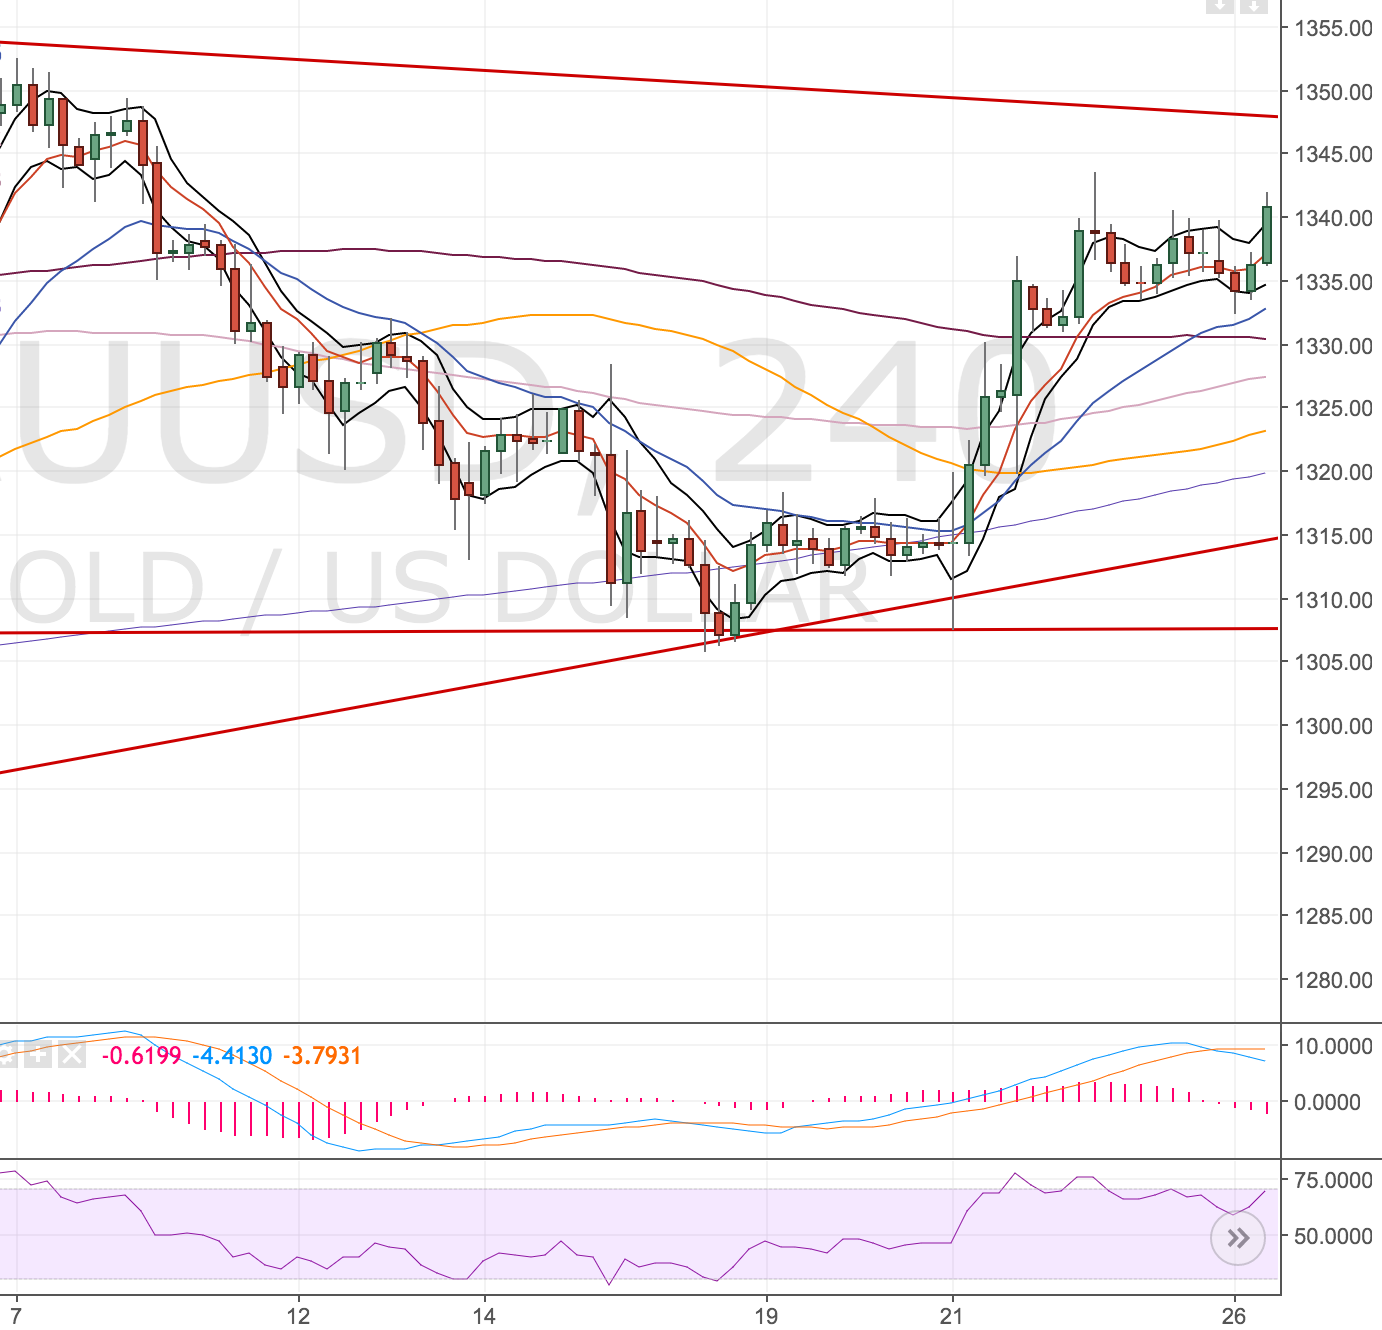
On the 4H chart, which I didn’t check at the time (why? I don’t know), the price action is showing divergence so maybe that wasn’t such a bad call.

Gold 4H Chart - 26 Sep 2016

Some profit banked which is good.

In summary, this is how I feel about the trade:

Good

  • Entry on a trendline support coinciding with the bands
  • Rising momentum on the trendline support

Not so great

  • Long term analysis pointed to the downside
  • Overhead resistance at the 50MA