Author Archives: admin

EURUSD DST Short – 28 Apr


Acc Risk: 0.5%
Short: 1.0894
Stop: 1.0961 (63 pips)
Target: 1.0686 (d50, 209 pips, 3.31 RR)
Mindset: Surprisingly positive considering my track record!

Update – Stopped out – 4 May

Following the french election, the mega gap up must have everyone getting short the euro. It certainly crossed my mind and I’m sure it will but I’m also sure it won’t happen when everyone expects it to. Most of the Euro markets have been rallying higher since, I took a divergence short on the GBP and surprise surprise it didn’t work out.

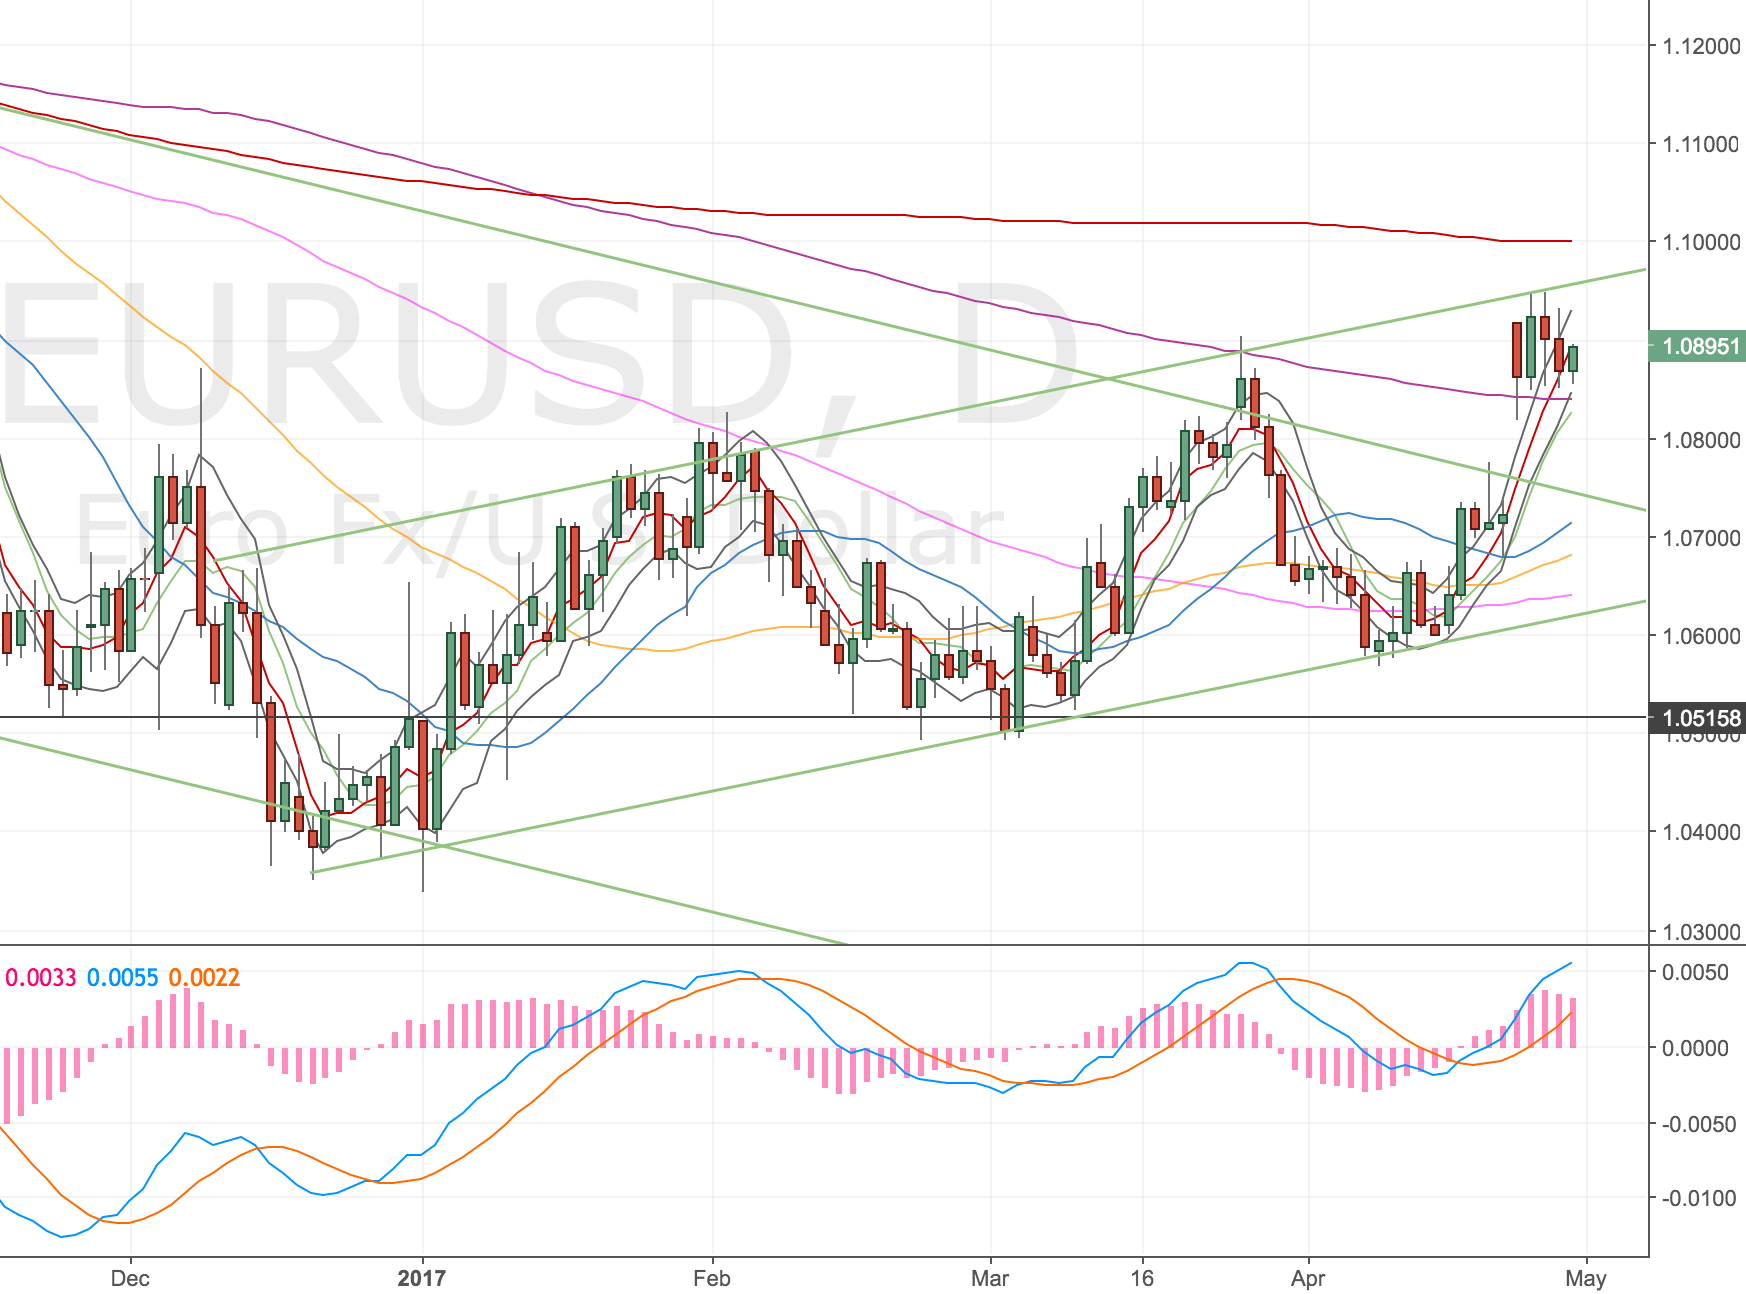
This set up, on the daily timeframe, looks pretty good to me. I think we’ve got a few days margin too before the divergence doesn’t work out if price moves higher. It’s not A grade though, with gaps like this I guess you are often going to get a divergence!

Here’s the set up …

Daily Chart

EURUSD Daily Chart – 28 Apr

Price is into the upper trendline, we’ve got the gap and the upper trendline has been tested a few times but failed to break. Obviously the gap is the obvious trade to take, the GBP gap following the Brexit vote is still there!

Weekly Chart

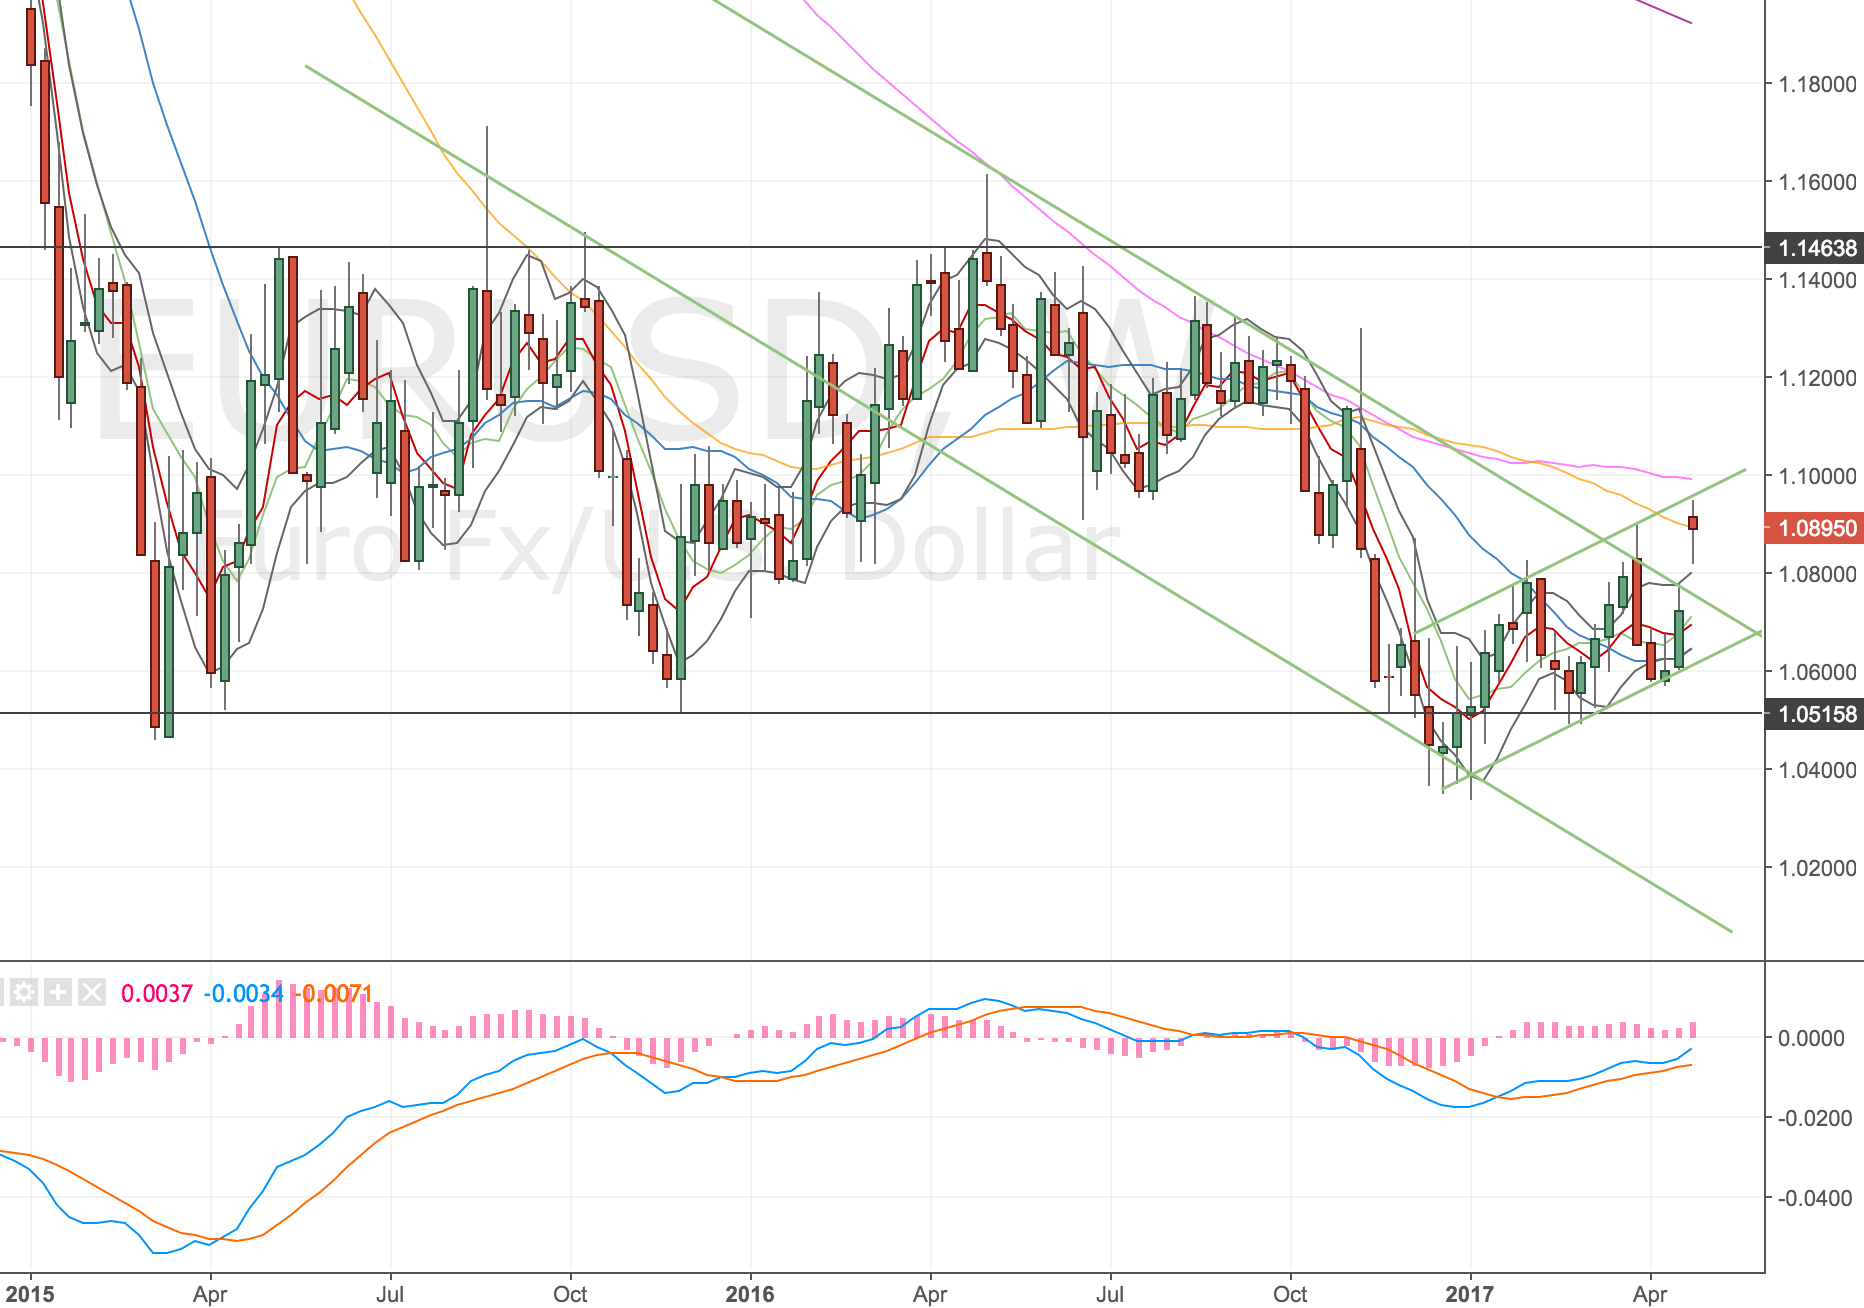
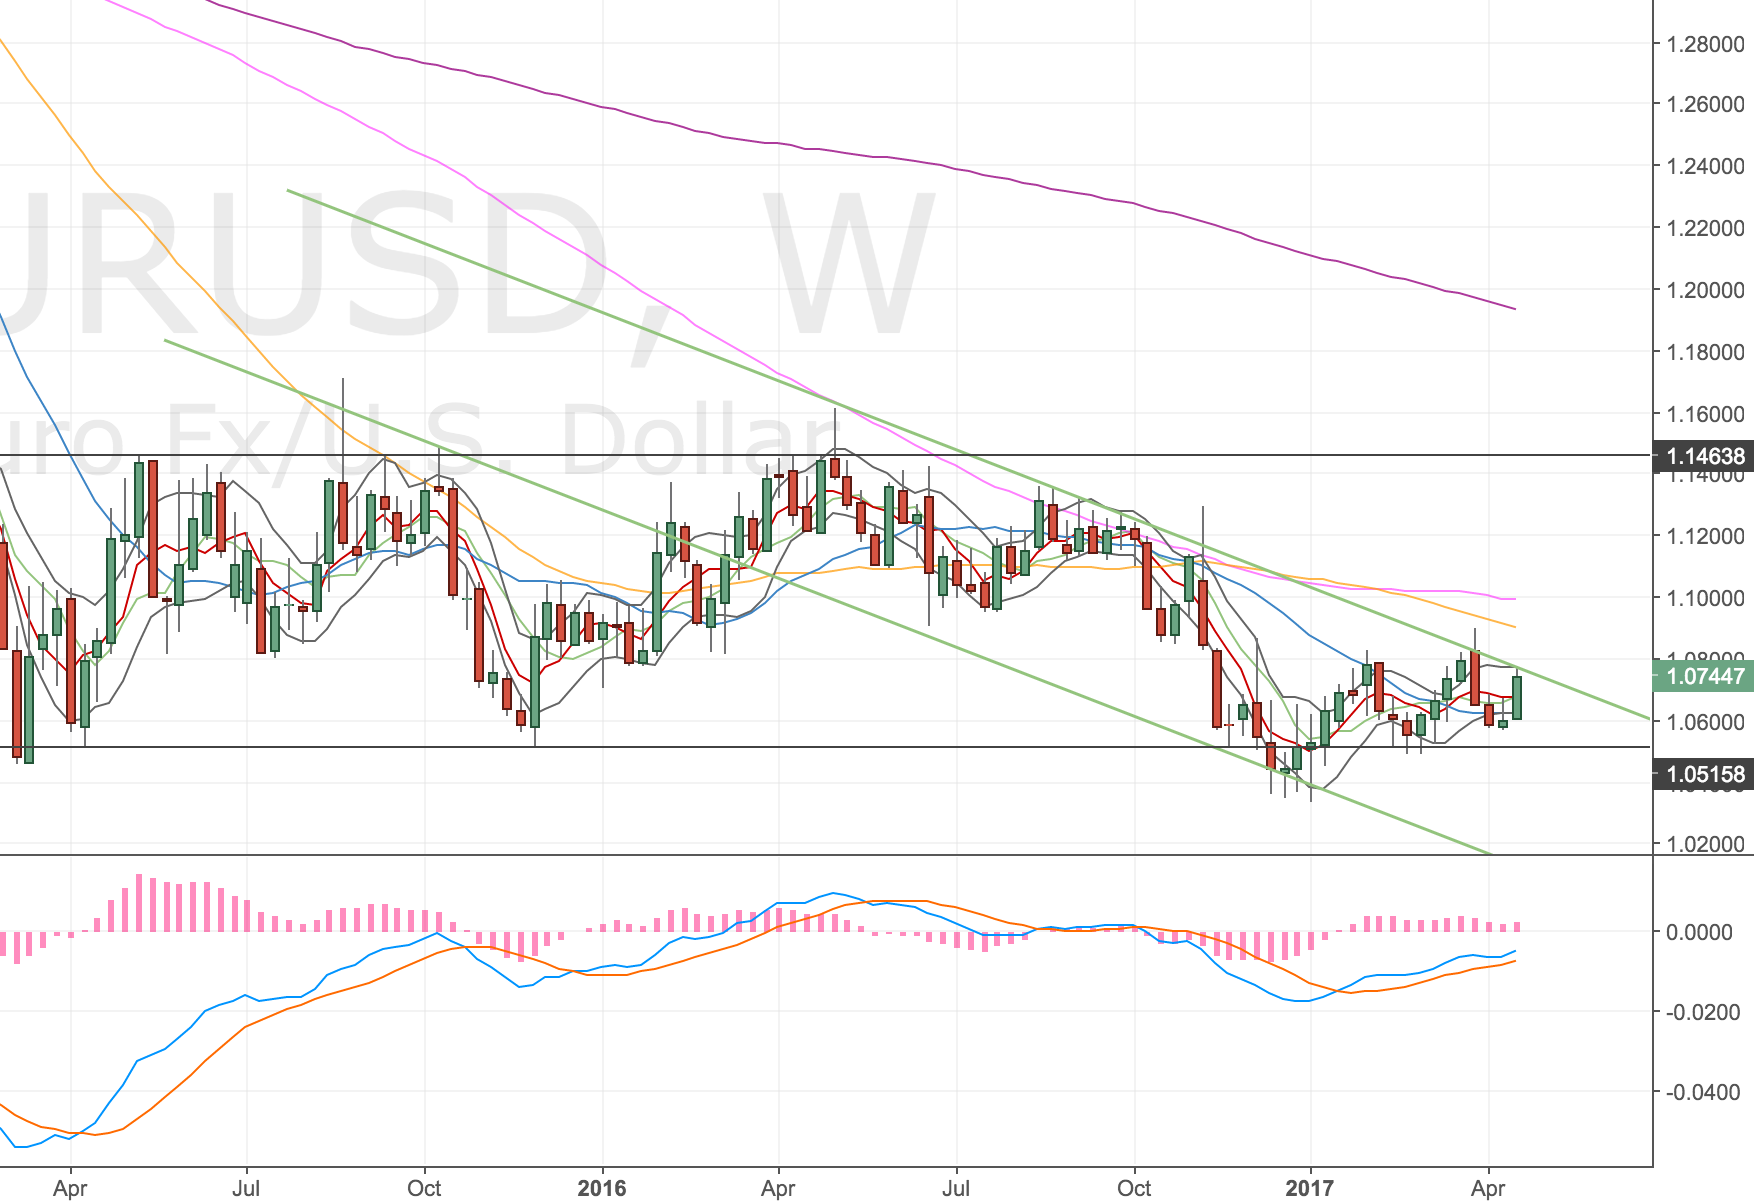
Weekly the gap has opened up into the w50. This also adds a bit of validation to my short.

EURUSD W Chart – 28 Apr

I think we could be sitting on this trade for a while.

Stopped out – 5 May

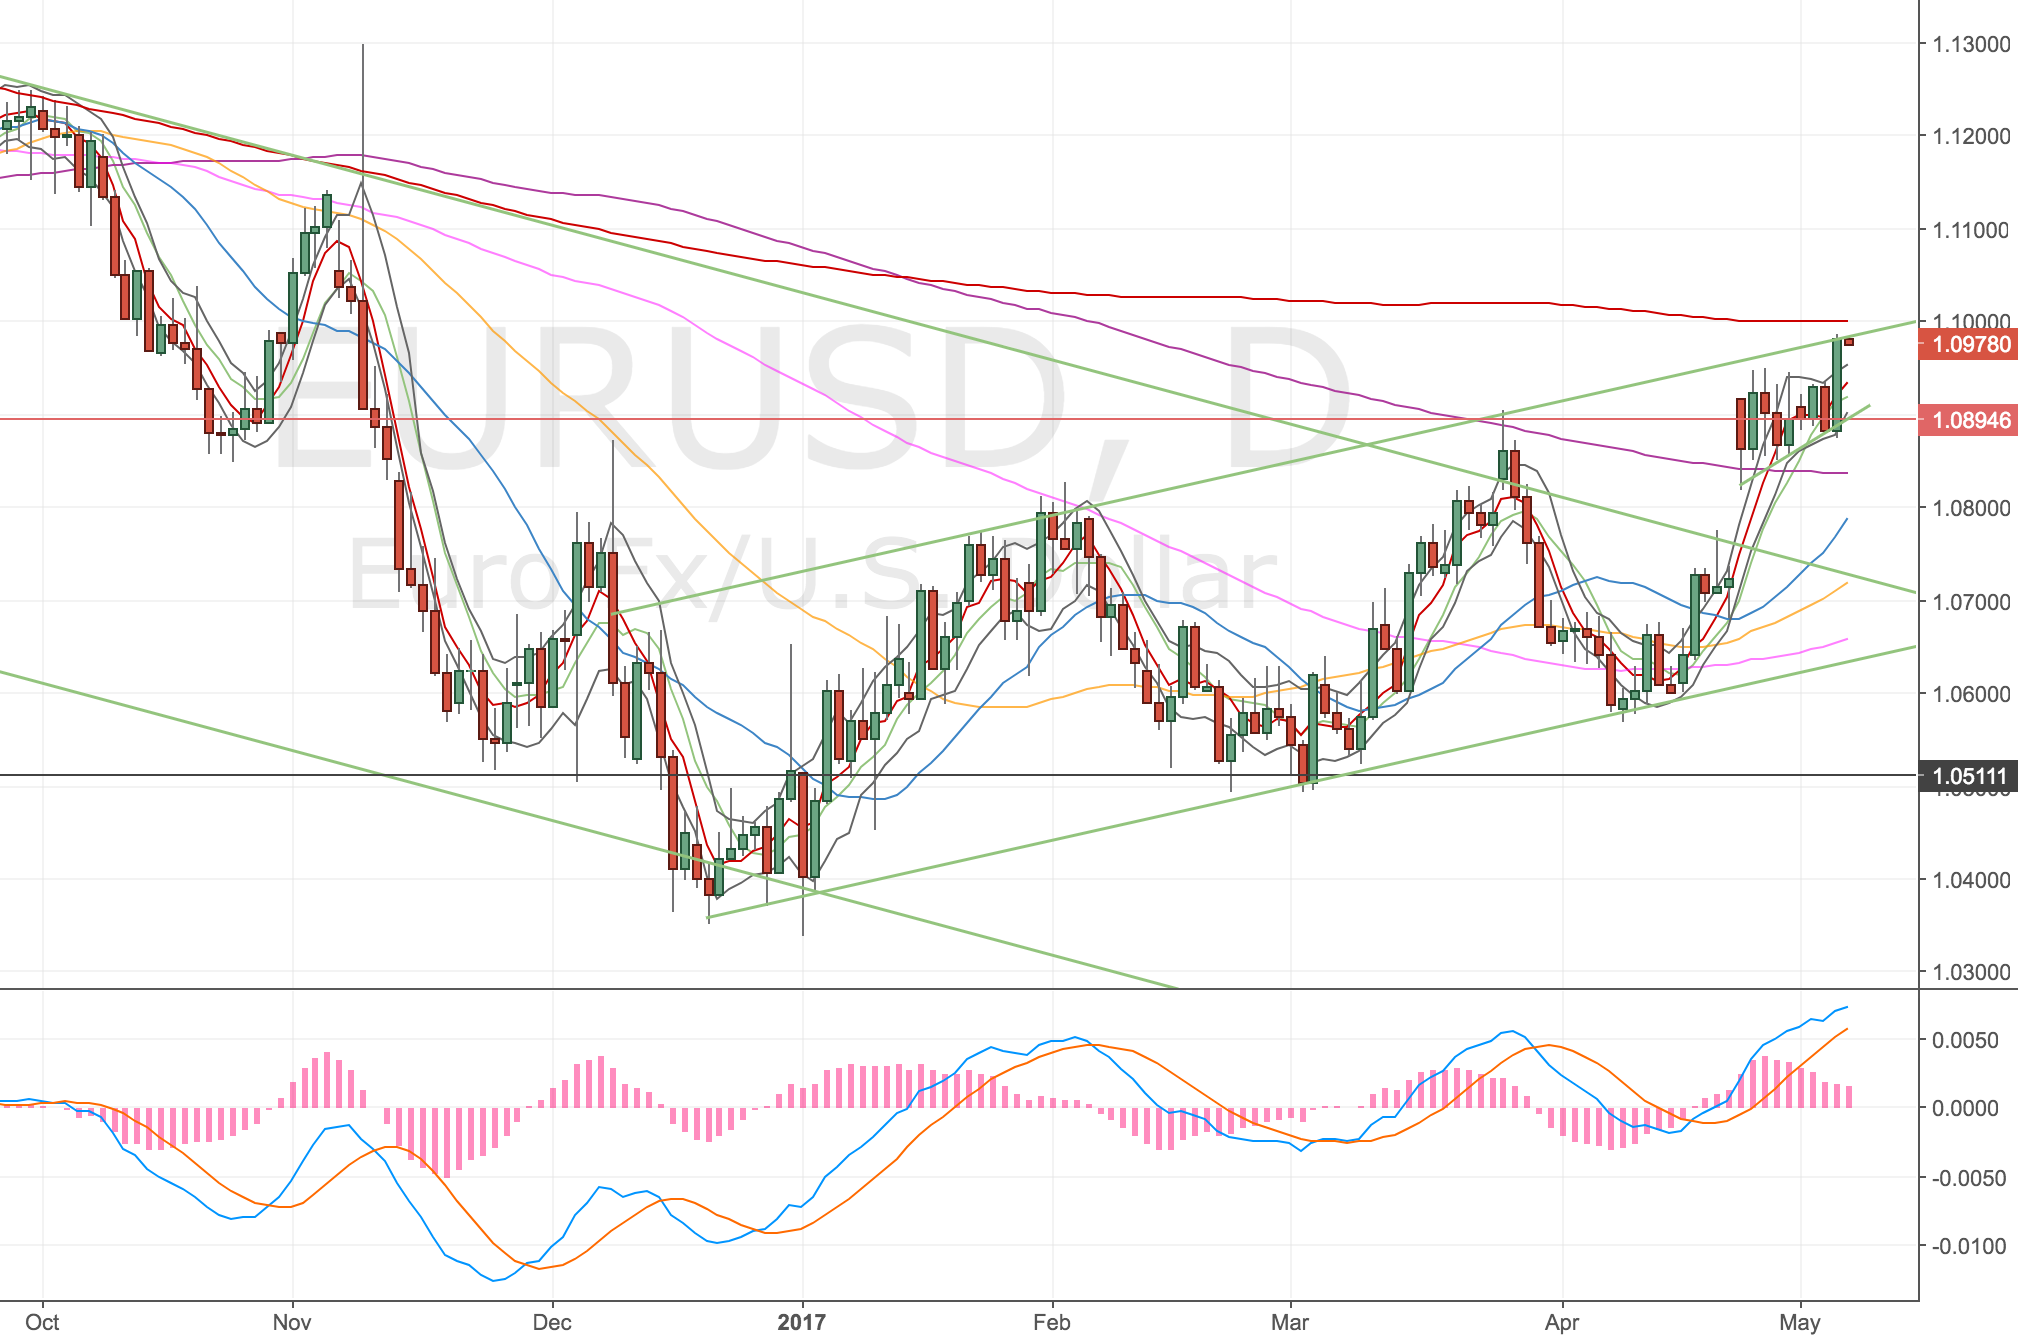
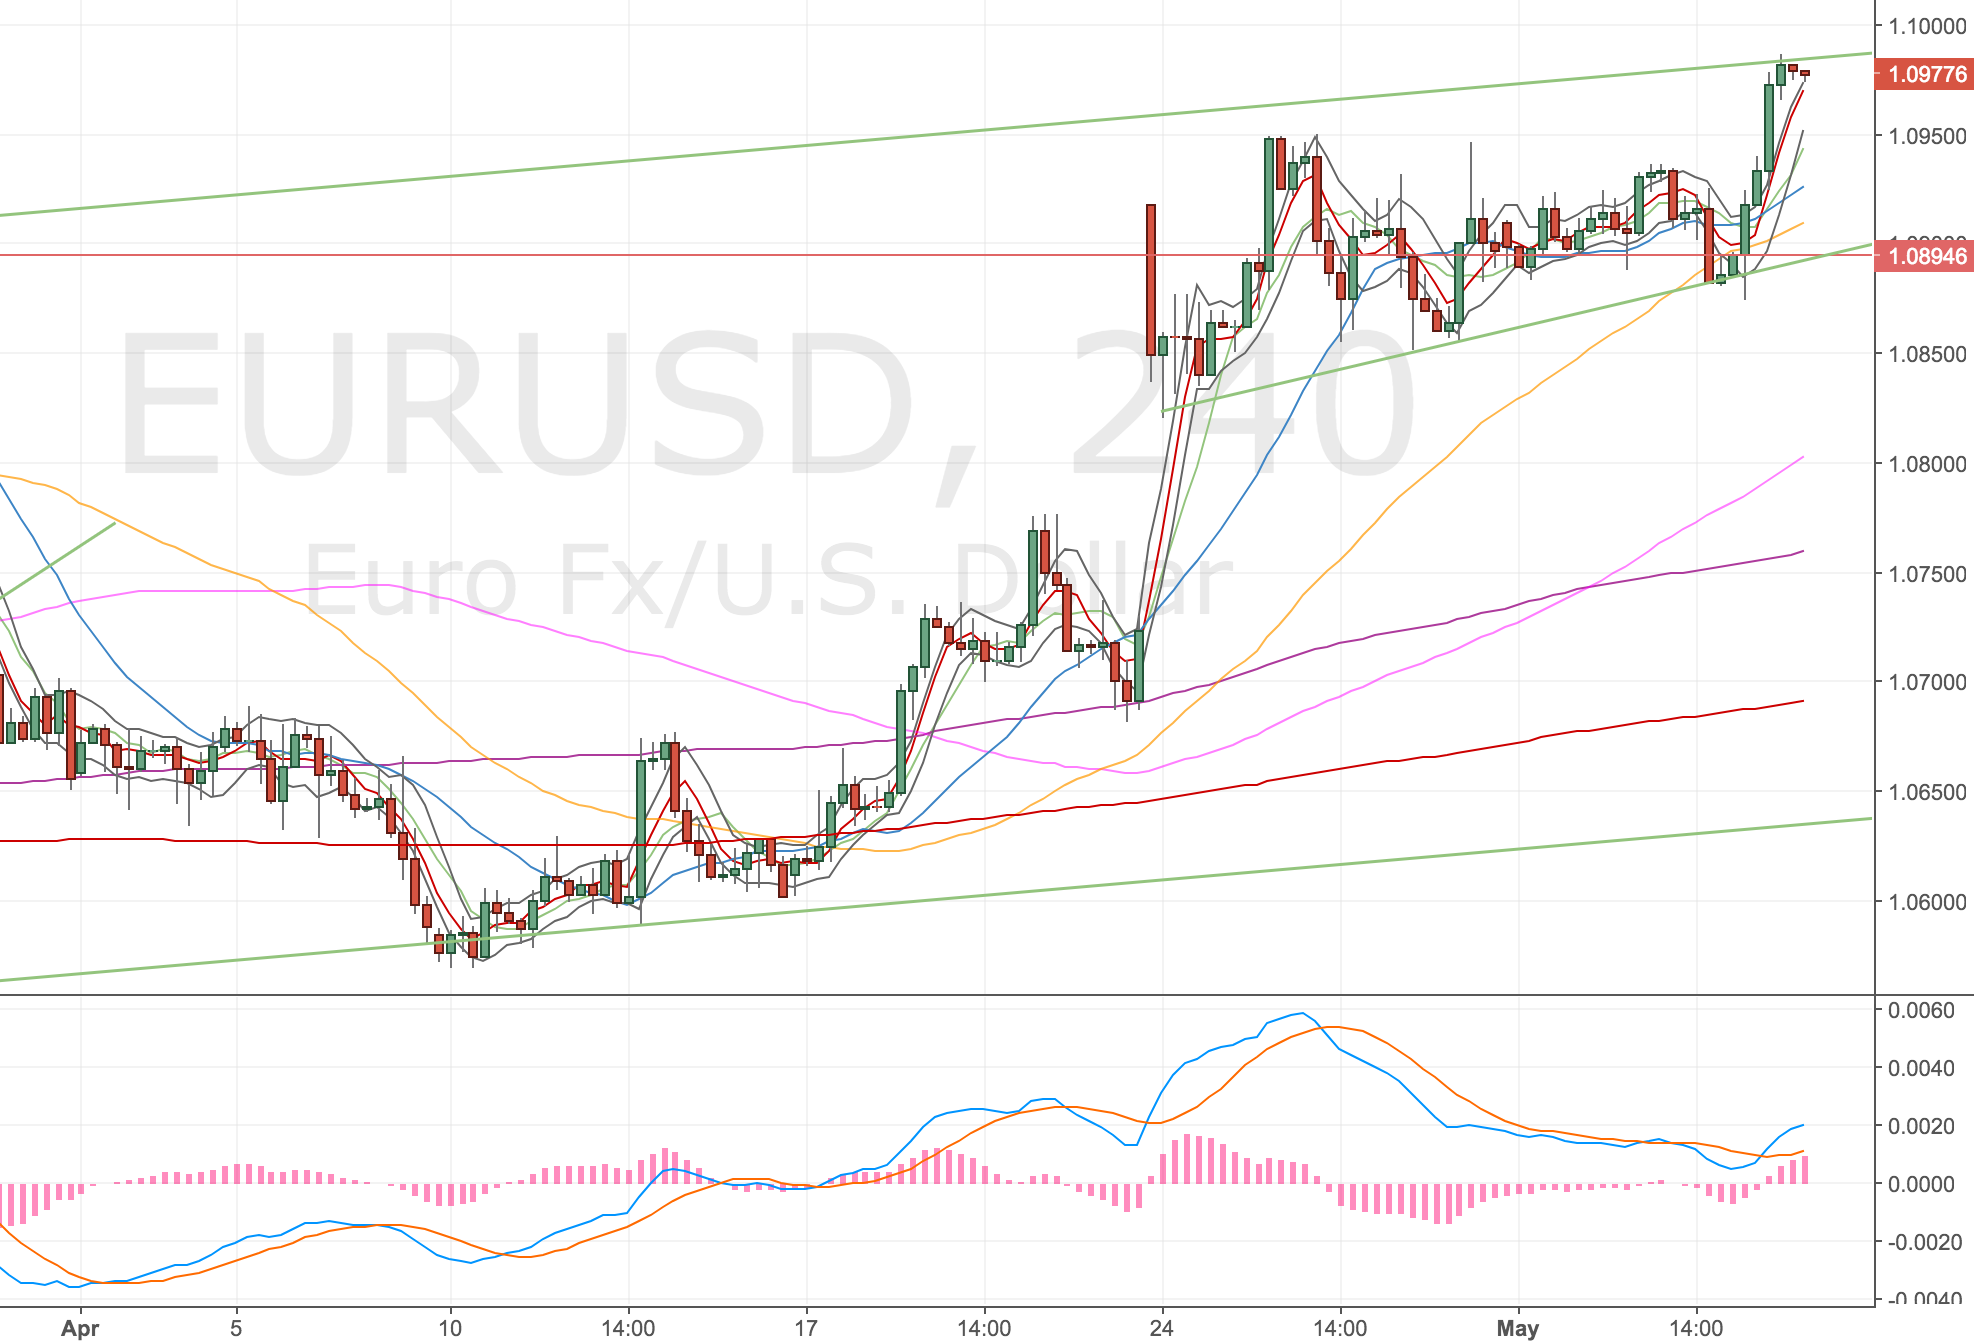
Price stopped me out. I never liked the set up of this chart; I traded the divergence but the trend has been higher. It feels like the Euro will sell off after the french election regardless of the result. There’s a 4 hour divergence setting up but there’s no confirmation on the lower timeframe for me trade – so I’m sitting tight for now.

Daily Chart

EURUSD D Chart – 5 May

4H Chart

EURUSD 4H Chart – 5 May. Divergence on the 4H but not the daily or hourly.

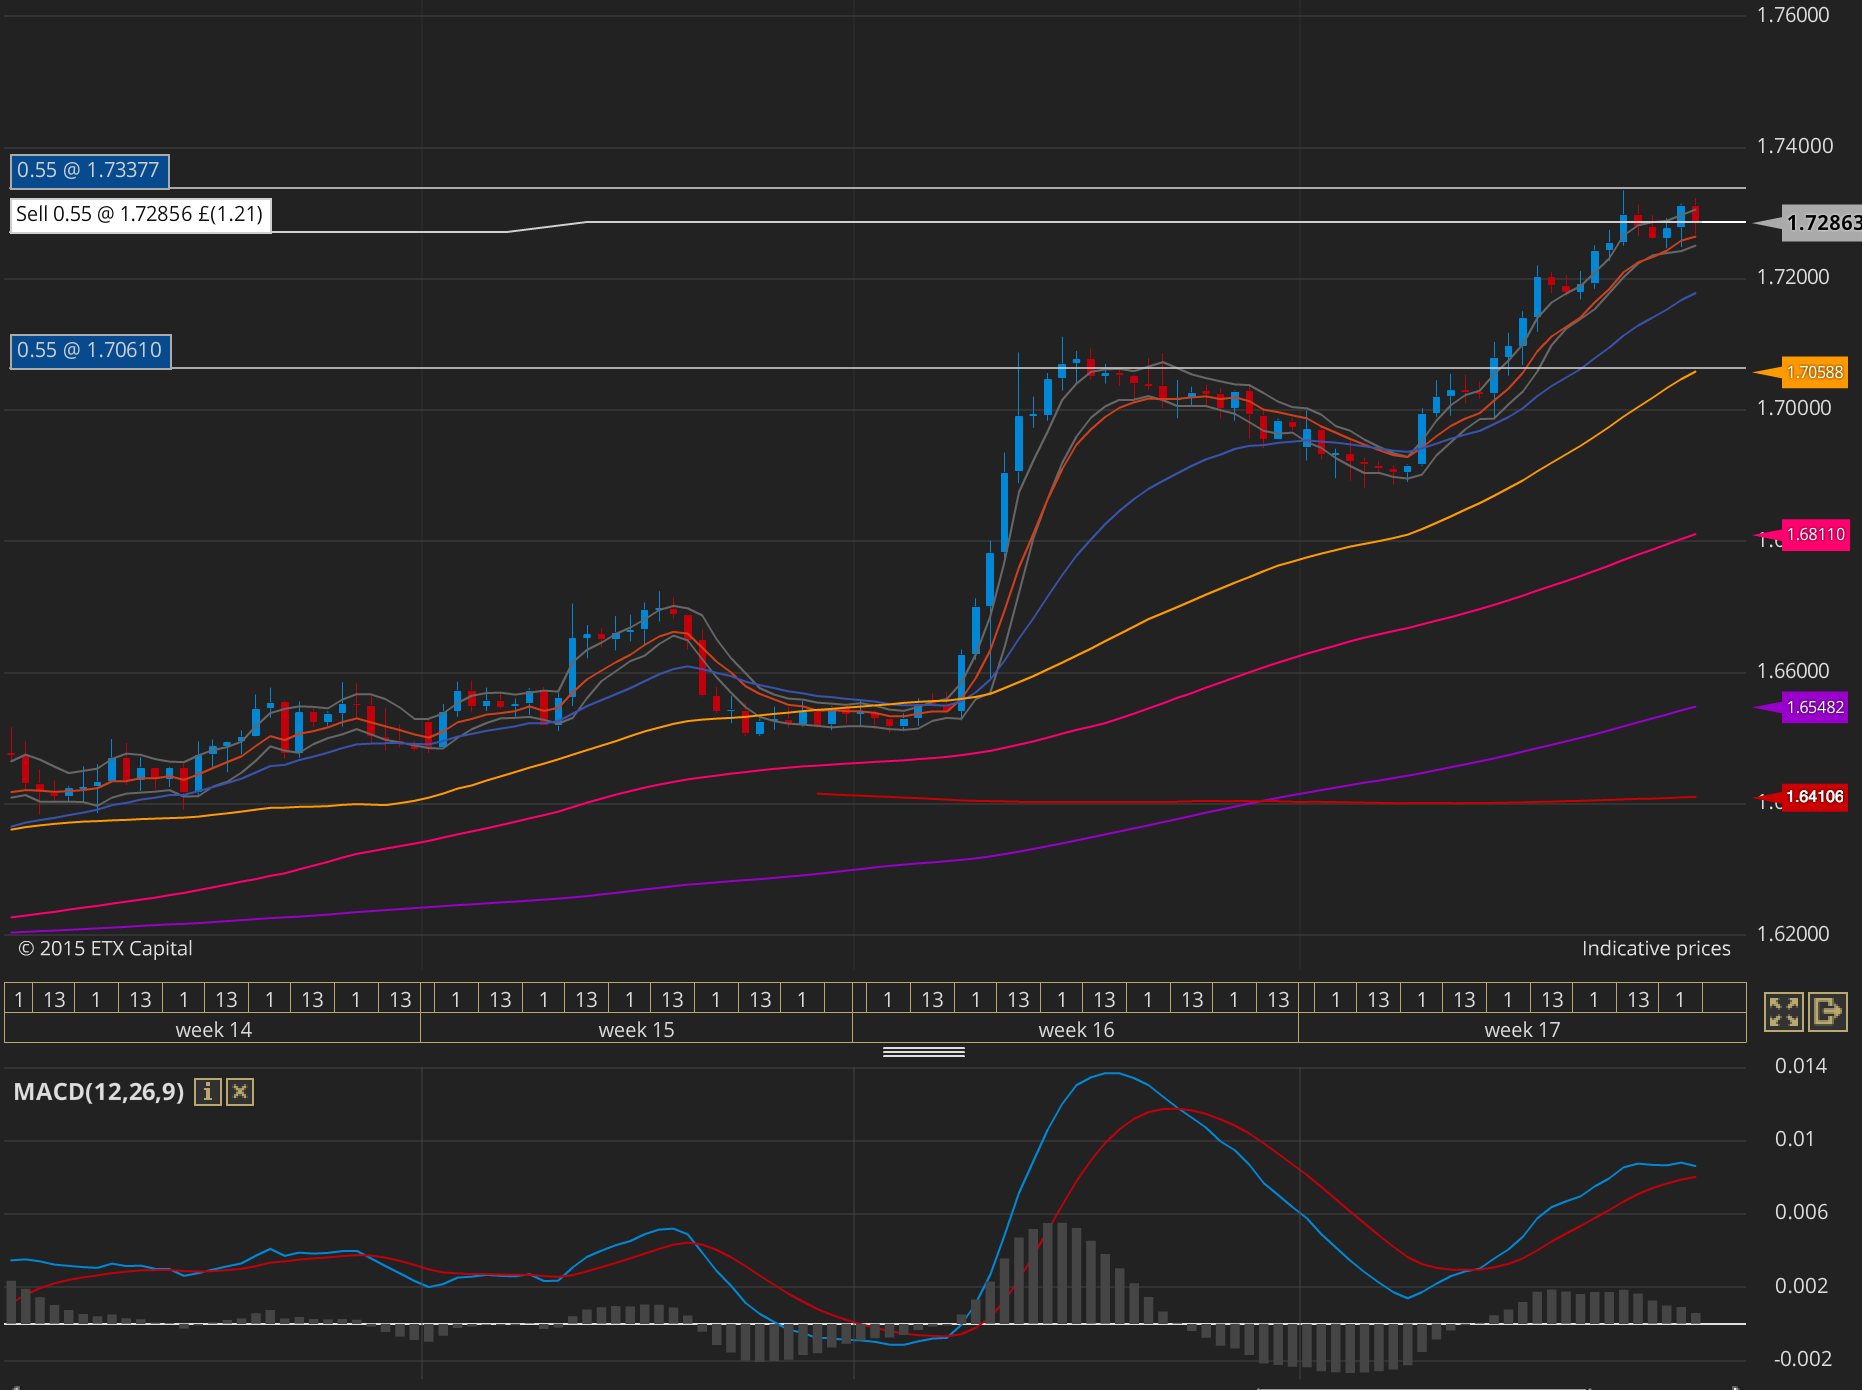
GBPAUD DST Short – 28 Apr


Acc Risk: 0.4%
Short: 1.7285
Stop: 1.7337 (52 pips)
Target: 1.7061 (4h50, 276 pips, 5.3 RR)
Mindset: Positive about the divergence but reluctant about taking another trade

I like this trade set up the divergence is lovely and looping. The entry is pretty good too.

Here’s the set up chart.

4H Chart Set up

GBPAUD 4H Chart – 28 Apr

The divergence is looping and the set up looks swell.

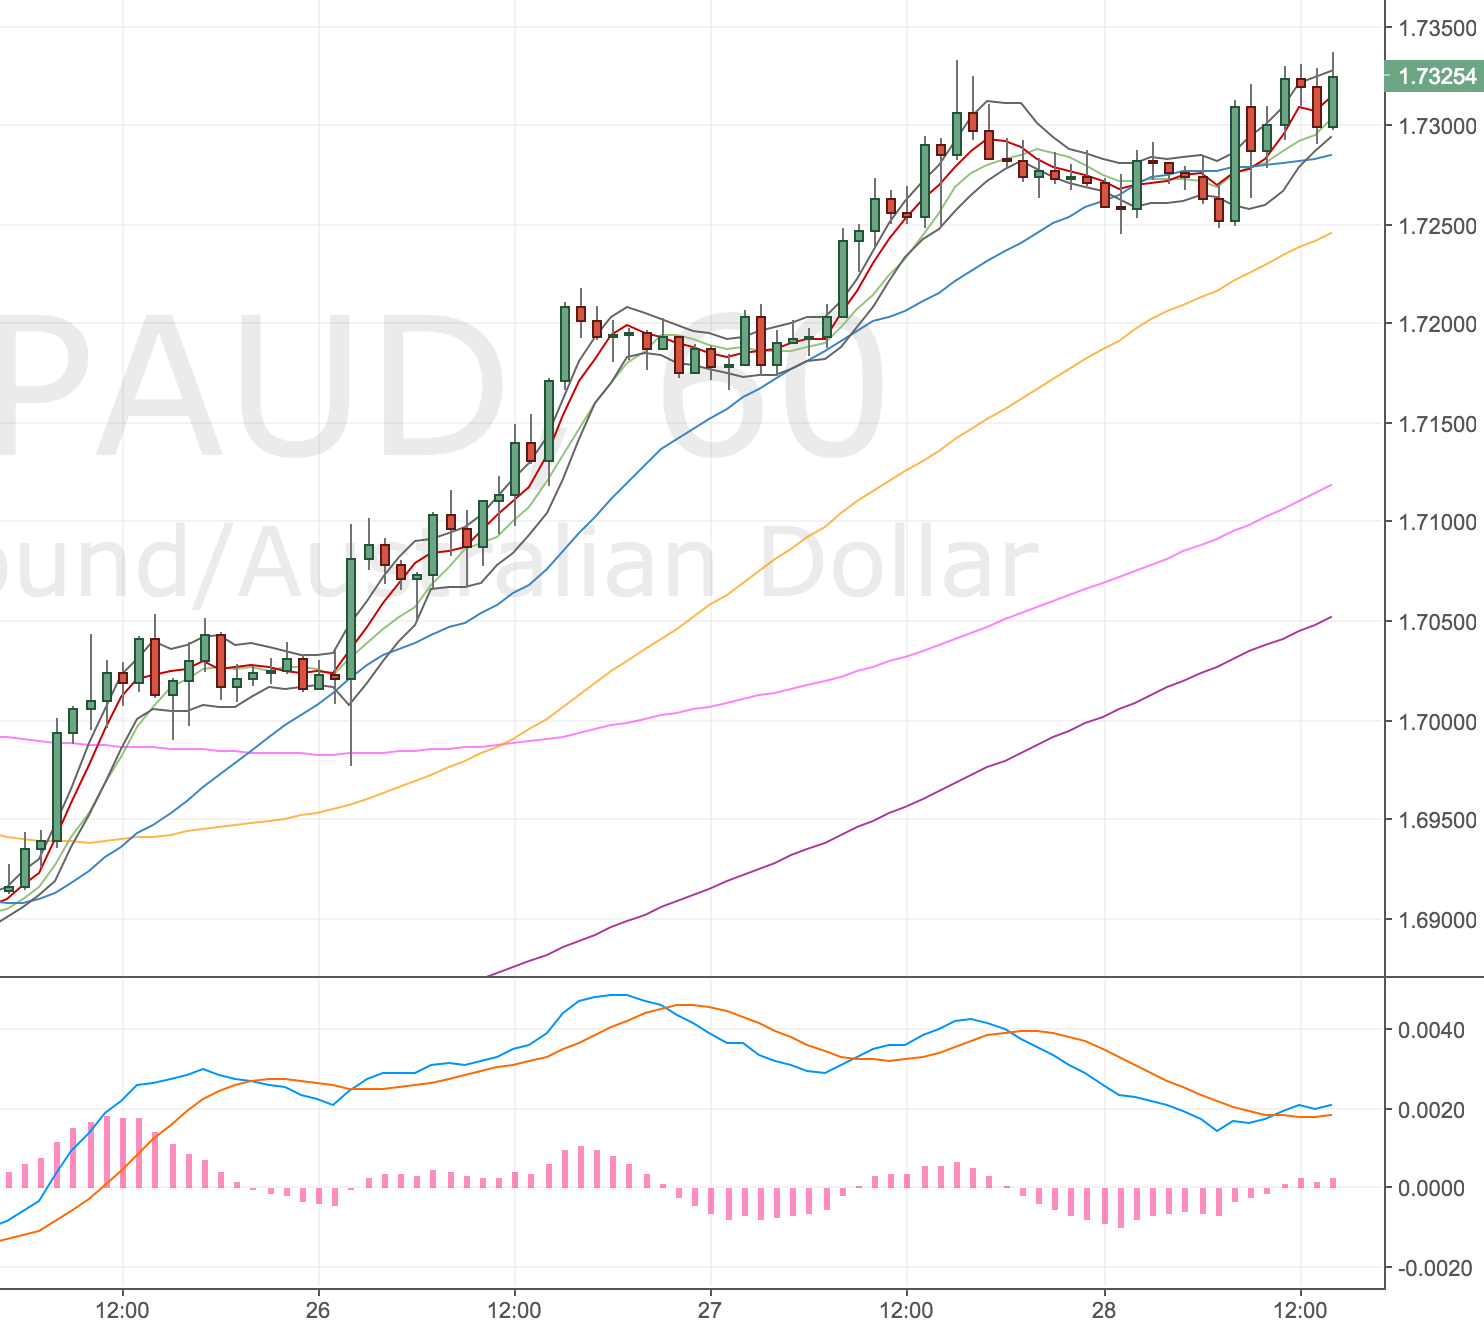
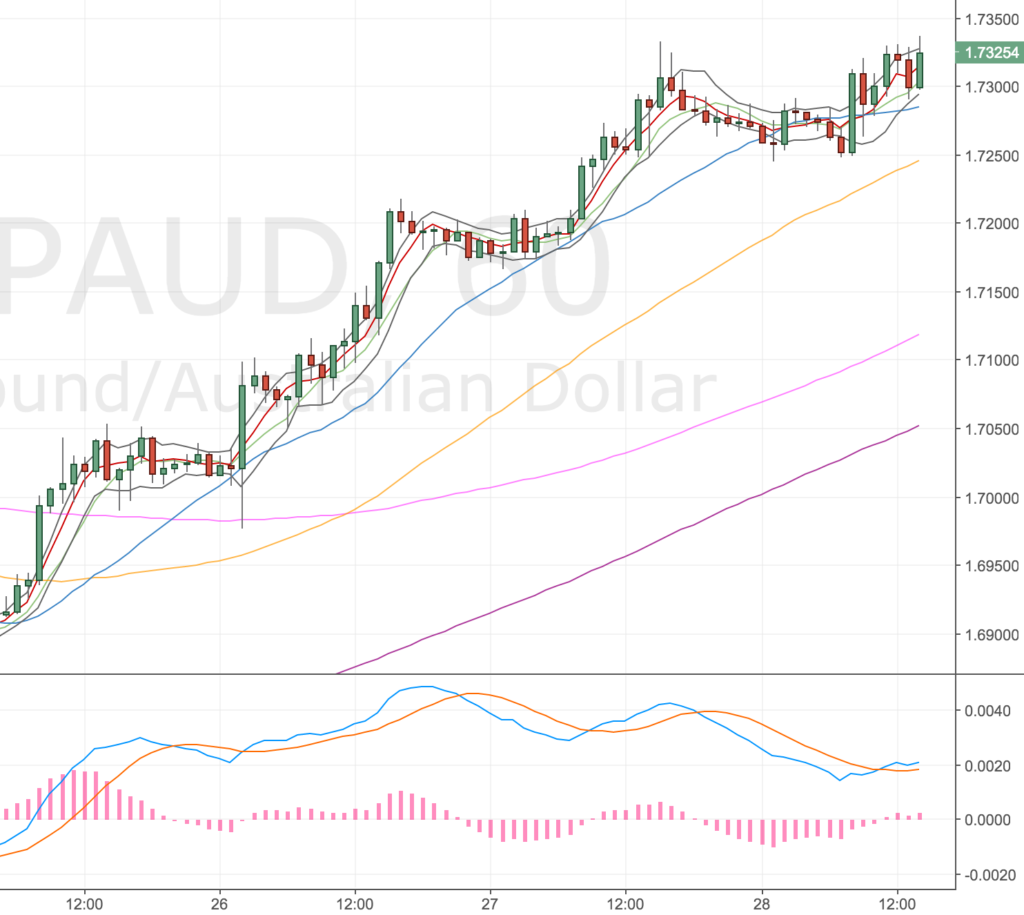
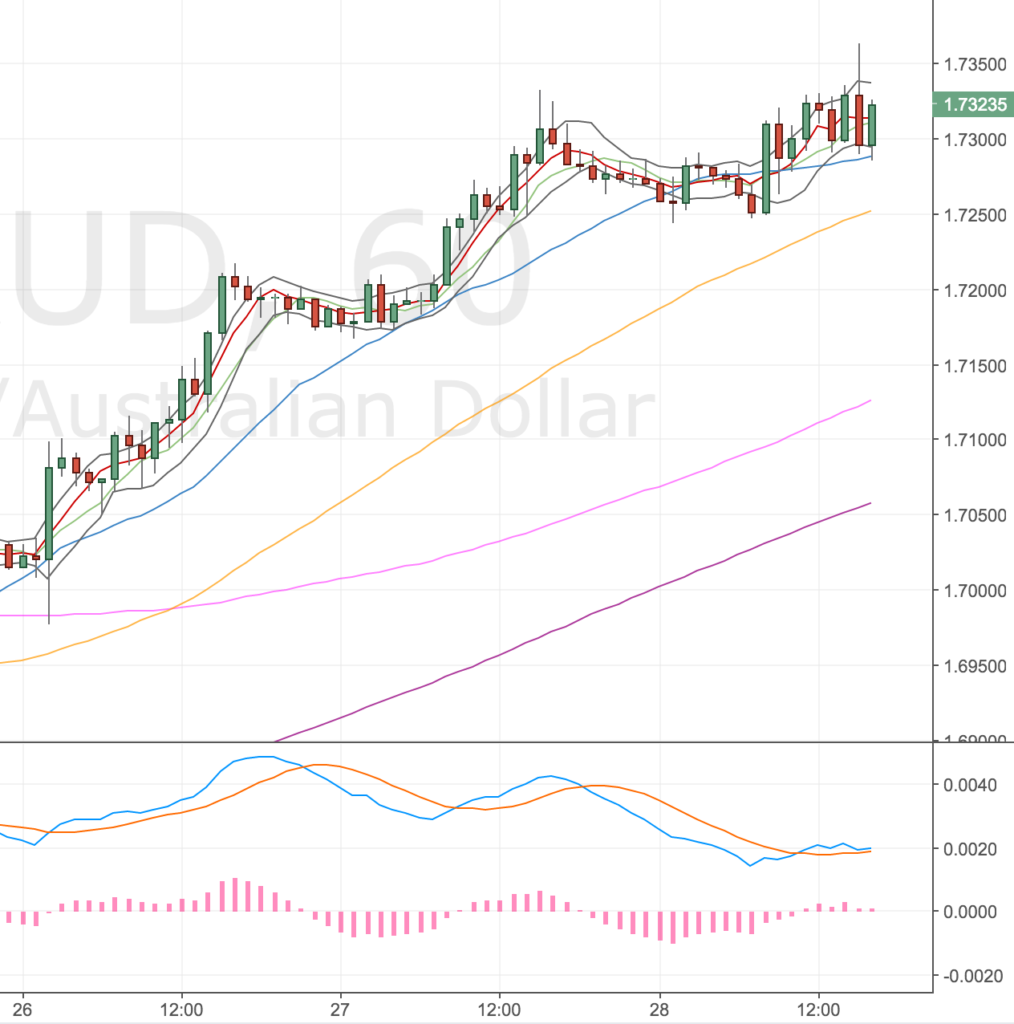
1H Chart

GBPAUD 1H Chart – 28 Apr

There’s a double divergence on the hourly chart.

The only other timeframe of note is the weekly. We are into the w50.

Stopped out – 28 Apr

Got stopped out on this trade, Friday PM. Not a great way to finish the week. The market has just spiked up and taken me out. Very frustrating.

GBPAUD 1H Chart – 28 Apr

My first thought was – if I wasn’t using a tight stop I’d still be in this trade – but that’s my old mindset talking. I know that it is better to hit a lower win rate and get back into trades.

Added an order to get back in – 28 Apr

I know this is the right thing to do, get back into the trade, so I waited for the set up to remateralise and placed an order roughly 50% off the high. We’re getting to the end of day Friday, so I’m not sure the timing is good right? Being triggered in over a weekend!?

GBPAUD 1H Chart – 28 Apr

Cancelled the order – 28 Apr

I’ve cancelled this order, Friday @ 21:20. Price was within 1 pip of triggering the order but price has now moved away. Maybe this is a good thing. I’m nervous of holding a position over the weekend in the GBP if there’s some sudden trauma that triggers me in and immediately out of a trade. Maybe this is not worth worrying about?

Feeling unlucky with this one – 02 May

Just double checking the chart to see if any further set ups occur and I’m feeling pretty unlucky about this. I missed my entry by 1 pip and price has now hit my original target quite quickly. I’ve had so many losers lately it’s not nice to see.

GBPAUD 4H Chart – 2 May

GBPCAD 4H Short – 27 Apr 17


Acc Risk: 0.55%
Short: 1.7485
Stop: 1.7548 (63 pips)
Target: 1.6935 (613 pips, 4h100, 9.7 RR)
Mindset: Resigned to the market

Update – Stopped out lunchtime – 27 Apr
Update – Re-entered the market – 28 Apr
Update – Stopped out in 4 mins! – 28 Apr
Update – Switching to the GBPAUD – 28 Apr

I just looked up resigned in the dictionary – just to make sure it was an accurate of my mindset right now – it is.

resigned
adjective
having accepted something unpleasant that one cannot do anything about: my response is a resigned shrug of the shoulders.

That pretty well sums it up! Hahaha. I’m just taking the signals and waiting for my time.

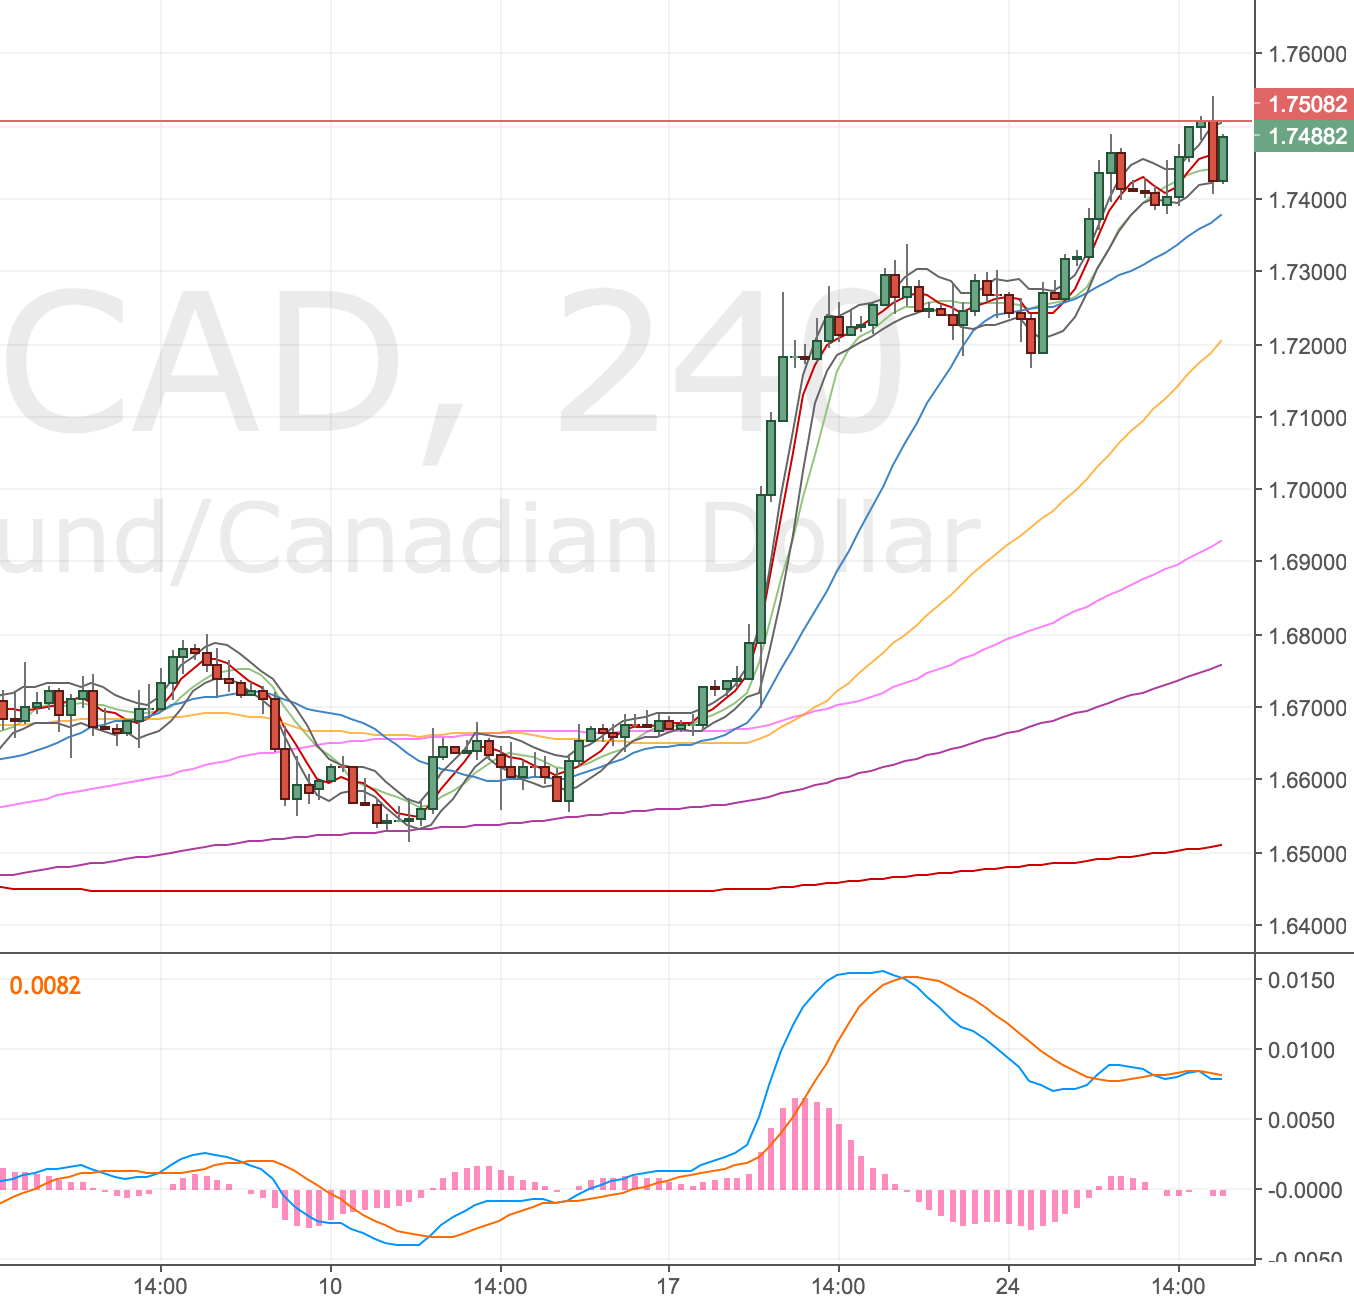
I actually spotted this trade a few days ago but held fire for the resistance line test. It has been quite strong but hasn’t been tested for a while so it felt stupid to jump the gun. If it went without testing it, so be it, but it was so close I decided to wait. I was also hoping for a strong pin bar to give me some confidence. Didn’t quite happen as dramatically as I’d like but it has happened now (Not to say it couldn’t do another flash up again!)

Technically I like this chart, so I will need to be prepared to trade it again but will need to keep in mind the USDCAD trade I’m also watching/trading I’ve just been stopped out of that trade, but I can see the daily timeframe setting up.

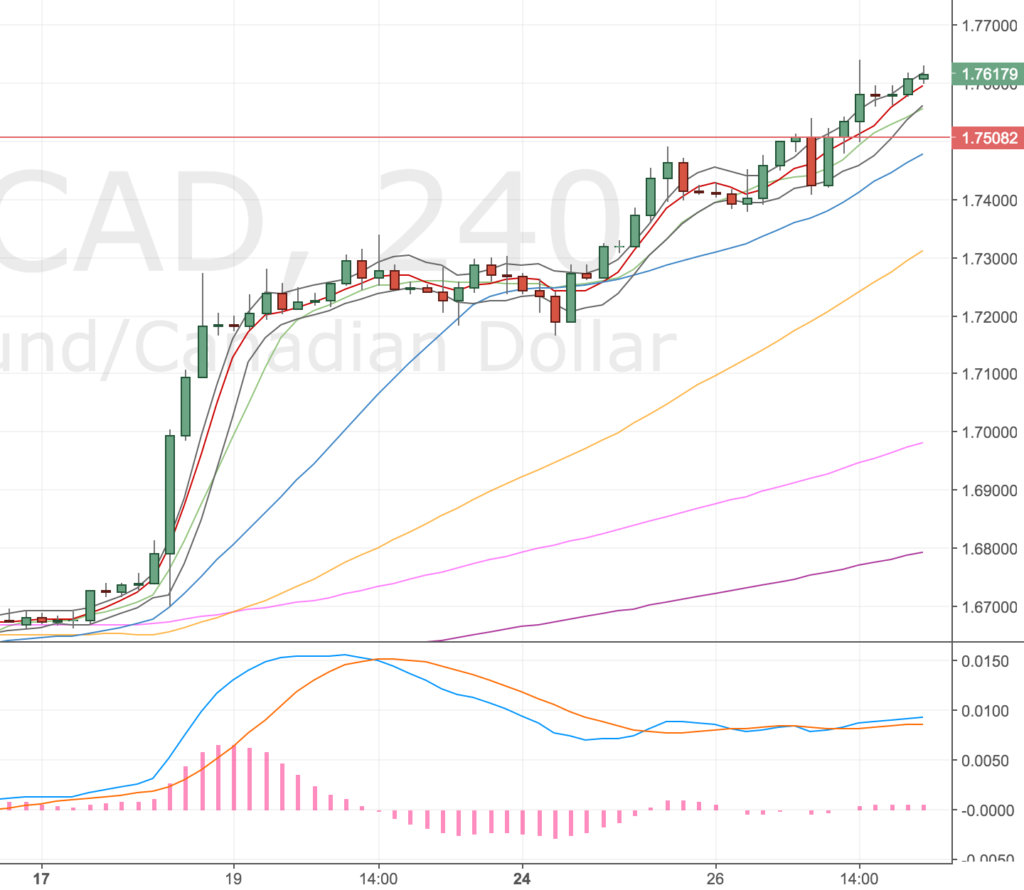
4H Chart – the setup

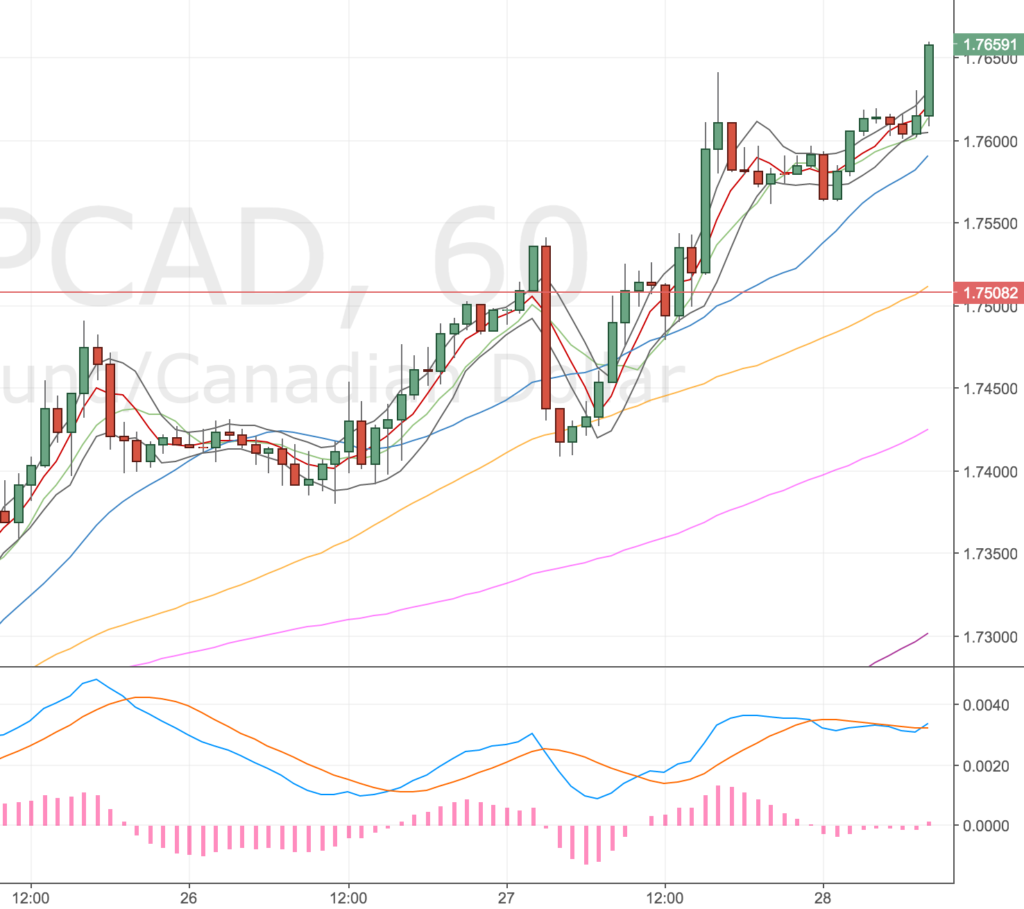
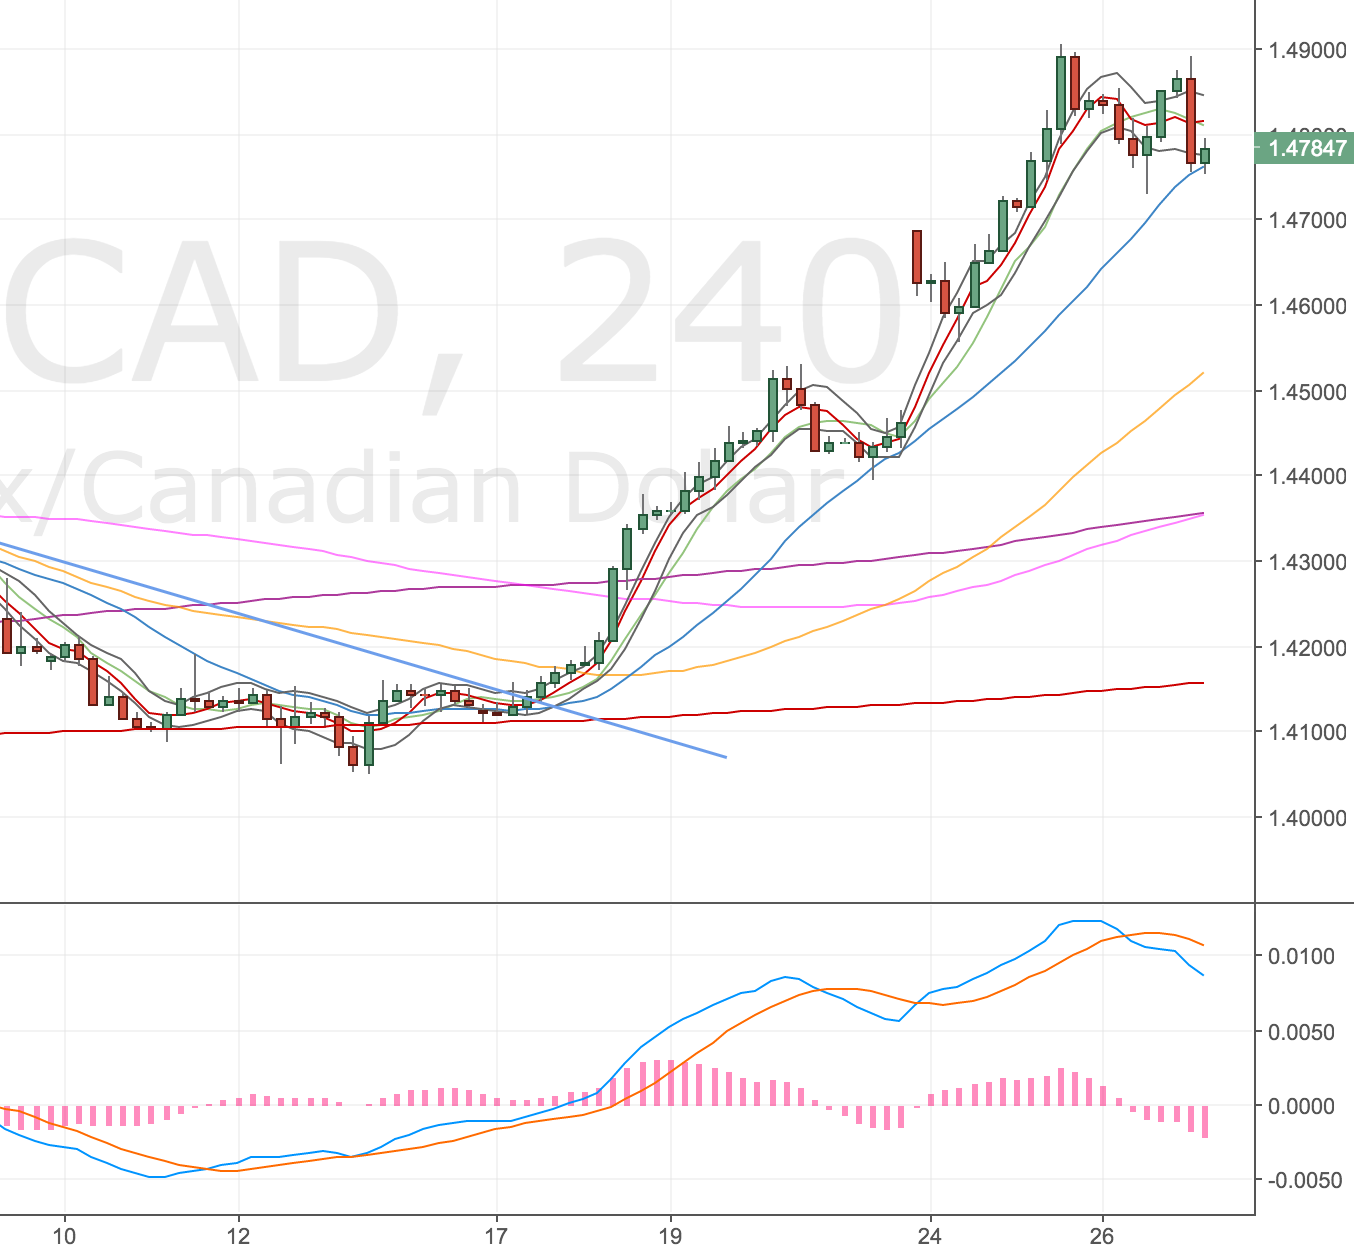
USDCAD 4H Chart – 27 Apr

Looks like a good entry to me, quite near the top of the bands.

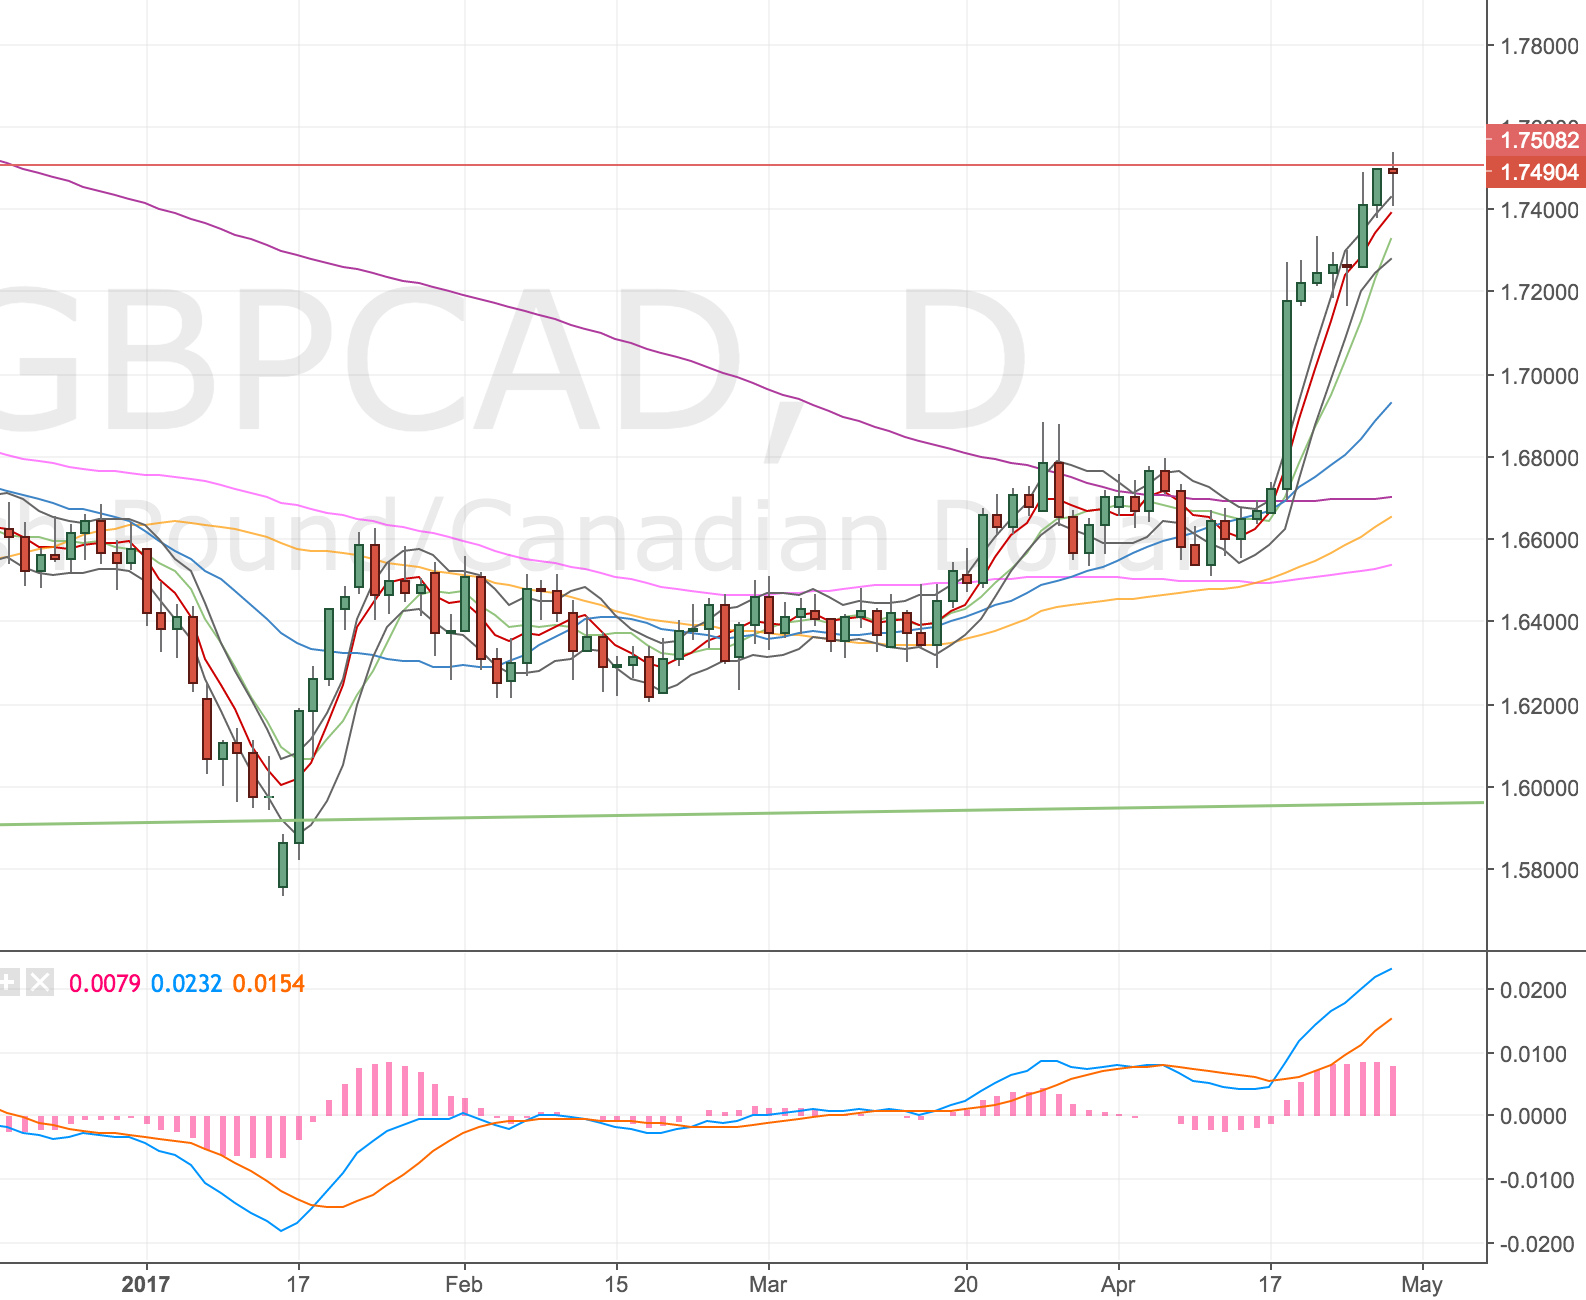
Daily Chart

GBPCAD Daily Chart – 27 Apr

Hopefully this will stay as a doji into the resistance level!

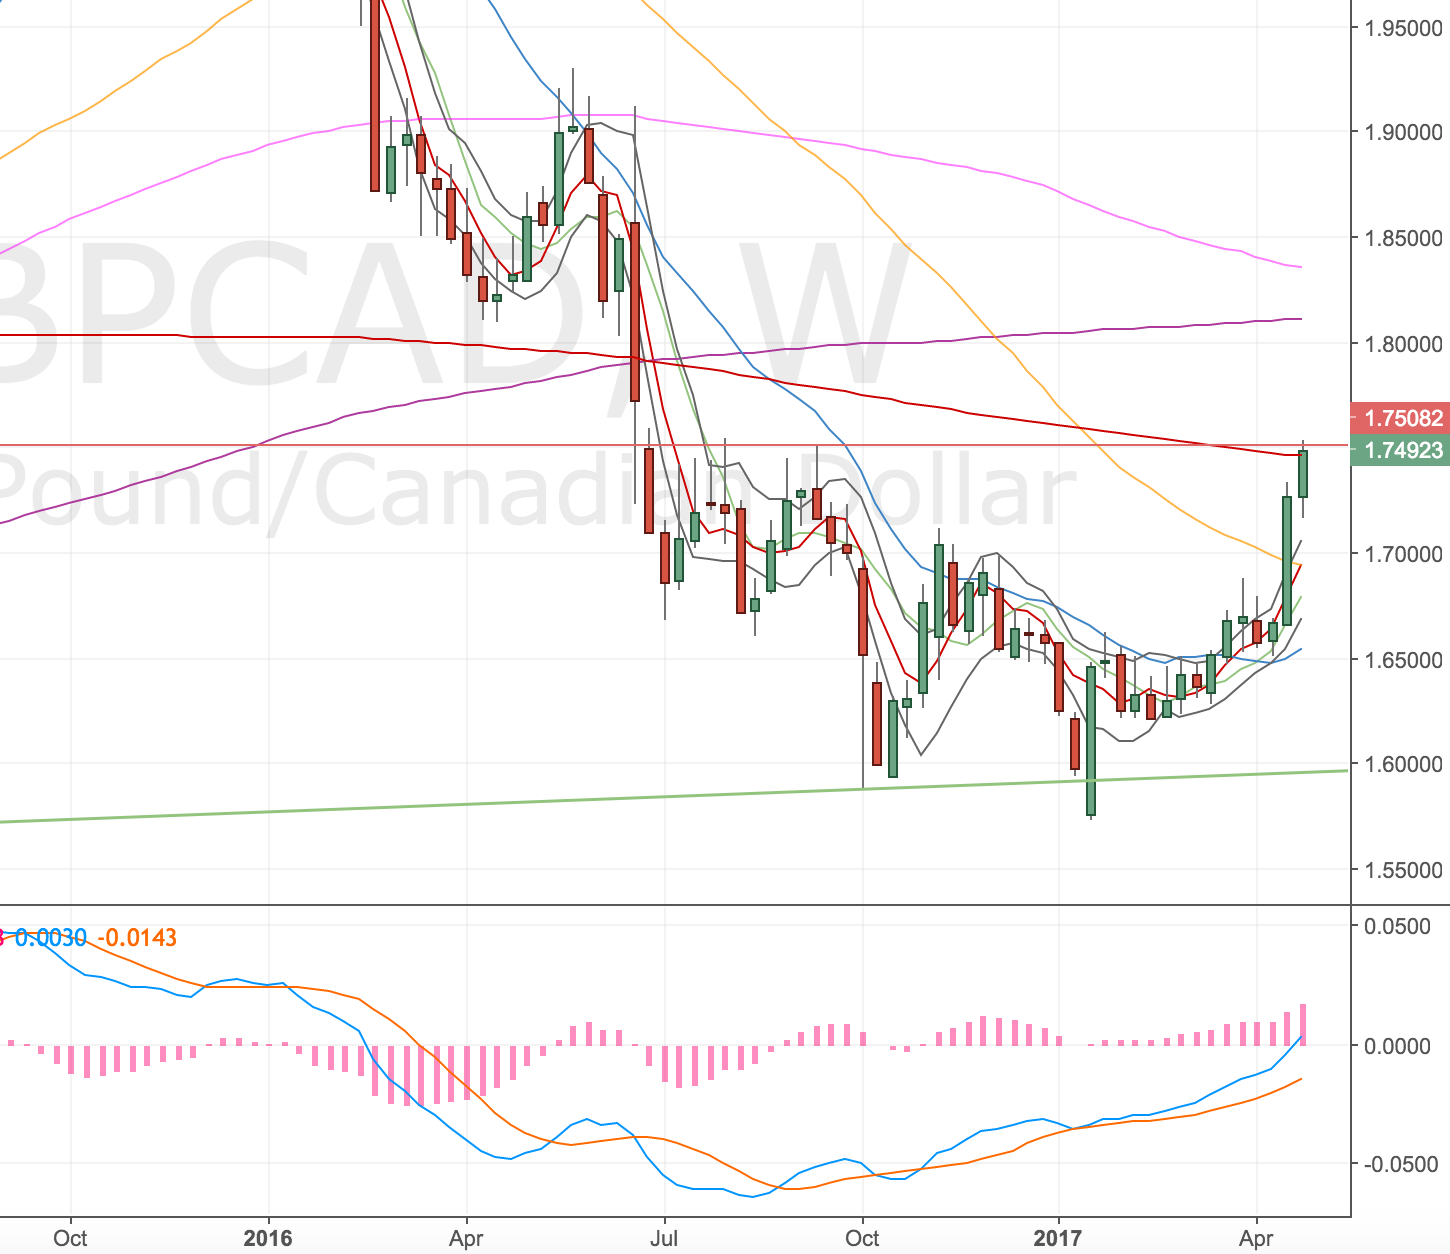
Weekly Chart

GBPCAD Weekly Chart – 27 Apr

Weekly price action into the w500.

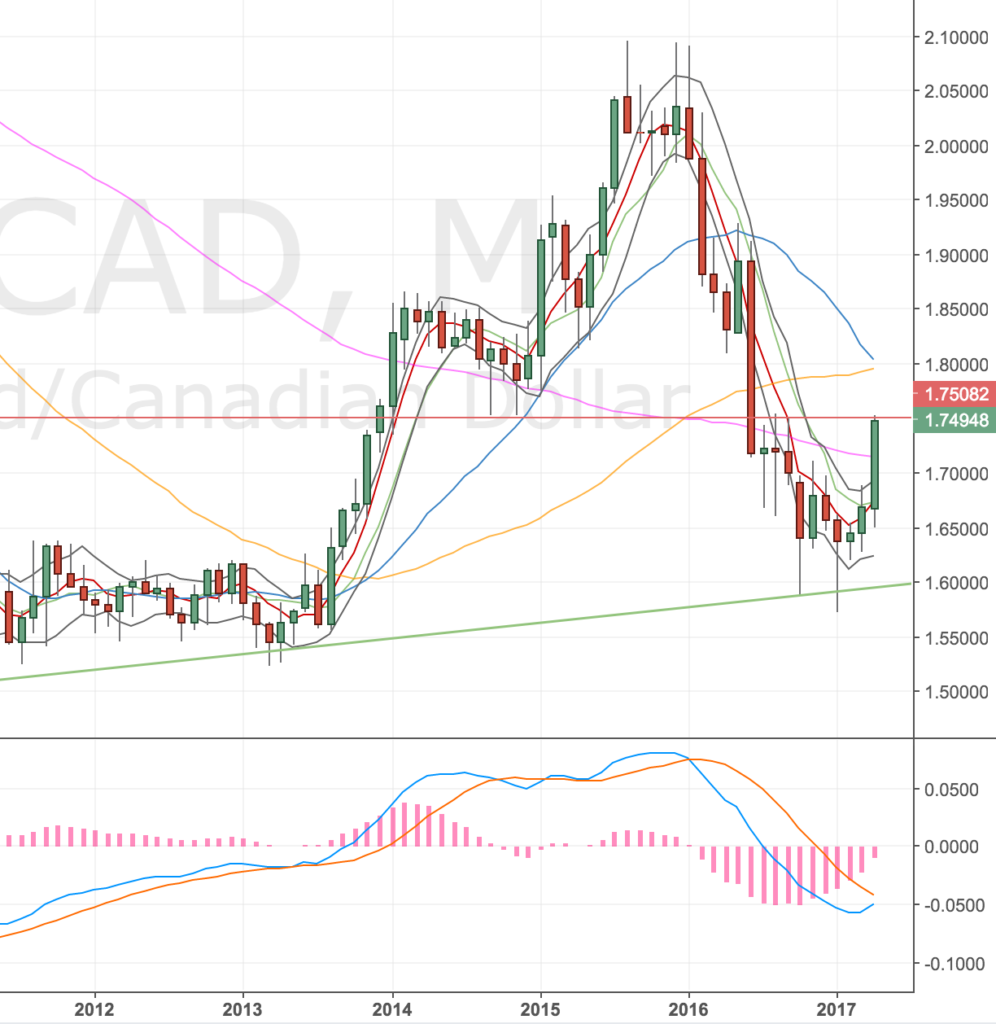
Monthly Chart

GBPCAD M Chart – 27 Apr

Monthly big push up to the, long standing, resistance level. It’s been prior support in 2014.

Summary

Technically the set up is quite tidy, but I can definitely see this going higher before it goes lower. I may have got in too early. If so I will have to try again if the set up is still valid, the chart looks too tidy.

Update – Stopped out lunchtime – 27 Apr

I actually didn’t realise I’d been stopped out of this until the evening. When you trade so many different markets it’s hard to remember all the price levels! Anyway – I thought it might happen, chop around a key level is quite common and price moved strongly higher.

I’m looking for a re-entry and can’t see a clear place to get in.

4H Chart – 28 Apr AM

GBPCAD 4H Chart – 28 Apr

We have two doji bars close inside the bands (which I usually ignore) but now I can see this drift into the bands. I would be much happier if there was a clear top – UK GDP figures are out this morning – so volatility is quite likely again. This is similar to the previous GBPUSD trade I didn’t take so I will have to get back in but where?

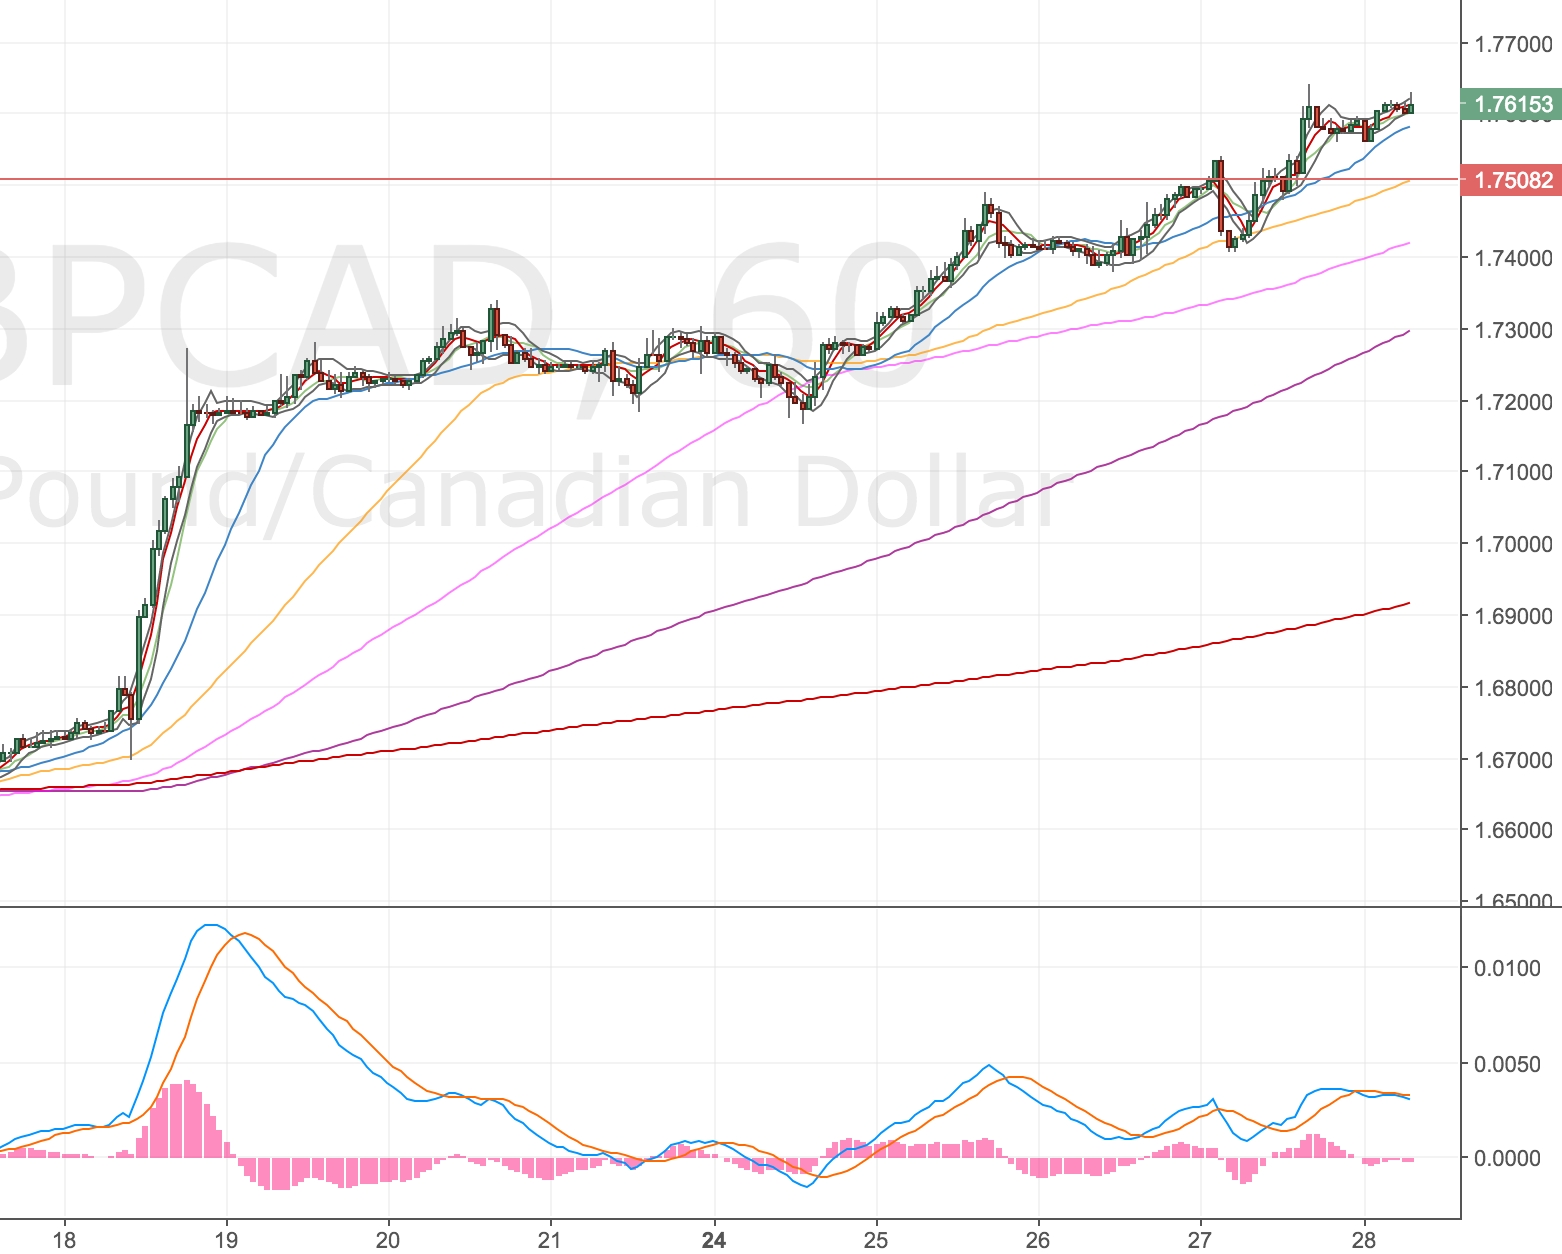
1H Chart – 28 Apr AM

GBPCAD 1H Chart – 28 Apr

The hourly chart is showing a double divergence so I’ll probably trade off this chart and see where we end up. This feels very uncomfortable so it’ll be a small position and I’ll need to add a bit extra to my stop to cover the spread.

Re-entered the market – 28 Apr


Acc Risk: 0.5%
Short: 1.7613
Stop: 1.7654 (41 pips)
Target: 1.7429 (225 pips, 1h100, 5.48 RR)
Mindset: Probably the worst I’ve felt trading. I have an awful win rate and constantly feel like I’m getting it wrong.

We’re inside the bands and diverging so despite the clearer stop placement I’ve gone in again. The stop is slightly wider than I’d like due to the spread and expected volatility. Again I expect to get stopped out of this trade again. It’s the morning of the GDP figures, so they’ll be volatility coming into the market.

Having placed the trade – I’m starting to wonder if it would’ve been better to wait for just prior to the news so the market would be quieter? I guess the spreads would be worse?

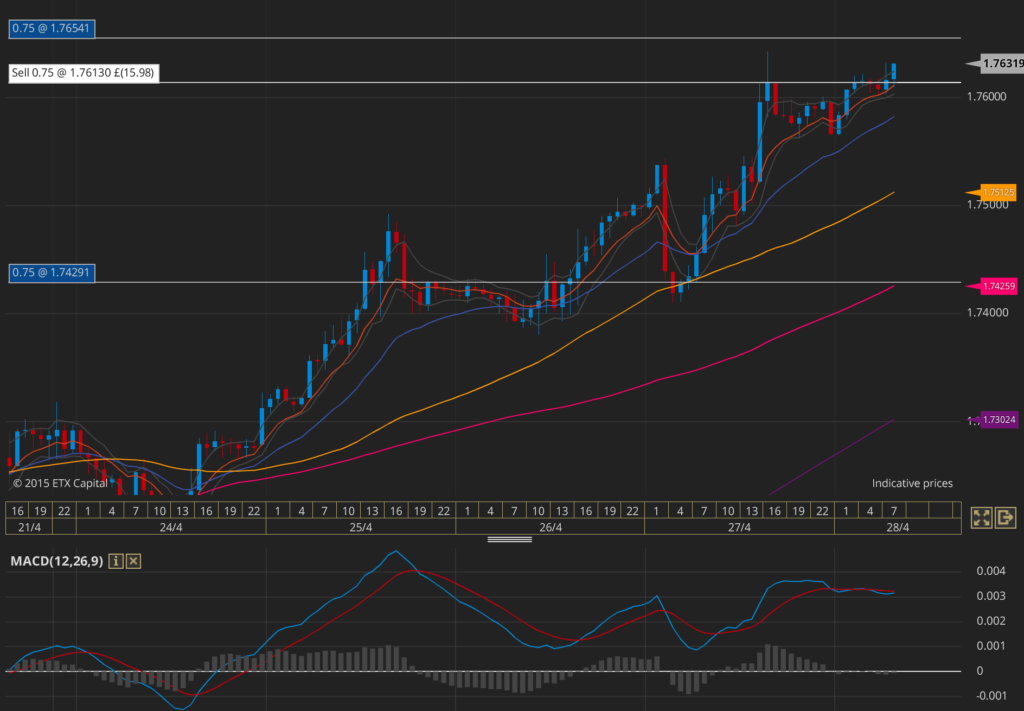
Here’s my entry (the market has already moved higher since I took the trade, but it was inside the bands!):

GBPCAD 1H Chart – 28 Apr

Stopped out within 4 mins! – 28 Apr

GBPCAD 1H Chart – 28 Apr

Well I’d only just posted the chart and I got stopped out! I’d looked at this chart a few times before making my decision and within minutes of placing the trade it spiked me out! Typical. I know it’s just coincidence but I seem to have a knack for timing.

I’ll wait and see again what sets up.

Switching to the GBPAUD – 28 Apr

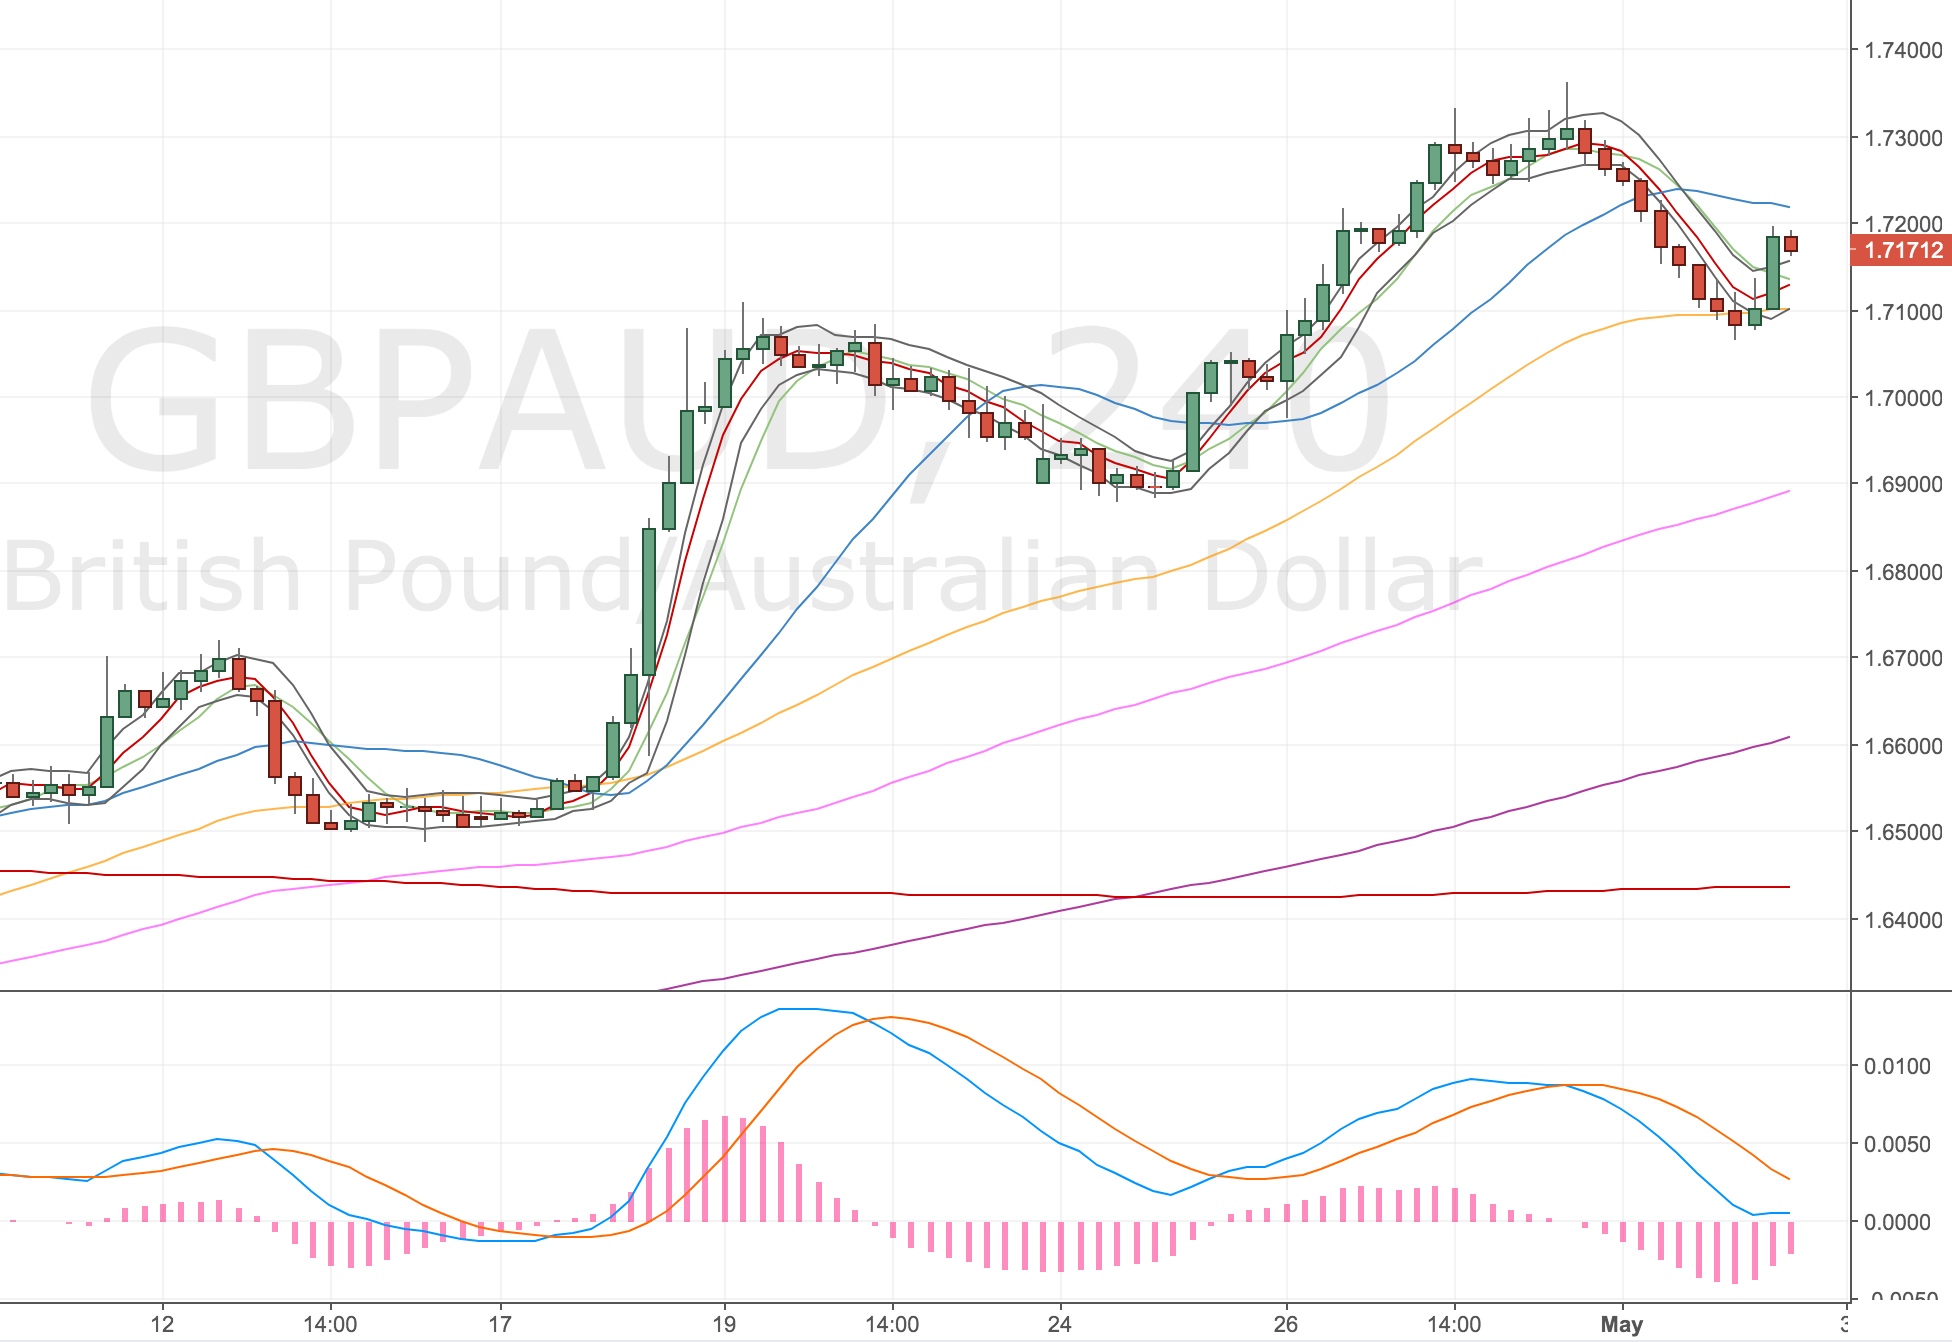
I’ve just been scanning the GBP pairs again and I think there’s a better set up now on the GBPAUD. So I’ve switched to that. There’s a 4H entry I’ve just taken, looks like a nice looping divergence – hopefully it’ll be 3rd time lucky shorting the GBP.

GBPAUD 4H Chart – 28 Apr

USDCAD 4H Short – 26 Apr 17


Acc Risk:
Short: 1.3588
Stop: 1.3631 (43 pips)
Target: 1.3434 (4h50, 154 pips, 3.58 RR)
Mindset: Relatively comfortable

Update – Stopped out overnight – 27 Apr

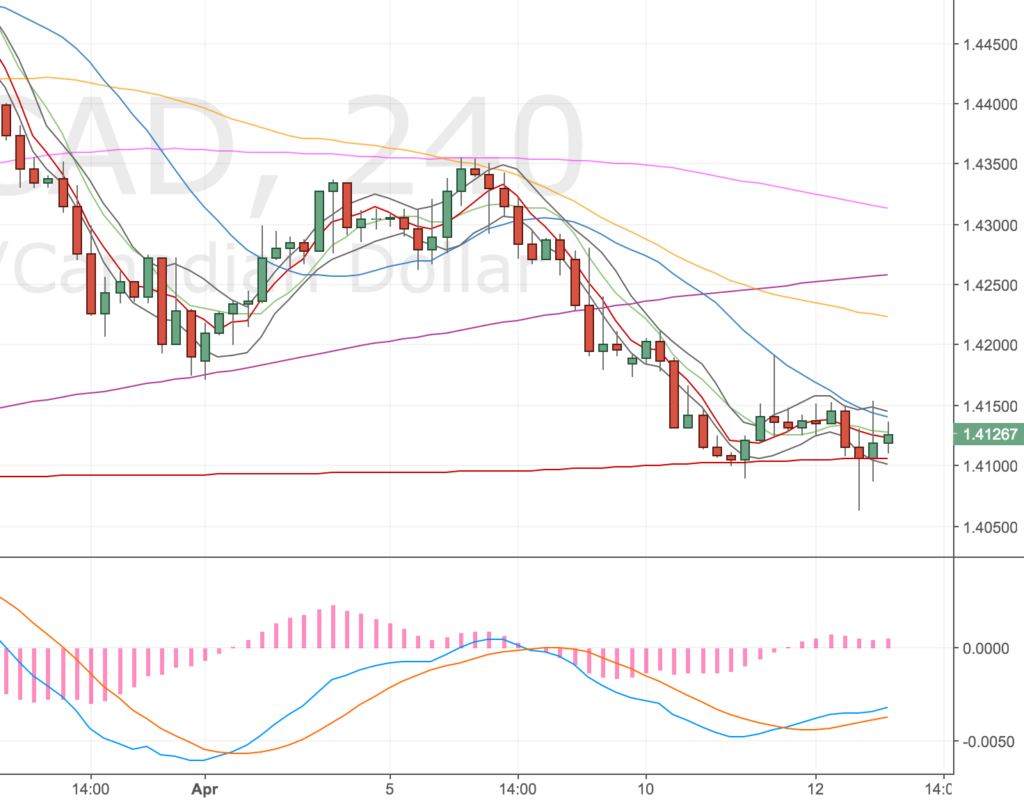
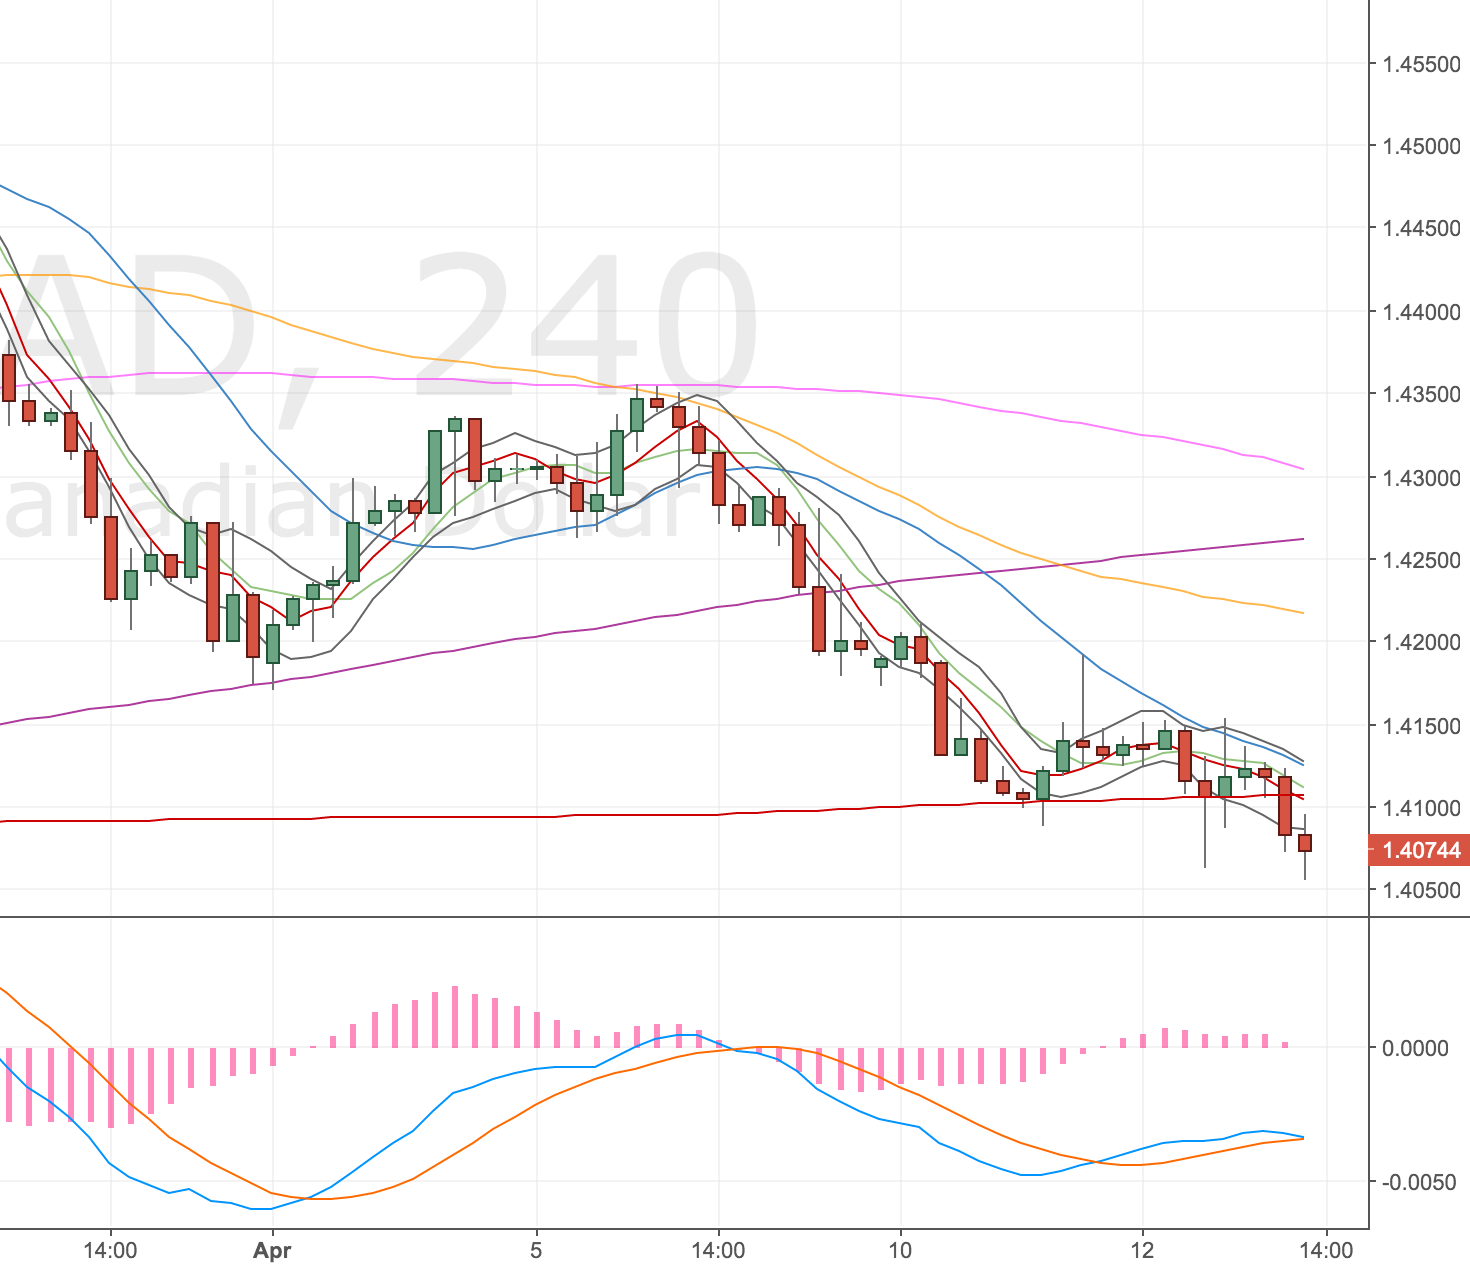
I’ve been staying clear of USDCAD lately; the charts are really choppy and I felt they were difficult to read. However, trading mechanically, I have elected to take the trade. The RR is good and the volatility has picked up so we could make a quick buck!

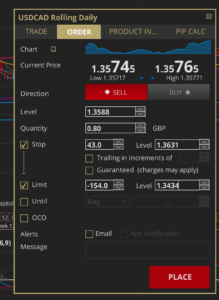
I did this at lunch so didn’t get a chance to screenshot my charts. I did screenshot my ticket to help me blog this later, so here you go.

USDCAD Ticket

I can see this going either way, as usual, so we’ll see how it goes.

Stopped out overnight – 27 Apr

Didn’t go my way, again trading lots of different markets means I’m more subject to getting bigger runs of losers and winners. So not much to say on this trade. I don’t think I did anything wrong, just one of those things. The move in my direction was ultimately a good one, so unfortunate with timing and entry.

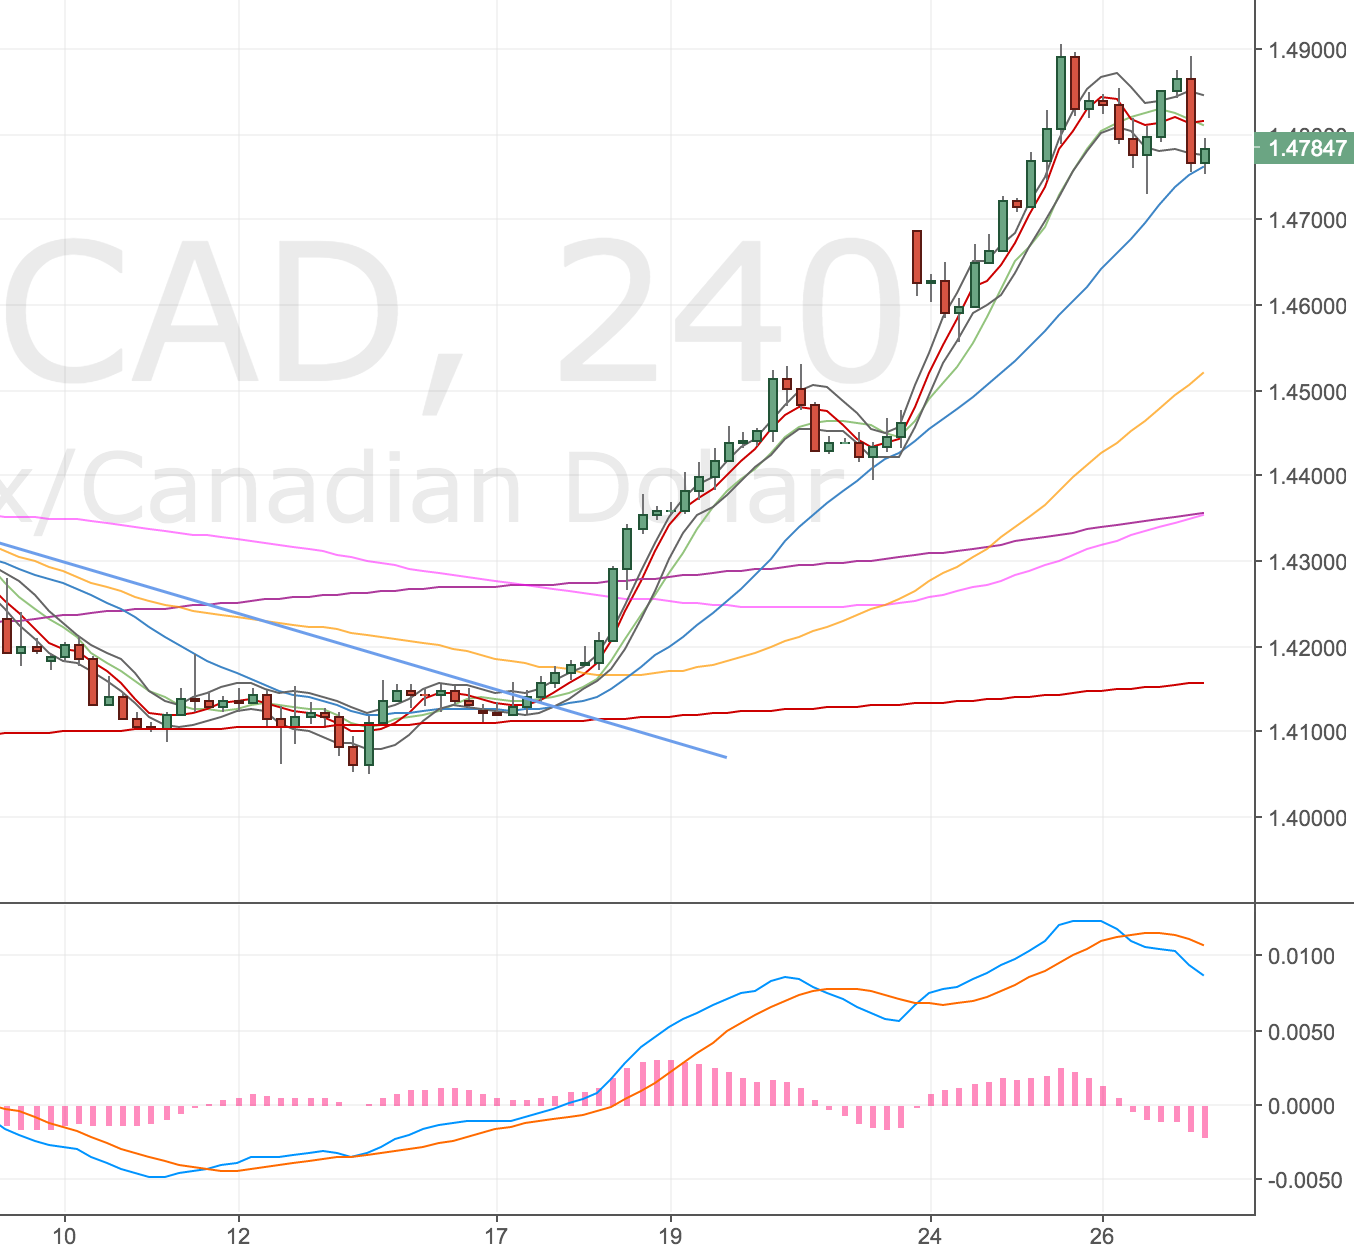
USDCAD 4H Chart – 27 Apr

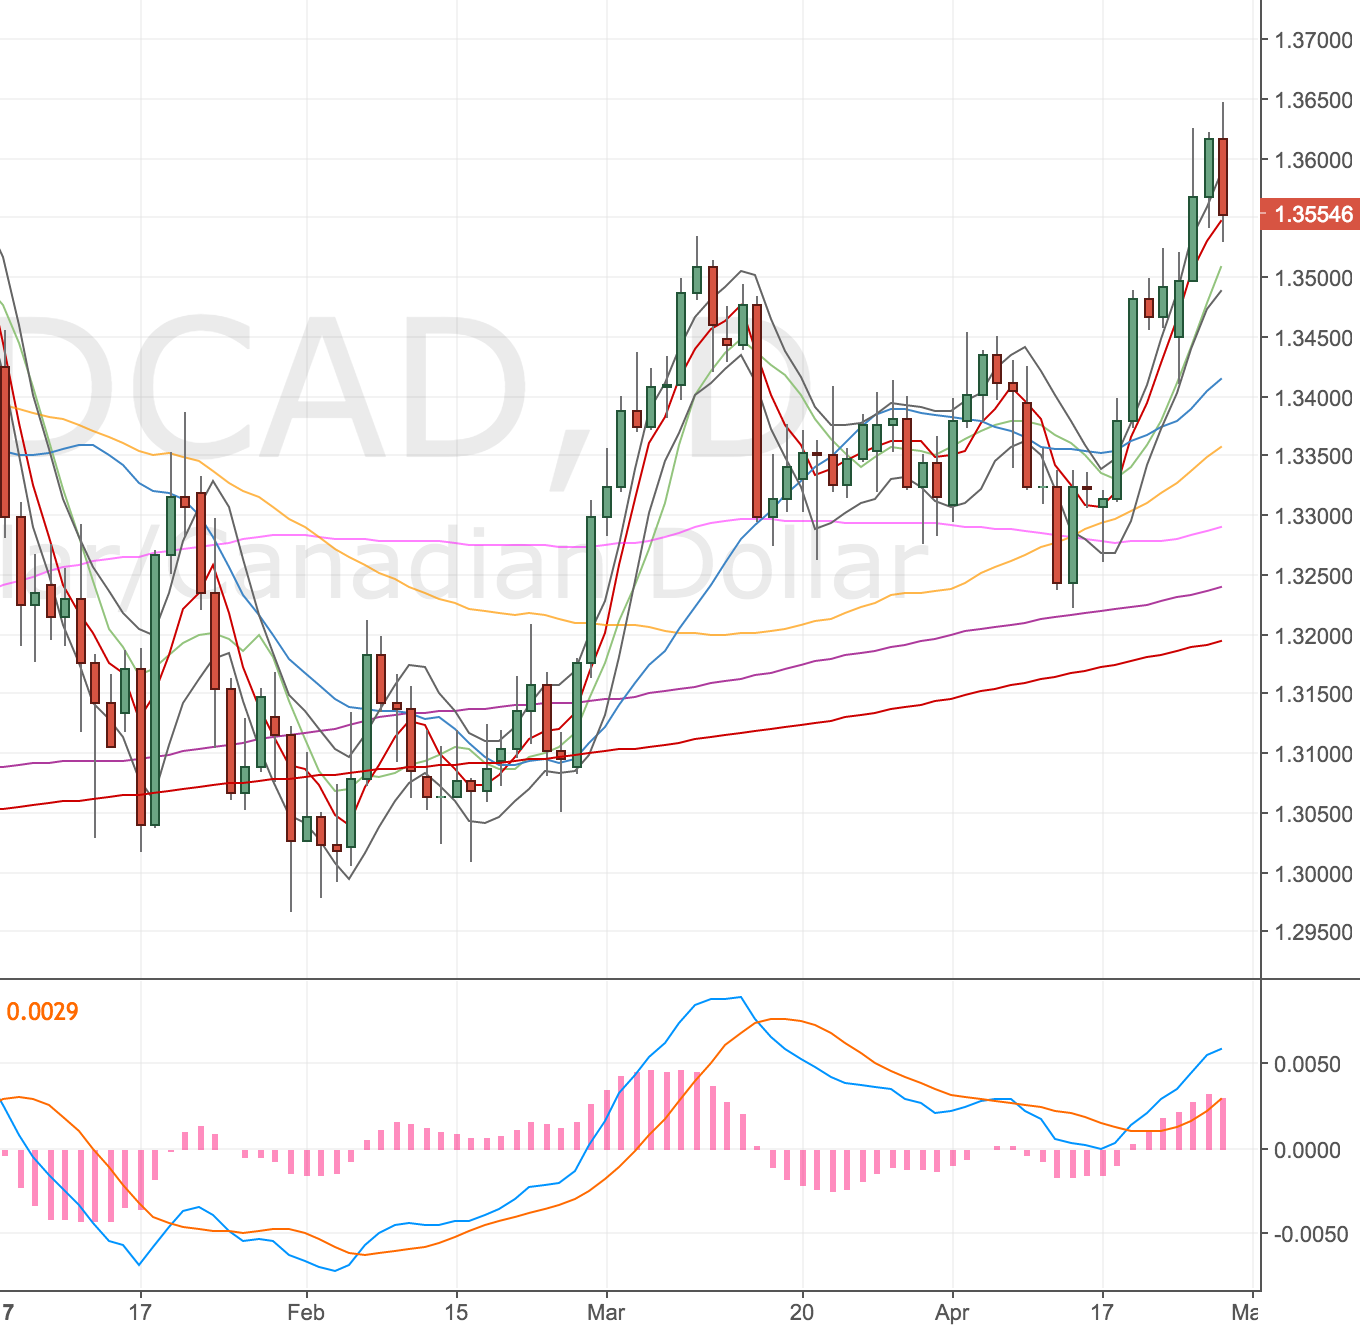
On to the next trade … which might very well be USDCAD again! The daily chart is setting up to go short now. We’ll see if the bar closes inside the bands and I can get a good entry tomorrow.

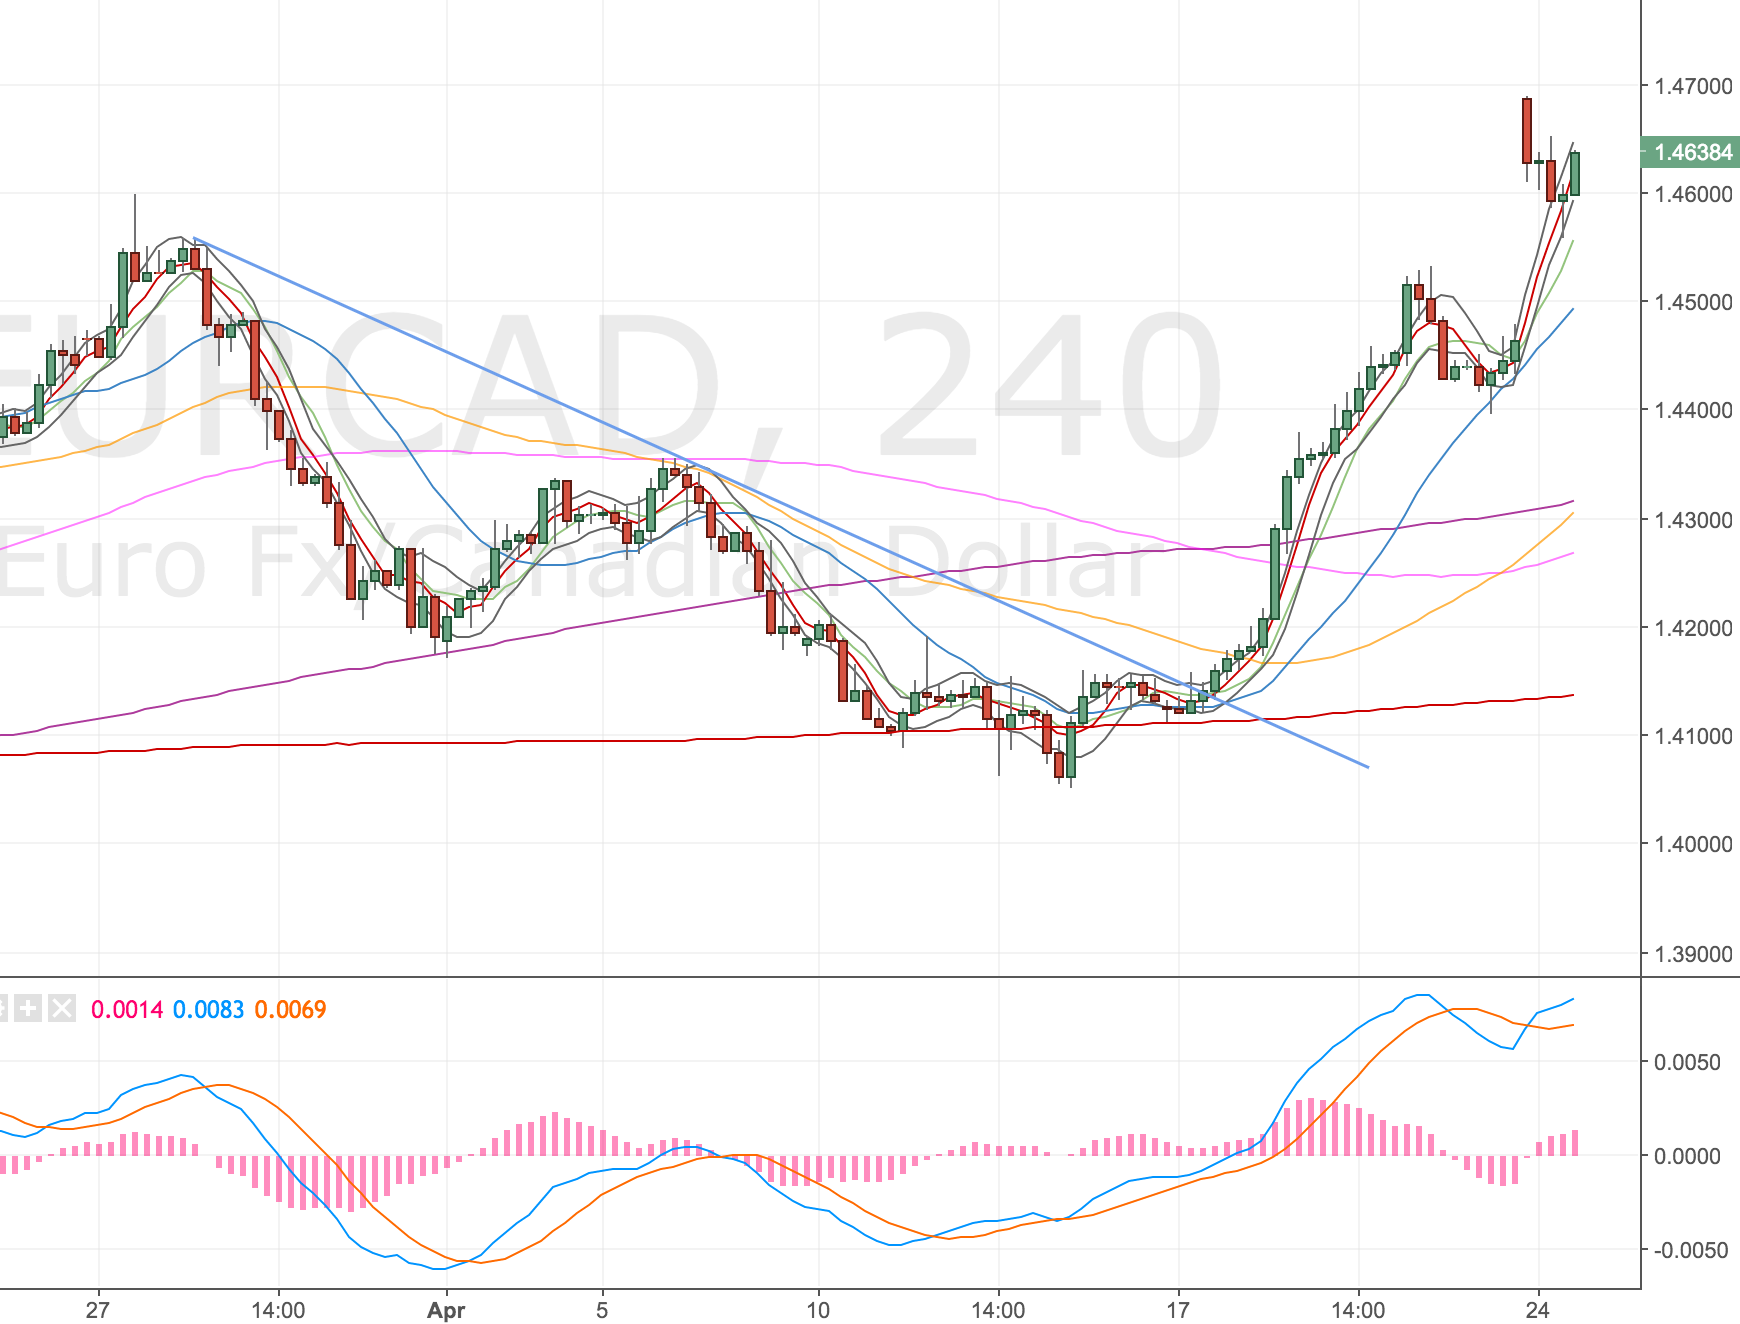
EURCAD DST Short – 24 Apr


Acc Risk: 0.6%
Short: 1.4634
Stop: 1.4717 (83 pips)
Target: 1.4313 (4h50, 321 pips, 3.86RR)
Mindset: Oh well!

Updates – Stopped out – 25 Apr 17

Can’t say this doesn’t feel like a stupid thing to do, but I’ve gone short the € following the weekend’s election results. Stupid because one of the first things you learn in technical analysis is trading the gap – looking for gap fills in markets. Surely everyone is trading this?!

Also when you get market making news like this – it feels like your signals are going to get thrown off – purely by the monster move that happened?

Anyway, I’m trading the system, but can’t help but feel we are going into a trending environment which is going to kill me system AKA drawdown time? I guess we’ll know when we do the monthly analysis next week.

Here’s the set up anyway

4h Chart – the setup

EURCAD 4H Chart – 24 Apr

Looking for the gap fill, the divergence is pretty marginal. Hoping (not my strategy – just my choice in words!) the price won’t go much beyond the upper band.

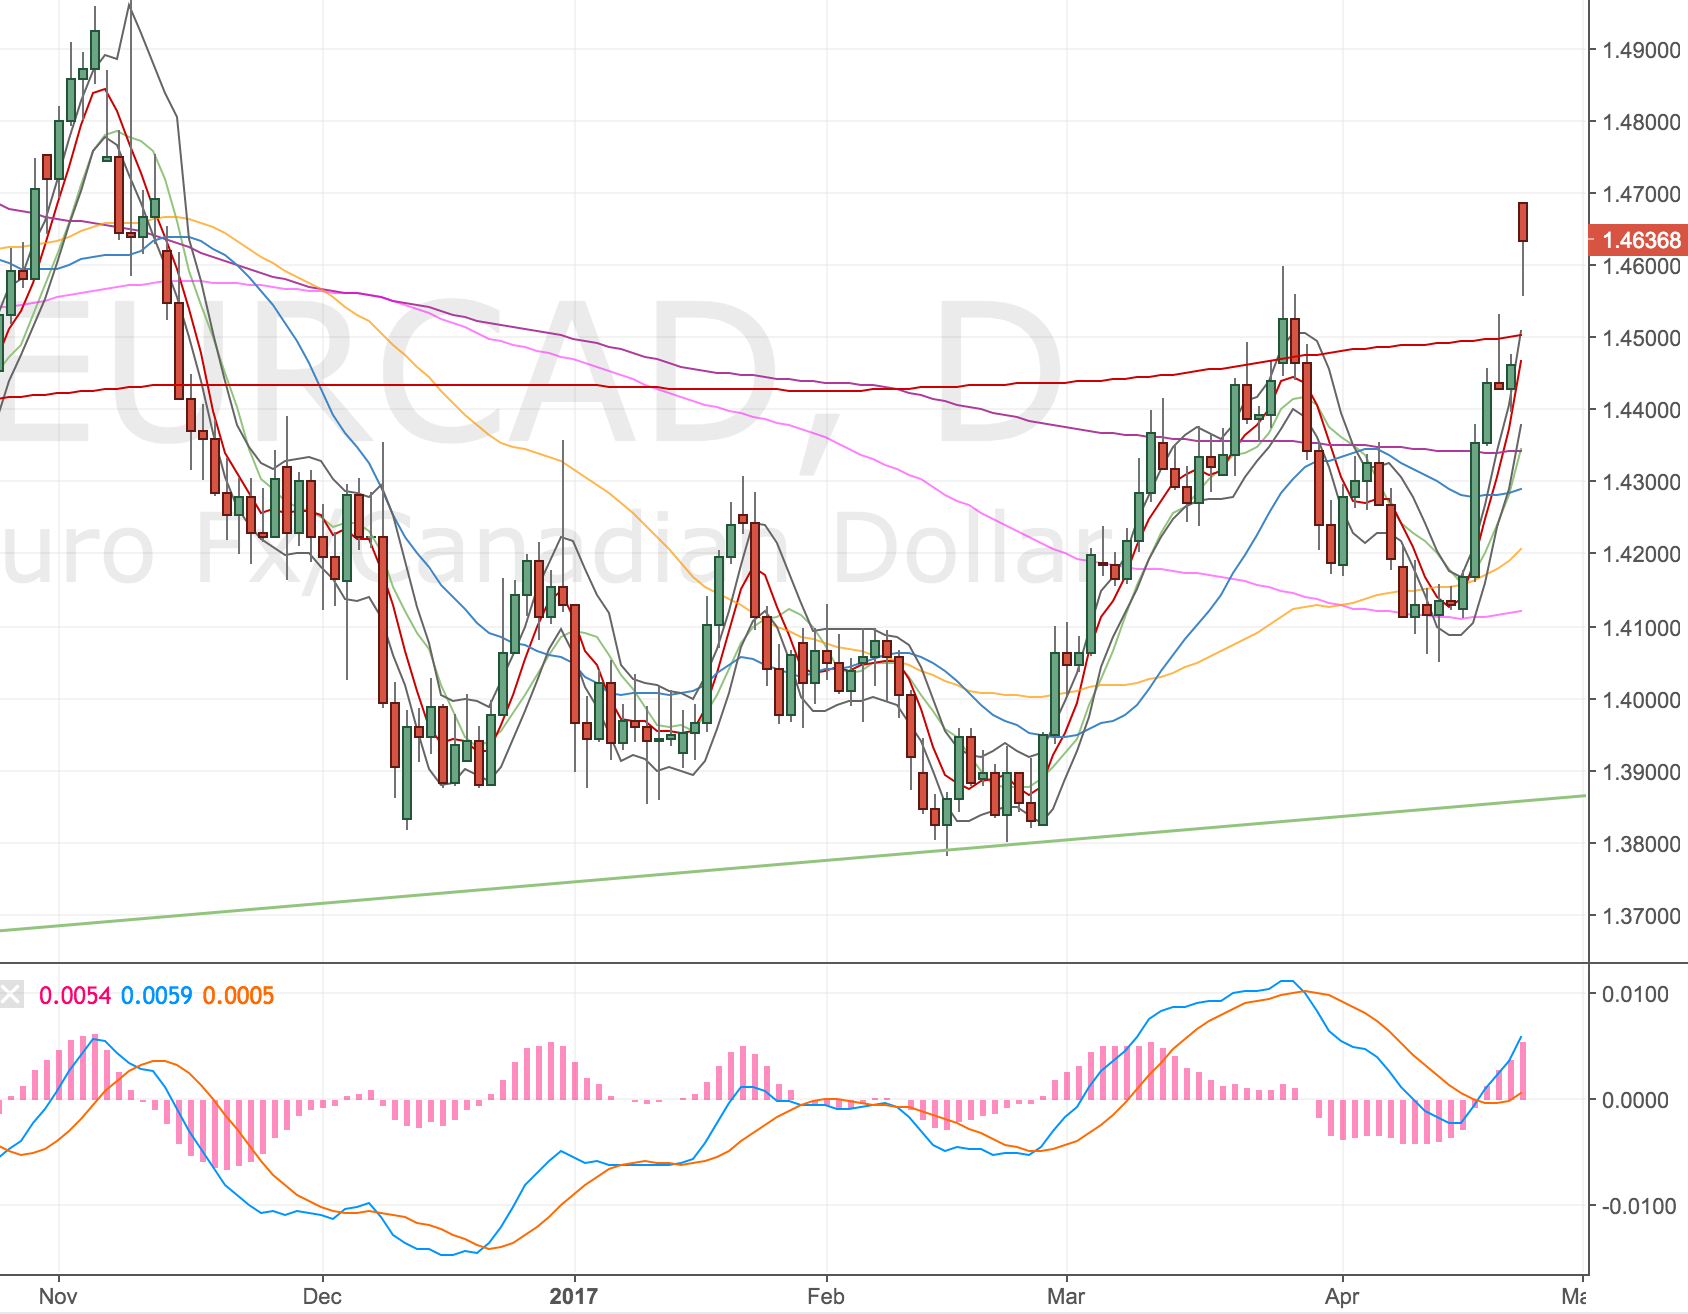
Daily Chart

EURCAD D Chart – 24 Apr

If price comes down on the 4H, we might set up for a divergence on the daily too.

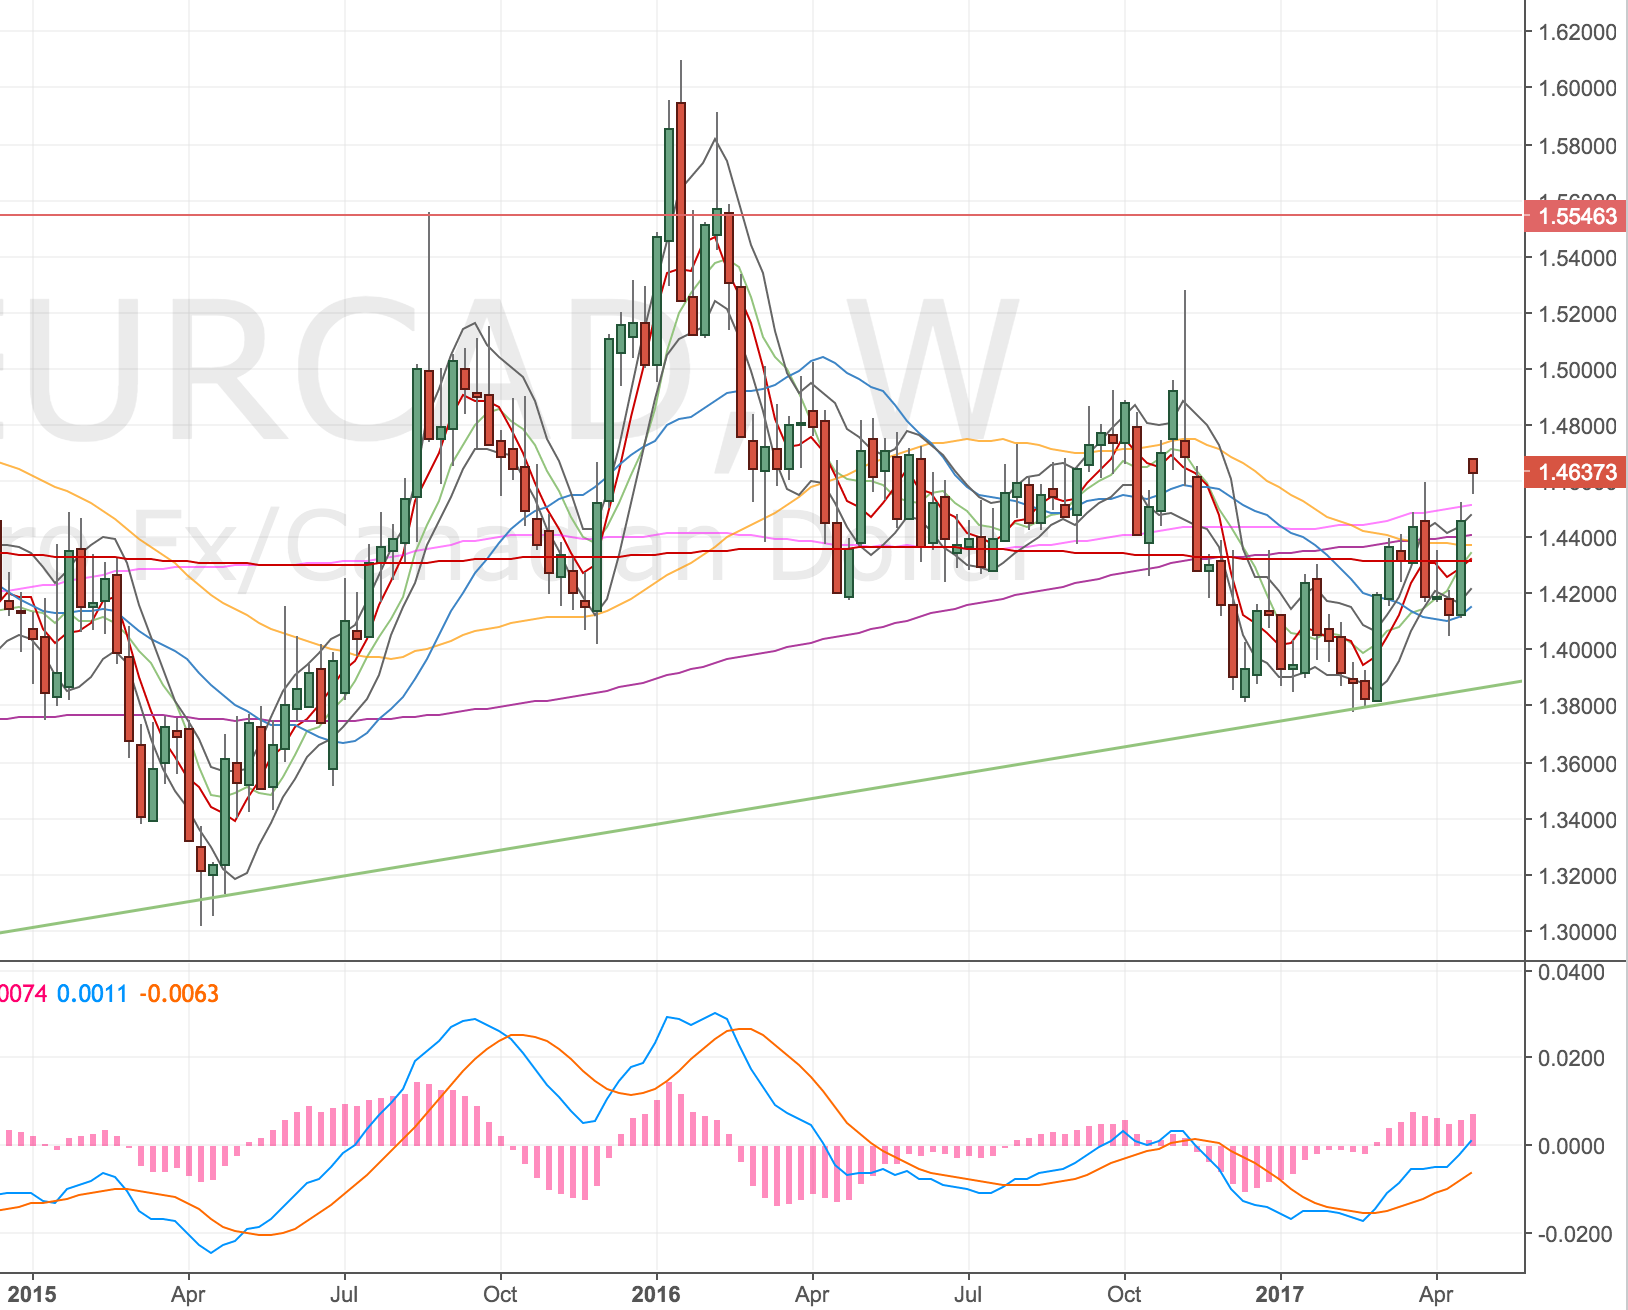
Weekly Chart

EURCAD W Chart – 24 Apr

Nothing stands out to me here.

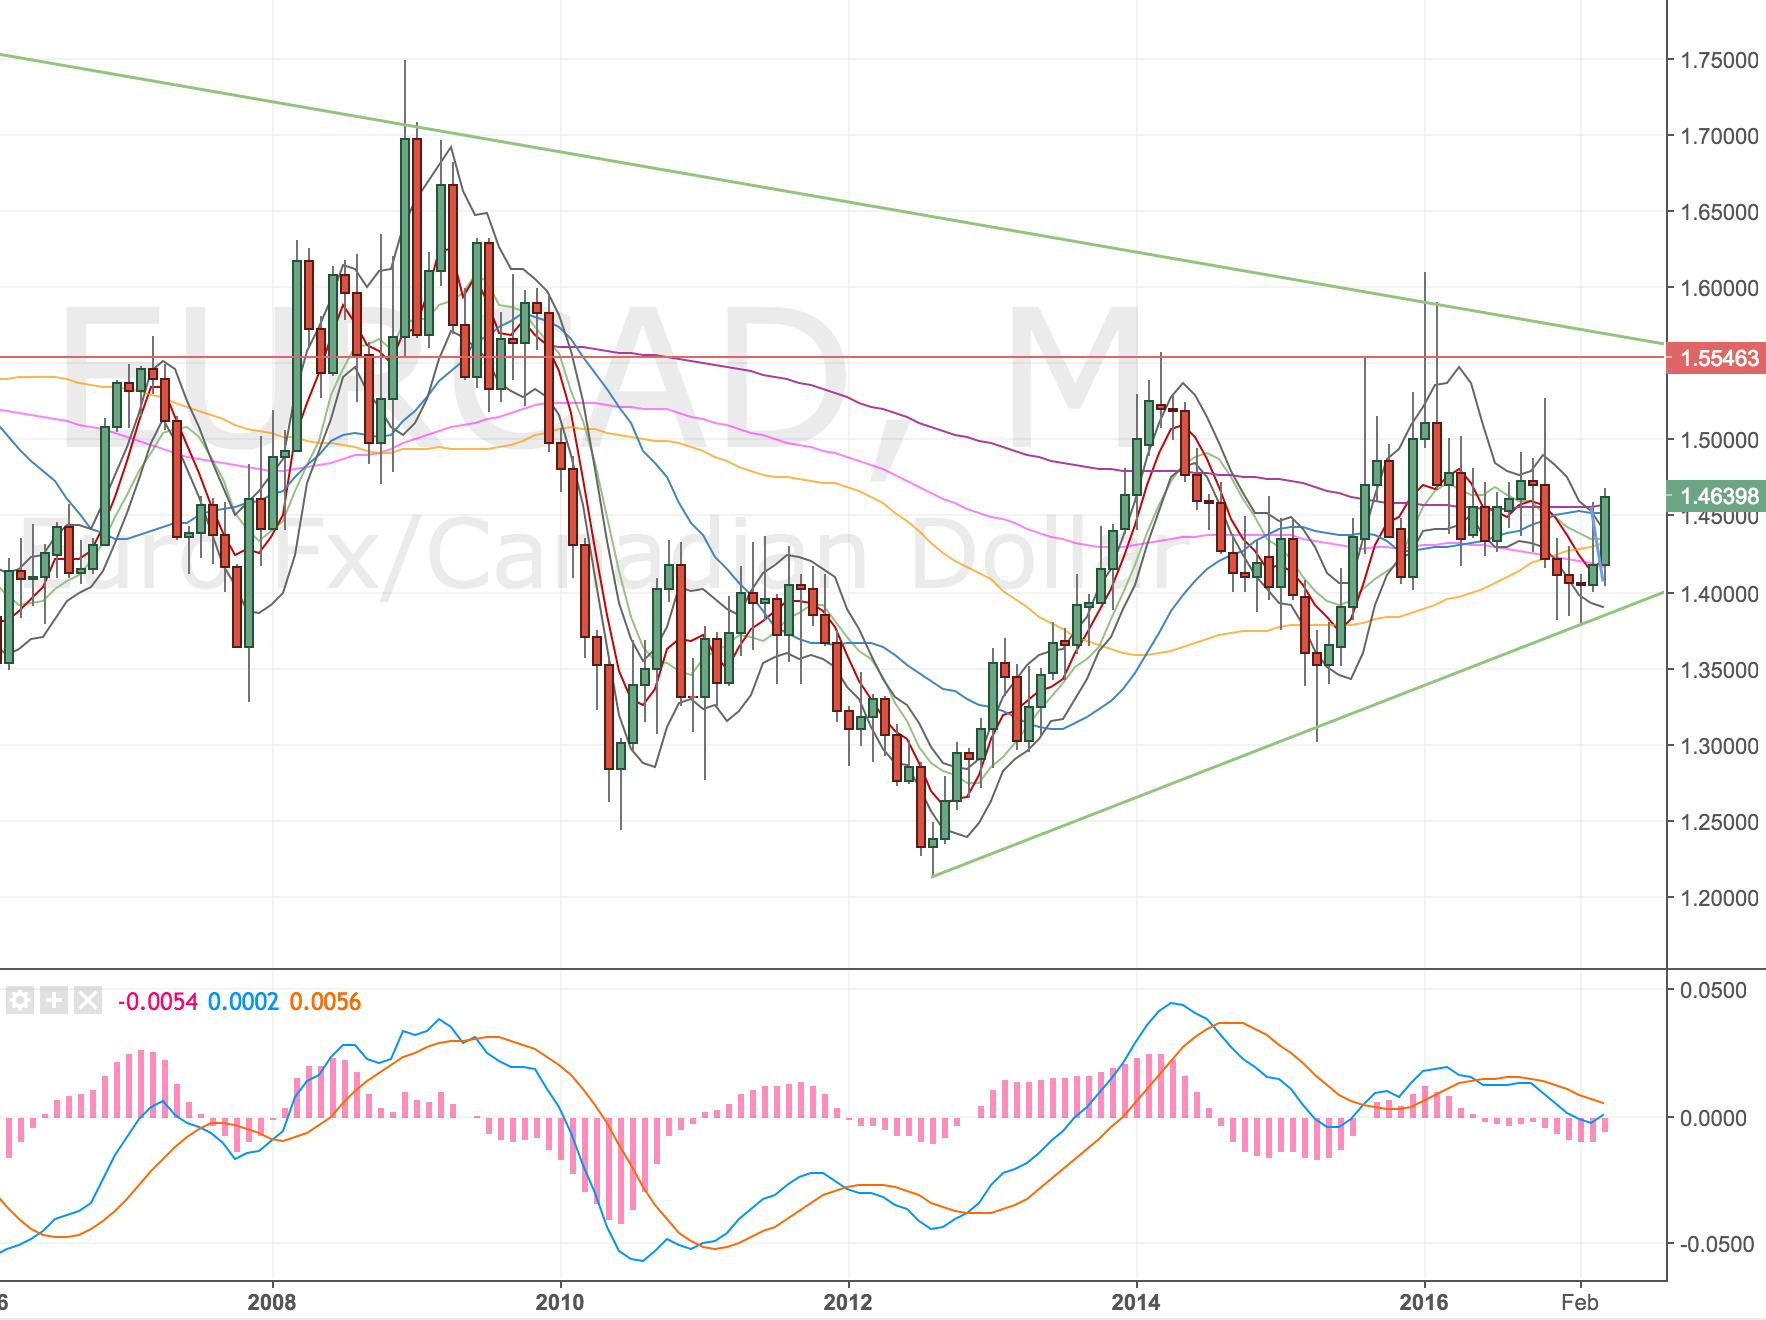
Monthly Chart

EURCAD M Chart – 24 Apr

Into a bit of resistance but price has been chopping around for weeks so nothing to really say here.

One thing I should mention is the price high is different on my ETX broker chart to the chart I scan for set ups on. My stop, risk reward and target are always set on my broker chart.

Updates – Stopped out – 25 Apr 17

So no great surprise, I got stopped out of this trade. Price has moved nicely higher and seems to be setting up another divergence. It’s not nice to sit through so many losers, I seem to have created a psychological maker of £7k which I am constantly chopping around. It has no bearing on my strategy and at times I have to worry whether I am imposing my will on the market so I am trying to stay objective but I can feel the emotions, the doubt, the reluctance to trade at times!

Just got to keep plugging away. Trading so many markets means I will have losing streaks and rich seams. Just got to stay in the game.

EURCAD 4H Chart – 25 Apr

I’m getting a number of charts setting up for a divergence short on the EUR so I’ll take another pop later, I will need to select the best set ups 4 EUR shorts are setting up, I will probably take two of them.

EURUSD DST Short – 20 Apr


Acc Risk: 0.35%
Short: 1.0759
Stop: 1.0782 (23 pips)
Target: 1.0697 (1h500, 62 pips, 2.7 RR)
Mindset: optimistic and impatient

Update 20 Apr – Manually closed for a 40 pip profit 😐

I have to confess a few faults here:

  1. Trading off the hourly timeframe, not in my plan (although I think I should include it!)
  2. Trading mechanically first, then analysing a trade after I’ve put it on
  3. Suffering from FOMO (fear of missing out). I feel a pressure to take every set up so I don’t under trade my system.

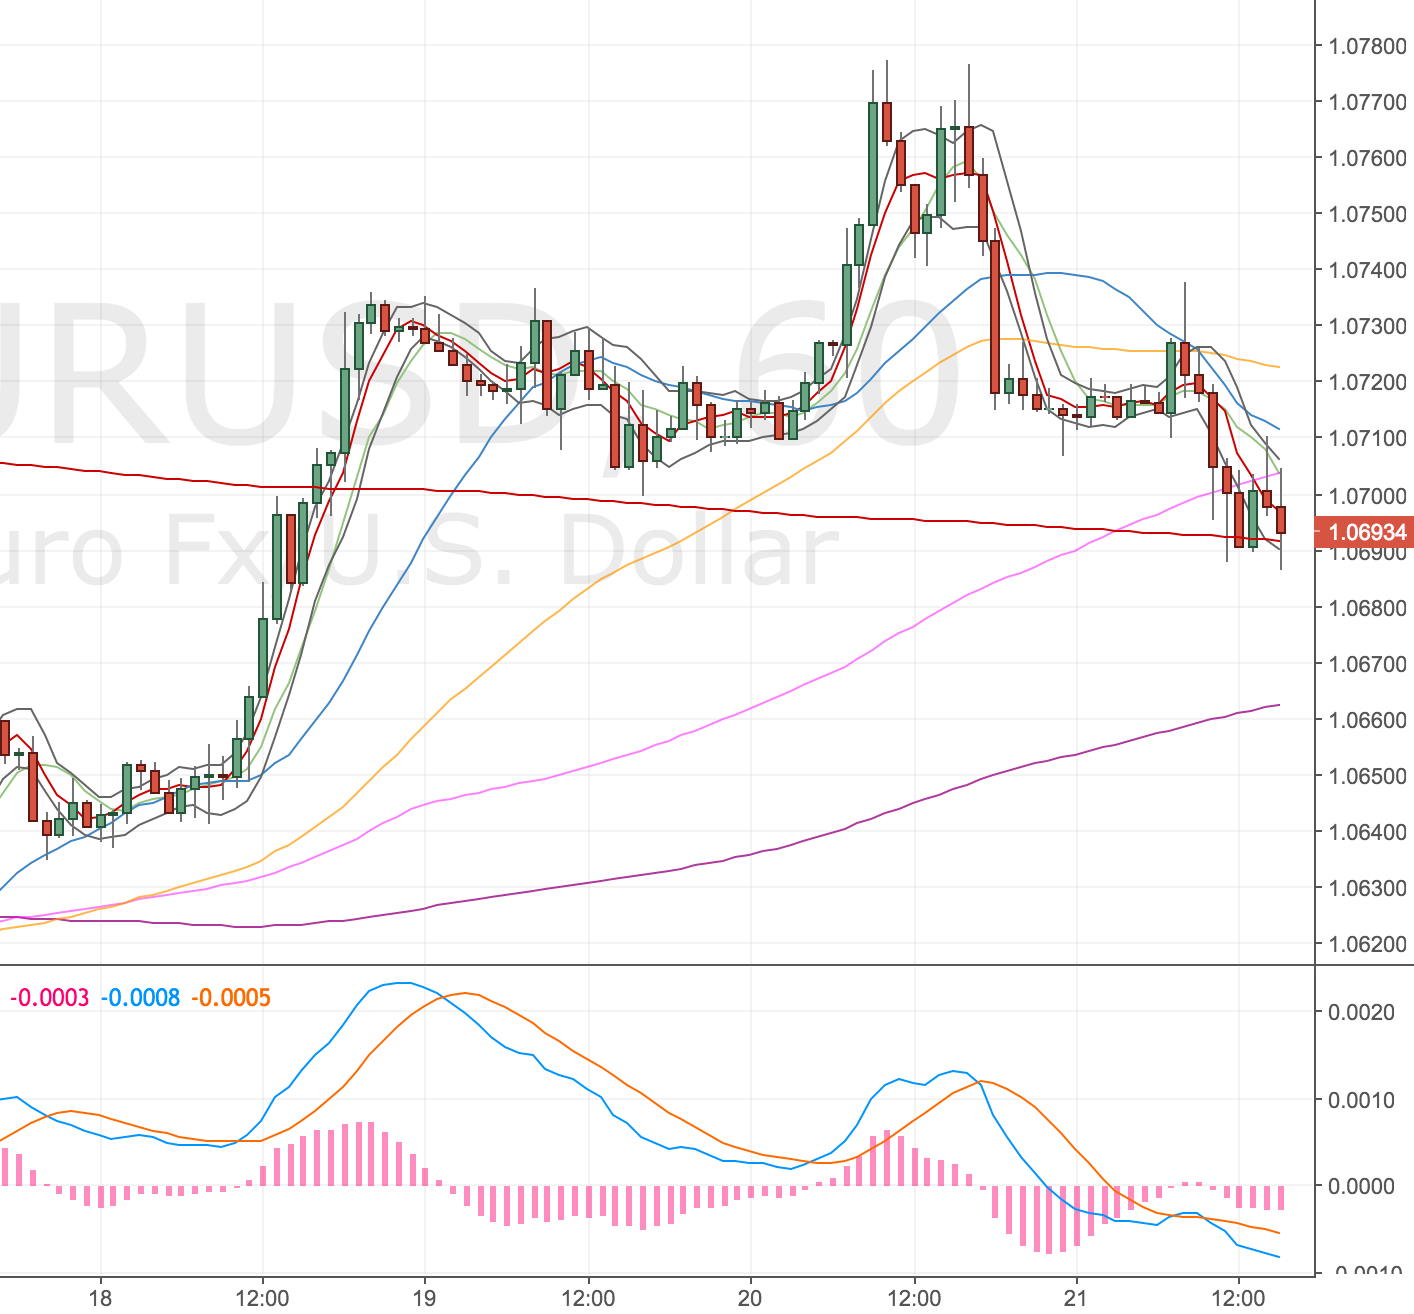
I cover 20 markets and so I’ve usually got a set up forming or tradable. However over Easter I didn’t trade, and it’s been pretty quiet lately, so I haven’t put a trade on for about a week. I have been keen to get back into the market. I was looking at the EURUSD 4H chart and looking for a divergence which didn’t materialise, price was into a weekly trendline resistance, so I went down to the 1H timeframe to see if a divergence had occurred there.

It had, it looked nice, so I didn’t think twice about it.

1H Chart – the setup

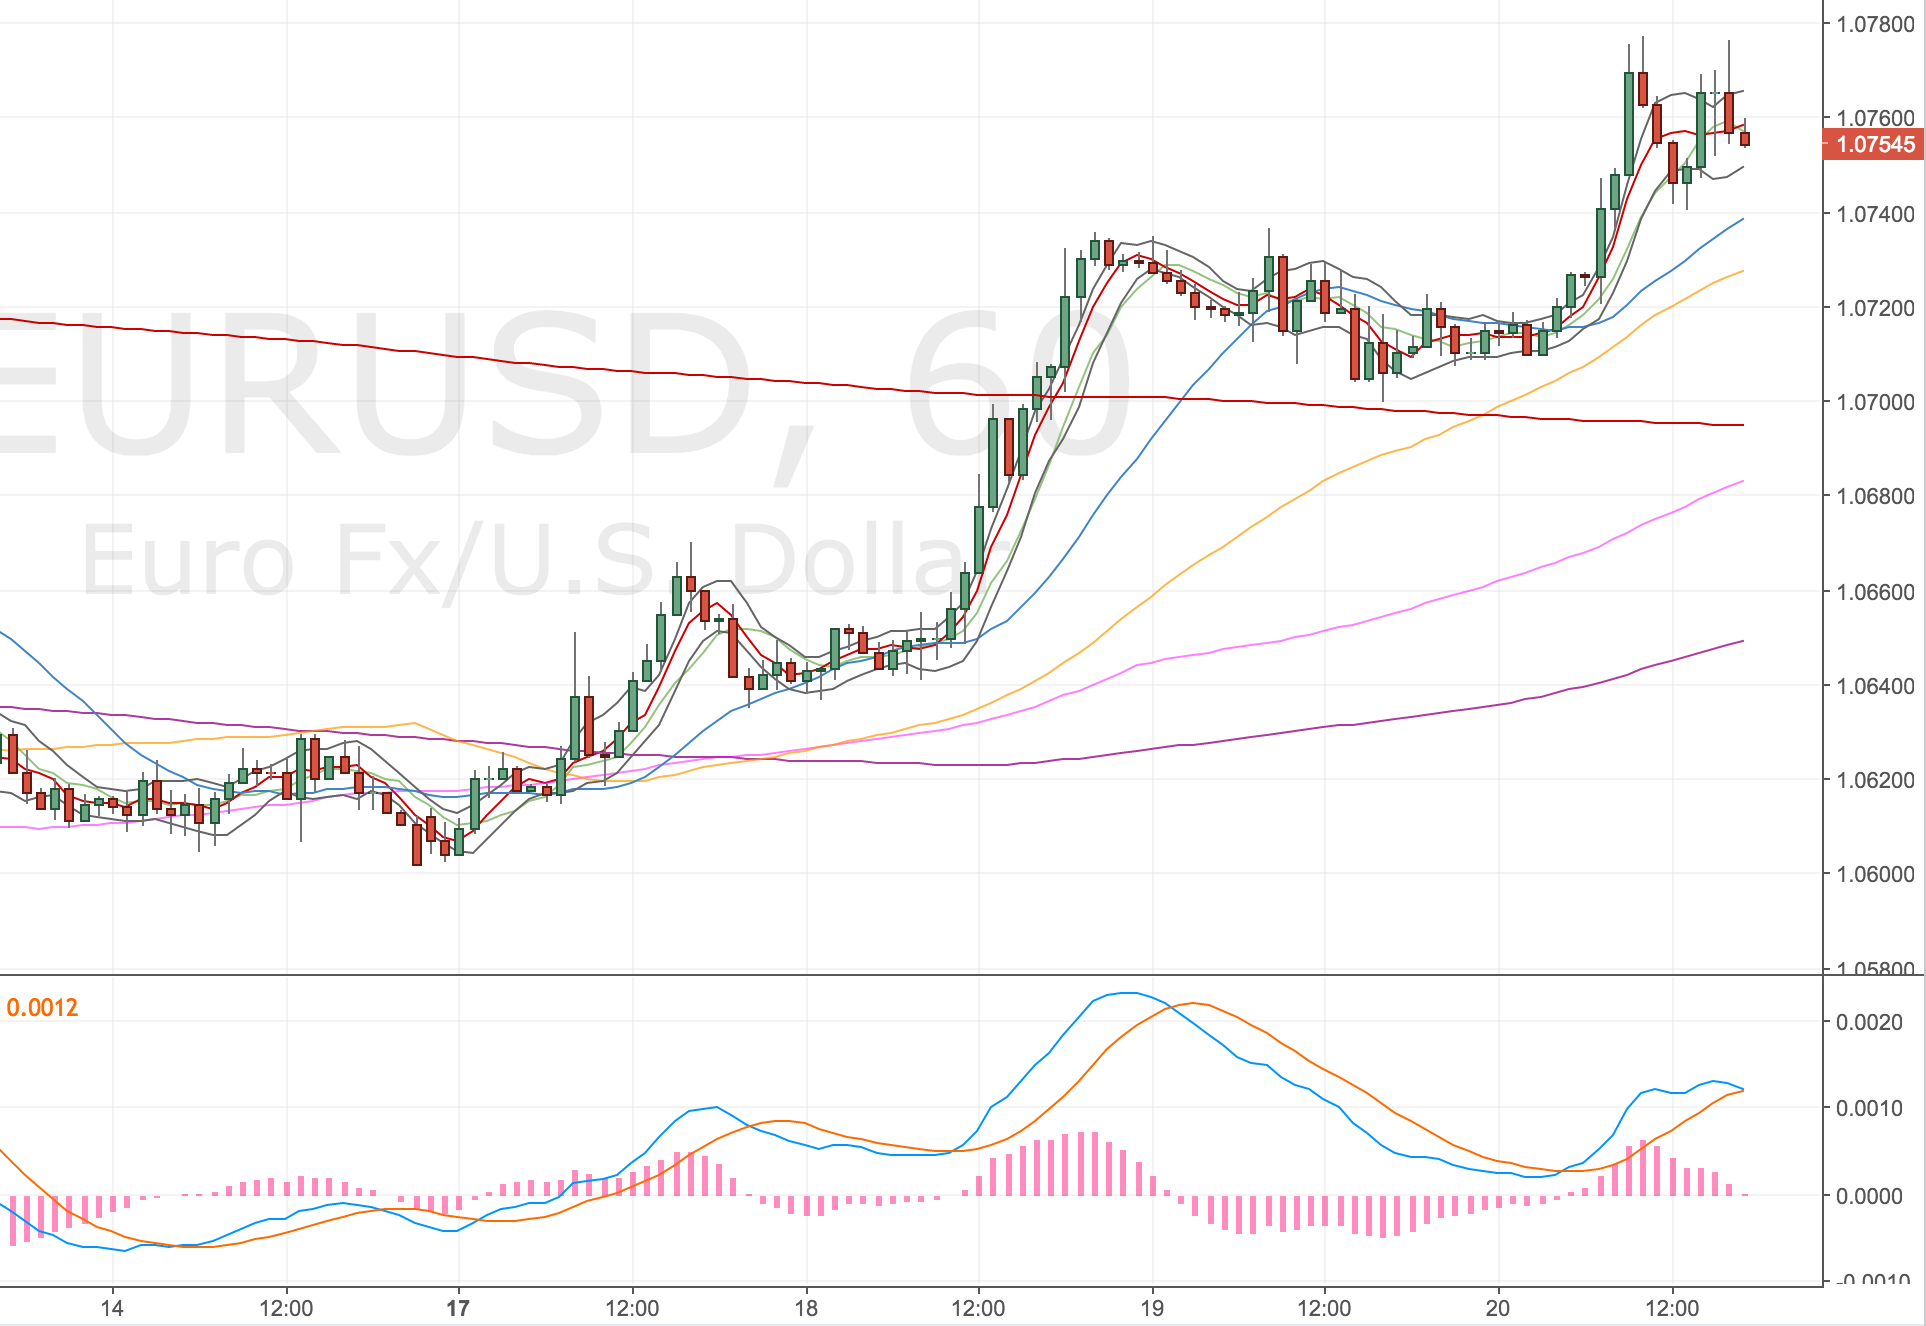
EURUSD 1H Chart – 20 Apr

4H Chart

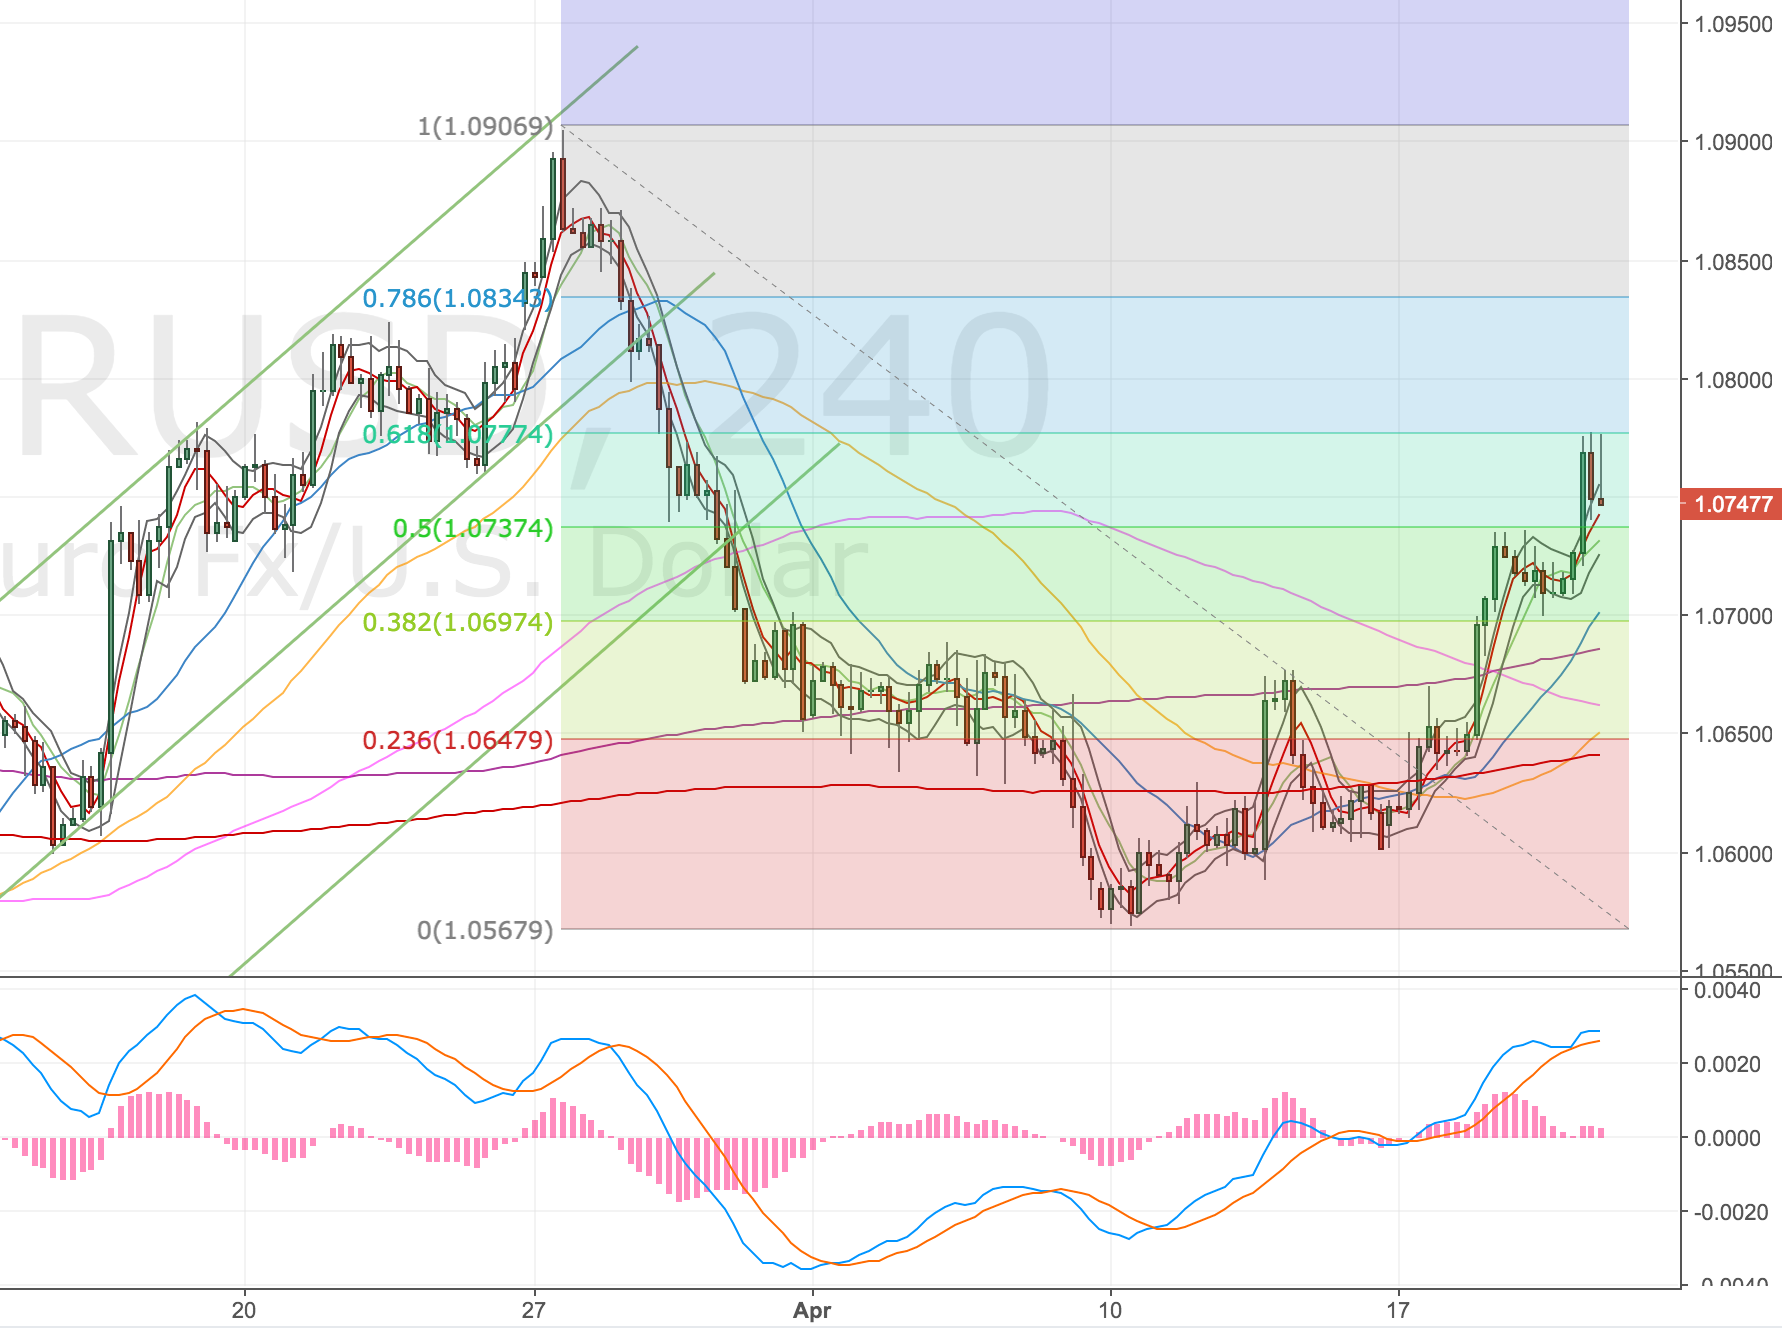
EURUSD 4H Chart – 20 Apr. Not that I would trade from it, but I did note a 61.8% retrace.

Weekly Chart

EURUSD W Chart – 20 Apr

It’s a small position – risk is only 0.35% but I wanted to get back into the market. Not a great reason but I have followed the set up rules, just on a different timeframe.

I have also been thinking recently that it might be short-sighted to stick rigidly to my two timeframes (daily & 4 hourly) when things don’t quite set up like this did, why not check the hourly timeframe for an entry?

One other habit I’ve noticed is seeing a set up, taking it and THEN really checking the charts to see what other factors might be in play. I need to kick that habit into touch! Thinking about it for a second, I would say this is partly because I don’t truly know what I am looking for, I have no other stats to base my analysis on (e.g. 70% of the time when price closes inside the 4h bands, it will touch a particular ma, or x tests of trendline usually lead to a break etc) it’s back to my opinion again, I have no real weighting I can apply to what I am seeing.

I think I need to do some more back testing, although not sure how best to backtest broad analysis like this.

Update 20 Apr – Manually closed for a 40 pip profit 😐

Well I haven’t followed my original plan here. I’ve had a lot of doubt about my target, some targets are very clear to me and don’t get changed, but some are difficult to pick. This is a great example, the set up was on the hourly chart, but I’m always thinking bigger targets – hence my 1h500 target which aligned with the 4h200. However, I only have daily and 4h backtesting stats on the 20, 34, 55 & 100 MAs and the divergence only occurred on the 1h timeframe.

So I decided I was trading on opinion and not my strategy, so I closed the position just below the 1h50 (yellow line) @ 1.0719. Not that it matters/bothers me, but price has since hit the original 1h500 target (red line).

EURUSD 1H Chart – 21 Apr

A few thoughts/questions on this trade:

  1. I haven’t back tested the 1h timeframe, but I found similar results across the daily and 4h timeframes so assumed it would be the same for the hourly (but I never checked / did the work).
  2. Once the trade was on I checked the chart regularly! I didn’t want another loser (had a number of losers going long against the Yen) and I wasn’t confident about my exit. This has to be a sign I’m not comfortable with the trade. In future is it best to just close the trade if I find myself in this situation again?
  3. I think I did the right thing in retrospect – exiting at the 1h50 – my original target was baseless and I still earnt an okay RR

Some things here to cover with Charlie.

CADJPY DST Long 05 Apr – 14 Apr 17


Acc Risk: 0.35%
Long: 1x 82.33
Stop: 81.90 (43 pips)
Target: 83.69 (4h100, 136 pips, 3.16 RR)
Mindset: Positive

Price hit target – 10 Apr
Going long again – 12 Apr
Stopped out – 13 Apr

A questionable trade here 🙂 another one! Price has diverged off and although I missed the initial entry, I placed an order to get long in case we had any retracements back down to the prior low. Again, was being rushed and didn’t get a chance to get a screenshot! I’m quite glad it’s Easter this weekend, I’m knackered and could do with a break. Don’t get me wrong, I love the markets, but it doesn’t feel good to be trading when I’m sneaking time here and there. The discipline to check the markets regularly has been my biggest shortcoming.

As I was looking for the 4h100 I didn’t cancel the order when price hit the 4h50. Not sure if this was sensible.

Order got triggered overnight. I’m happy with it.

Price hit target – 10 Apr

Price has hit my target! I tracked the limit order down fairly reliably. Updating my order morning and evening.

Final exit price was 83.19 (86 pips) 2x RR

Going long again – 12 Apr


Acc Risk: 0.5%
Long: 2x 82.25
Stop: 81.97 (28 pips)
Target 1: 82.95 (4h100, 70 pips, 2.5 RR)
Target 2: 83.97 (4h200, 172 pips, 6.14 RR)
Mindset: Dubious. All my other attempts to go long against the JPY have been killed. I expect this to rollover.

Price has the 4h100 and made another (marginal) divergence. Why do I always trade it when it’s marginal! Here’s the chart, you can see my previous trade from the recent low into the 4h100.

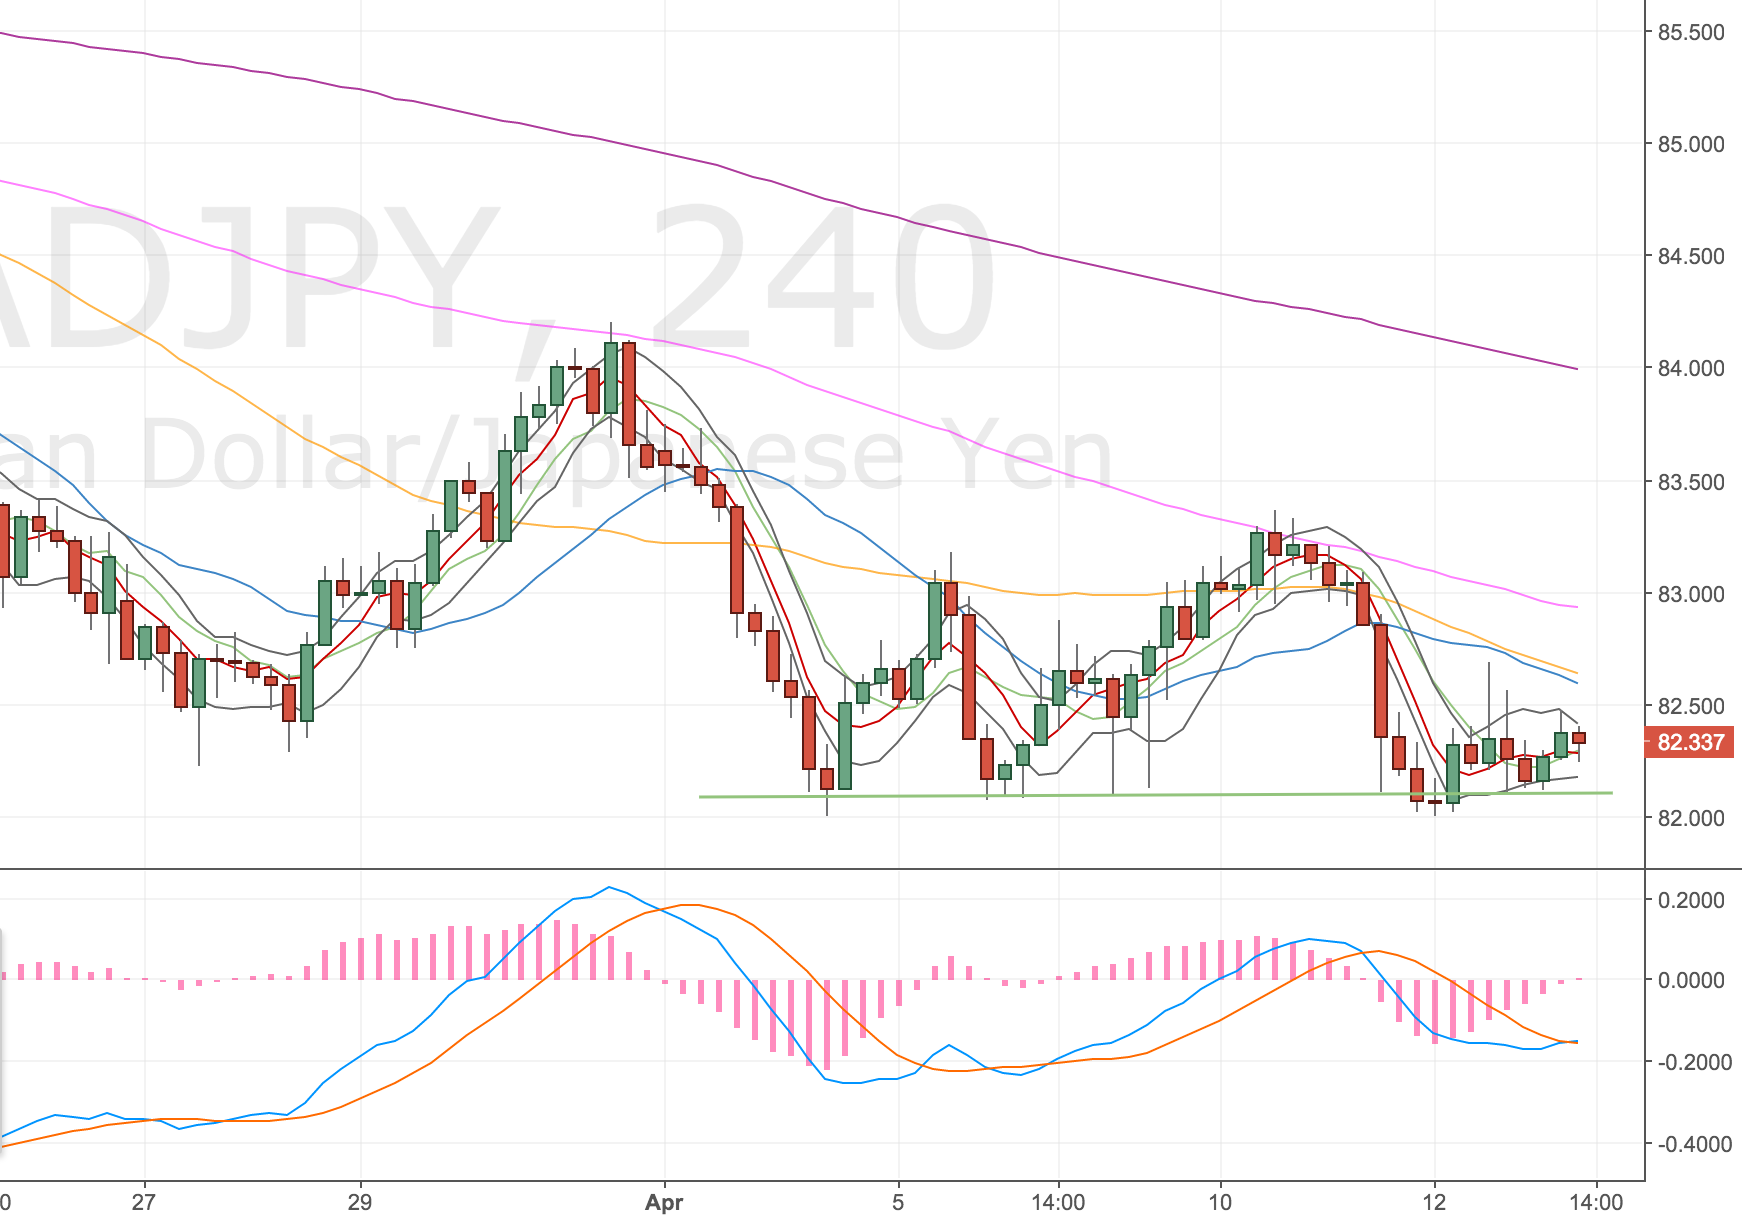
CADJPY 4H Chart – 13 Apr

I quite like this trade, there’s a lot of correlation on the higher timeframes and as I have no other correlated trades on, or planned, I’ve upped my risk.

Daily Chart

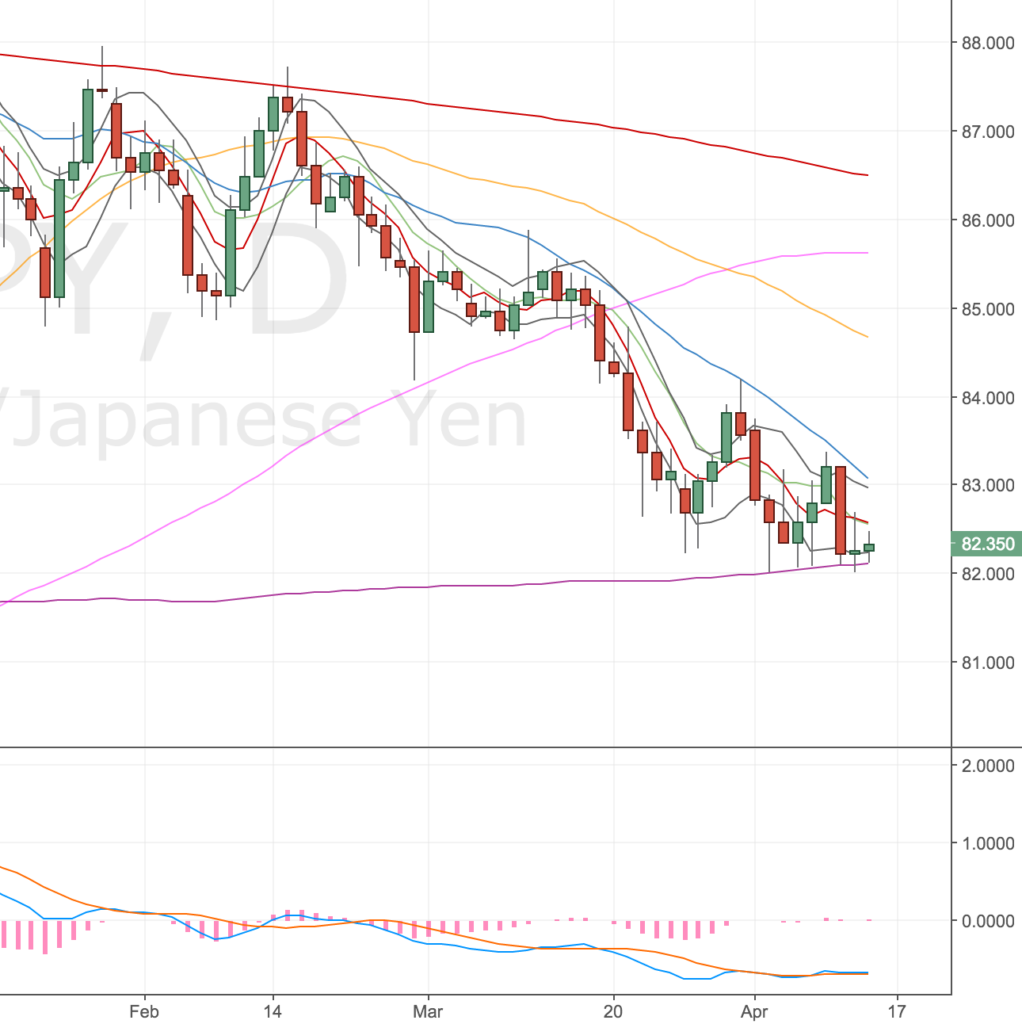
CADJPY Daily Chart – 13 Apr

Price has run into the d200. The MACD is flat but you could argue a divergence (I think Charlie would say not)

Weekly Chart

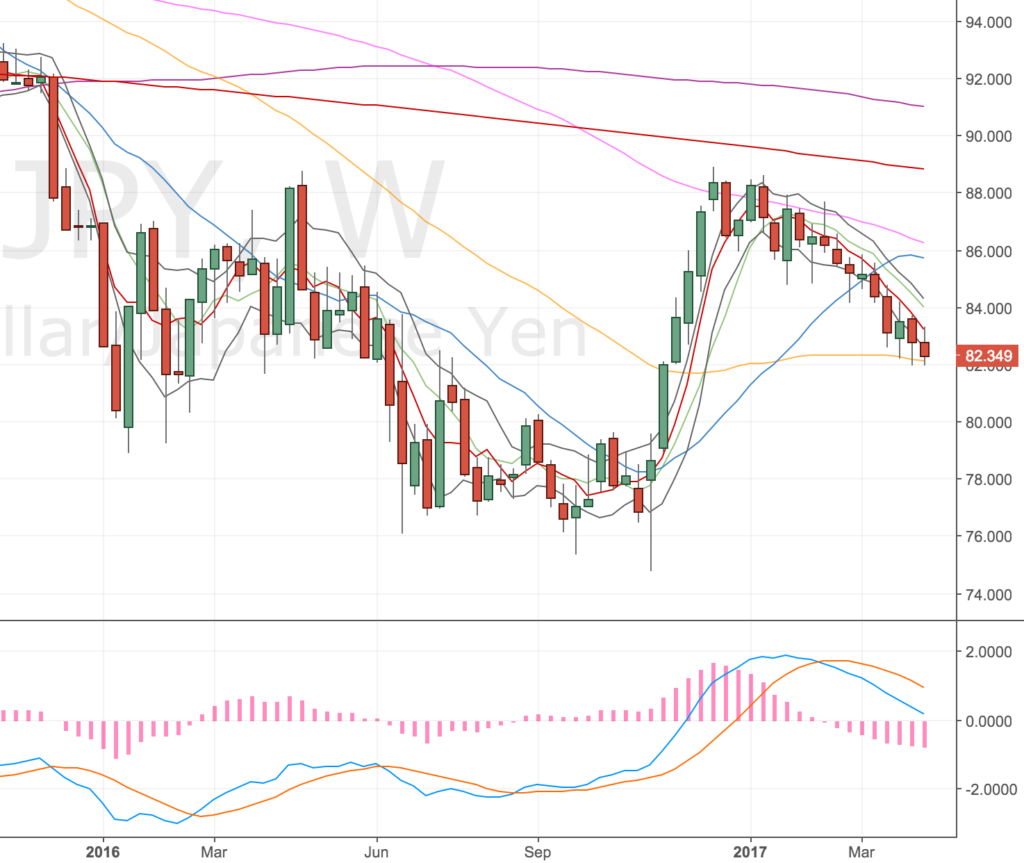
CADJPY Weekly Chart – 13 Apr

Price has also found support on the w50.

I need to be careful with this trade though – this could be handrailing of the d200 (like Gold was) before we continue the trend lower. If the JPY is the risk off trade right now, with equities and the dollar falling (CAD is loosely linked to the USD) – this could easily go pear-shaped.

I have a number of long set ups against the dollar – only this previous CADJPY trade has worked out though. My AUDJPY and EURJPY longs have failed a number of times.

Stopped out – 13 Apr

Ugh – this happened right at the end of the day Friday. Great end to a not so hot week. I’ve wiped out all of my earlier gains and some. So trading side-ways again! I hate it – it’s so frustrating. However I have to remember, that my edge is in the system so my focus must be on my process and not the outcome of any one trade.

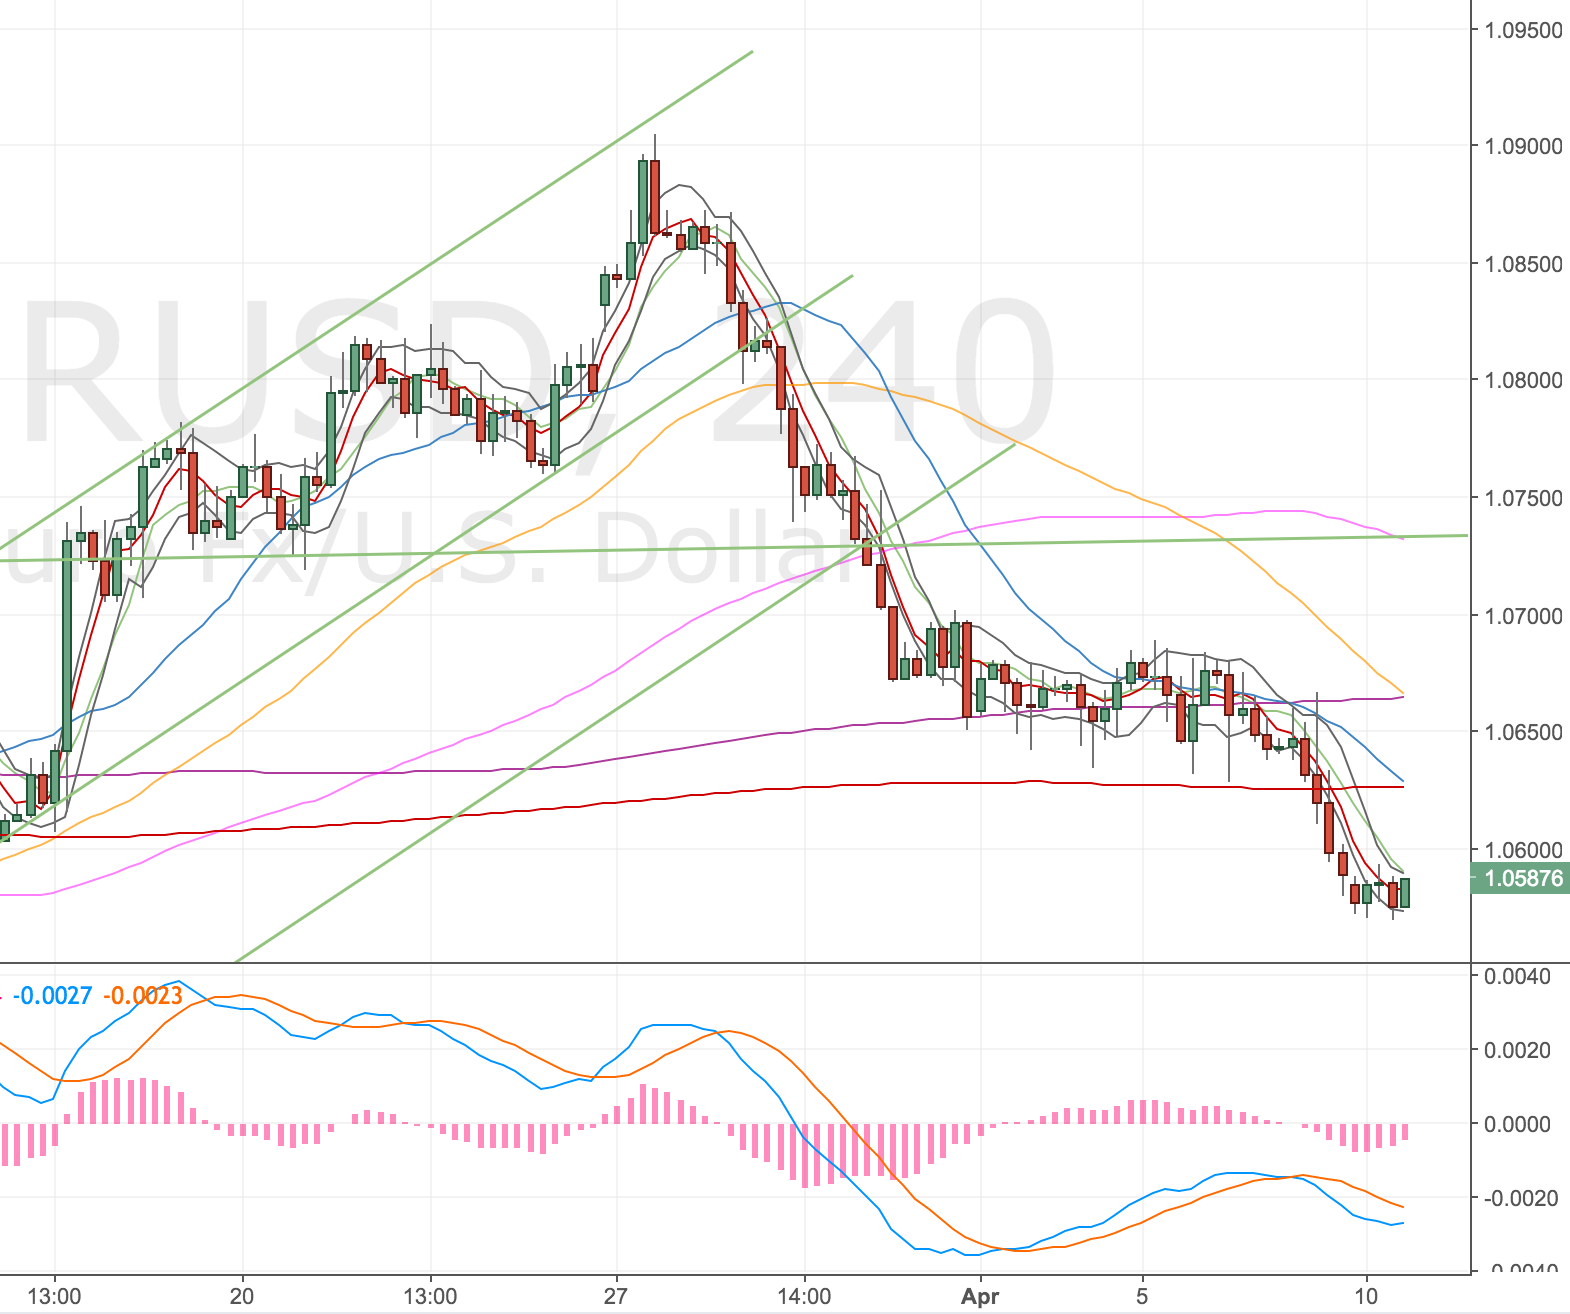
What’s been so frustrating about all these JPY trades is the how they have all failed together (not unexpected really) but have since (20 Apr – I’m writing this late!) reversed as expected but without a set up for me to trade. I’ve just taken a short EURUSD from the hourly timeframe and I just wonder whether I could’ve seen these divergences not truly forming, so gone to a lower timeframe to get long!?

Just a thought – one to discuss with Charlie.

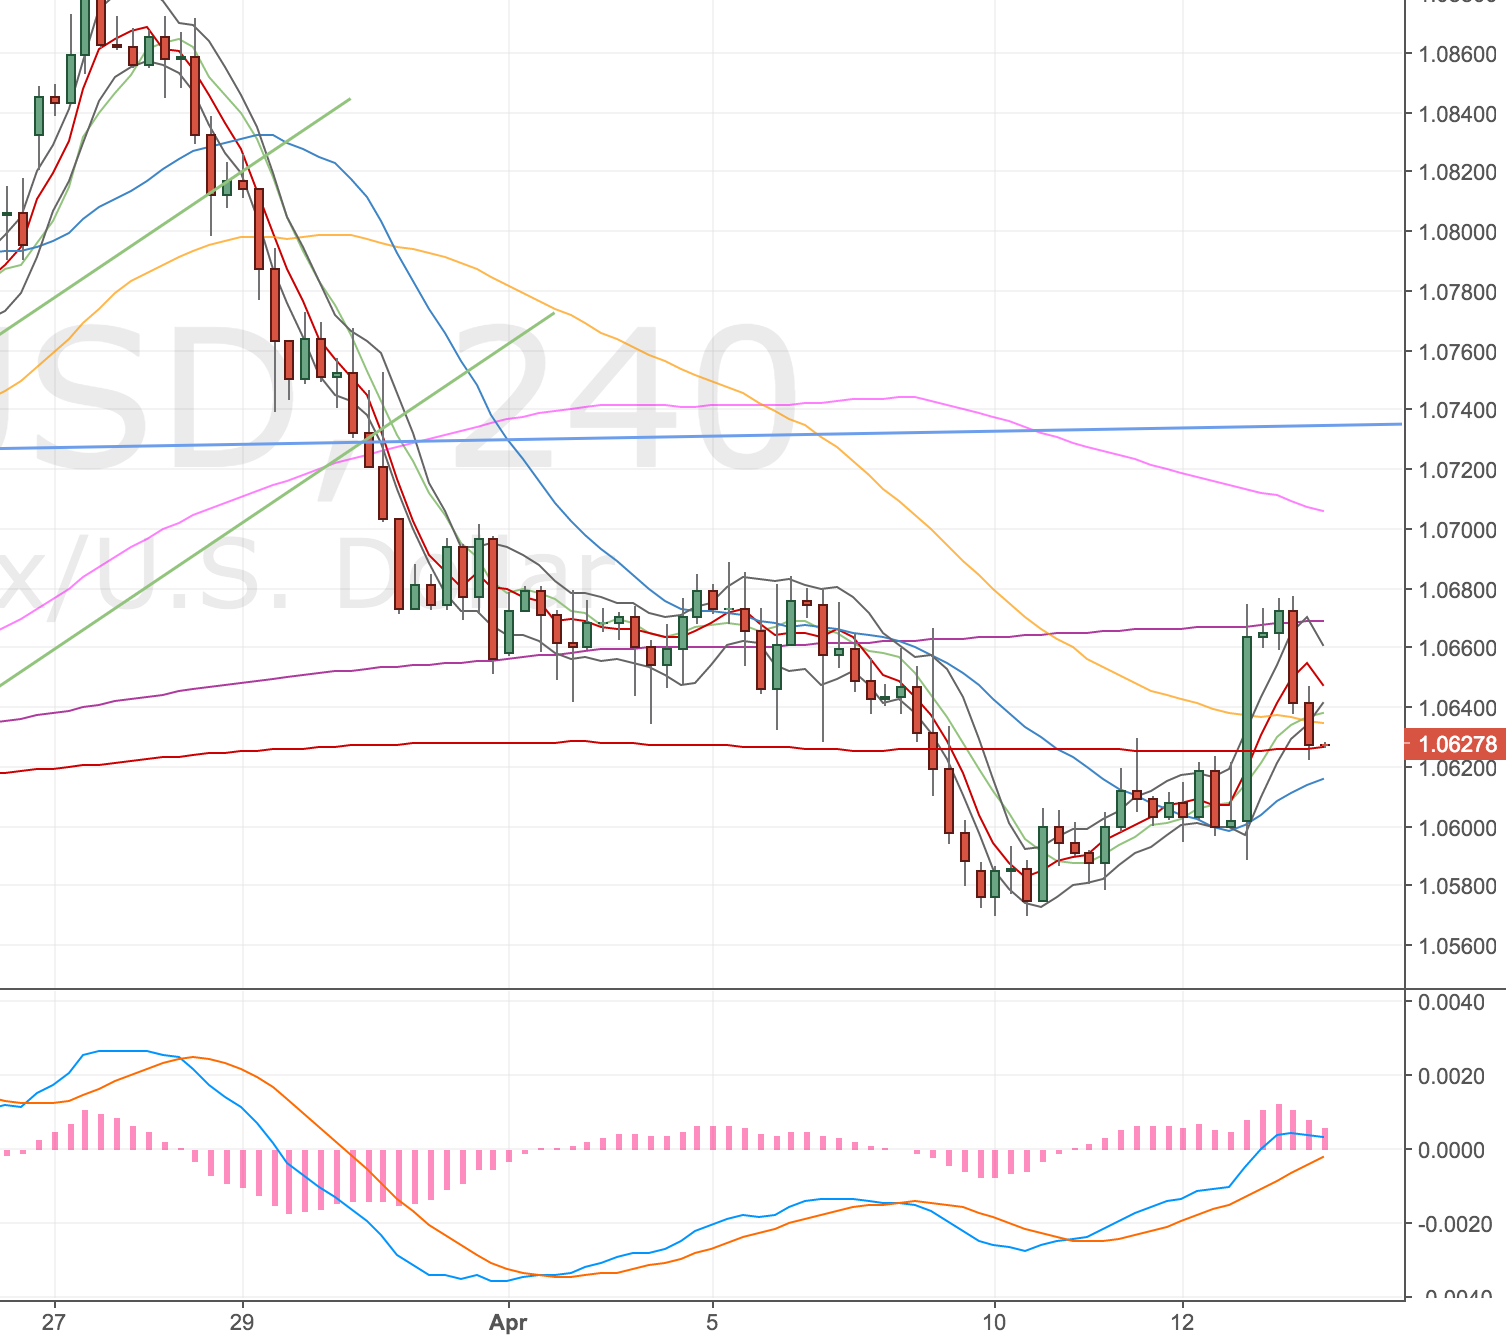
EURUSD DST Long – 10 Apr 17


Acc Risk: 0.4%
Long: 1.0585
Stop: 1.0563 (22 pips)
Target: 1.0660 (4h50, 75 pips, 3.4 RR)
Mindset: Erm – not enjoying going long the Euro.

Price has been trending down for a while now on the EURUSD and might be bottoming out. I don’t feel great about this trade we look to have cleared the 4h500 nicely and I don’t really see any reason for a move higher. On the daily chart we’ve retraced to the 78.6% fib level. That’s about it. Anyway – we’ve formed a divergence so I’m going in!

EURUSD 4H Chart – 10 Apr 17

And what a nice divergence it is! Lovely and looping. Not the best price I could get, but not terrible.

Target hit – 12 Apr

The North Korea problem. Seems that Trump might be starting to spread himself a little thin. Got a lot of enemies to go after!

Trumps at it again, just happened to be on the right side of this! Apparently he did an interview with WSJ saying two things:

  • The dollar is over-valued
  • He’s after North Korea to stop their nuclear programme

The dollar dropped, Gold rallied, Euro rallied, etc. My target got hit. It’s all gravy. I have to say was not feeling good about this trade so feel lucky to be out of this.

I think I always say that, feel lucky, like I’m totally winging it!

EURUSD 4H Chart – 13 Apr. Nice divergence!

My order was triggered at 1.0633 for 48 pips, 2.1 RR.

EURCAD DST Long – 12 Apr, 13 Apr, …


Acc Risk: 0.5%
Long: 1.4110 (as a market order)
Stop: 1.4084 (26 pips)
Target: 1.4240 (4h50, 156 pips, 6 RR)
Mindset: Pretty ambivalent

Updates

Order filled then stopped out – 12 Apr
Going in again – 13 Apr
Stopped out again – 13 Apr

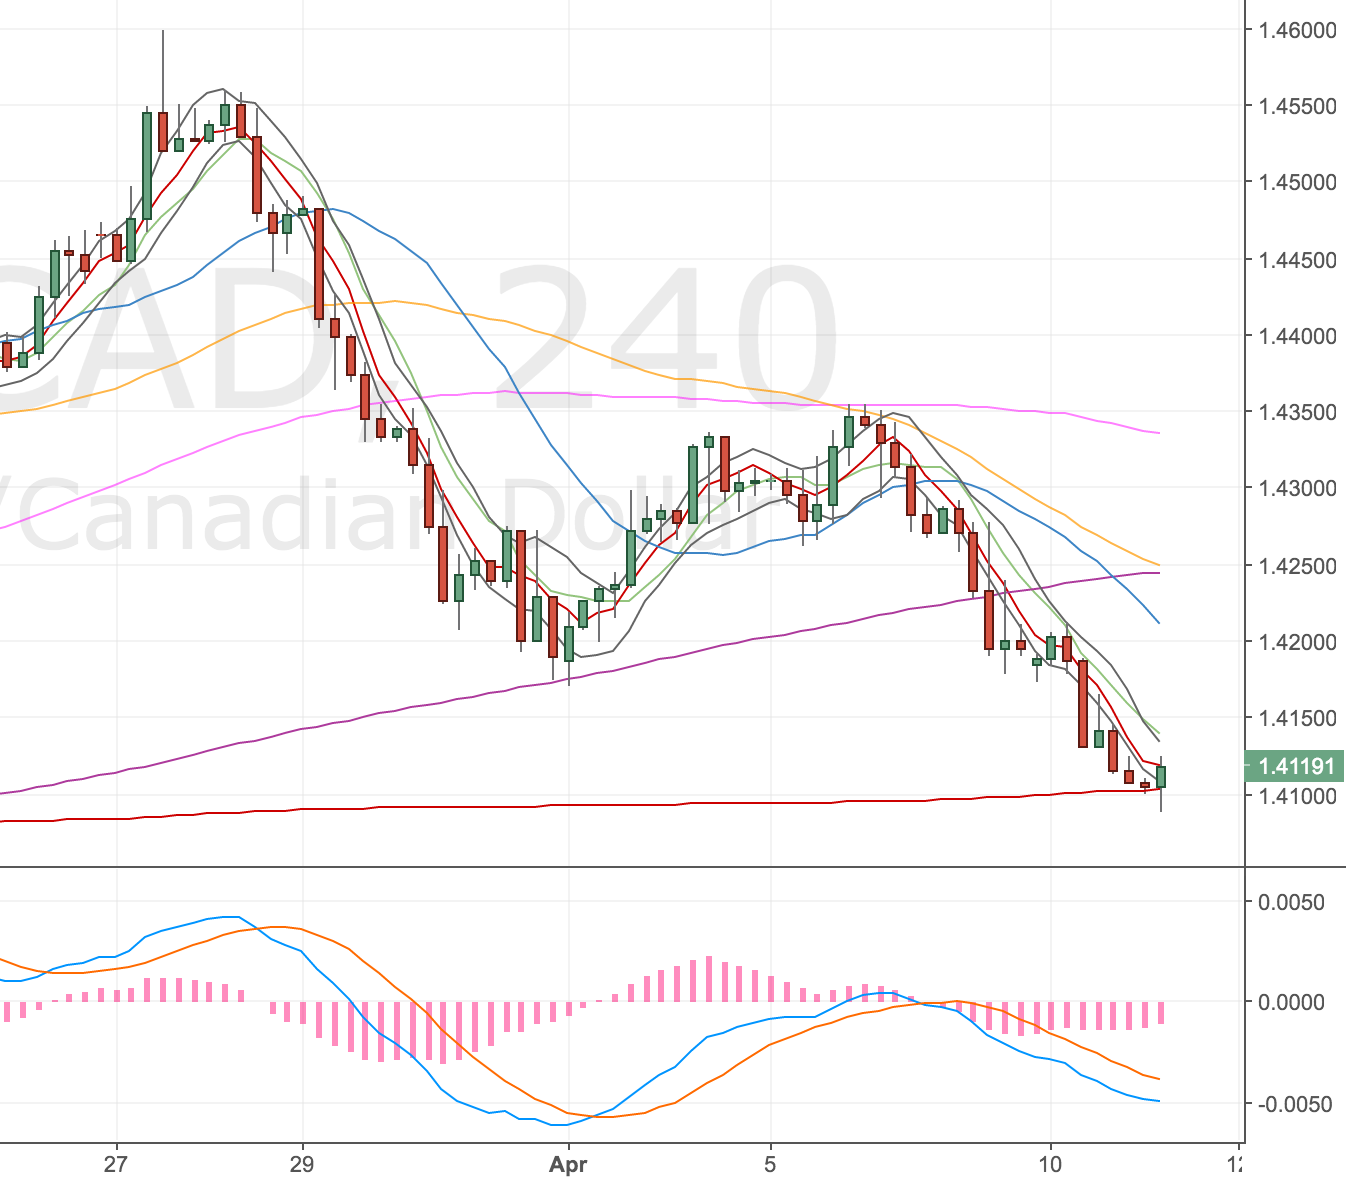
Got a set up on the EURCAD chart that I like the look of. There’s correlations on other timeframes and other long set ups against the JPY (not had a lot of success against the JPY though!)

Here’s the set up

4H Chart – set up

EURCAD 4H Chart – 11 Apr

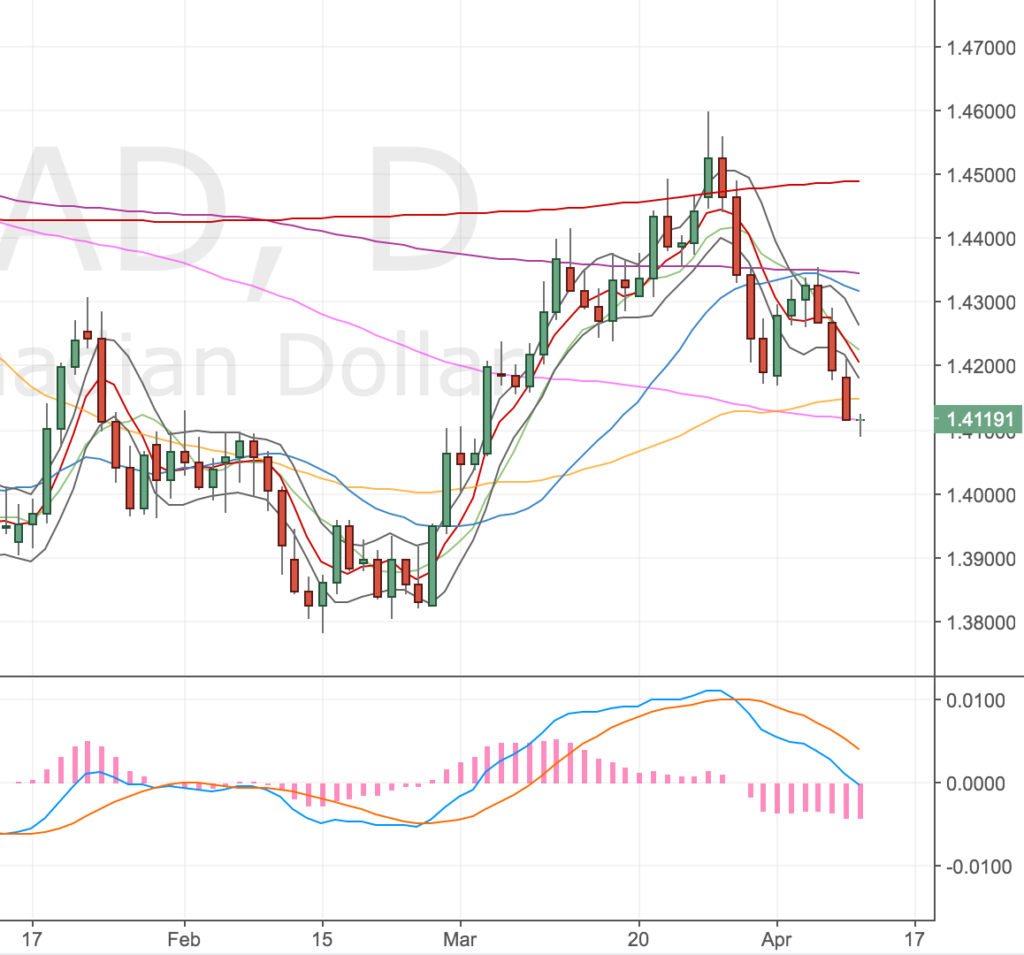
Daily Chart

Also into resistance on the d50 & d100.

EURCAD Daily Chart – 13 Apr

Order filled then stopped out – 12 Apr

Order got filled and pretty quickly stopped me out! I got filled on a bar down and then spike low took me out. Depending on how this bar closes, it could indicate some tasty upside, I’d be looking for a hammer to form inside the bands. Will keep an eye on it.

Going in again – 13 Apr


Acc Risk: 0.5%
Long: 1.4120 (as a market order)
Stop: 1.4084 (36 pips)
Target: 1.4224 (4h50, 104 pips, 2.88 RR)
Mindset: Pretty ambivalent

I spotted this set up last night whilst updating/breaking from my house plans for the door frame sizes! (Not a great situation for trading, I know). Price did a kind of hammer but didn’t close inside the bands, however the subsequent bar has closed inside the bands. The stop is slightly wider so the position size is smaller.

EURCAD 4H Chart – 12 Apr (end of day)

The spread was 10 pips on this market! Pretty wide compared to the EURUSD. Hopefully the order will get triggered and we’ll be in a winning trade.

Stopped out again – 13 Apr

My order got triggered over night and again got stopped shortly after, this morning. Shame will keep my eye on the market, looks like price might be setting up long again for a double divergence. If it does I still think I’ll stick to the 4h50 (despite the double divergence) as the 4h50 hasn’t been tested in a while.

EURCAD 4H Chart – 13 Apr 17

XAUUSD & EURUSD Short 27 Mar – 13 Apr 17


Total Acc Risk: 0.5% => 1.1%

EURUSD
Acc Risk: 0.2% => 0.5%
Entry: 1x 1.0864, 2x 1.08750 (market order)
Stop: 3x 1.0915 (51 pips)
Target 1: 2x 1.0787 (4h50, 77 pips 1.5 RR)
Target 2: 1x 1.0690 (4h100 & d20, 174 pips, 3.4 RR)

XAUUSD
Acc Risk: 0.3% => 0.6%
Entry: 2x 1253.8, 2x 1258.0 (market order)
Stop: 1263.3 (Avg. 77 pips)
Target: 4x 1241 (4h50, 128 pips, 1.35 RR)

Updates

XAUUSD order triggered, now in the full trade – 28 Mar
Cancelled the remaining EURUSD Order – 29 Mar
closed some positions – 30 Mar
have added to my gold position – 5 Apr
NFP tomorrow, feeling ominous – 6 Apr
Stopped out – 7 Apr
Still tracking Gold – 11 Apr
Gold heading higher – 13 Apr

This is a more complex trade for me. I have a few xyzUSD pair shorts either setting up or currently diverging. So I’ve split my exposure to the USD across the best looking set ups (EURUSD and XAUUSD). I feel uneasy about these two trades, I feel obliged to take them as my scan shows so many correlations right now.

The problem I’m struggling with; I can’t seem to get a run of winning trades going and it feels like I am beginning to hemorrhage money. I’m desperate to close my reasonable profits on my GBPJPY long, it’s close to target, but that just isn’t disciplined.

I have to remind myself that I am taking these two trades because my monthly reviews show when I pass on divergences, I will usually regret it in hindsight. However, the long USD trade seems so obvious to me right now.

Of those set ups I have chosen XAUUSD and EURUSD to go short on, primarily because the charts seem to have the cleanest set ups (i.e. touching long term MAs and diverging on the 4H and almost on the Daily timeframes – sort of 🙂 !).

Here are the set ups.

Gold Daily & 4H Charts
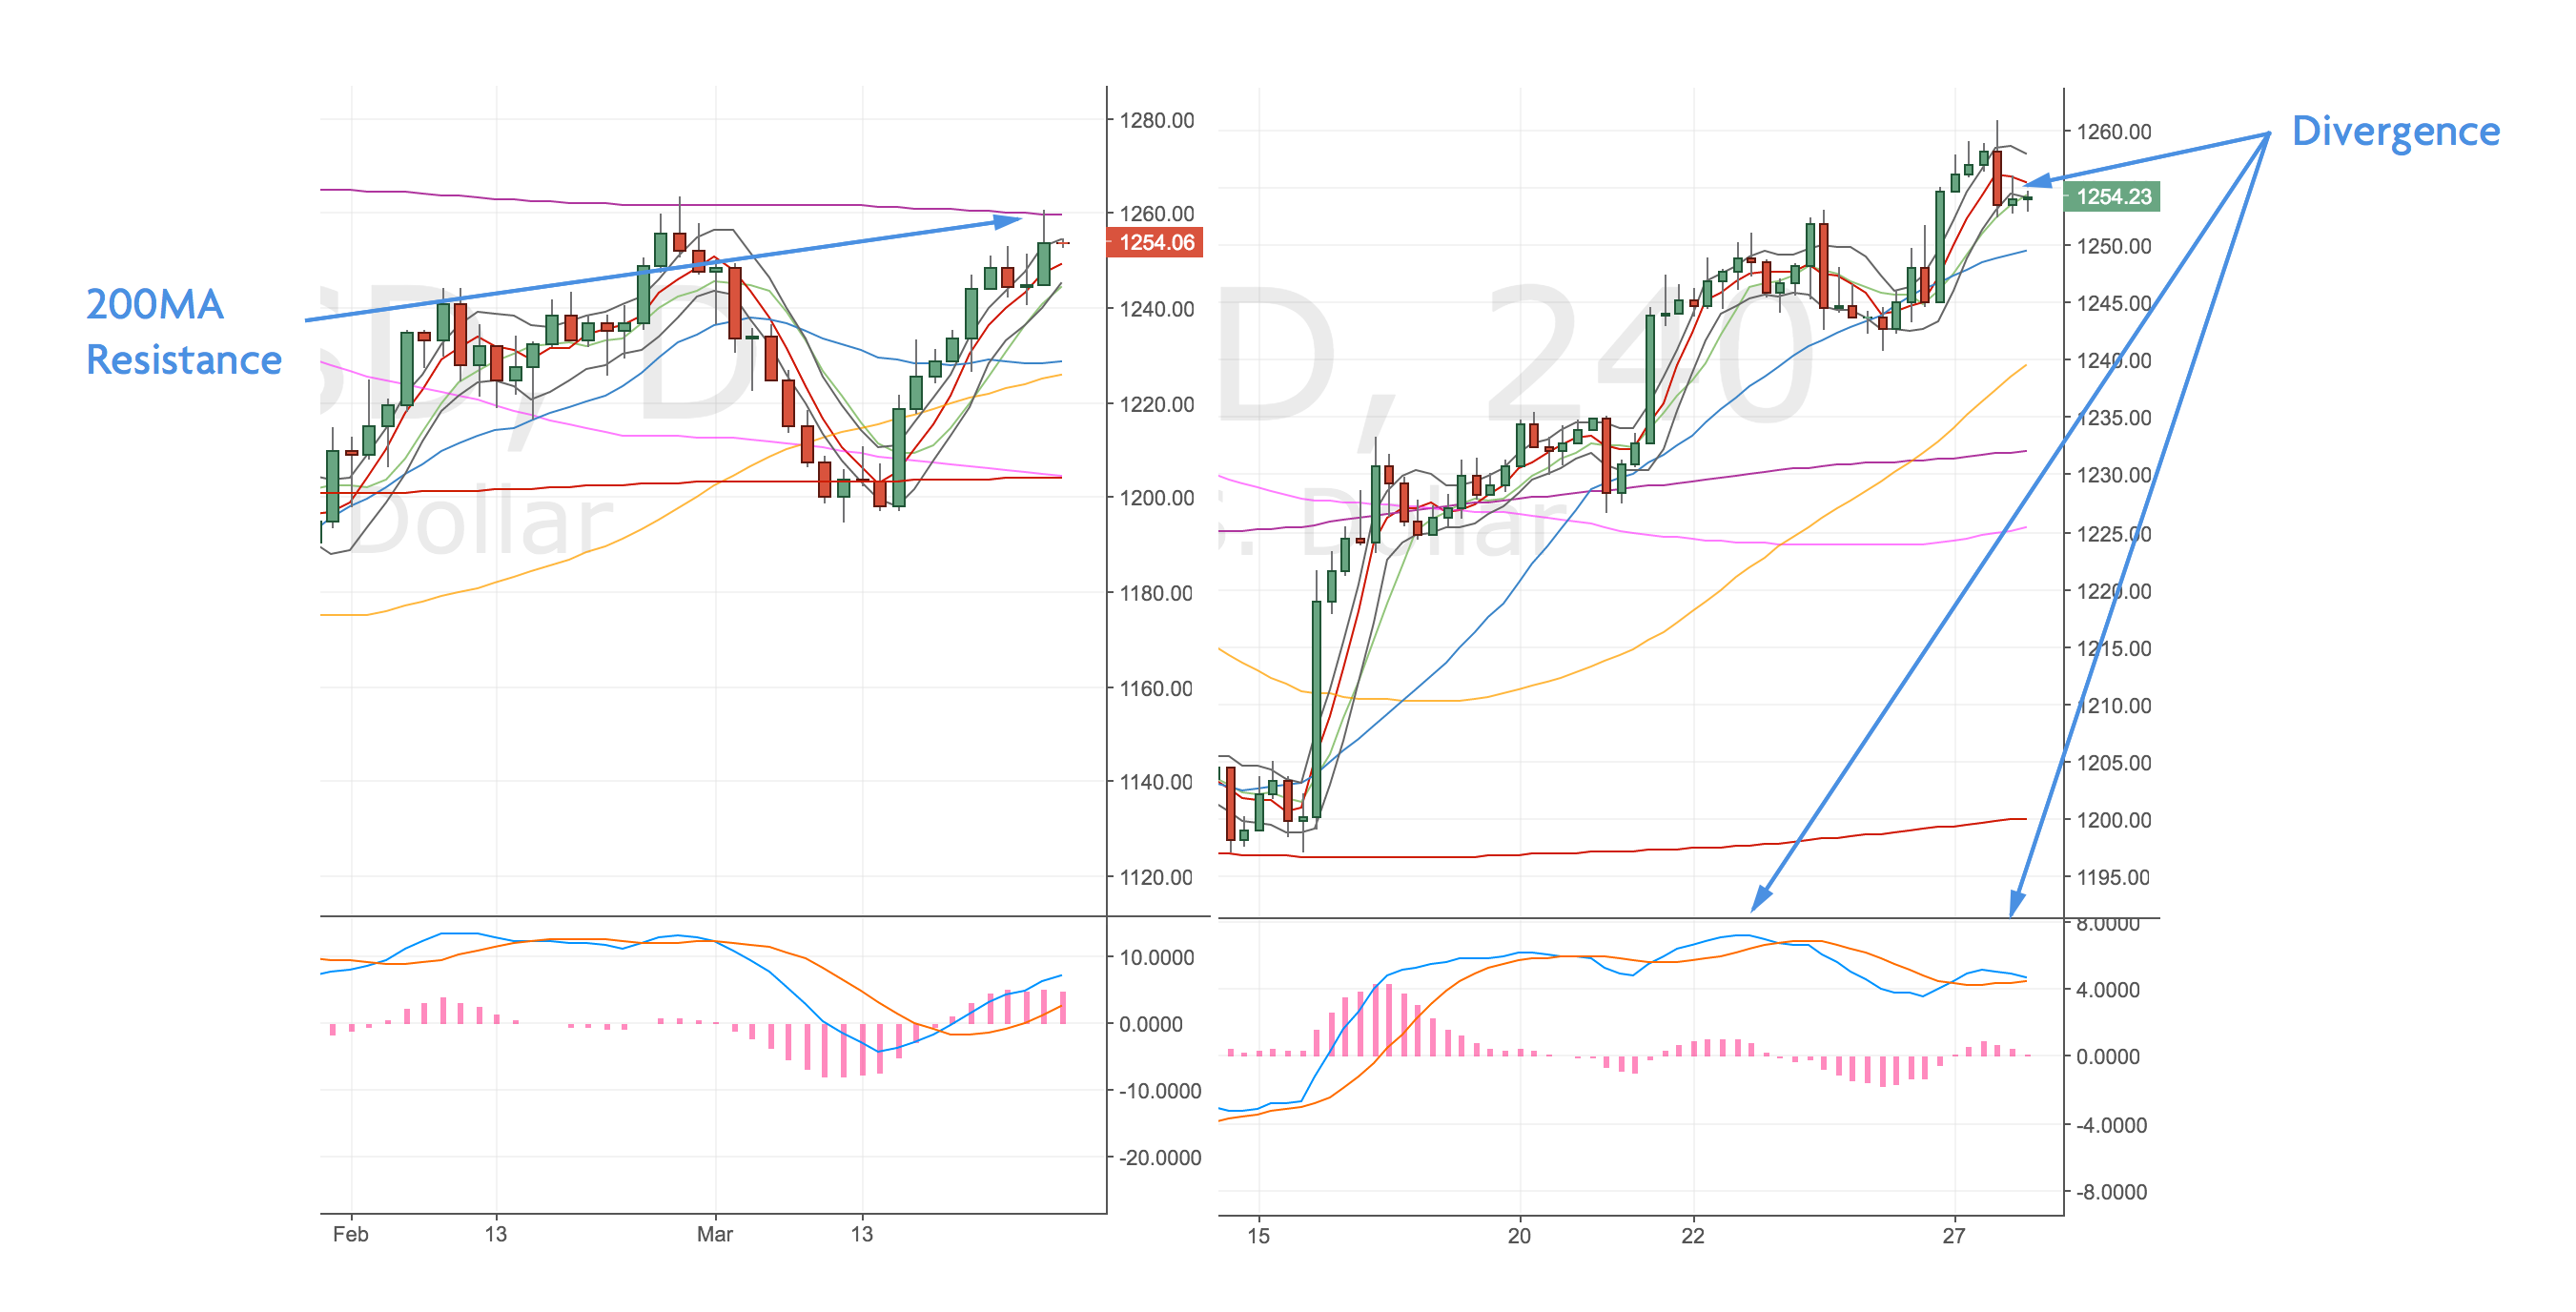
Gold Daily & 4H Chart – 27 Mar

The 4H divergence is pretty clear, the daily one isn’t but I’ve mentioned this before in my monthly trade reviews – it seems as though MAs distort some of the divergences either pulling or pushing price so the signal doesn’t set up.

Regardless, I am trading this on the 4H divergence – aiming for the 50MA. It’s a pretty crap RR when you consider the 50MA will be moving higher, but still in my favour for now.

EURUSD Daily & 4H Charts
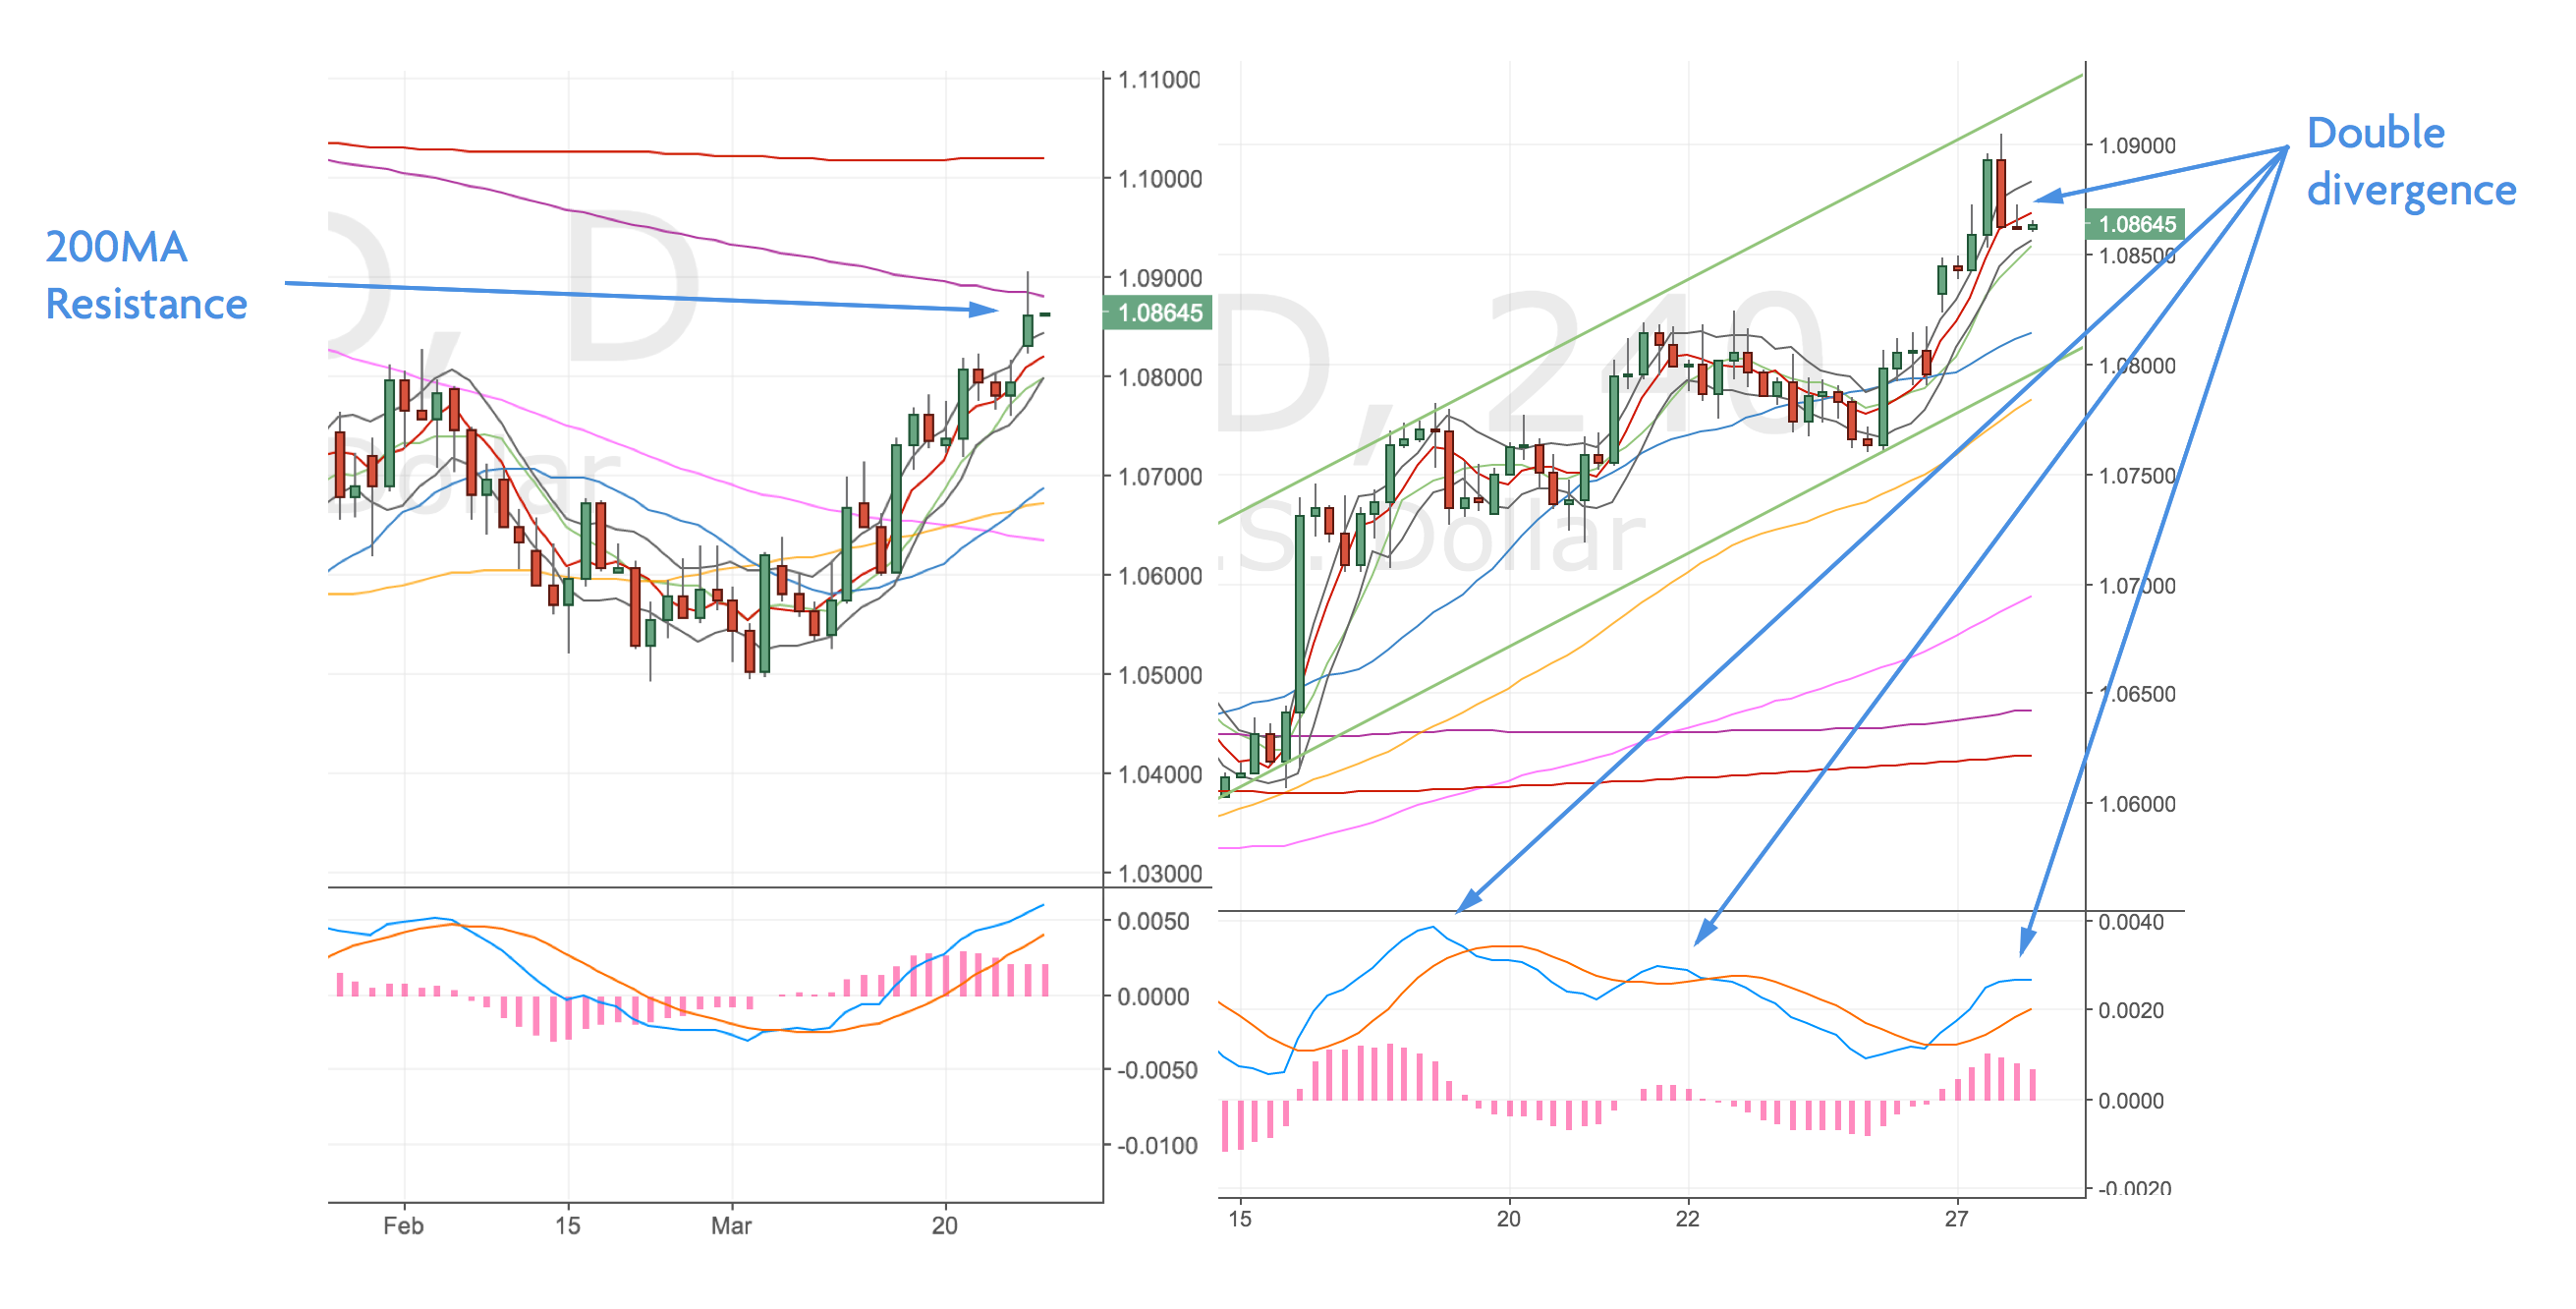
EURUSD Daily & 4H Chart – 27 Mar

The weekly chart is very close to touching the 50MA, the monthly is close to the 20MA.

Trade set up

Across the two pairs, I’ve got a full position on both at a little over 1%. ~ 1/3 of the position is open now in each market, the remaining ~ 2/3s is to be opened by order at the upper bands (I chose the upper bands because the prior candlesticks were spiky and long bodied so the upper bands coincide with about 50% of the candlestick body).

I’m not totally comfortable with these trades, but I need to trade the system – not my opinion. The proximity of the MAs on the higher timeframe does worry me. I need to be more like Chirrut from Star Wars. He has absolute faith in the force and I need to have faith in my system’s probability. 🙂

If Chirrut was a trade he’d probably say…

I’m trading the system and the system is with me, I am trading the system and the system is with me, I am trading the system and the system is with me …

Trust in the system. I am trading the system and the system is with me

Hahaha, I’m such a dumb ass.

XAUUSD order triggered, now in the full trade – 28 Mar

My additional gold order has triggered at 1258. So 2/3rds of my dollar position is open now. The remaining 1/3, order to short the EURUSD, doesn’t look like it’ll get hit.

Cancelled the remaining EURUSD Order – 29 Mar

Mini update, price has now hit the 4h50 so I’ve cancelled the remaining EURUSD order to get short. As some of the move has now played out, there’s no need to add to the position if price comes higher.

As we’ve got a double divergence in play, I’ve kept the more ambitious 4h100 target and ditched the 4h50 target.

Closed some positions – 30 Mar

Some good news, but bad trading, today. Both of these positions have been doing OK; however, I’ve been undecided about my targets and not been moving my limit orders inline with my MAs regularly.

Being honest, it’s been a combination of being forgetful and dog tired. I managed to catch another cold off the boy and he’s not been sleeping well so I’ve not been on my A game. This time though, I’ve been lucky to be watching when price has hit my targets, so I’ll accept the spoils and consider this a lesson learnt.

Taking some profits

My EURUSD trade is now closed – we touched the 4h100 around early lunchtime. My Gold trade is partially closed, I took half profits following the USD GDP figures move down to the 4h50. Not a big win on either, but not terrible.

The remainder of my Gold trade is being held for the 4h200 now. I originally planned to close the whole position at the 4h50 but price action has been slow and the 4h50 has moved up and up. So, I’ve held half of the position open, because I would’ve been dissatisfied with a move lower that I wasn’t in.

Here’s the latest charts.

EURUSD 4H Chart
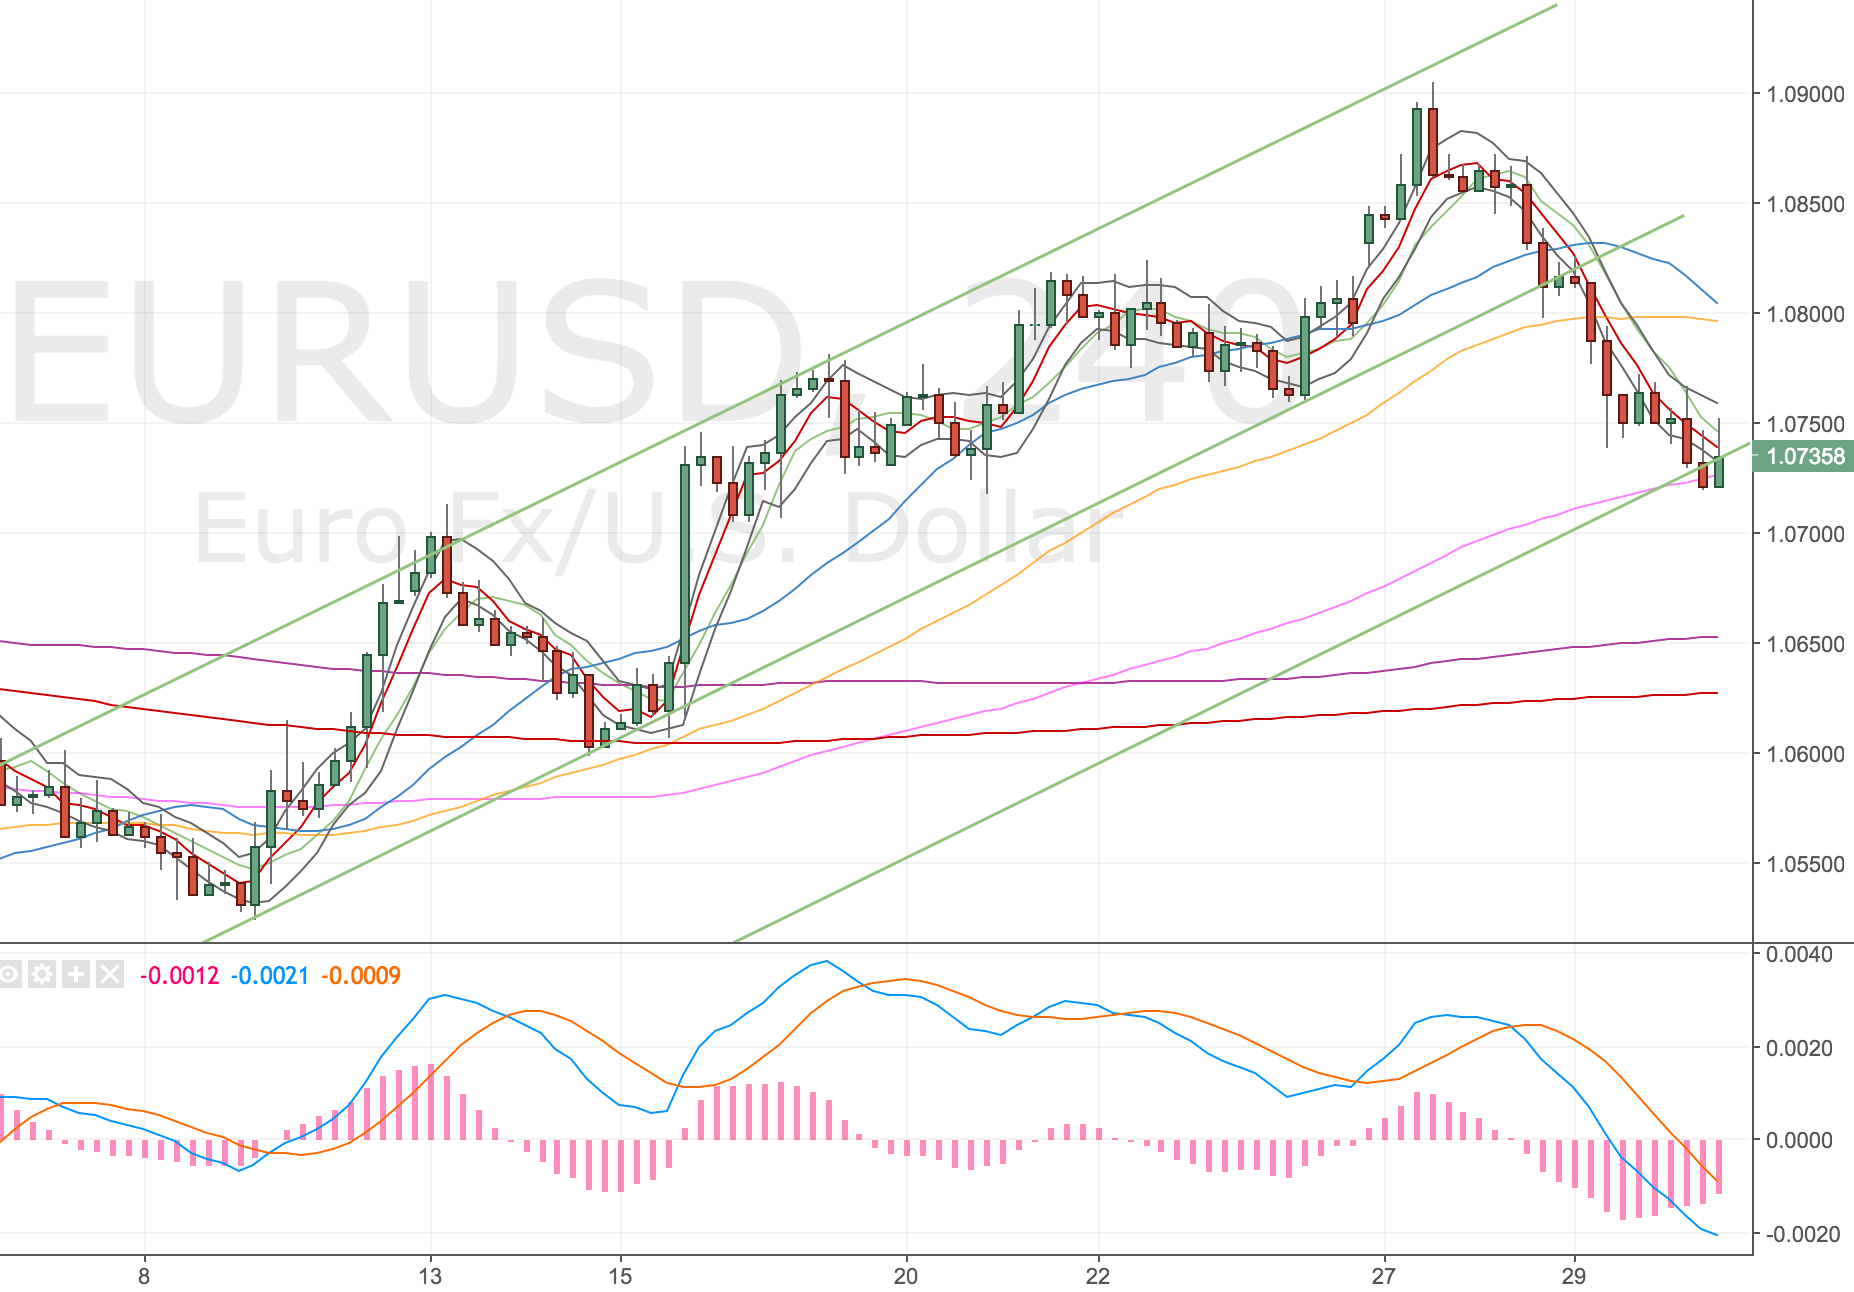
EURUSD 4H Chart – 30 Mar. Pink line is the 4h100.

XAUUSD 4H Chart
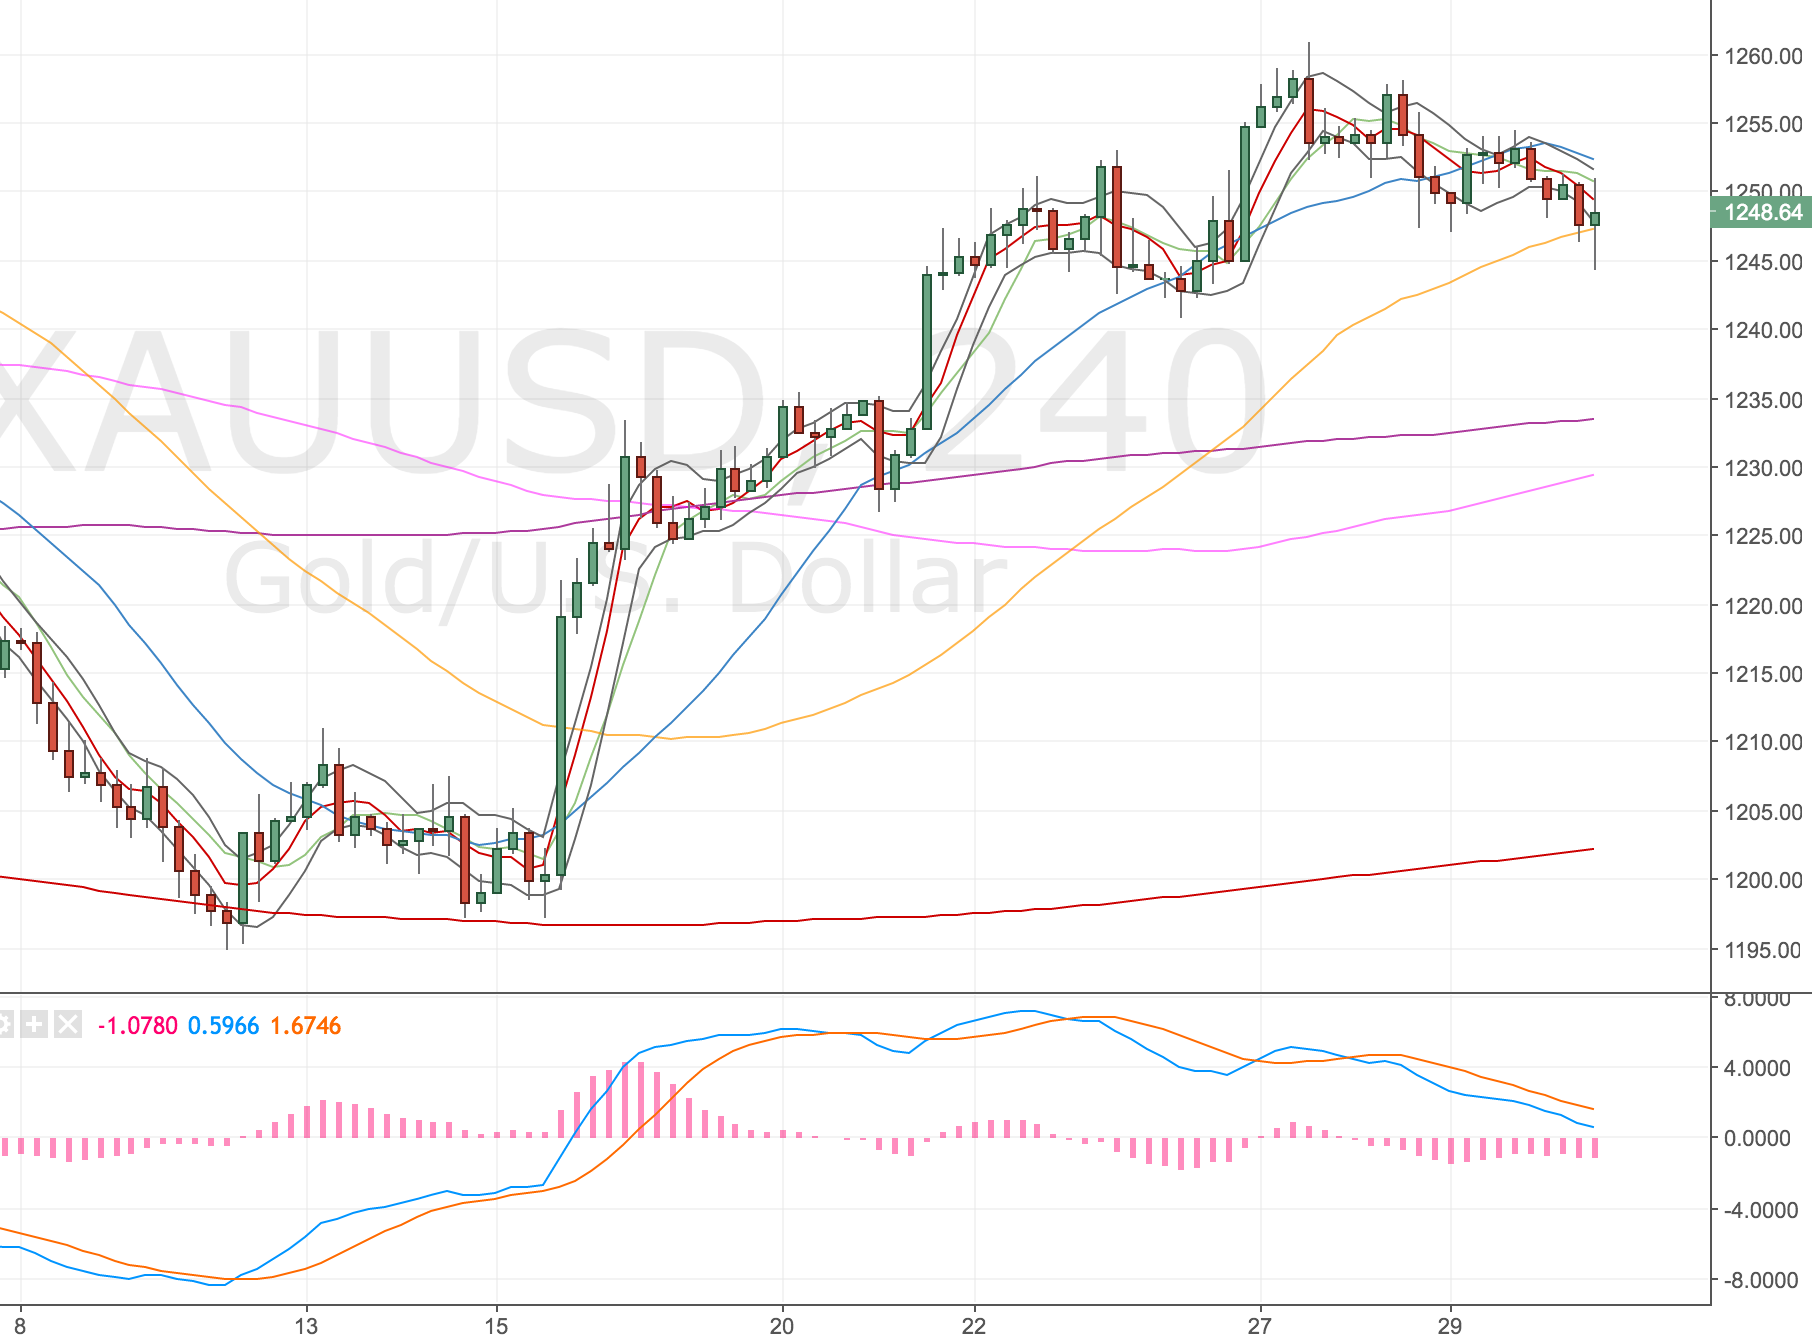
XAUUSD 4H Chart – 30 Mar. Purple line is the 4h200.

It feels good to have cut my risk and be out of some of those positions! I can move on to the next opportunity.

Here’s what I’m left with now.


XAUUSD
Acc Risk: 0.3%
Entry: 1258.0
Stop: 1263.3 (53 pips)
Target: 1233.7 (4h200, 243 pips, 4.58 RR)

Have added to my Gold position – 5 Apr

Gold has been holding up and has made another test of the d200. I wasn’t surprised to see it and fortunately for me it has made another 4h divergence. So we have a double divergence in play. So I’ve added to my position at 1253. the 4h100 has also crossed the 4h200 so I’ve split my targets to test both (as they are close by and the 4h200 hasn’t been tested in a while)


XAUUSD
Acc Risk: 0.5%
Short: 1256.3 (Avg price)
Stop: 1263.3 (70 pips)
Target 1: 1240 (4h100, 160 pips, 2.32 RR)
Target 2: 1234 (4h200, 223 pips, 3.18 RR)

I did get a screenshot of this but late on in the day. I was working to get ready for a call with Charlie. Here’s how it is looking. Looks like it might hit my target soon!
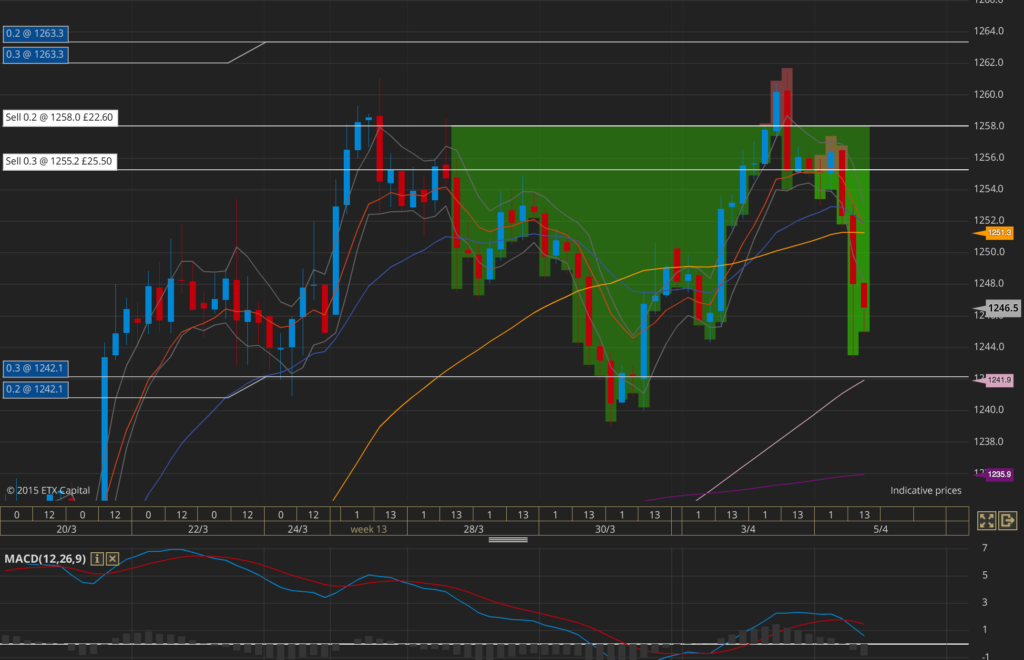
XAUUSD 4H Chart – 5 Apr

Just noticed my targets are both on the 4h100. Ops better update that! So many mistakes lately – I’m not putting enough dedicated time into this – it’s always rushed lately. Need to be better at that.

NFP tomorrow, feeling ominous – 6 Apr

The ADP figures were a strong beat and I feel that whatever happens now NFP will be a disappointment, surely a good figure is priced in so anything short of excellent will be a disappointment. We’ll see at lunchtime I guess.

Stopped out – 7 Apr

Trump announces an air strike on Syria. No doubt he mentioned some very bad people – sad.

Well I never got to those NFP figures, Trump launched a missile strike overnight and that seems to have spiked Gold higher (to be expected.) I’m not too fussed about this, not the sort of thing you can predict and so long as risk is managed it’s going to happen.
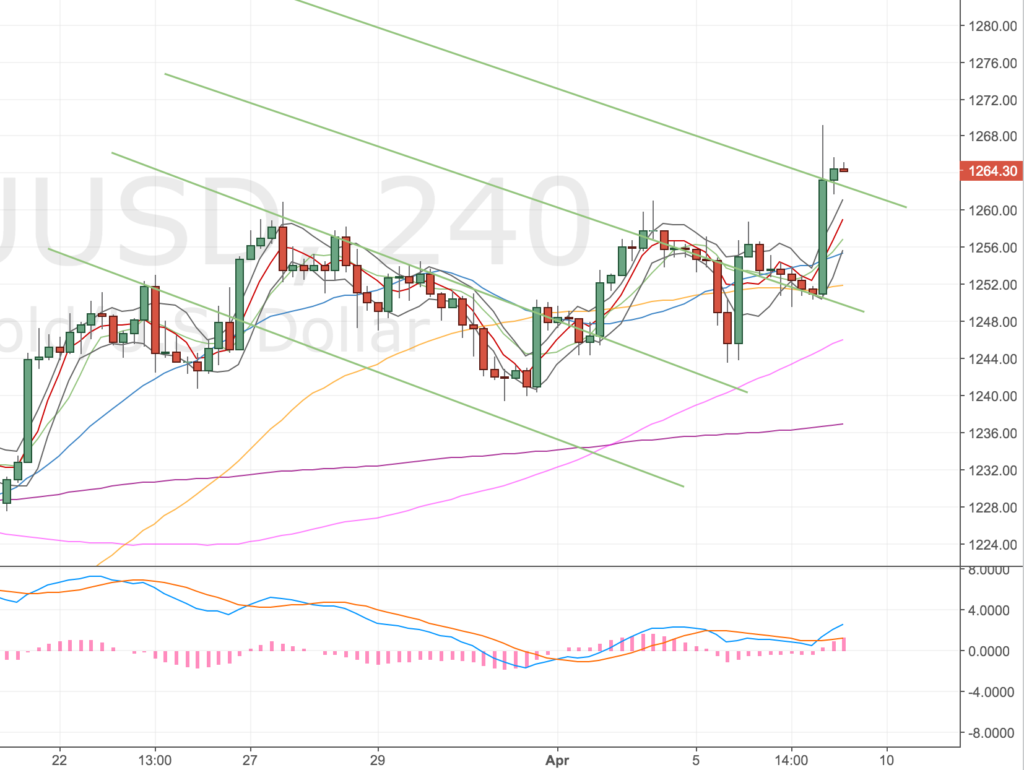
XAUUSD 4H Chart – 7 Apr 17

Price is potentially forming another divergence (double this time). I expect with the NFP figures we’ll get the set up. This set up is on the daily and 4h timeframe. I think I’ll be waiting towards the end of the day to trade this. NFP is due out at 1.30 and the candlestick on the 4h FXCM chart closes at 2pm (which might be a bit close!?) IDC 4h candlestick closes an hour later at 3pm so I might wait for that to get my read on the market.

Still tracking gold – 11 Apr

Following Friday I missed an entry to get short again on Gold. TBH I was pretty fed up with the price action and was happy to leave the trade and wait for fresh eyes on Sunday, at the back of my mind was a slight doubt that was the correct decision, but I left it nonetheless. Well turns out it wasn’t, Friday evening triggered the trade to get short, I didn’t think much would happen until Monday and I didn’t need to be holding risk over the weekend for no reason so didn’t check the market.

Being a double divergence the target would’ve been the 4h100, which got a great touch soon after!
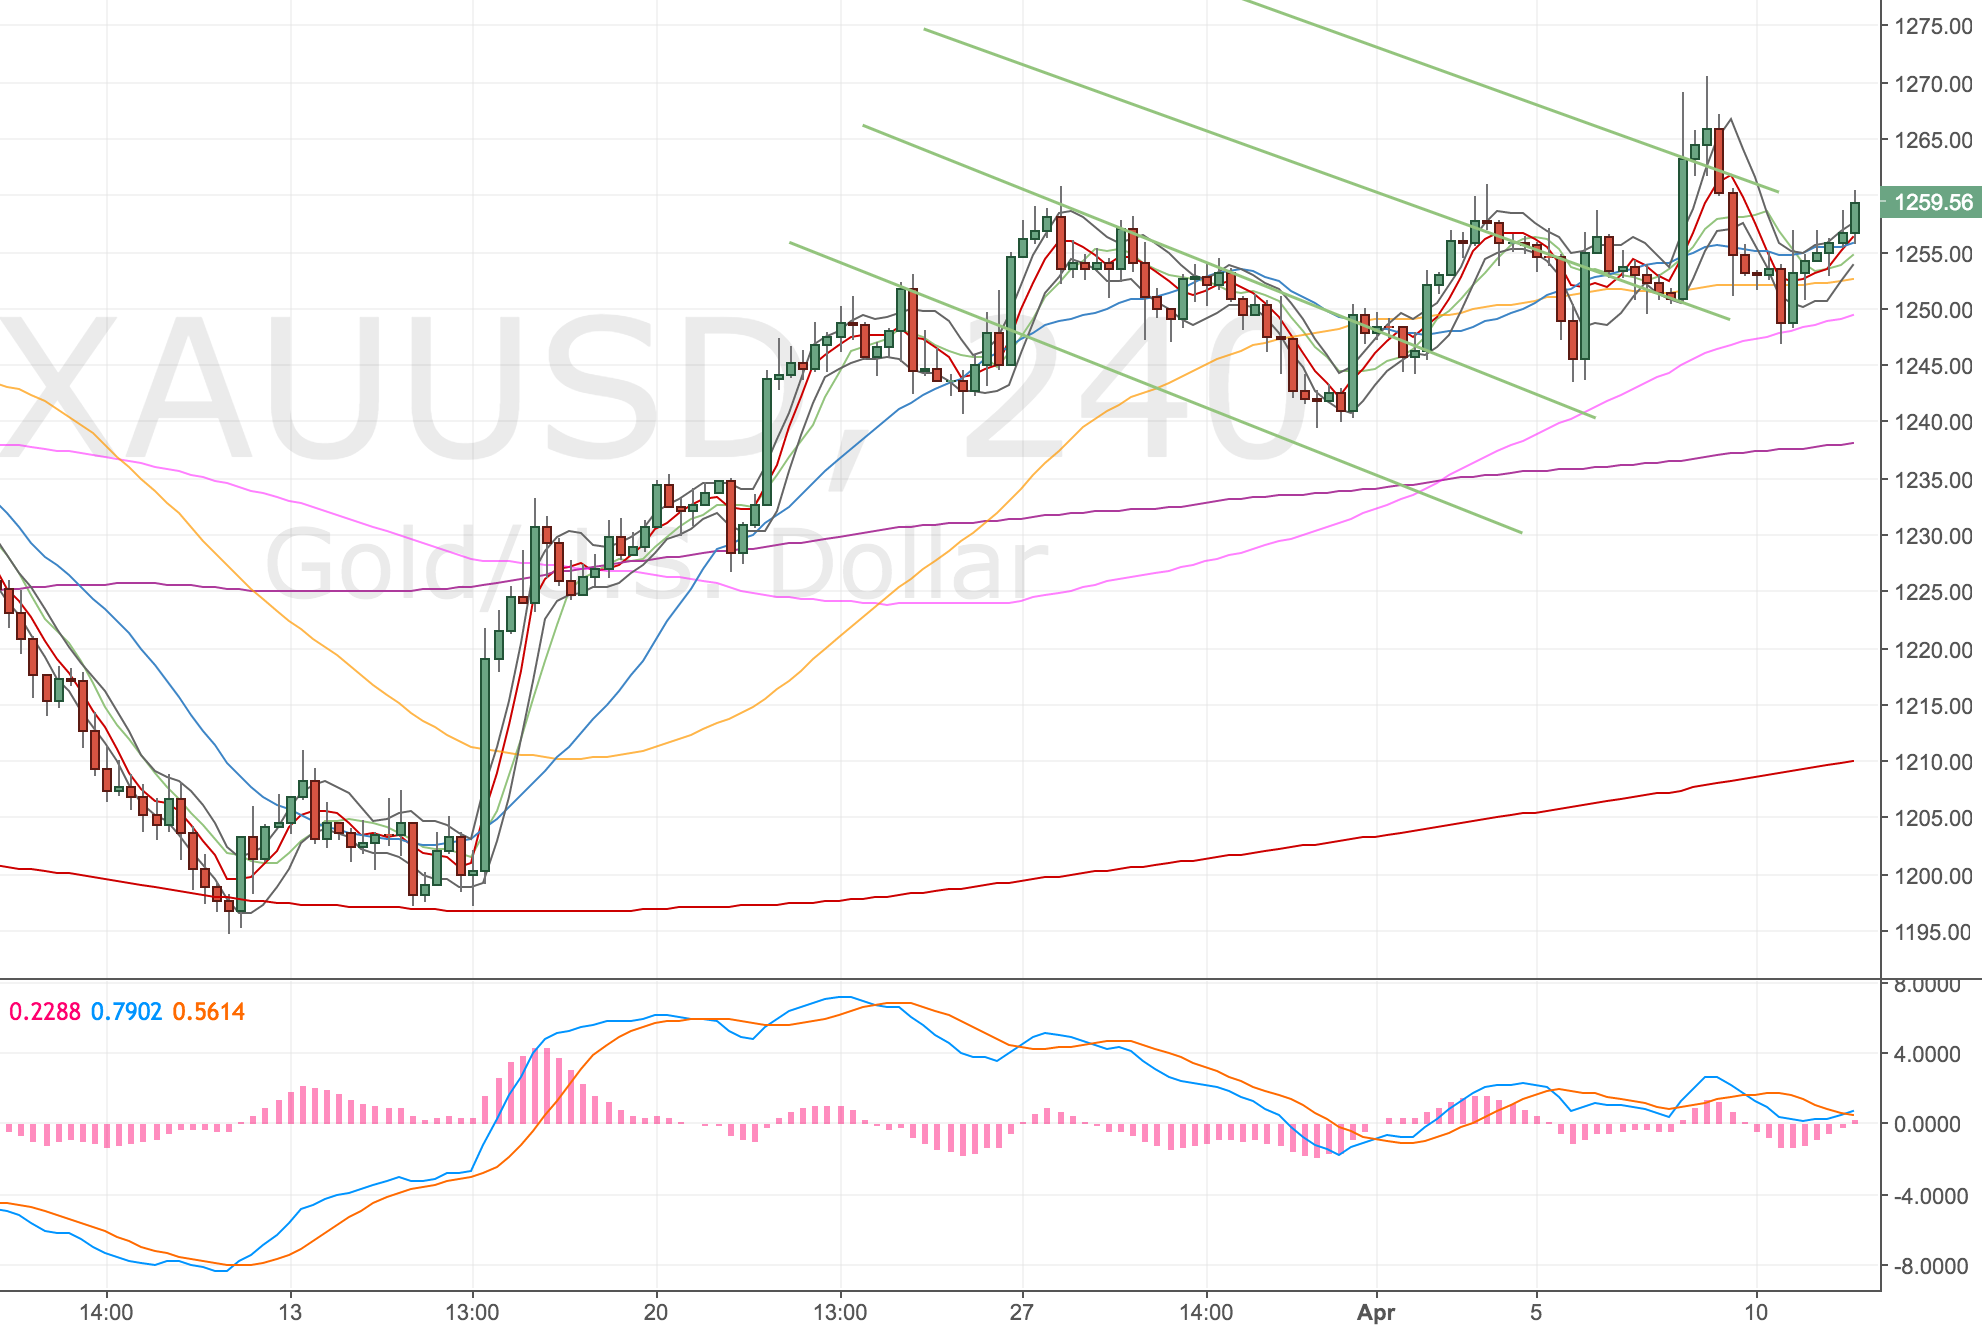
XAUUSD 4H Chart – 11 Apr

I guess price action is crap, until it isn’t!

Price is heading higher, and looks to be setting up a daily divergence. Shame the 4h won’t now. The double divergence was much nicer. It’ll be really interesting to see what price action is like over the next two days.

Gold heading higher – 13 Apr

Just keeping my eye on this – for now the trade is over, if we get a sudden reversal the daily chart could still set up but the price action seems very bullish right now. There was a lot of hand-railing of the d200 and the small pullbacks were quickly bought up, so I guess the writing was on the wall for Gold shorts.

Either way, we got some pips out of this, on to the next trade.
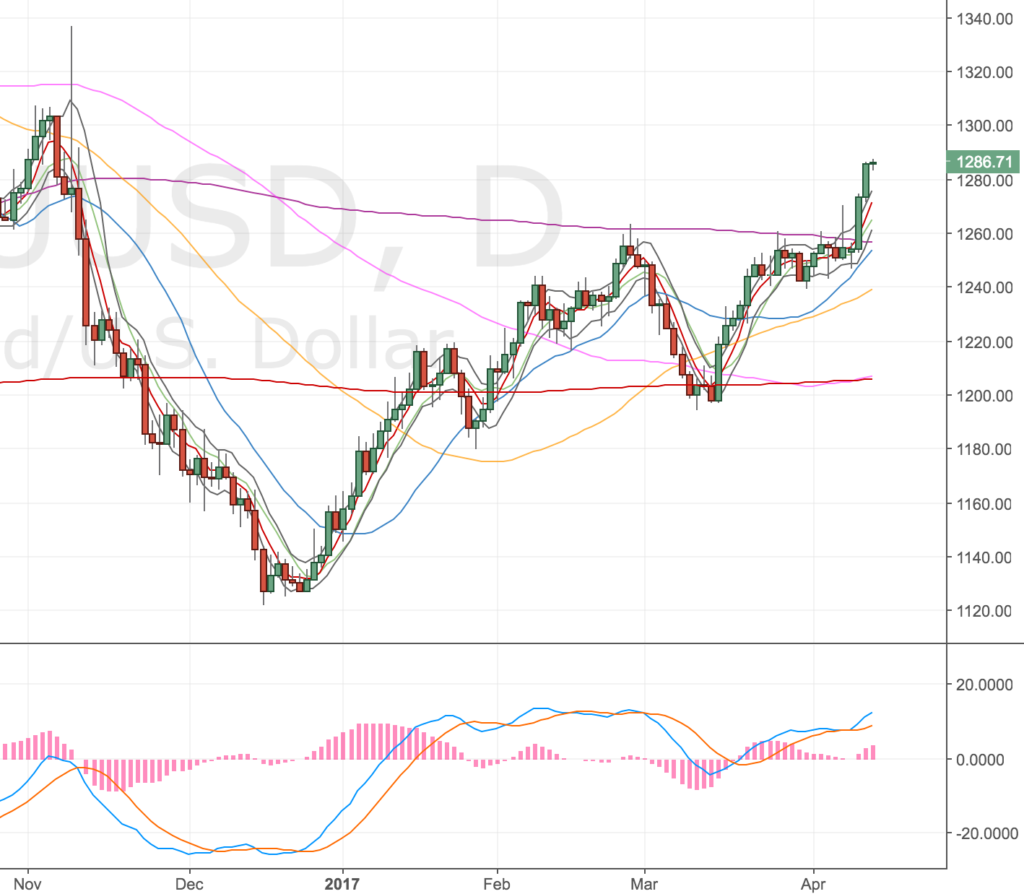
XAUUSD Daily Chart – 13 Apr