Author Archives: admin

AUDUSD DST Short – 20 Mar


Account Risk: 0.6%
Short: 2x 0.7725
Stop: 0.7758 (33 pips)
Target: 0.7641, 4H 50MA & 200MA (84 pips, RR 2.6x)
Mindset: Uncomfortable about this but trading the signal

Update 1 -Target hit – 22 Mar

I’m not too happy about this set up, it’s right into a resistance zone that has been tested so many times it’s surely gonna blow! However I resolved to trade the setups I see, when I see them so here goes!

Trepidation is my middle name

I also made a decision to reduce my stop size to 10 pips off the high or low. I did this because my risk to reward isn’t good enough and my winning trades are too small compared to my losers. At the moment my win rate is less than 50% so I really need to make those winners count and – although untested – I think I’d do better in the long run to take smaller losses and get back into the market later.

I’m working on testing this now by writing an EA in MT4 to do some back-testing.

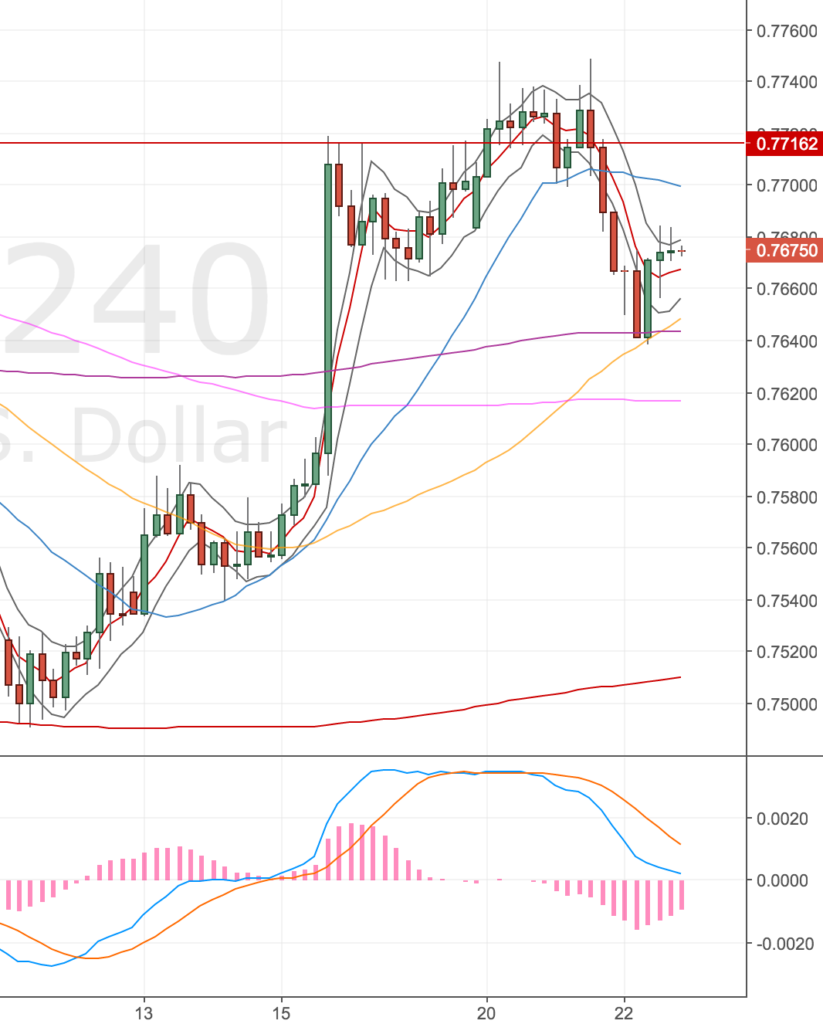
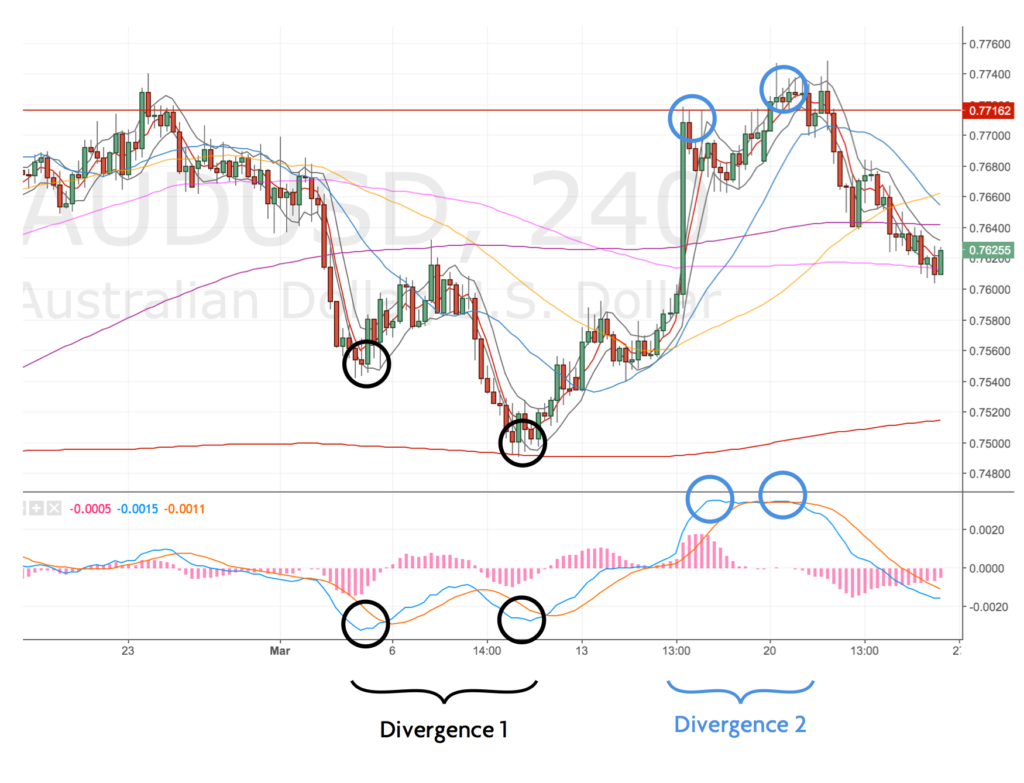
Anyway here’s the set up, it’s not the best example of a divergence!

Set up chart 4H

AUDUSD 4H Chart – 20 Mar

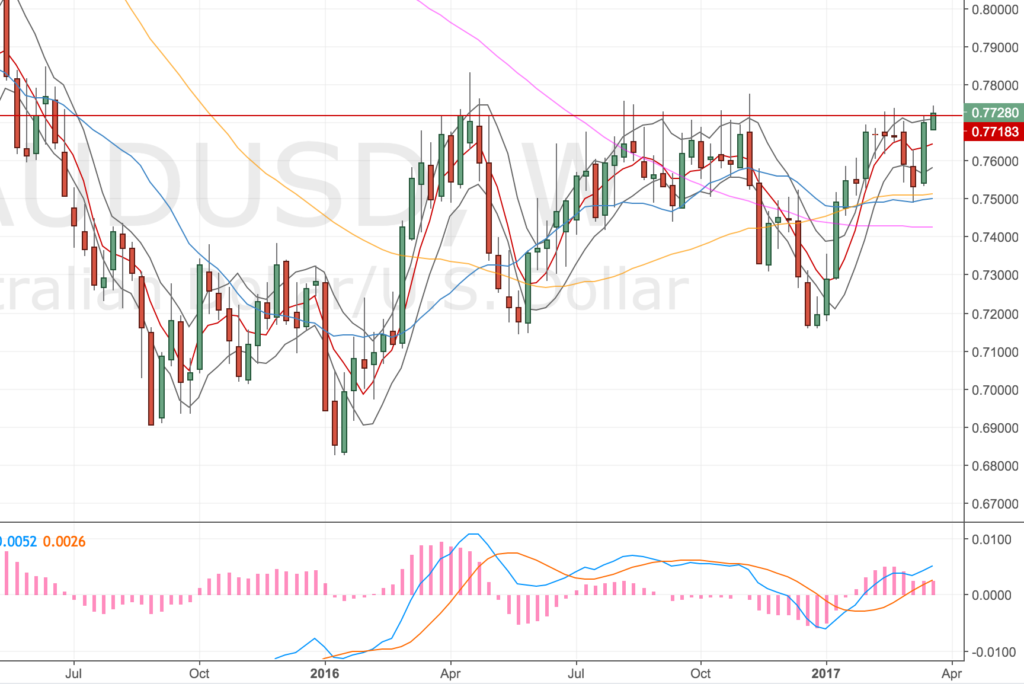
Here’s that daily resistance zone

AUDUSD Daily Chart – 20 Mar

There’s also a divergence setting up on the daily but I’m trading the 4H setup.

I’ve entered two positions, targeting the 50MA and the 200MA both very close together.

Update – Target hit – 22 Mar

AUDUSD 4H Chart – 22 Mar. Nice touch on my target.

Well this has been the most uncomfortable trade ever for me. I blogged about a chat with traders interview which had some really good quotes. The best one was that traders need to be comfortable feeling uncomfortable. It’s so true. I didn’t want to take this trade and I wanted to close it a few times, but stuck to my plan and I’m glad I didn’t underperform the strategy this time!

It’s my first trade which has banked over £100 profit for me. I know it’s small fry but it’s nice to hit that milestone. Hopefully there are many more to come!

Monthly Review – Mar 2017


This month I’d give myself the grade: C-

Starting balance: £7,070.10
Target return: £255.50
Actual return: -£64.75
Closing balance: £7,005.35 -0.85%

I’ve been itching to get to the end of the month to see how I did since I started trading more markets.

All I can say is WOW, I did pretty badly! Before I crunched the numbers on my performance, I actually thought I’d done OK this month. OK being, checked regularly enough, had a few trades on each week, handled the increased number of markets, traded the right markets, kept up the journalling, etc. However, I have hugely underperformed the strategy.

Daily

On the daily charts, I only traded 30% of the set ups. I under performed the strategy quite badly.

ActualWin Loss %Trades takenWin Loss %
Signals10-3-
Winners660%133%
Losers330%133%
Still live110%133%

4 Hourly

On the 4H charts, I only traded 29% of the set ups (under performing badly!) What’s worse is I managed to catch over half of the total losing trades! 😐

ActualWin Loss %Trades takenWin Loss %
Signals38-11-
Winners2258%327%
Losers1129%655%
Still live513%218%

Given that I have underperformed this strategy so badly, I’d have to put the whole thing down to my psychology (second guessing trades) and lack of discipline (not being routine enough, when I check the markets). The psychology is probably my greatest issue, I keep wanting to put wider stops on, which skews the RR and puts me off the trade (especially around MAs and support lines).

I think my most significant changes for next month will be tighter stops (10 pips), getting back into markets and downsizing position sizes at ambiguous areas. This will be my number one goal for next month – if I can consistently do that, I reckon I will make some money.

March Trade Log

Here’s the break-down of my trades this month.

#DateMktPosAcc RskOpenStopStp PipsTgtTgt PipsR:RCloseFnl PipsFnl R:RDaysP&L (£)
127 Feb 17GoldShort0.3%1254.8126611212351981.751234.82001.78239.68
201 Mar 17GBPCADShort0.4%1.64691.6529601.6374951.61.6374951.6147.90
302 Mar 17AUDNZDShort0.4%1.07401.0792521.05651753.361.0792-5212-29.19
403 Mar 17EURUSDLong0.4%1.05151.0475401.05958021.0594791.97854.25
506 Mar 17FTSEShort0.6%7359.07416.05769434167.297416-57-111-78.06
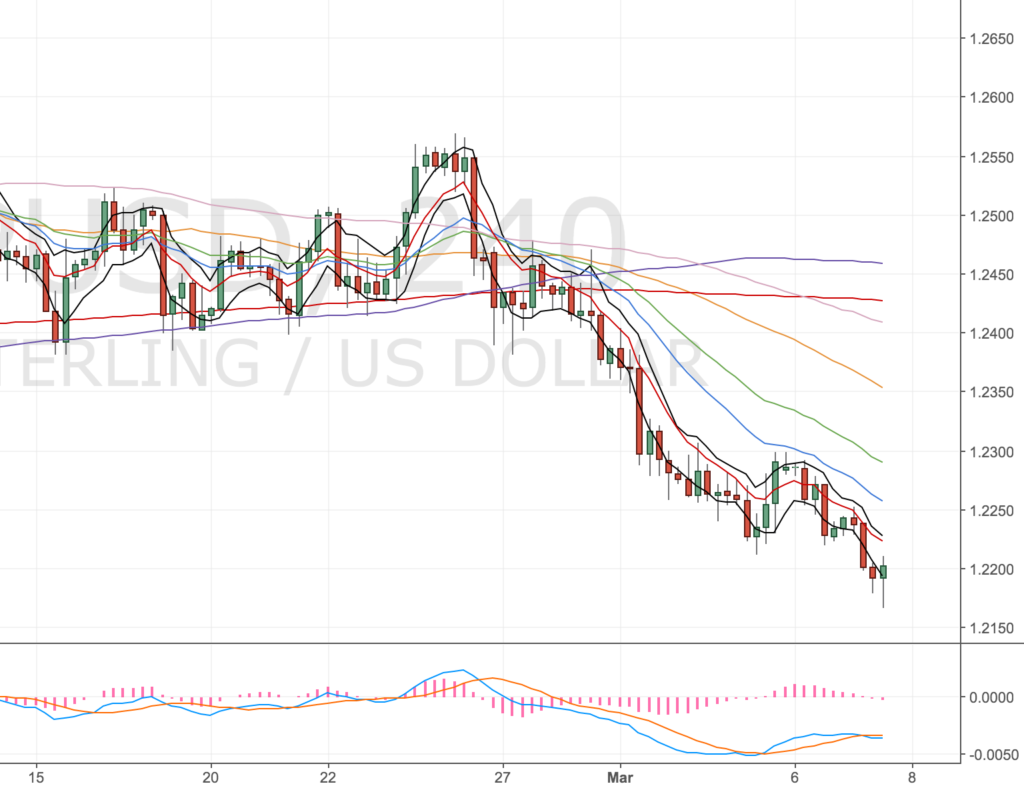
607 Mar 17GBPUSDLong0.6%1.22061.2149571.23832344.11.2149-57-12-43.41
709 Mar 17GBPUSDLong0.6%1.21601.2110501.23581983.961.2150-10-0.25-6.87
810 Mar 17EURAUDShort0.6%1.40961.4139431.39781202.881.4139-43-11-46.37
914 Mar 17AUDNZDShort0.5%1.09361.0969331.0875611.841.0969-33-12-33.39
1016 Mar 17EURUSDShort0.7%1.07091.0757481.0618911.891.0757-48-11-47.40
1120 Mar 17AUDUSDShort0.6%0.77250.7758330.7641842.60.7644812.453110.78
1222 Mar 17EURUSDShort0.3%1.08101.0830201.07141165.8-----
1322 Mar 17EURCADShort0.4%1.44471.4478301.43471003.31.4478-30-11-31.10
1423 Mar 17GBPJPYLong0.3%138.65138.1348140.281633.4-----

Summary of what’s working and what isn’t

Here’s my summary of what worked and what didn’t.

What worked

  1. I covered more markets and feel I am getting a better feel for those markets (mainly volatility).
  2. Managed my risk pretty well – I averaged 1.95x RR on my winners – so despite losing twice as much as I won, my drawdown was only 0.85% this month
  3. Didn’t close any of my trades early. Once in a trade, I kept to the system.
  4. My journalling has been consistent so I’ve been able to look back on trades and review what I did.
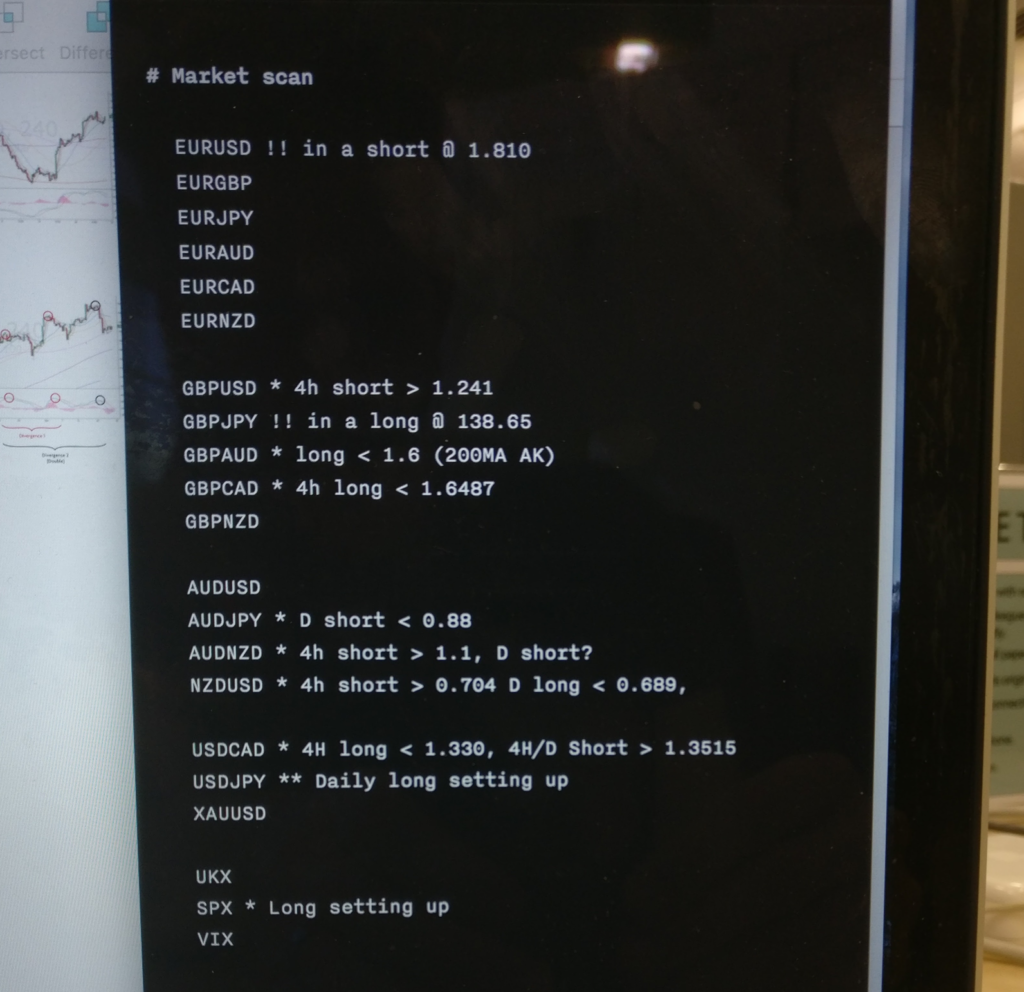
  5. My market scan note taking is working for me. * indicate levels worth watching, ** indicate a set up is forming and *** indicates a set up is in play. Good for reminding me of correlating markets and managing my exposure.
  6. !! indicates a trade is on. Again helps me to manage my exposure to a currency. I’m sure as I trade more I will need to make calls on total exposure to a currency.

My market scan notes.

What wasn’t so great

Quite a bit 🙂 !

  1. I missed set ups through lack of discipline and rigour with my morning and evening market scans
  2. I second guessed a number of trades (in particular the GBPUSD) which in hindsight was a golden opportunity. Would’ve been a great winner but felt stupid at the time, trading into volatility ahead of the fed rate decision.
  3. Tampered with my position sizing too much! My losers were generally larger size trades than my winners. I shouldn’t really started tweaking my position size until I’ve endured a more sustained drawdown.

Changes for next month

  1. Get a small position in the market on the open of a valid candlestick and place the bulk of the trade as an order at a better price. It won’t always be a full trade but it’s better to be in the market
  2. Make sure I’m back in a trade after a loser if the signal is still valid. This is so important, especially when you get an additional divergence, my confidence in the trade should increase. It won’t always work out but it usually does.
  3. Don’t get too precious about how price enters the bands after move higher, it won’t always be text book (Think about the FTSE trade)
  4. Rigour & Discipline. 10pm should be my main scan of the day, morning to validate any set ups forming, lunch time to check on price alerts. I also need to keep a better eye on the higher timeframes, I’ve ignored them too much.
  5. Trade smaller stops and be prepared to jump back in if the set up is still valid

I would also consider upping my position size for double or triple divergences but I think I’ll keep this back for another month.

Monthly trade overview

Here’s my run down of the markets I traded this month:

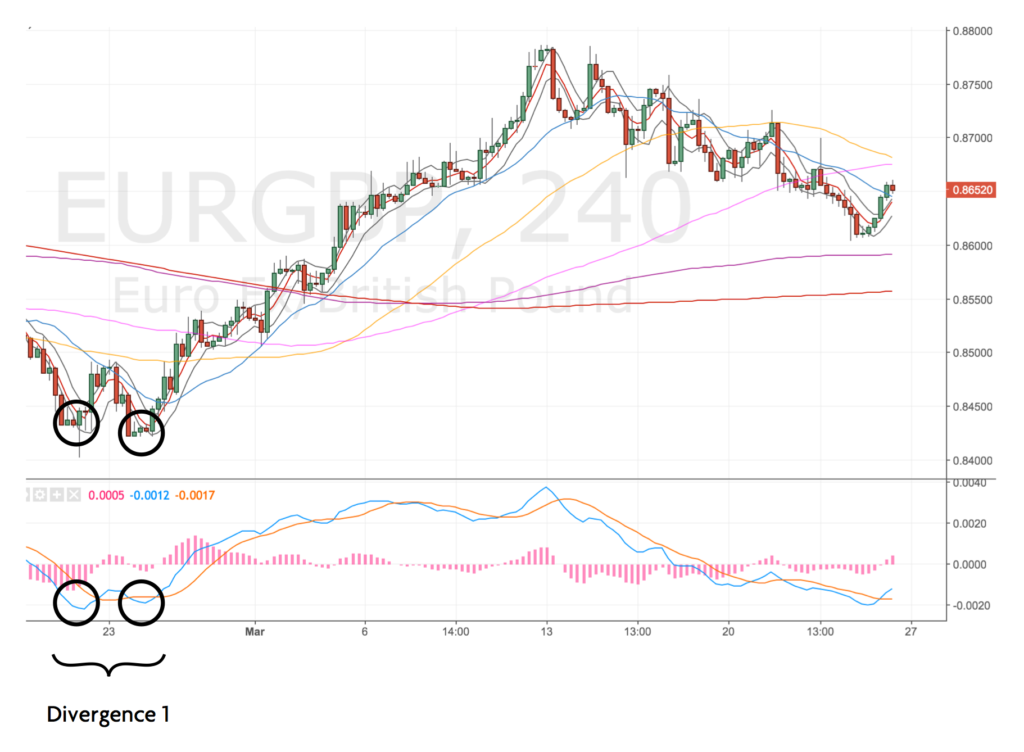
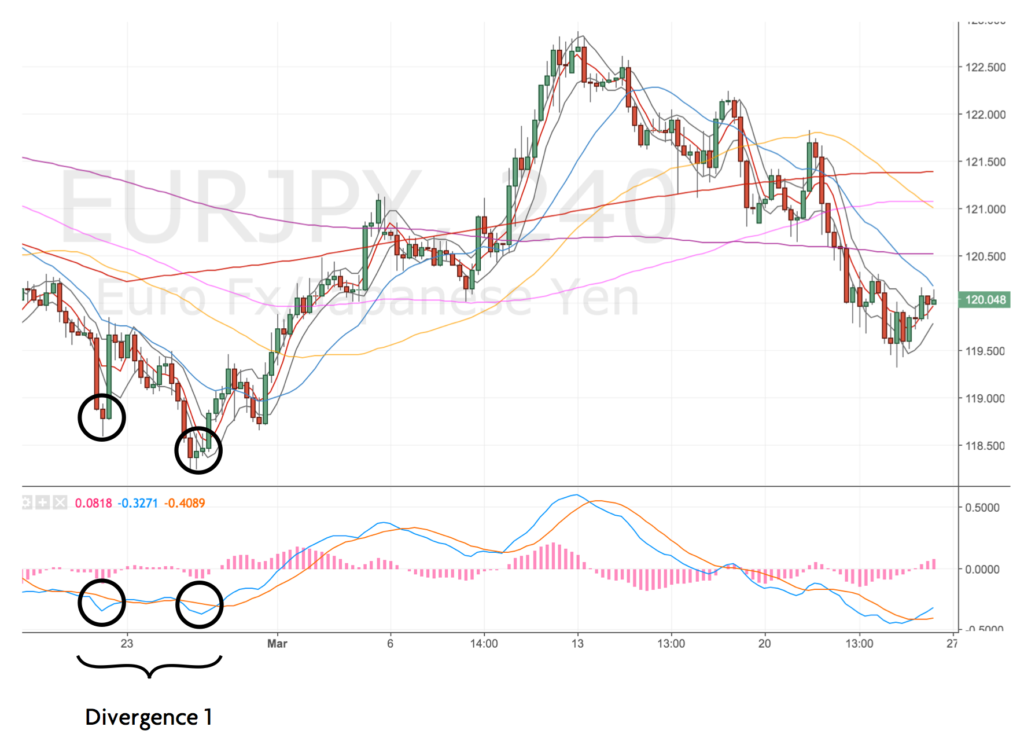
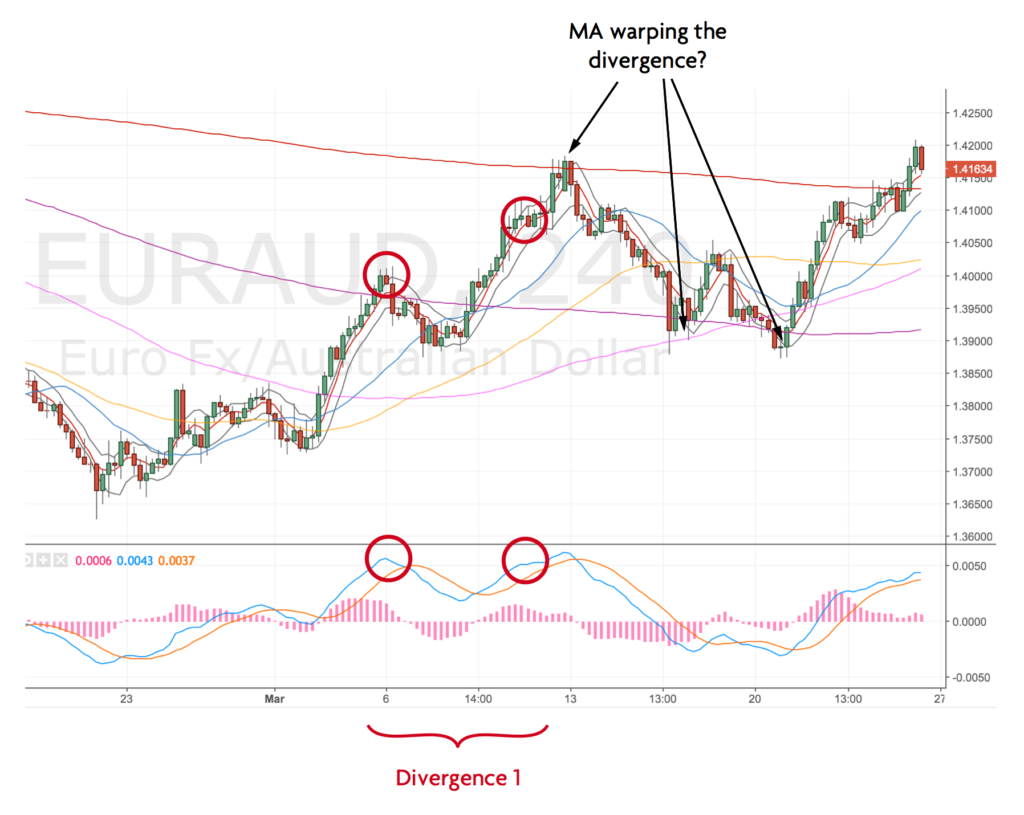
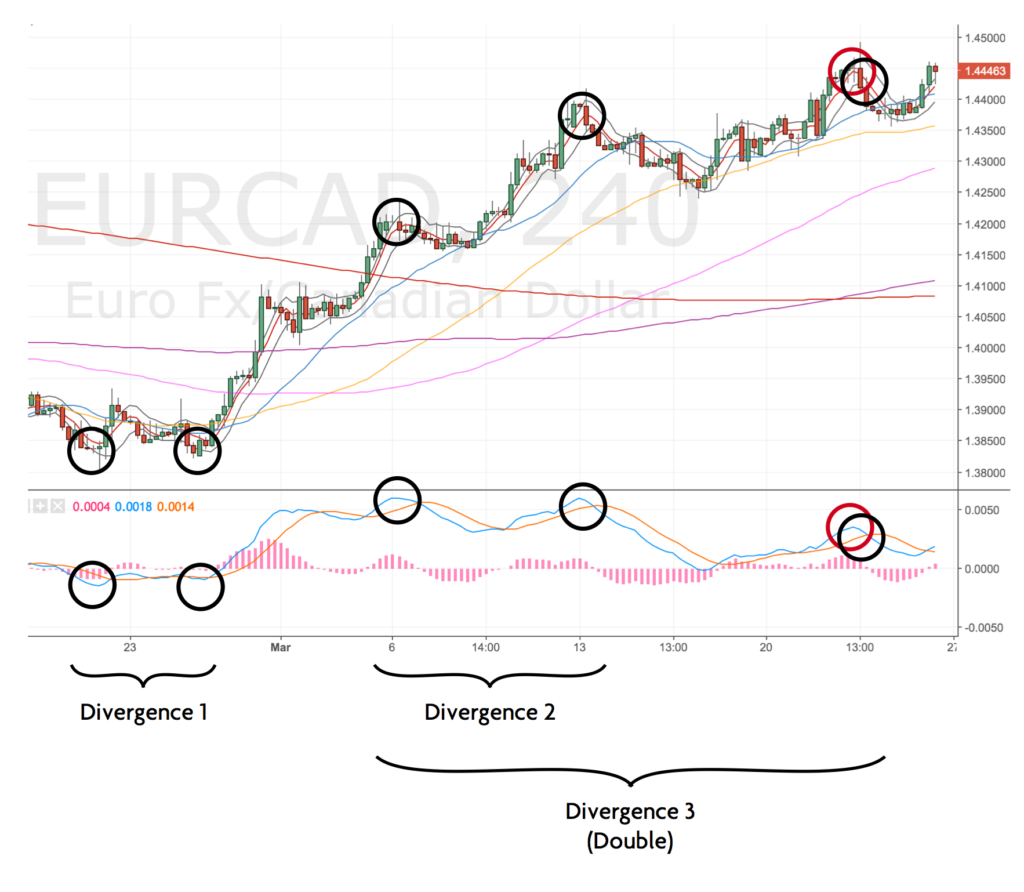
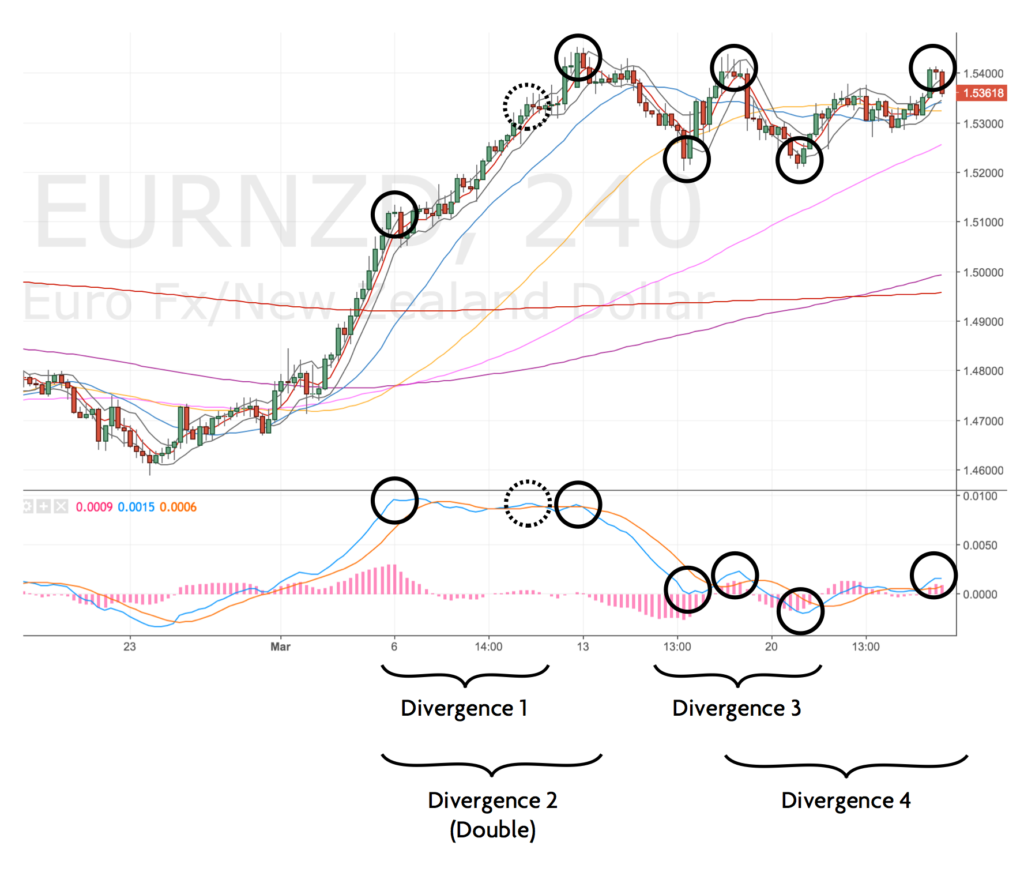
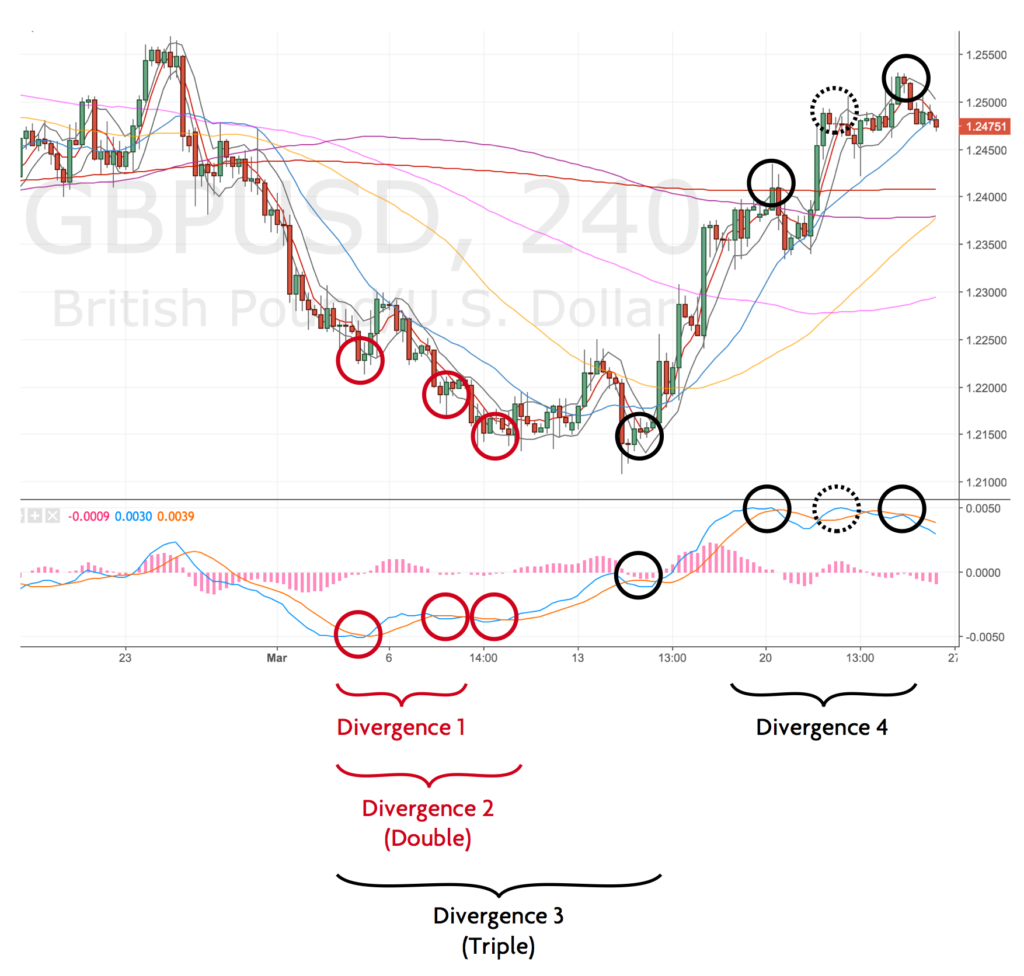
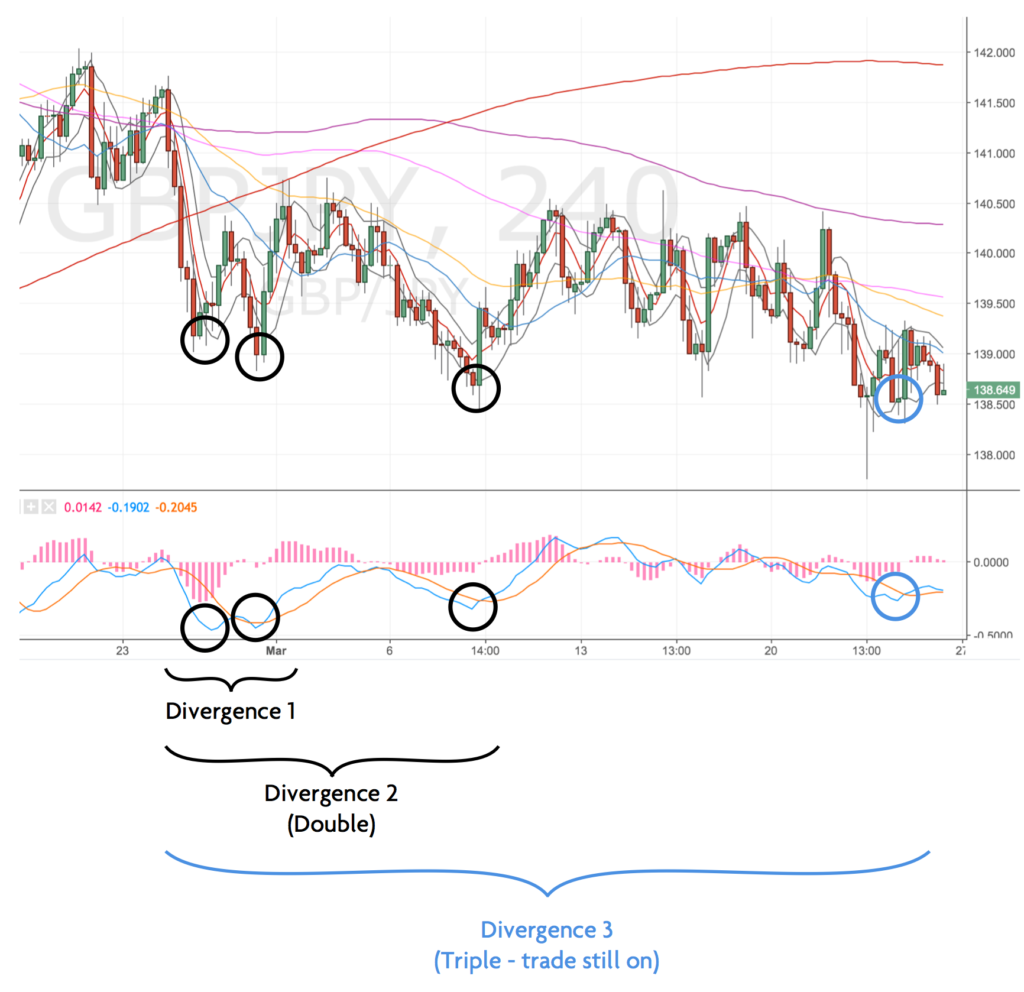
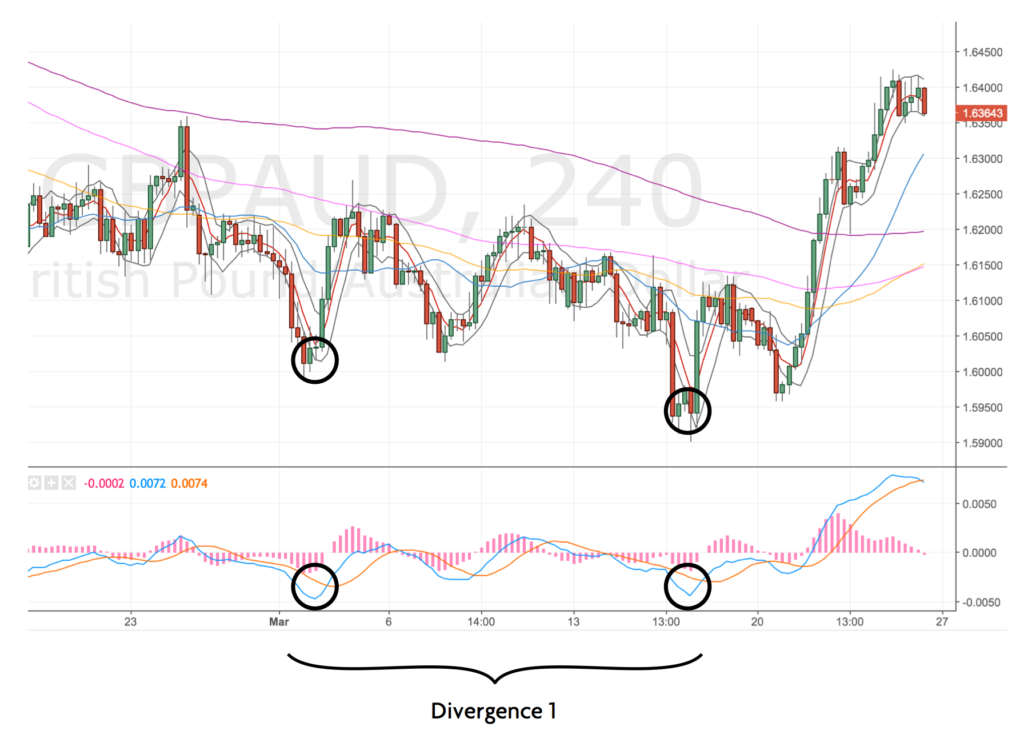
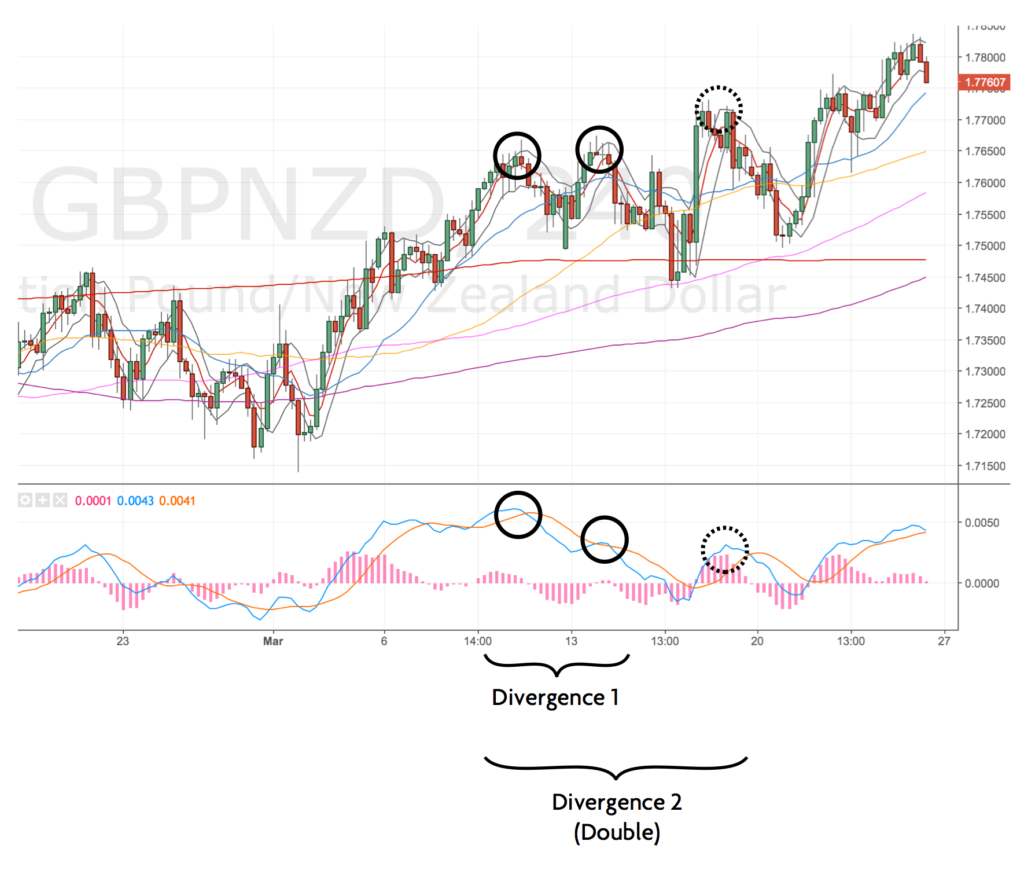
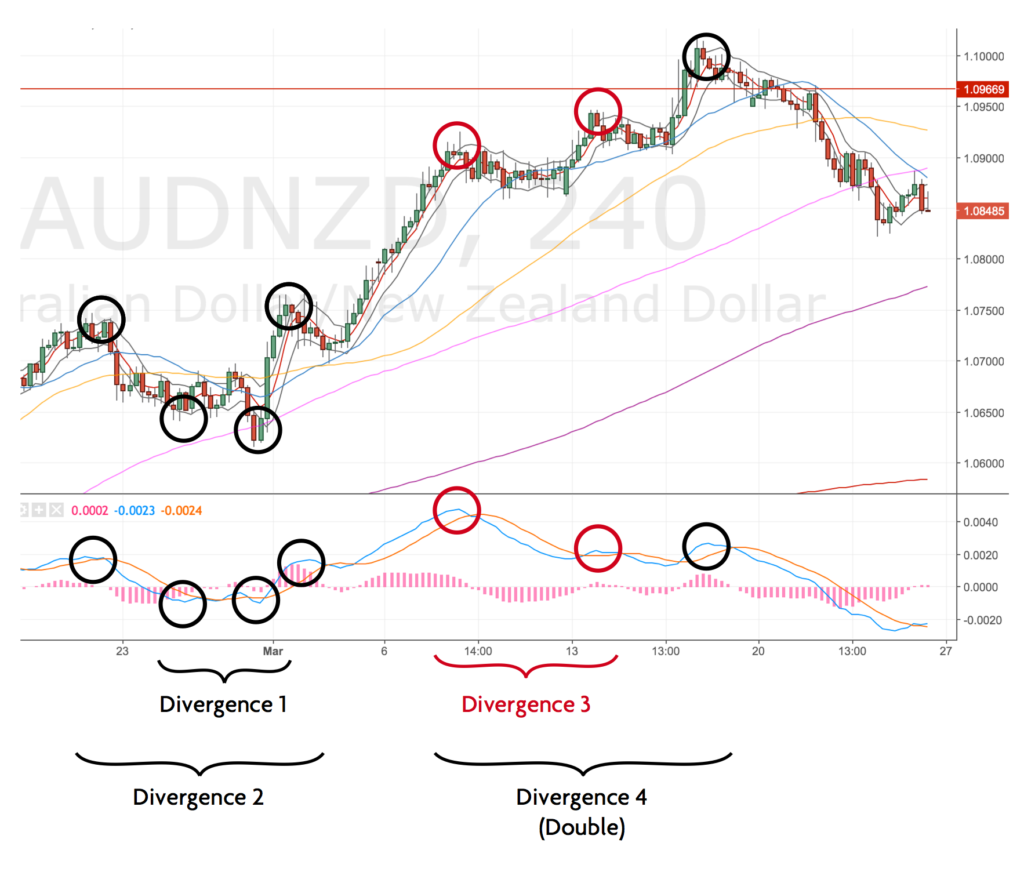
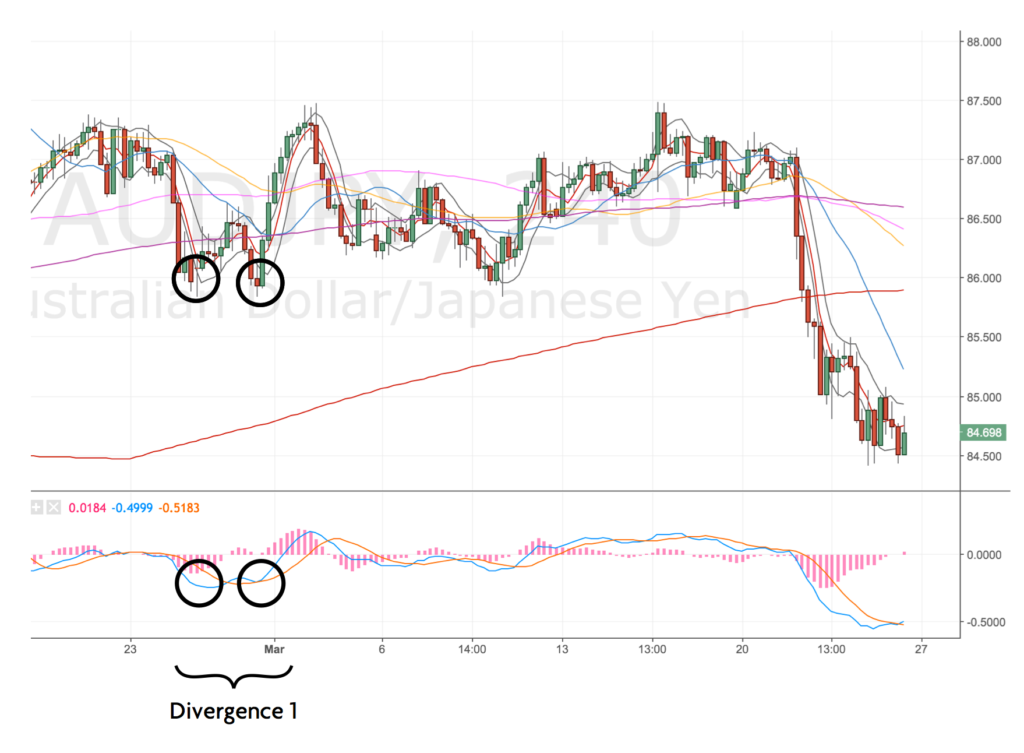
  • Blue circles are winning or open trades taken
  • Red circles are losing trades taken
  • Black circles are missed DST set ups (they appear in pairs or triplets)
  • Dotted black circles would be missed DST trades that would’ve been a loser (just for context)
  • Grey circles are DST set ups I chose not to take

EURUSD

EURUSD 4H Chart – 24 Mar

EURGBP

EURGBP 4H Chart – 24 Mar

EURJPY

EURJPY 4H Chart – 24 Mar

EURAUD

EURAUD 4H Chart – 24 Mar

EURCAD

EURCAD 4H Chart – 24 Mar

EURNZD

EURNZD 4H Chart – 24 Mar

GBPUSD

GBPUSD 4H Chart – 24 Mar

GBPJPY

GBPJPY 4H Chart – 24 Mar

GBPAUD

GBPAUD 4H Chart – 24 Mar

GBPAUD Daily Chart – 24 Mar

GBPCAD

GBPCAD 4H Chart – 24 Mar

GBPJPY

GBPJPY 4H Chart – 24 Mar

GBPJPY Daily Chart – 24 Mar

GBPNZD

GBPNZD 4H Chart – 24 Mar

AUDUSD

AUDUSD 4H Chart – 24 Mar

AUDNZD

AUDNZD 4H Chart – 24 Mar

AUDJPY

AUDJPY 4H Chart – 24 Mar

NZDUSD

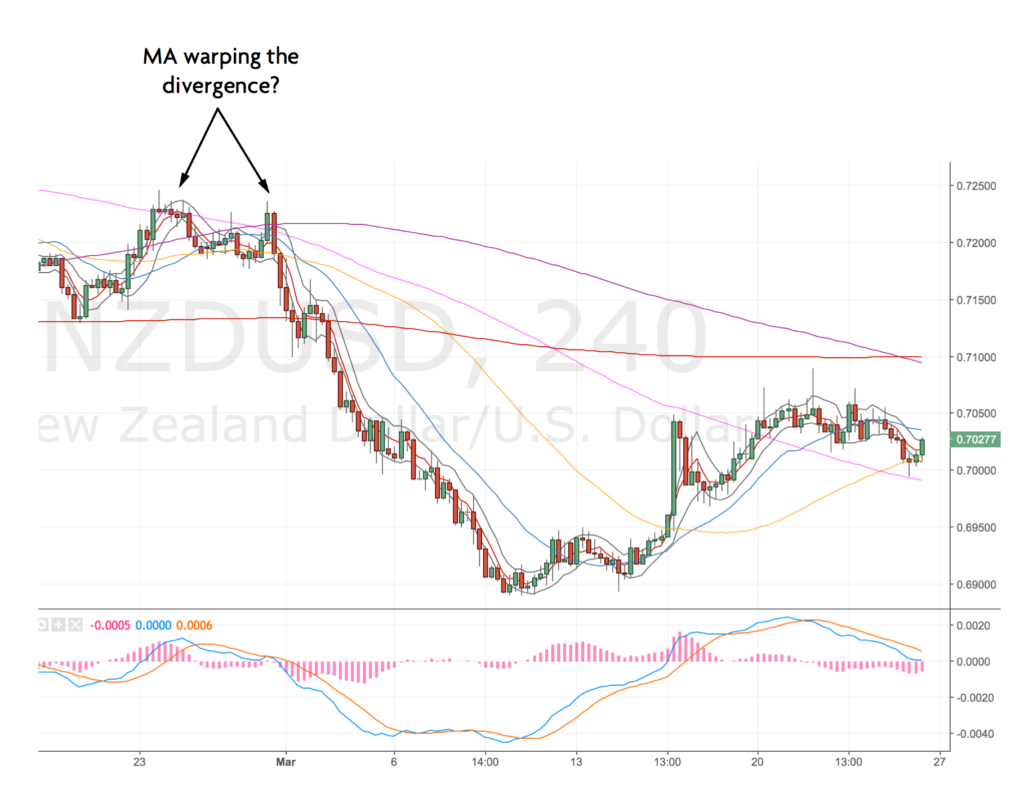
NZDUSD 4H Chart – 24 Mar

USDCAD

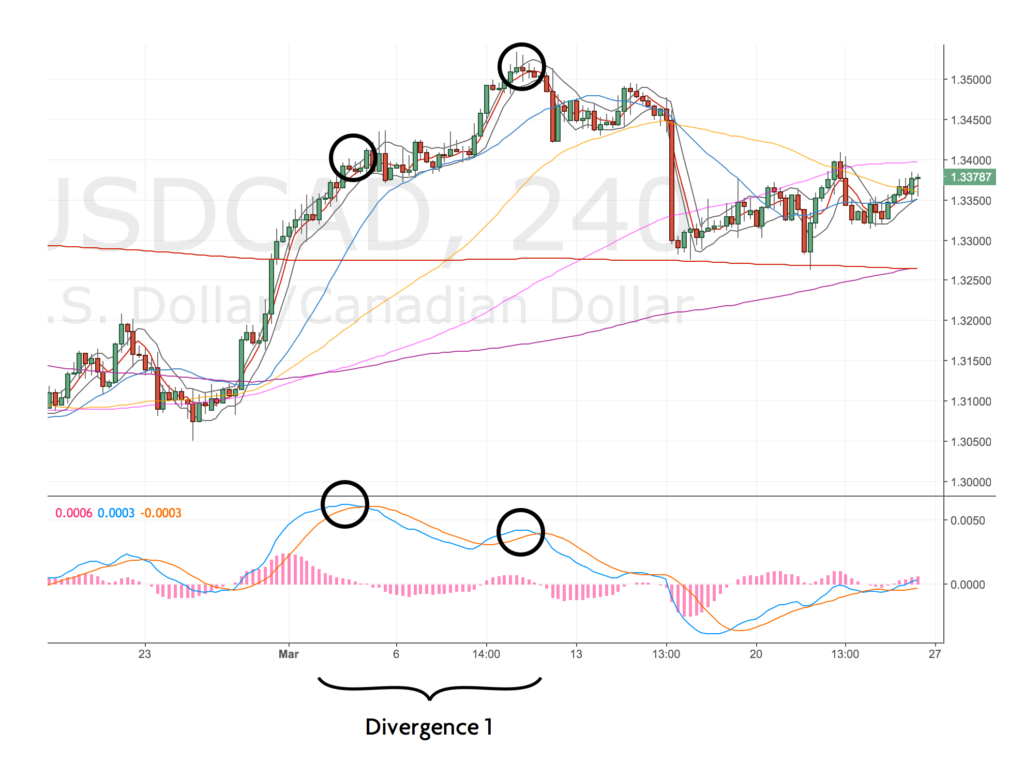
USDCAD 4H Chart – 24 Mar

USDJPY

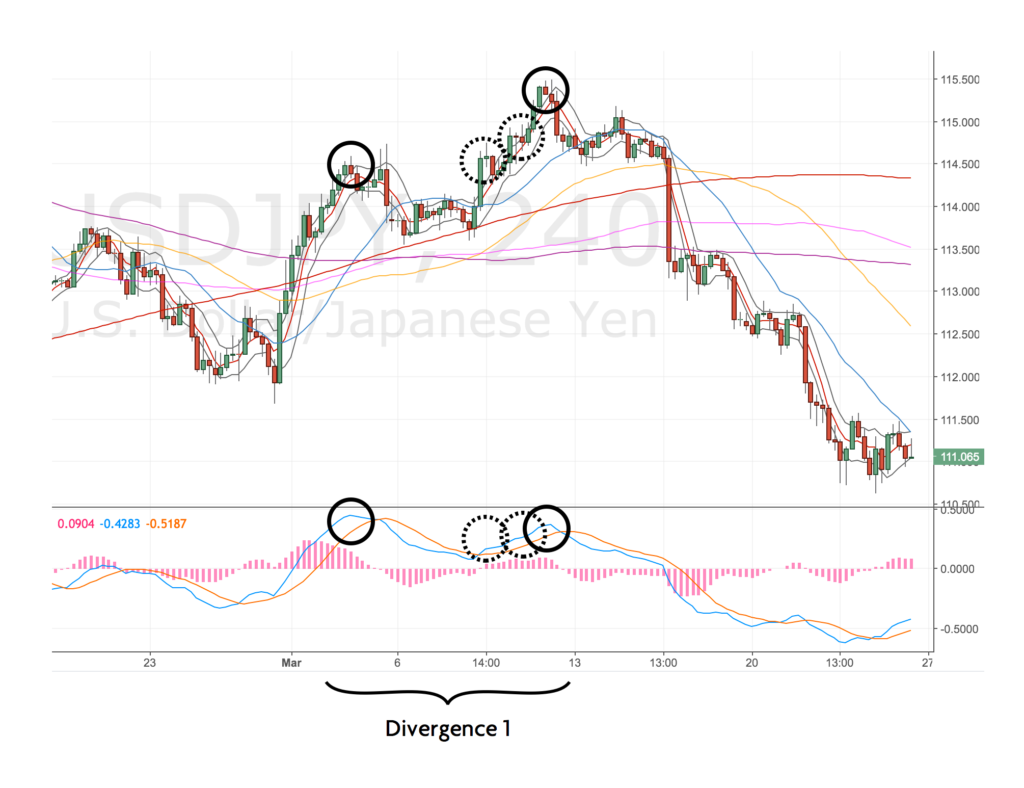
USDJPY 4H Chart – 23 Mar

XAUUSD

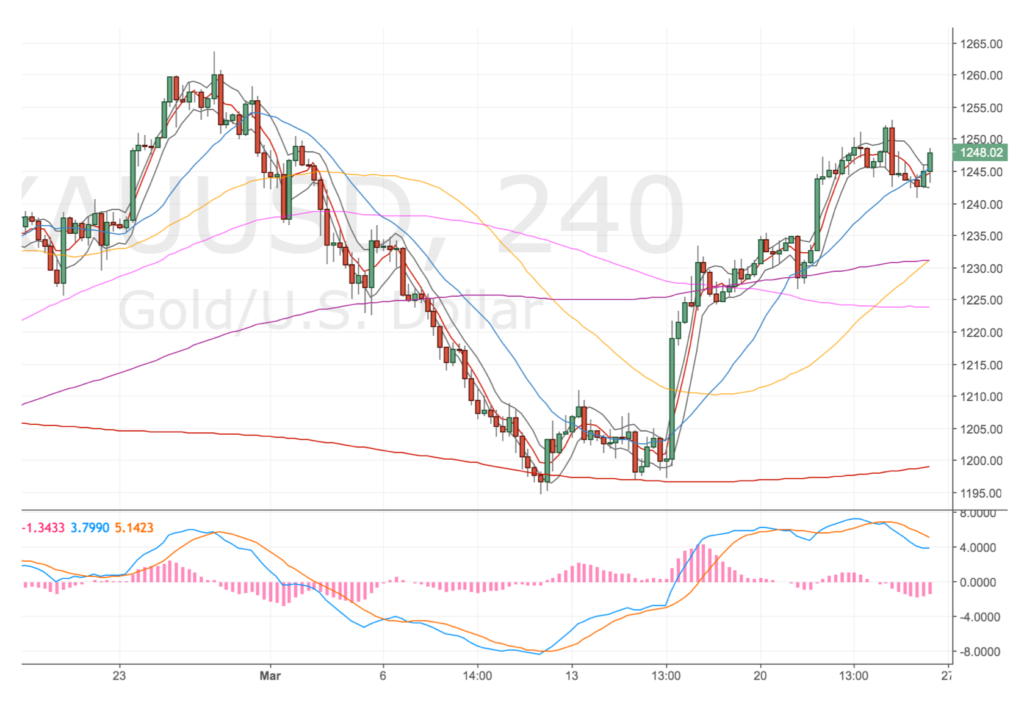
XAUUSD 4H Chart – 24 Mar

XAUUSD Daily Chart – 24 Mar

FTSE

FTSE 4H Chart – 24 Mar

FTSE Daily Chart – 24 Mar

Trade plan updates

I need to update the plan to include:

  • The change in markets markets
  • Revise my goals to be achievable for next month.
  • Add a section on routine (Morning, Lunch and Evening quick market reviews i.e. 10 minutes)
  • Start adding calendar reminders to review my plan at the beginning of each week
  • Set alarms to remind me to check the 4H charts when they are setting up
  • Get better at setting alerts

Dealing with losing trades

I knew there’d be a time when I’d need to write this and I think now would be a good time. Here’s some advice from various traders which are worth a watch/listen when I’m losing money.

The first thing to do after a series of losers

S.T.O.P.

  1. Step back
  2. Take time out
  3. Organise your thoughts
  4. Proceed

Take some time to reflect on what’s happened. Log and review my trades. Then go through the four Ms of trading. Did I:

  1. Manage the money: Didn’t risk too much, traded with a stop loss, was realistic with the entry and exit. The key is to always be able to fight another day.
  2. Manage the markets: Trading the right markets at the right time. Am I being realistic trading these markets? Are they too volatile? Am I stretching myself too much to cover those markets?
  3. Manage the method: Did I break my trading rules? Am I making a regular mistake? Am I being patient?
  4. Manage the myself: Am I supported? Am I well rested? Was my mindset in a good place? Was I tired, distracted or emotional? Are there identifiable trends in my own habits?

Putting a trading loss into context

The whole video is important to watch. Once you’ve reflected, forget about what’s happened and move on with your plan. Managing emotion is what will make me a good trader.

Not making progress

Experience in the markets is so valuable – if you can get a years worth of trading experience without loss, you’ve just gotten an education which didn’t cost you much.

When things aren’t going well don’t lose the faith. Self-belief is a really important commodity for a trader, build on your self-awareness and self-belief through analysis of your trades and visualising your trades.

Keep reviewing your trades, build on your self-awareness and identify any learnings – small tweaks will make the difference in the end. And remember trading gets easier the longer you do it.

Coming back from a drawdown

A drawdown can be a few weeks to a few months for a swing trade. The key is to keep trading – don’t stop trading, take a break if you need – but stay in the game. The most important thing to do is downsize the positions. Build up your track record and confidence, then increase the position again.

Coming back from a big trading loss

It’s possible to come back from big loses, take time out to put a plan in place, then start again. Expect it to take a long time (maybe years) to come back from.

EURUSD DST Short – 16 Mar


Account Risk: 0.7%
Short: 1.0709
Stop: 1.0757 (48 pips)
Target: 1.0618, 4H 50MA (90 pips, RR 1.95x)
Mindset: Keeping the faith

Update 1 – Stopped out – 16 Mar

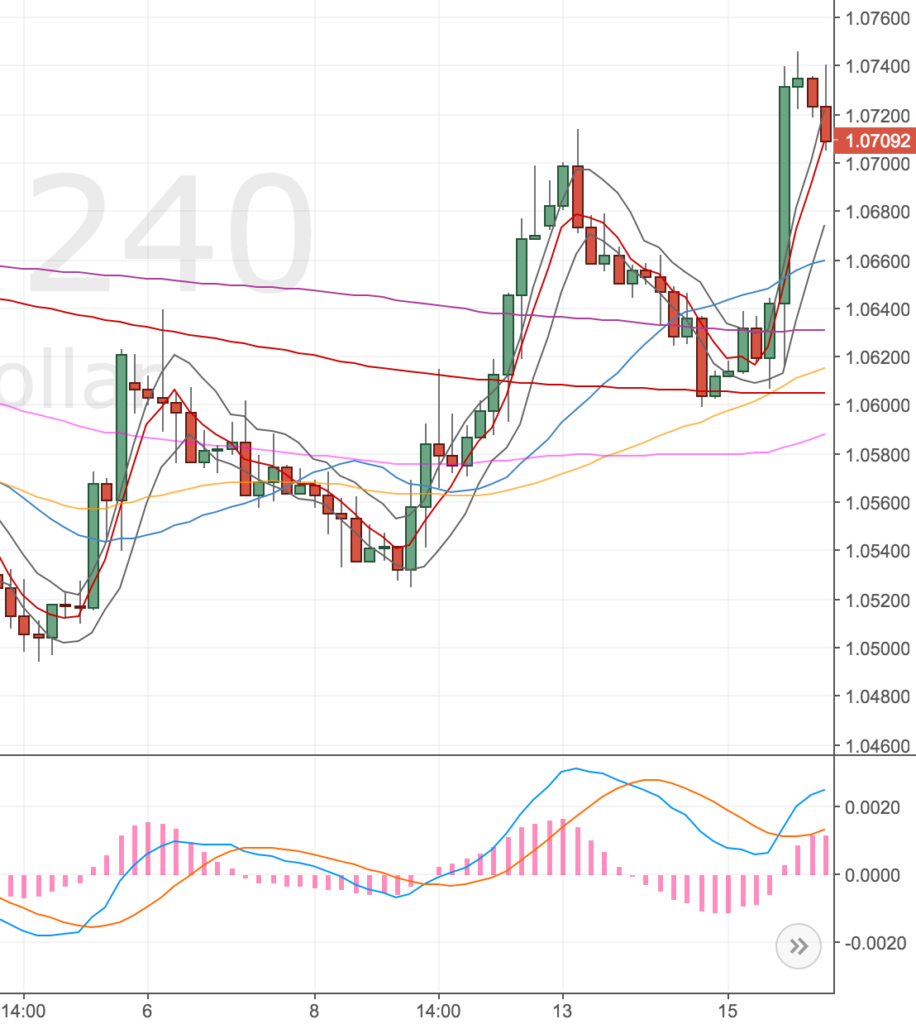
Saw this short set up this morning. Prices have been rallying higher since the Fed rate decision, so decided to take the short. My mind is awash with reasons to not take this trade but I’m trading the system! So it’s a short from here. Here’s the set up.

4H Chart – the set up

EURUSD 4H Chart – 16 Mar

I’m hoping for the 50MA – it’s a fair target if it works out.

Update 1 – Stopped out – 16 Mar

Just got stopped out of this trade. I don’t really think there’s much more to say on it, it’s one of those things. Another loser to add to the list. I really need to work on maxing out my winners! At the moment they are all pretty even in size so I’m net down after these losers and trading costs.

EURUSD 4H Chart – 17 Mar

AUDNZD DST Set up – 14 Mar


Account Risk: 0.5%
Long: 2x 1.0936
Stop: 1.0969 (33 pips)
Tgt 1: 1.0875, 4H 50MA (61 pips)
Mindset: Reluctant

Update 1 – Stopped out – 15 Mar

This sums up how I’m feeling about this.

Ugh. I guess I should take this trade then.

I didn’t really want to take this trade, the AUDUSD and NZDUSD are very similar in price action and the AUDNZD is low volatility. However, I’m about trading set ups that I see rather than trying to be clever with my opinion and entries.

It’s another thing I’ve been wondering for a while – when looking at a trade you ideally want to be trading a weak vs a strong currency. The AUD and NZD just seem to be very similar and price action between the two seems marginal.

Here’s the set up …

4H chart setup

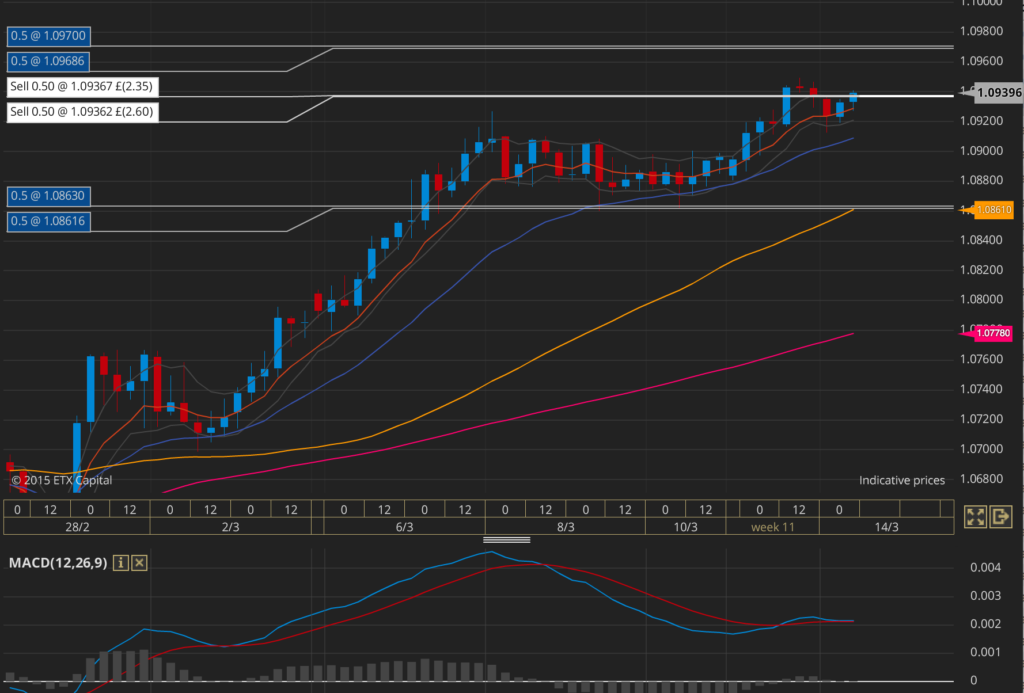
AUDNZD 4H Chart – 13 Mar

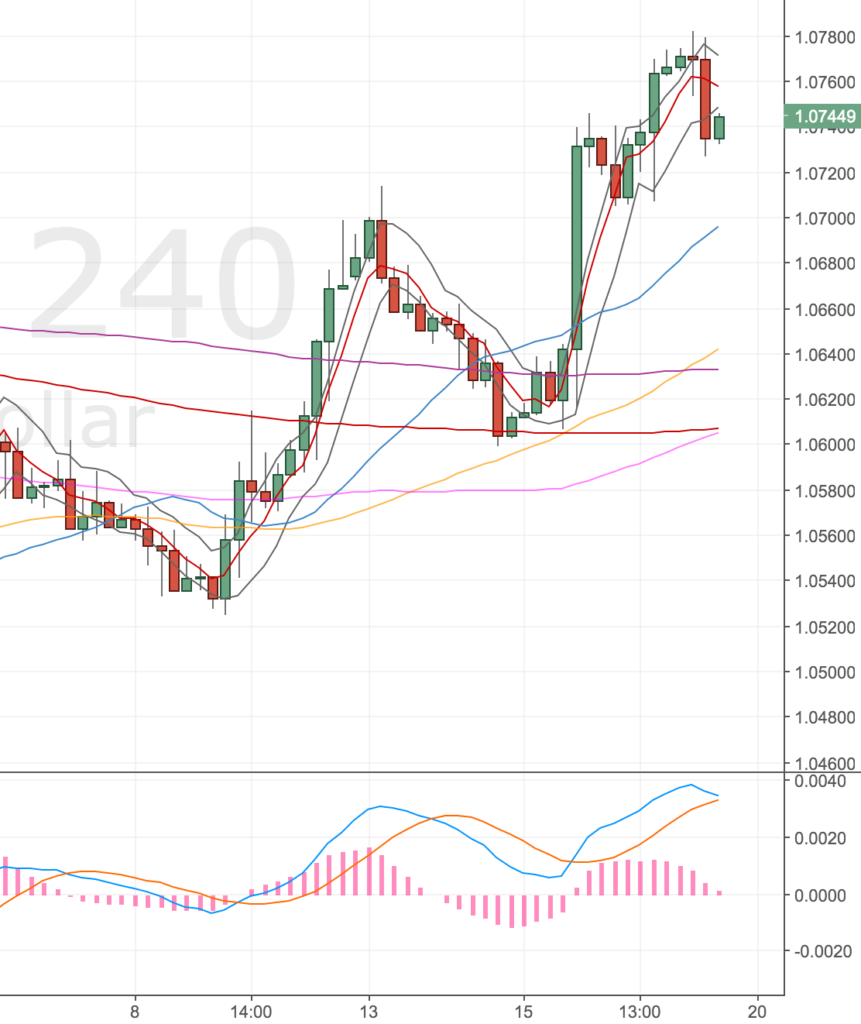
It’s actually a nice entry – price has diverged, inside the bands and is now testing the upper band. So I am happy with the entry.

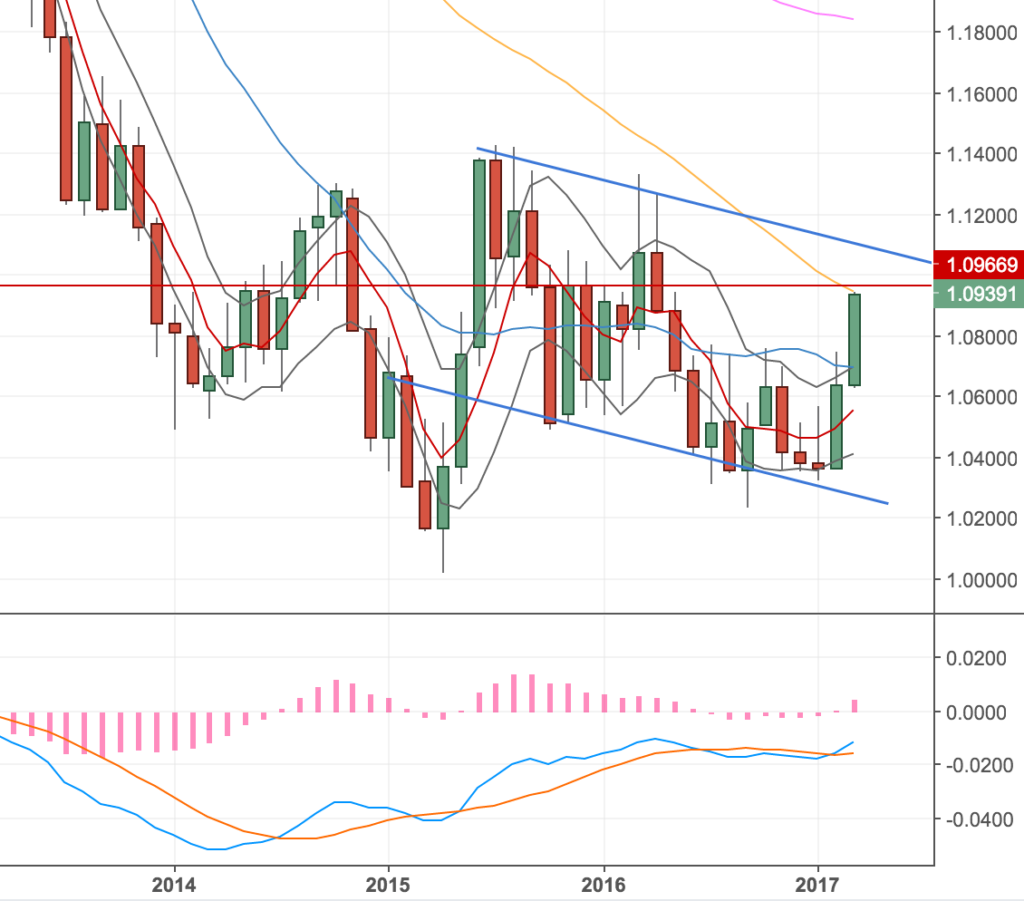
I’ve looked at the higher timeframes and there’s nothing to suggest to me that price would stop it’s trend higher with maybe the exception of the month which has run into the 50MA. However MAs are soft targets in my mind. Price often chops around a MA.

Monthly chart

AUDNZD Monthly Chart – 13 Mar

Will see how it plays out – at least the entry is good.

Update – Stopped out – 15 Mar

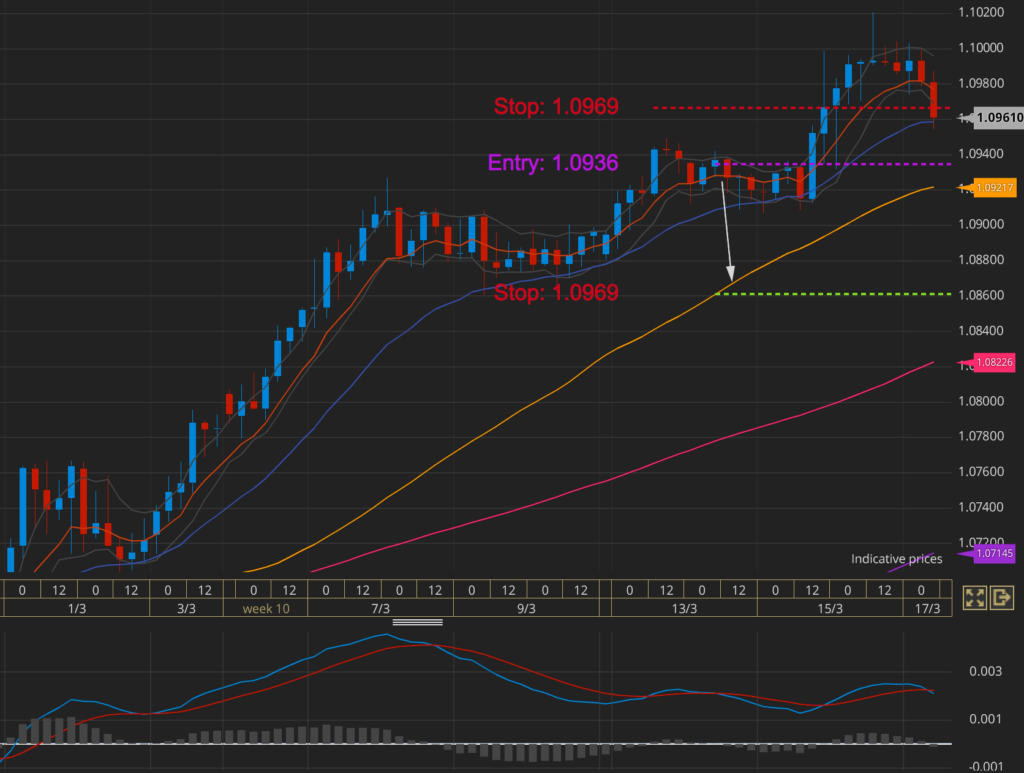
Just got stopped out of this trade. Price moved higher off the back of the Kiwi Q/Q GDP figures which took me out. The expectation was a growth of 0.7%, the actual was 0.4% – quite a big miss. After being taken out price then continued to move higher for a few bars.

AUDNZD 4H Chart – 16 Mar. Was my slope of hope 🙂

Frustratingly I see I’ve missed another entry which looks like it might work out. This goes back to my trading plan. Not being consistent enough with my trading time. If I’m not routinely checking the charts at set times I miss trades/opportunities. At the moment I’m just catching the losing trades!

Need to add this to my trading plan. I might try a different timeframe that suits my day-to-day.

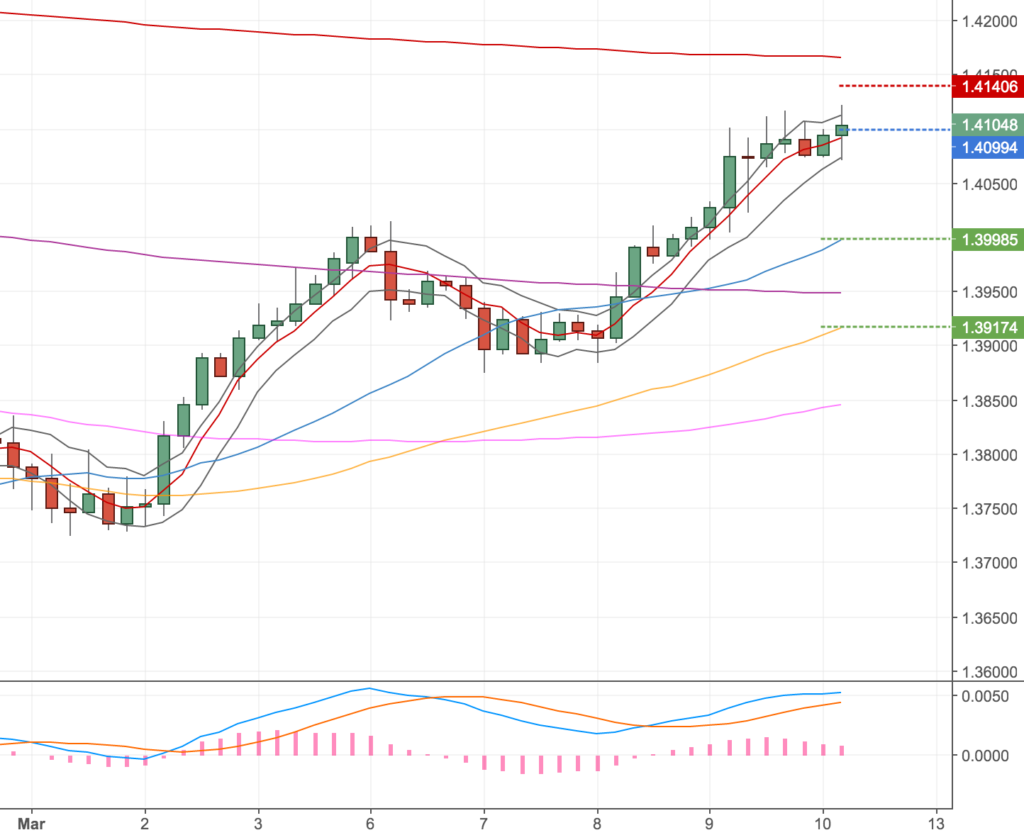
EURAUD DST Short – 10 Mar


Account Risk: 0.6%
Long: 2x 1.4096
Stop: 1.4138 (42 pips)
Tgt 1: 1.4026, 4H 20MA (70 pips, 1.66RR)
Tgt 2: 1.3930, 4H 50MA (166 pips, 3.95RR)
Mindset: A little unsure, as it’s NFP day, what effect we might see

Update #1 – Stopped out – 10 Mar
Update #2 – MA distortion – 13 Mar

A little unsure about this DST set up, the € is setting up short on a few markets and this one looks like the best set up to me. It’s NFP day so it’s nice to be in a market that shouldn’t be affected, however if the € reacts well I’m guessing it’ll follow through on to this market.

The AUD$ also looks to be bottoming out against the $. At the back of my mind is the question of whether I’m shorting the wrong pair. In hindsight, should I be shorting the EURJPY instead?

I’m currently long the EURUSD too and the price action has been pretty good so I’m hoping for a move higher on that market. So maybe this is stupid trade to take – who knows, not me that’s for sure.

Here’s the set up.

4H Chart – the set up

EURAUD 4H Chart – 10 Mar

It’s not perfect, price seems to have drifted into the bands, but the setup occurred overnight and I’m all about trading what I see.

The daily and weekly charts look bullish to me. So I set up my targets for the 20 and 50 MA. I noticed that the 500MA is nearby (like my AUDUSD set up which I didn’t take) but MAs often get air-kissed so I may or may not get stopped out.

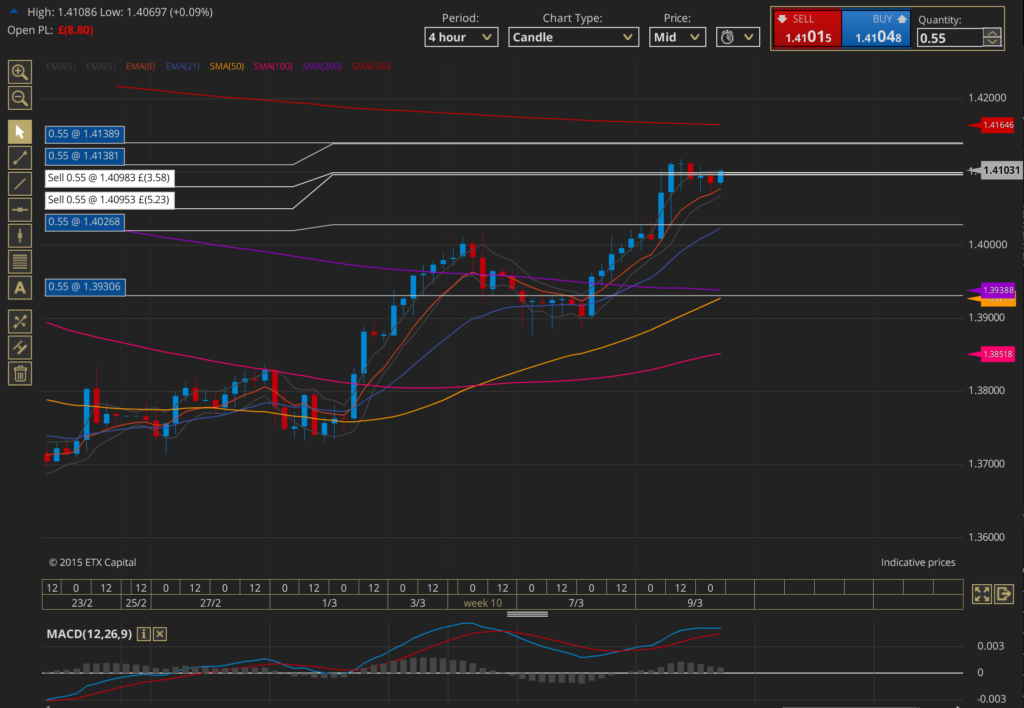
EURAUD Position – 10 Mar

Update 1 – Stopped out – 10 Mar

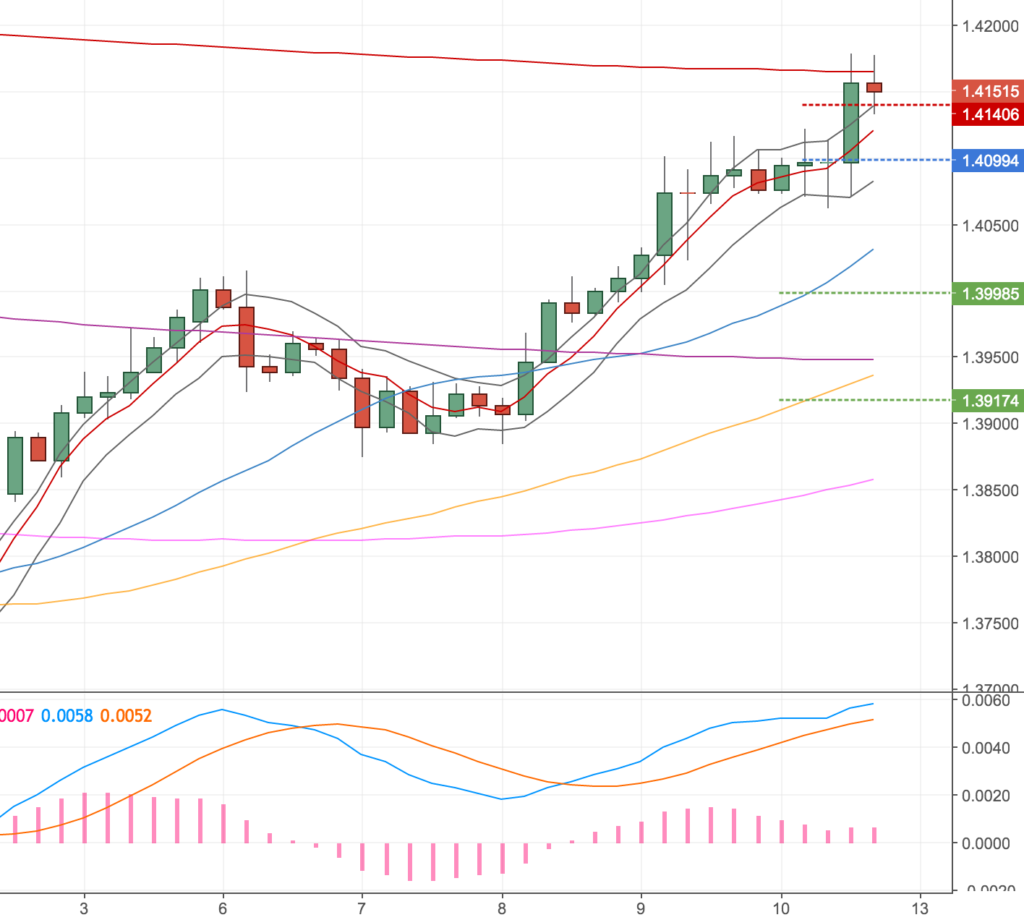
Got stopped out after NFP, the € was strong and jumped up to the 500MA. I don’t think there’s much more to say on the trade. Win some, lose some.

One thing I would say is I got pretty tense pre-NFP and I really have no idea why. I guess I had a lot of positions on (for me)? My FTSE trade has come right against me – hopefully this is just a swing up to go lower – higher interest rates are bad for equities so maybe the Fed rate decision might ripple through to the FTSE?

EURAUD 4H – 10 Mar – end of day

Update 2 – MA Distortion – 13 Mar

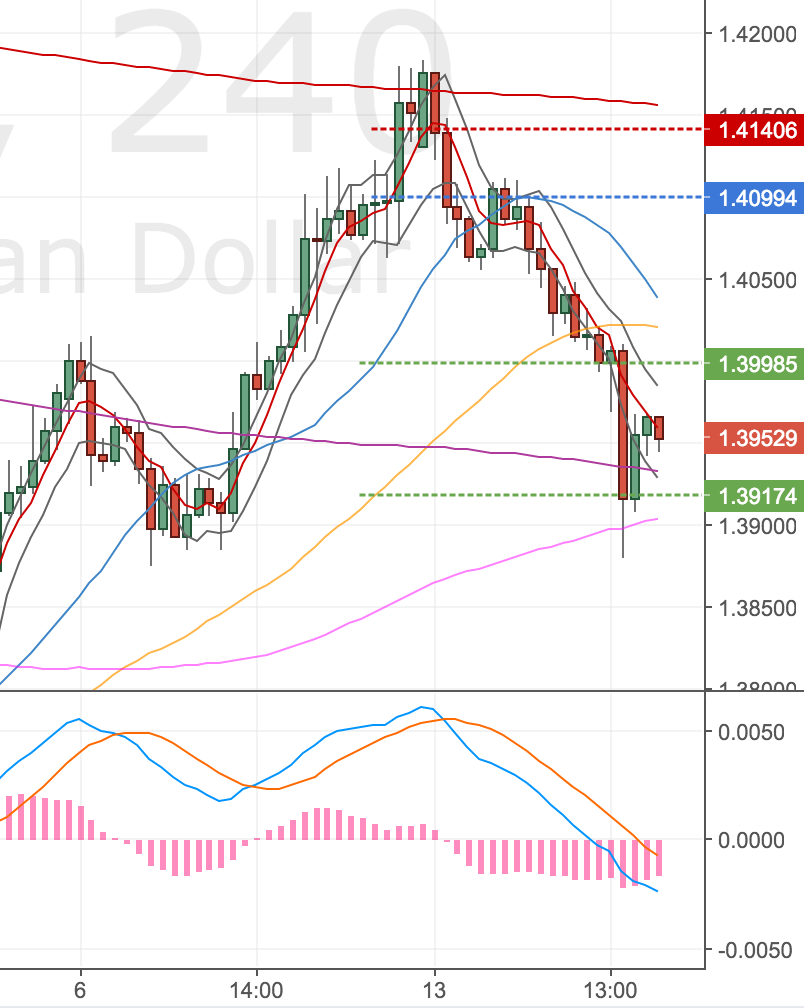
Just wanted to check back on this and see how price action developed. Although the divergence didn’t work out; as price moved up to test the 500MA; it did work itself lower. I’ll keep an eye on this just to see how it develops further.

EURAUD 4H Chart – 13 Mar. The lines show my entry (blue), stop (red) and targets (green).

I notice this kind of divergence distortion on my monthly reviews and I think it could be included in divergence set ups (as marginals to allow). I’ll see how it develops over the next few months.

Update 3 – MA Distortion cont’d

Just another note on the trade, it did make target. I appreciate this is just anecdotal evidence at the moment, but I will keep an eye on this pattern in the future too. Here’s the final chart.

EURAUD 4H Chart – 16 Mar. Lines were my ORIGINAL targets.

GBPUSD DST Long – 9 Mar


Account Risk: 0.4%
Long: 2x 1.2160
Stop: 1.2110 (50 pips)
Tgt 1: 1.2285, 4H 50MA (125 pips)
Tgt 2: 1.2376, 4H 100MA (189 pips)
Mindset: Not too smart, given the upcoming news events

Update 1: Added to position – 10 Mar
Update 2: Closed first unit – 13 Mar
Update 3: Stopped out – 14 Mar
Update 4: Missed a set up through lack of routine – 14 Mar
Conclusions

This pretty well sums up how I feel about taking this trade! In a word; crazy.

It’s my second crack at this. Last time I was in two minds about taking a long GBPUSD, this time the indecision is worse! I saw this tweet yesterday about next week’s fed rate decision.

100% odds of a rate hike?

And the ADP figures out yesterday were strong, a new high since Sept 16. So in my monkey brain it feels totally stupid. Surely it’s an odds on certain that the GBPUSD is heading lower. But this is all known news now, so I just wonder whether this is all priced in (and nothing is 100% certain). I can’t say for sure, but I’ve decided to go in with a smaller position size and find out. So yeah, Wile E. Coyote pretty well sums up how I feel.

Here’s my trade:
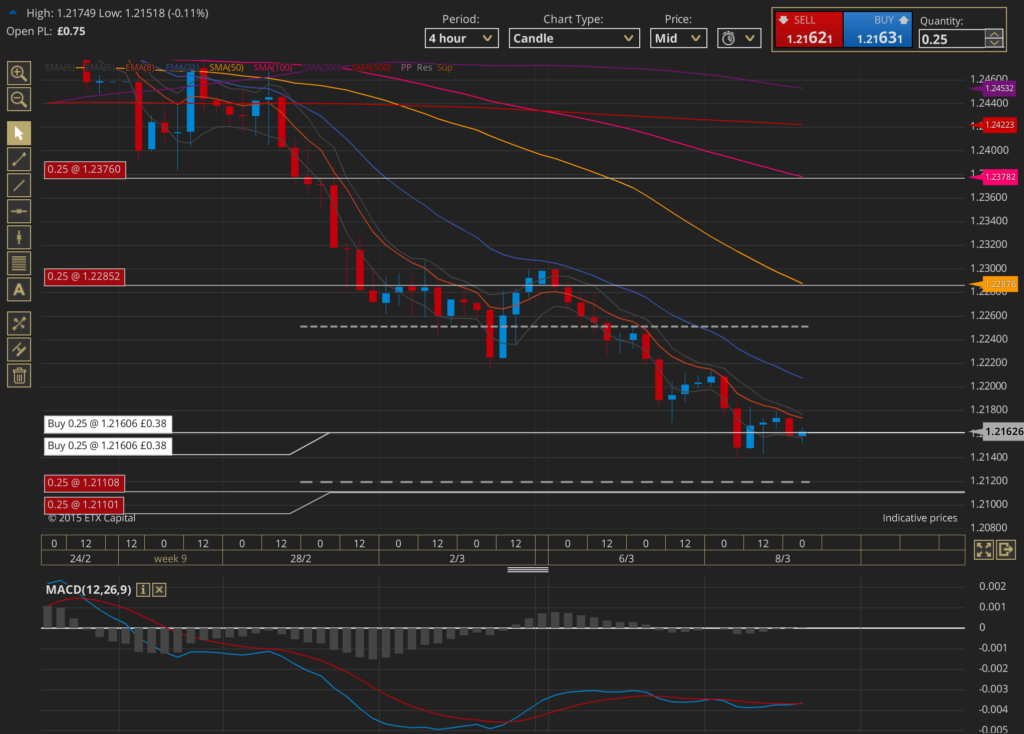
GBPUSD 4H Chart – 9 Mar

I put my stop the other side of the monthly S2. Targets are quite a bit greedy again, T1 is the 50MA and T2 is the 100MA despite the 20MA not being tested for a while, it has been previously tested 2 times before. So I’m going for a bigger move. My analysis says the GBPUSD could go much higher, but I want to trade the strategy as designed. There’s no divergence on the daily chart.

Added to position – 10 Mar


Account Risk: 0.6%
Long: 3x 1.2160
Stop: 1.2110 (50 pips)
Tgt 1: 1.2243, 4H 50MA (83 pips, 1.66 RR)
Tgt 2: 1.2351, 4H 100MA (191 pips, 3.82RR)
Tgt 3: 1.2417, 4H 500MA (257 pips, 5.14RR)
Mindset: Uncomfortable, still experiencing the emotional rollercoaster, but coping with the position.

I’ve survived the NFP results and price didn’t budge much on the GBPUSD, however my Euro position did get to it’s ambitious target so I was able to add to my GBPUSD position to bring it up to the target £50 risk level and not overly expose me to the Dollar.

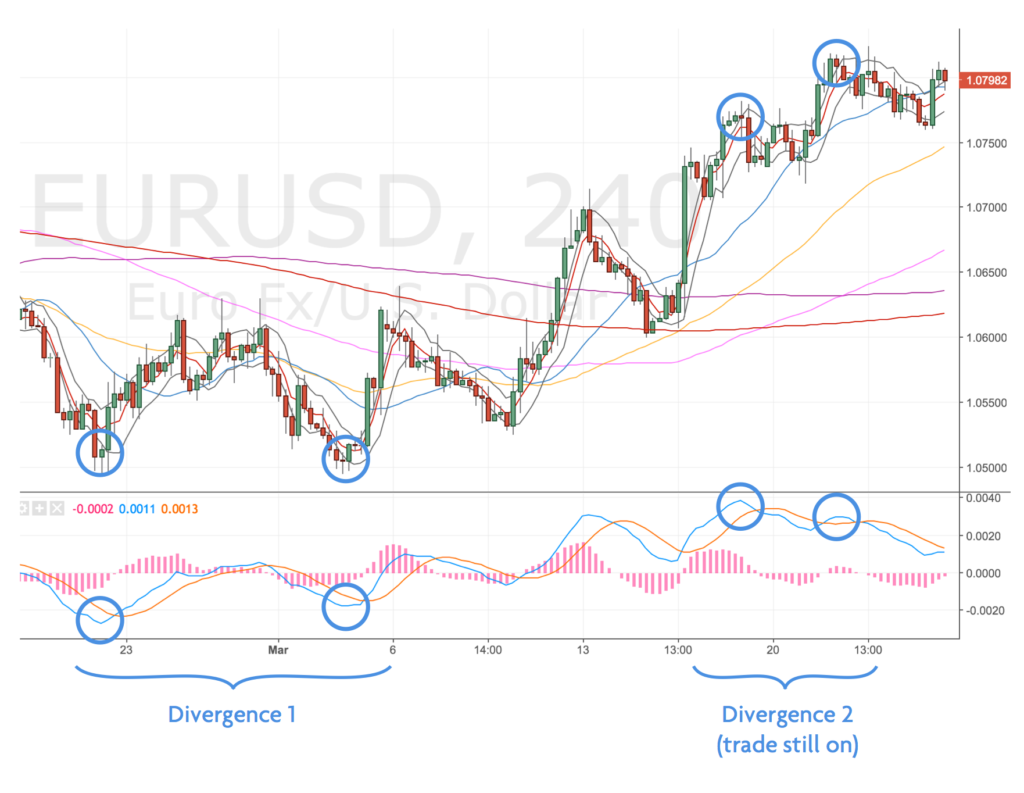
Part of this decision was the rising MACD on the hourly chart – showing a double divergence. It might be a triple divergence but there’s quite a bit of price action going back quite far.
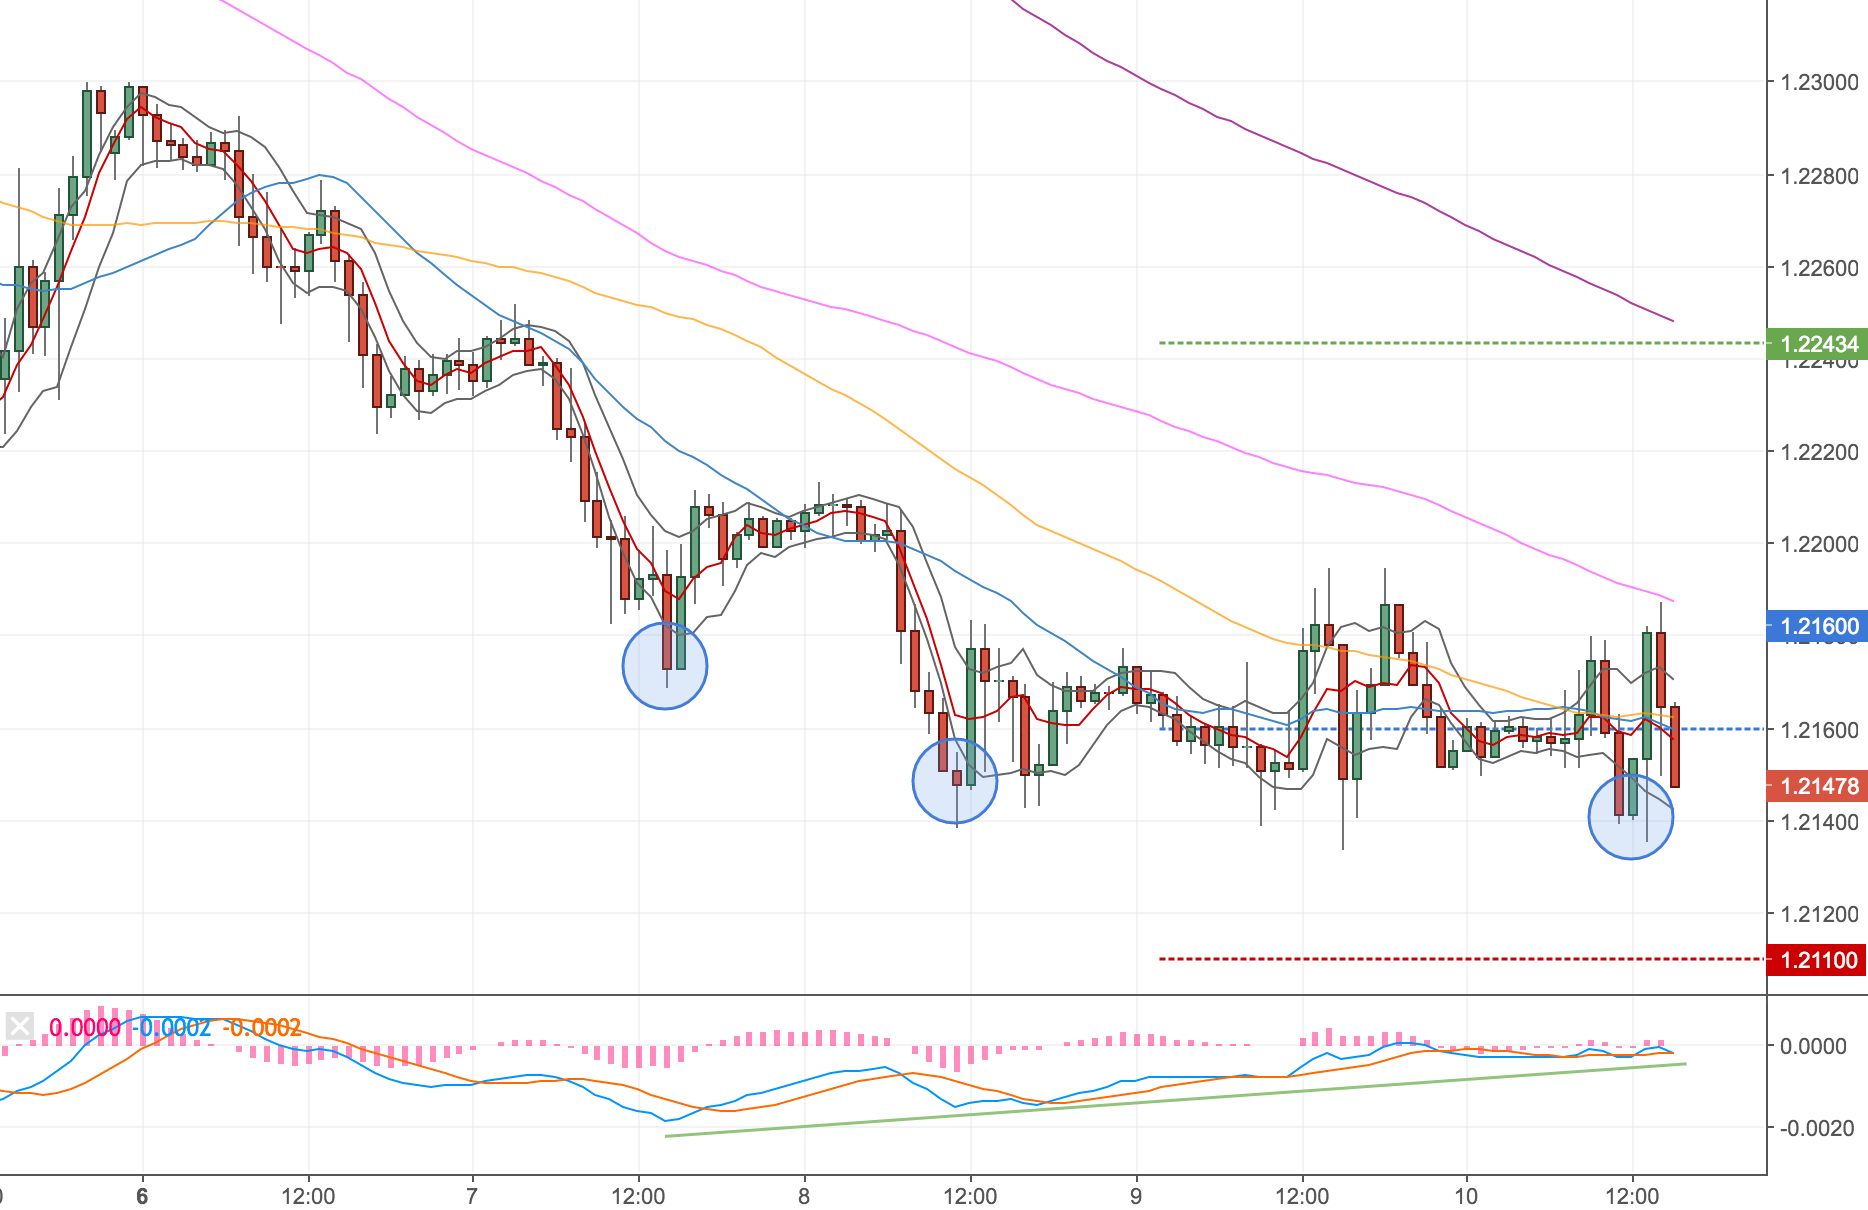
GBPUSD 1h Chart – 10 Mar

Given the Fed rate decision due next week – I’m not expect this to do much. Ideally it would trend up and give me some margin for a retrace if fed does decide to raise rates.

Here’s the inflation rate and interest table for interest.
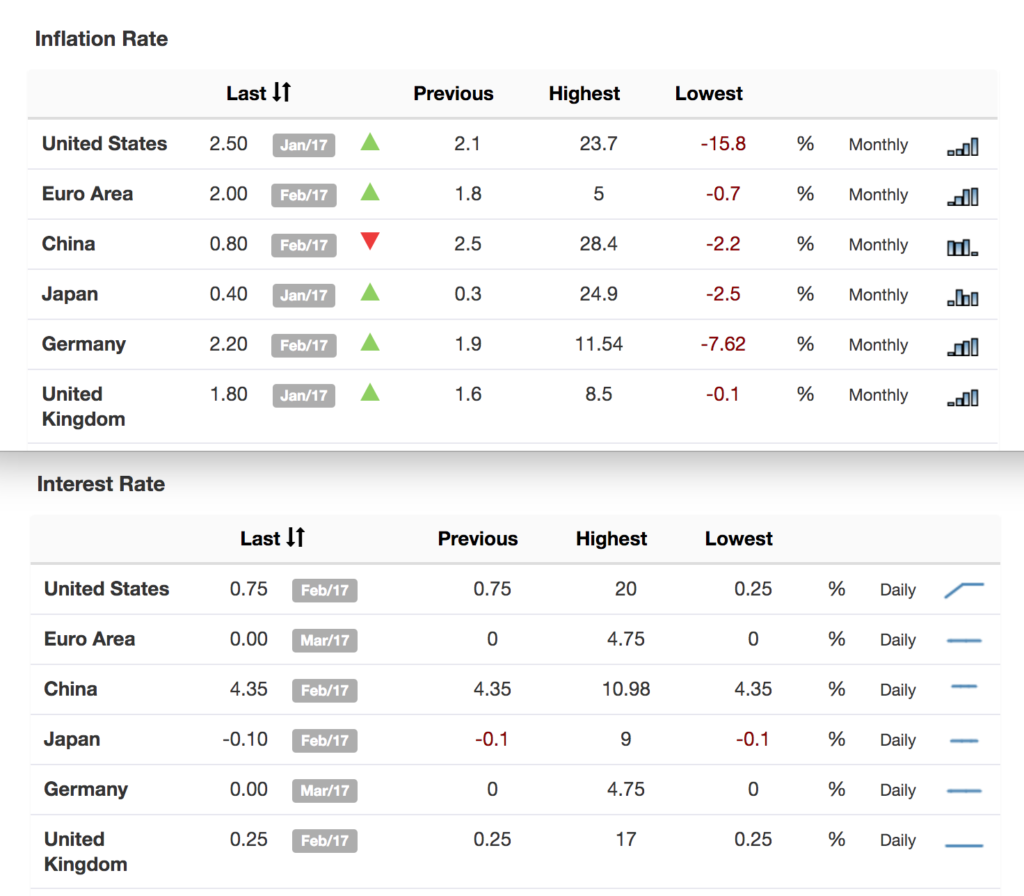
Trading Economics Interest Rates and Inflation numbers

Here’s the CME markets prediction of a rate rise on Weds. Interestingly the bulk of the expectation is for 0.75 – 1% increase! Seems a bit bold to me, I wonder if we are due a disappointment and it’ll be a smaller hike 0.25%.
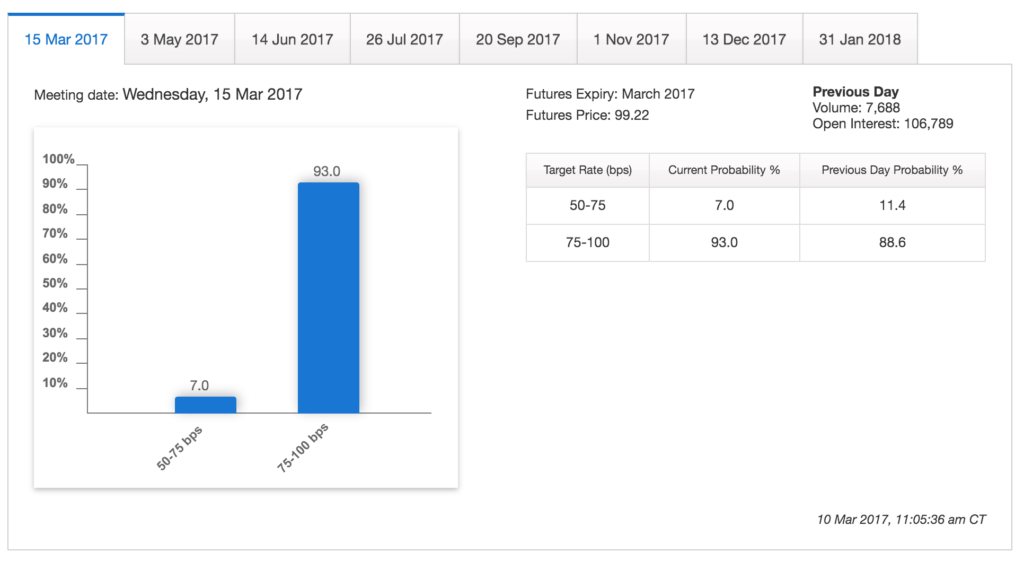
CME Fed Rate Decision Odds

Hit my first target – 13 Mar

Price ran up to my first target this morning, fortunately I saw it so could close my position. I didn’t update my targets overnight so I had to manually close my position. Not great – again poor routine. When I’m at home I want to be focussed on family, so I need to sort out my routine away from home and work, so that I am free to trade when I need to. I’m thinking I’ll drop into the local library on the way home from work and try and drop into a cafe on the way to work.

Stopped out – 14 Mar
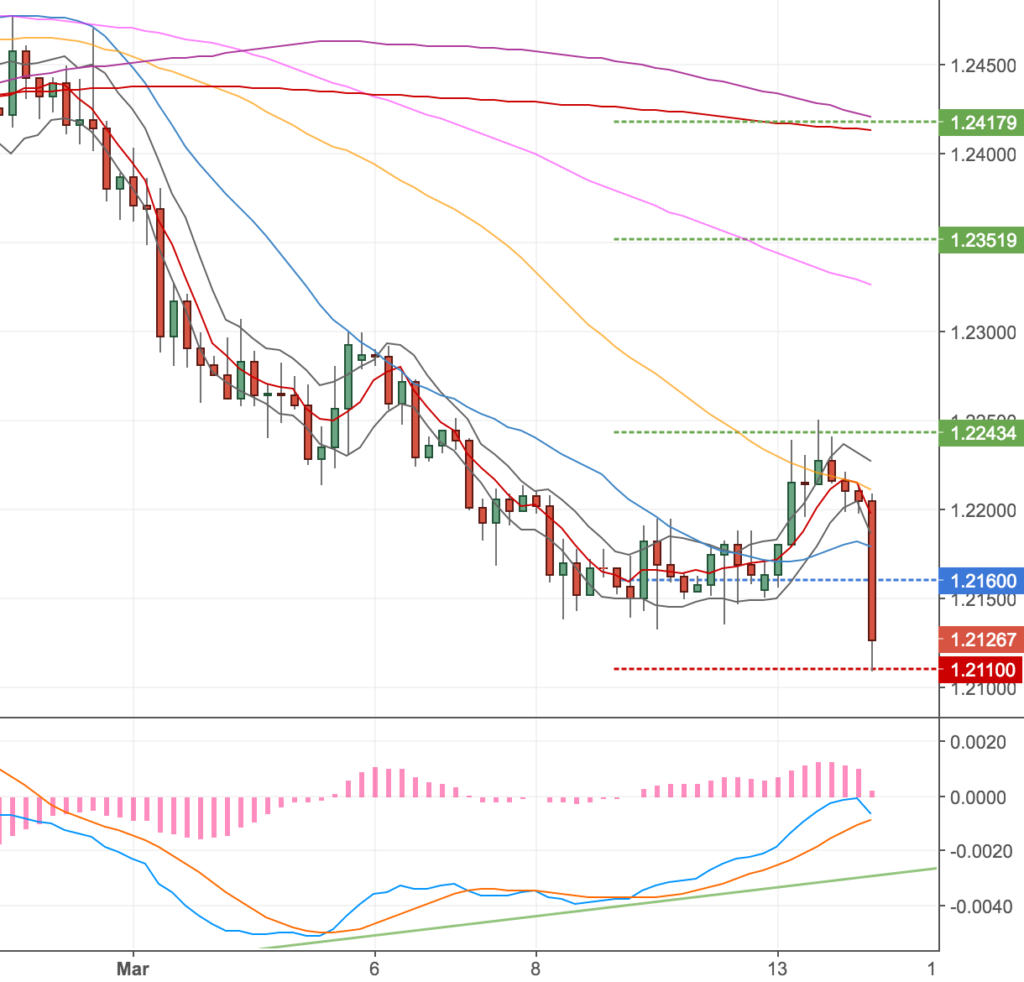
GBPUSD 4H Chart – 14 Mar. Green line was my original target, I exited slightly earlier.

Update 4 – Missed a set up through lack of routine – 14 Mar

Just a quick one, I was looking at the charts late last night scanning for set ups and saw this on the GBPUSD.
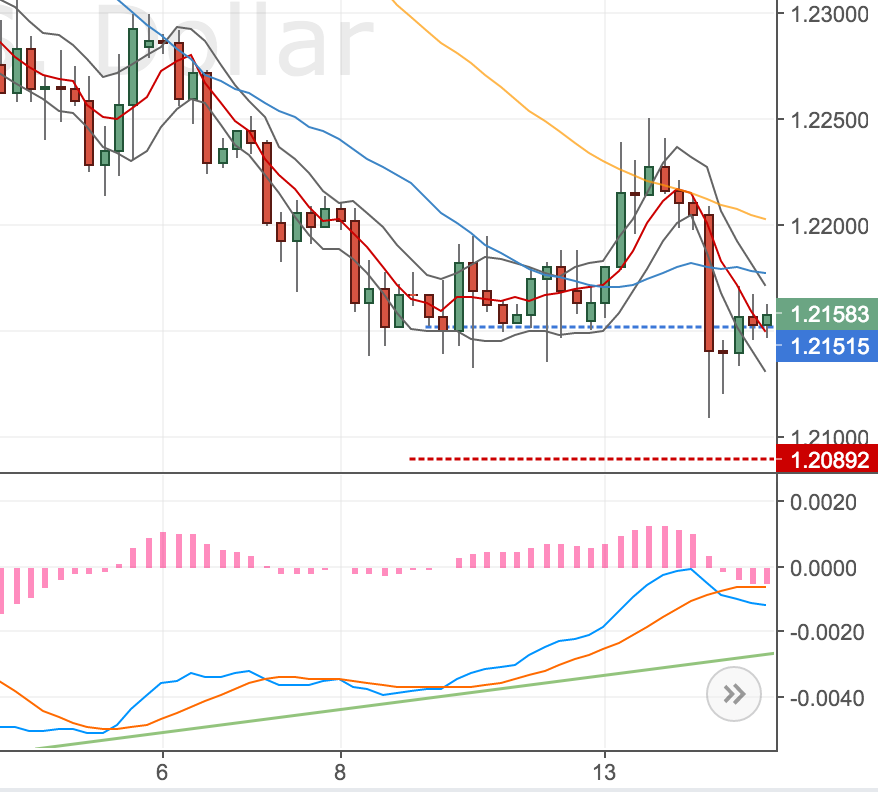
GBPUSD 4H Chart – 14 Mar. DST set up – double divergence ahead of Fed Rate Decision.

I decided not to take the trade because it was late and I was wrecked from house renovation plans, the target didn’t look that juicy and the fed rate decision was tomorrow and I was nervous (probably the biggest factor). I felt it would probably end up being a loser but I should look at it again tomorrow after some sleep and make a decision.

Well it popped higher at about 6am (of course it did) and it would’ve made for a quick winner straight-through the 50MA. Previously tested though. The 100MA is still in sight (it’s a double divergence now!) so I am not setting alerts for pull-backs into my range to get long.
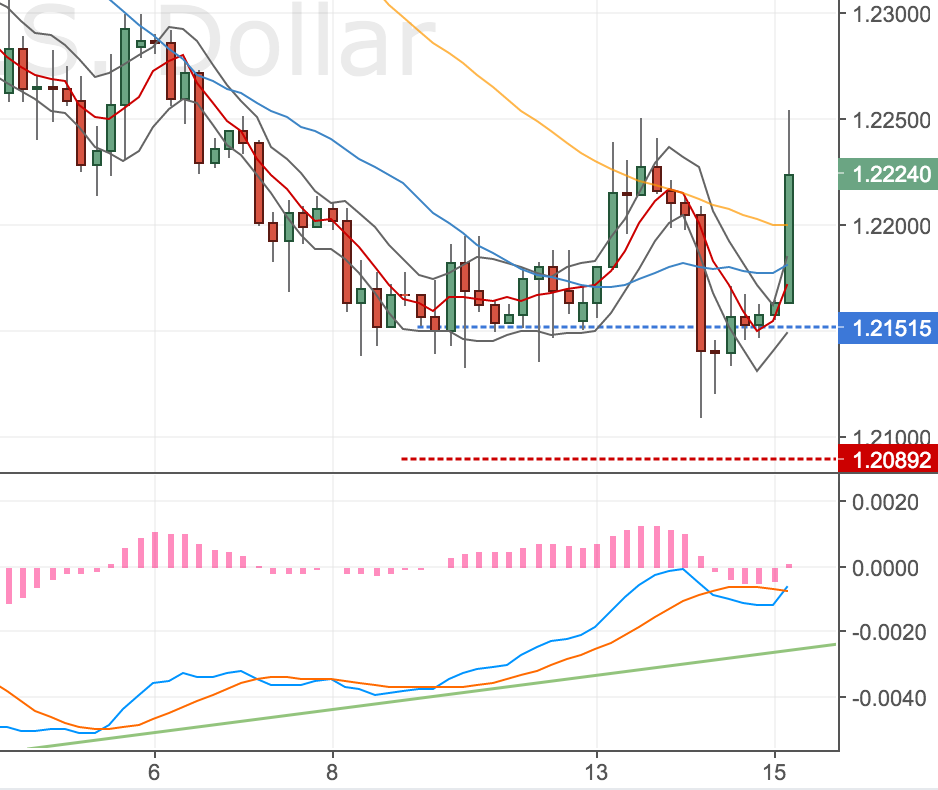
GBPUSD 4H Chart – 15 Mar. DST Set up has popped higher this morning.

Charlie said to me on our last call – forget about the news, you didn’t back test this with knowledge of when news was due. Expected news is also priced into the market – so perhaps this trade would be a win win what ever happens? No rate hike (GBP goes higher – much higher), rate hike as expected (short term volatility and then a pop higher for the GBP), rate hike smaller than expected (GBP goes higher).

Everything is always clearer in hindsight!

Conclusion

I don’t like to make changes on the back of one trade, however I’ve been thinking a couple of things for a few weeks now:

  1. My position size is too inconsistent. I’m downsizing on trades that win and trading fuller size on trades that lose. From now on I’ll aim for all trades to be 0.7% risk, until I get some consistency – no stress, win or lose.
  2. My targets aren’t realistic. I split my entries but I think I’m often looking for too much out of my trade targets, only closing a small position at my first target. I think this should be the other way around (i.e. close the bulk of my position and try and run a smaller position.)
  3. My stops are too big. I’ve always traded with larger stops however I am thinking it’s actually better to get stopped out and re-enter the market at a better level. Once a winner works out the better entry should help claw back some of the stop losses.

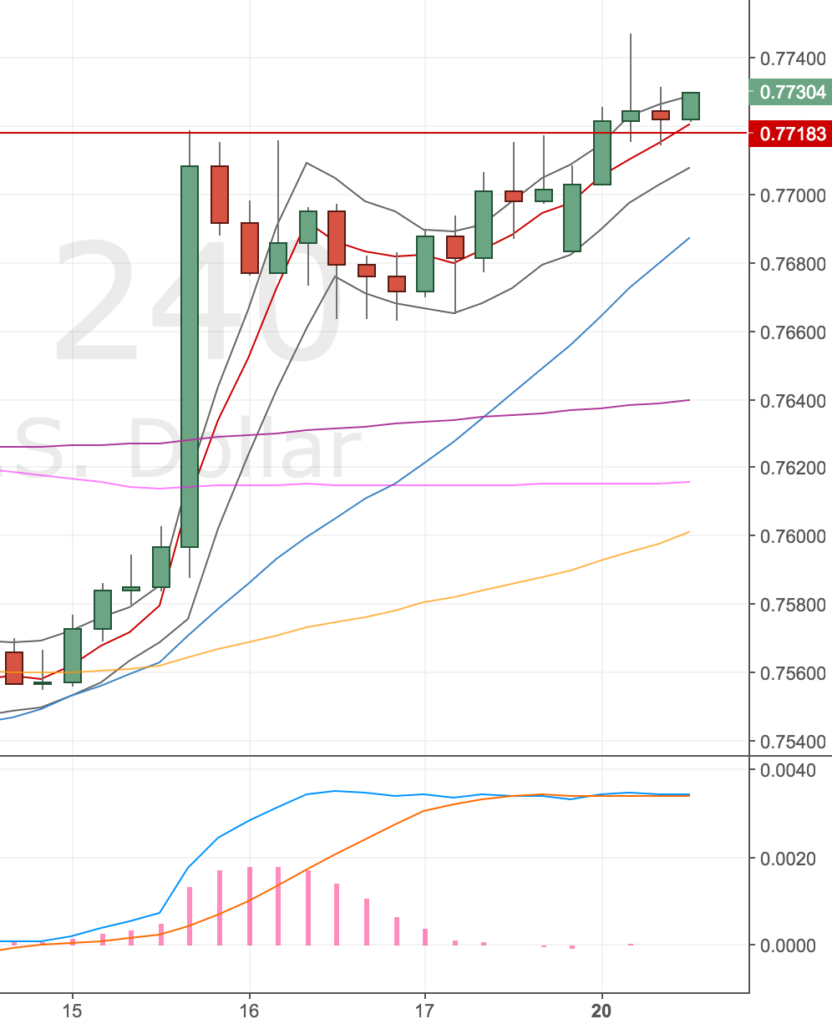
GBPUSD DST Long – 8 Mar


Account Risk: 0.6%
Long: 3x 1.2206
Stop: 1.2149 (57 pips)
Tgt 1: 1.2326, 4H 50MA (121 pips)
Tgt 2: 1.2395, 4H 100MA (189 pips)
Tgt 3: 1.2428, D 20MA (222 pips)
Mindset: Fine – maybe a little greedy

Update #1 – Stopped out – 8 Mar

Was in two minds to take this trade or not. The budget is the following day and the NFP numbers are due out Friday. So I could see some volatility coming into this position and needlessly stopping me out. However, I figured the budget would be a slow news event (as it lasts several hours) and the NFP was still two and a half days away. So I decided to go for it.

I see potential in the GBP to move higher. On my daily scans the GBP is setting up on several pairs. None are quite diverging yet but the GBPUSD has this 4H divergence in play.

4H Chart set up

GBPUSD 4H Chart – 7 Mar

The daily chart also looks really good to me to get long.

Daily Chart

What I like about this chart is the long term double divergence from Jul 16 -> Oct 16 -> Jan 17. Although now doesn’t look like it will set up for a triple, I wonder if price will now retrace to the 76.8% fib level and move higher?

So I decided it was better to be in the trade now, ready for any rallies higher should they occur.

Update 1 – Stopped out – 8 Mar

Well looks like I read this wrong. Price often seems to drift into the bands overnight and for price action to continue where it left off the next day. I don’t have enough trades under my belt to prove it, but I will certainly keep an eye on it.

I’m actually a bit frustrated about this a few things are on my mind:

  • Should I have set a tighter stop? So I waste less money trying be on a move.
  • Should I have waited for a better level?
  • Are all my trades now correlated (EURUSD, FTSE and GBPUSD)?
  • The chancellor is going to make me pay more tax

I decided to walk away from the computer and meet some friends for lunch. I think this helped me get some perspective on the situation, I’m still keen for another crack at this if the 4H continues to diverge but for now I’m on the side-lines. I can definitely feel the rollercoaster of emotions when I trade, have three positions on unusual for me and I’m not that rock-solid about losing trades yet.

Better goal setting & position sizing

Update: Comments from Charlie

Up until recently, my goals have been set pretty loosely. Currently (Feb 17) my goals are:

  • This month: be consistent trading my strategy
  • This year: get my account to £10k
  • By 40 (5 years): get my account to £100k (this seems light years away right now. The account that is not the age 🙂 !)

If I’m ever going to make the journey to professional trader, I need to get a little more focussed about it. Given I’m swing trading I’m happy to review progress on a monthly basis but my monthly targets could do with being more specific.

Time to get compounding

Compound interest is the eighth wonder of the world. He who understands it; earns it. He who doesn’t; pays it.Einstein

Compounding returns is where it is at. Safely using leverage, limiting my risk and compounding any returns I make is the only way I believe I can achieve my goals. For now I’m just going to focus on this year’s goal. (I’ll worry about the 5 year one later.)

To get to 10k in the next 10 months (end of this year) I need to be aiming for the following targets.

MonthStarting balanceMonthly profit% ReturnTotal profitEnding balance
March£7,070.00 £250.993.55%£250.99£7,320.99
April£7,320.99 £259.893.55%£510.88£7,580.88
May£7,580.88 £269.123.55%£780.00£7,850.00
June£7,850.00 £278.683.55%£1,058.68 £8,128.68
July£8,128.68 £288.573.55%£1,347.24 £8,417.24
August£8,417.24 £298.813.55%£1,646.06 £8,716.06
September£8,716.06 £309.423.55%£1,955.48 £9,025.48
October£9,025.48 £320.403.55%£2,275.88 £9,345.88
November£9,345.88 £331.783.55%£2,607.66 £9,677.66
December£9,677.66 £343.563.55%£2,951.22 £10,021.22

So for March (this month) I’m aiming for 3.55% return. Oooff, feels like a mountain to climb; especially with my current position sizing (0.5 – 0.7%) and some months will yield next to nothing in reality.

However, knowing the percentage is great for me because it means I can forget about the P&L and just focus on a percentage return. Some months I’ll make more, some months less.

So how much do I need to make per trade?

What I wanted to work out next was given a 0.7% risk on a trade how much RR (Reward to Risk) do I need to aim for to bring in the bacon. Here’s the crude / roundabout way I worked that out.

    \[ Exp. Rtn = Risk ((n_W * RR) - n_L) \]

Where:
Exp Rtn = Expected month end profit (in £s)
Risk = Position size (in £s), equivalent to 0.7% of the account balance
n_W = Number of winners
n_L = Number of losers
RR = Reward to Risk ratio

I know the return I am aiming for (£255); so I need to calculate what RR I need to aim for on each trade to achieve this return. So rejigging the equation.

    \[ RR = (\frac{1}{n_W}\))(\frac{Exp. Rtn}{Risk}\ + n_L)\ \]

Last month there were 24 DST set ups. Assume we average around 20 set ups per month, of which, we can catch 12 of them (around 2/3rds) and my win rate is around 50%. Then my expected return for the month would be …

    \[ 1.85 = RR = (\frac{1}{6}\))(\frac{255}{50}\ + 6)\ \]

Therefore I need to aim for 1.85 RR for each trade – averaging £92.50 on each winner and losing no more than £50 on each loser.

1.85 RR seems more manageable a target to focus on than £255 for the month.

What’s my theoretical maximum position size

In theory, if I’m trading 17 markets (the major crosses which I can scan each day) and from my back-testing the biggest run of losers is around 6 or 7; then I could have a losing streak of 119 trades! However, not all of those 17 markets are correlated together – most are traded against the dollar though, so let’s assume 2/3rds are correlated. So in theory of those 17 markets, 11 might all experience a losing streak in one go.

To avoid wiping out my account, the maximum position size I could safely trade would be:

    \[ Max Pos = \frac{Acc. Size}{(No. Mrkts * Losing Streak)}\ \]

Where:
Acc. Size = Current account size (£7070)
Max Pos = Maximum position size per trade (of all units) in £s
No. Mrkts = Number of correlated markets that I could be trading
Avg Mrkt Losers = Average market losing streak from back-testing

    \[ \£92 = Max Pos = \frac{\£7070}{(11 * 7)}\ \]

The cost of taking money from your account

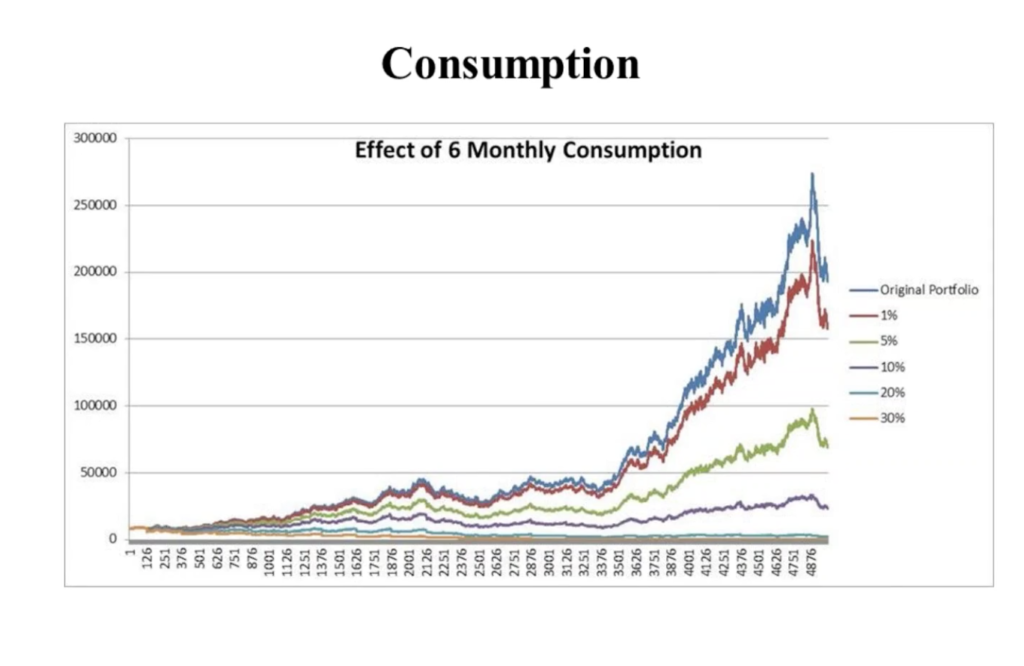
As an aside I saw this chart on the effects of taking income out of your trading account over time.

The chart shows a profitable trading account with a +/- 20% P&L swing year on year (I don’t recall the total timeframe.)

The x axis shows trades taken on the account, y axis shows total return. The assumption is that the trader takes a fixed percentage out of their account every 6 months.

Each line shows what would happen to the final account balance if you take money out of the trading account.

Consumption of a trading account over time

Update: Comments from Charlie

Went through this with mentor Charlie and he had a few comments for me.

  1. The compounding period is too short. Need to allow time to get comfortable with the new position size, before compounding again. He suggested once per quarter or 6 months
  2. Agreed it was best to focus on the RR and % return rather than the P&L of each trade

FTSE DST Short – 6 Mar


Account Risk: 0.3% (looking to increase leverage to 1%)
Short: 1x 7355 & 2x 7362 (order)
Stop: 7408 (1x 53 pips & 2x 46 pips)
Tgt 1: 7225, D 50MA (130 pips 2.4 RR)
Tgt 2: 7113, W 21MA (242 pips 4.5 RR)
Tgt 3: 6773, W 50MA & M 21MA (582 pips 10.9 RR)
Mindset: A little uneasy – worried about missing out on the full position.

Update #1 – Second part of my position has triggered – 6 Mar
Update #2 – Stopped out – 16 Mar

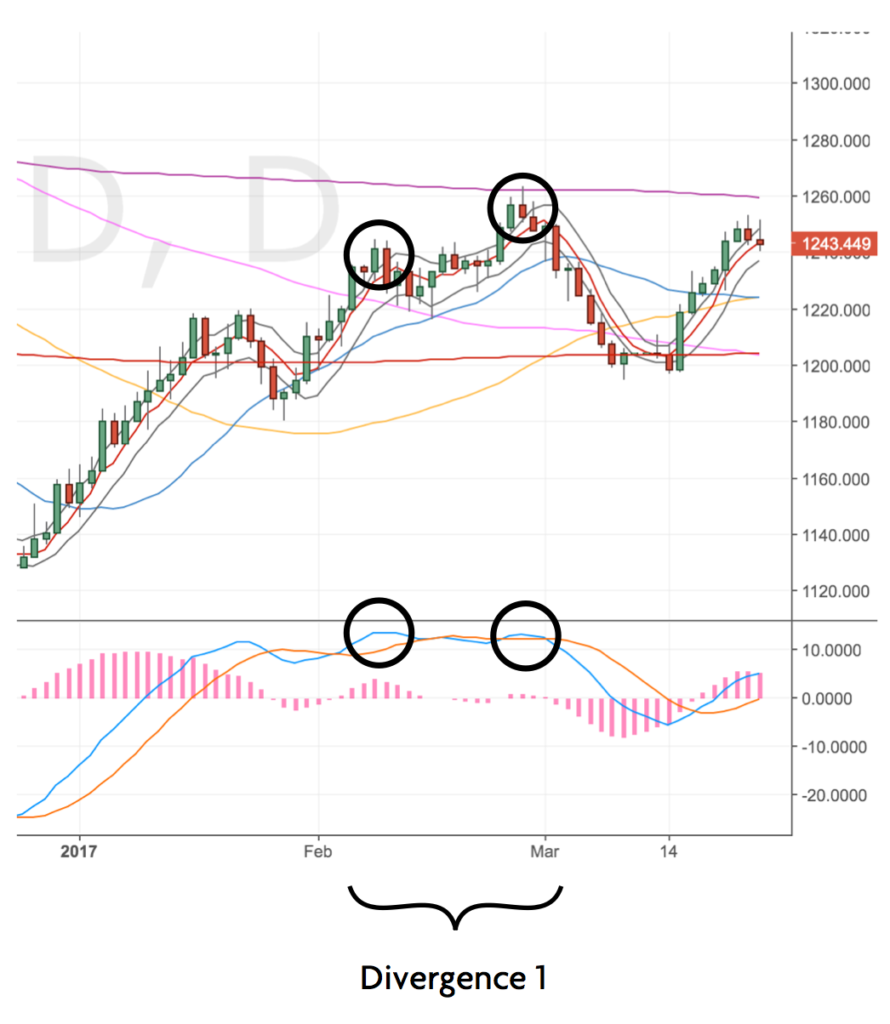
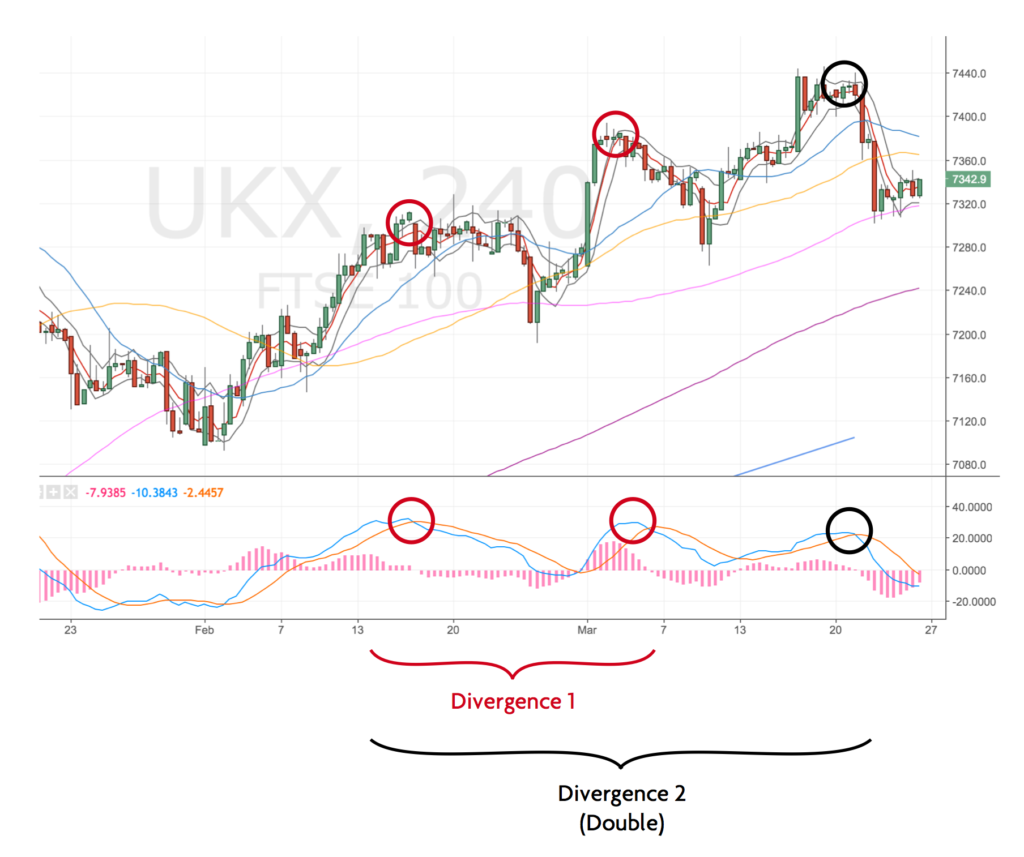
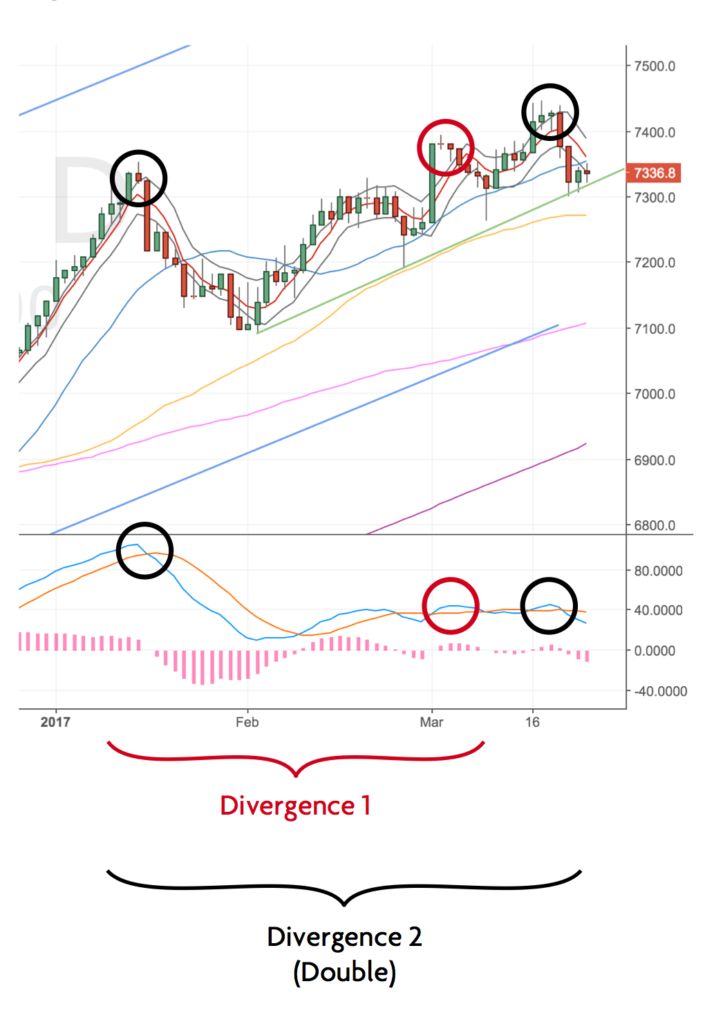
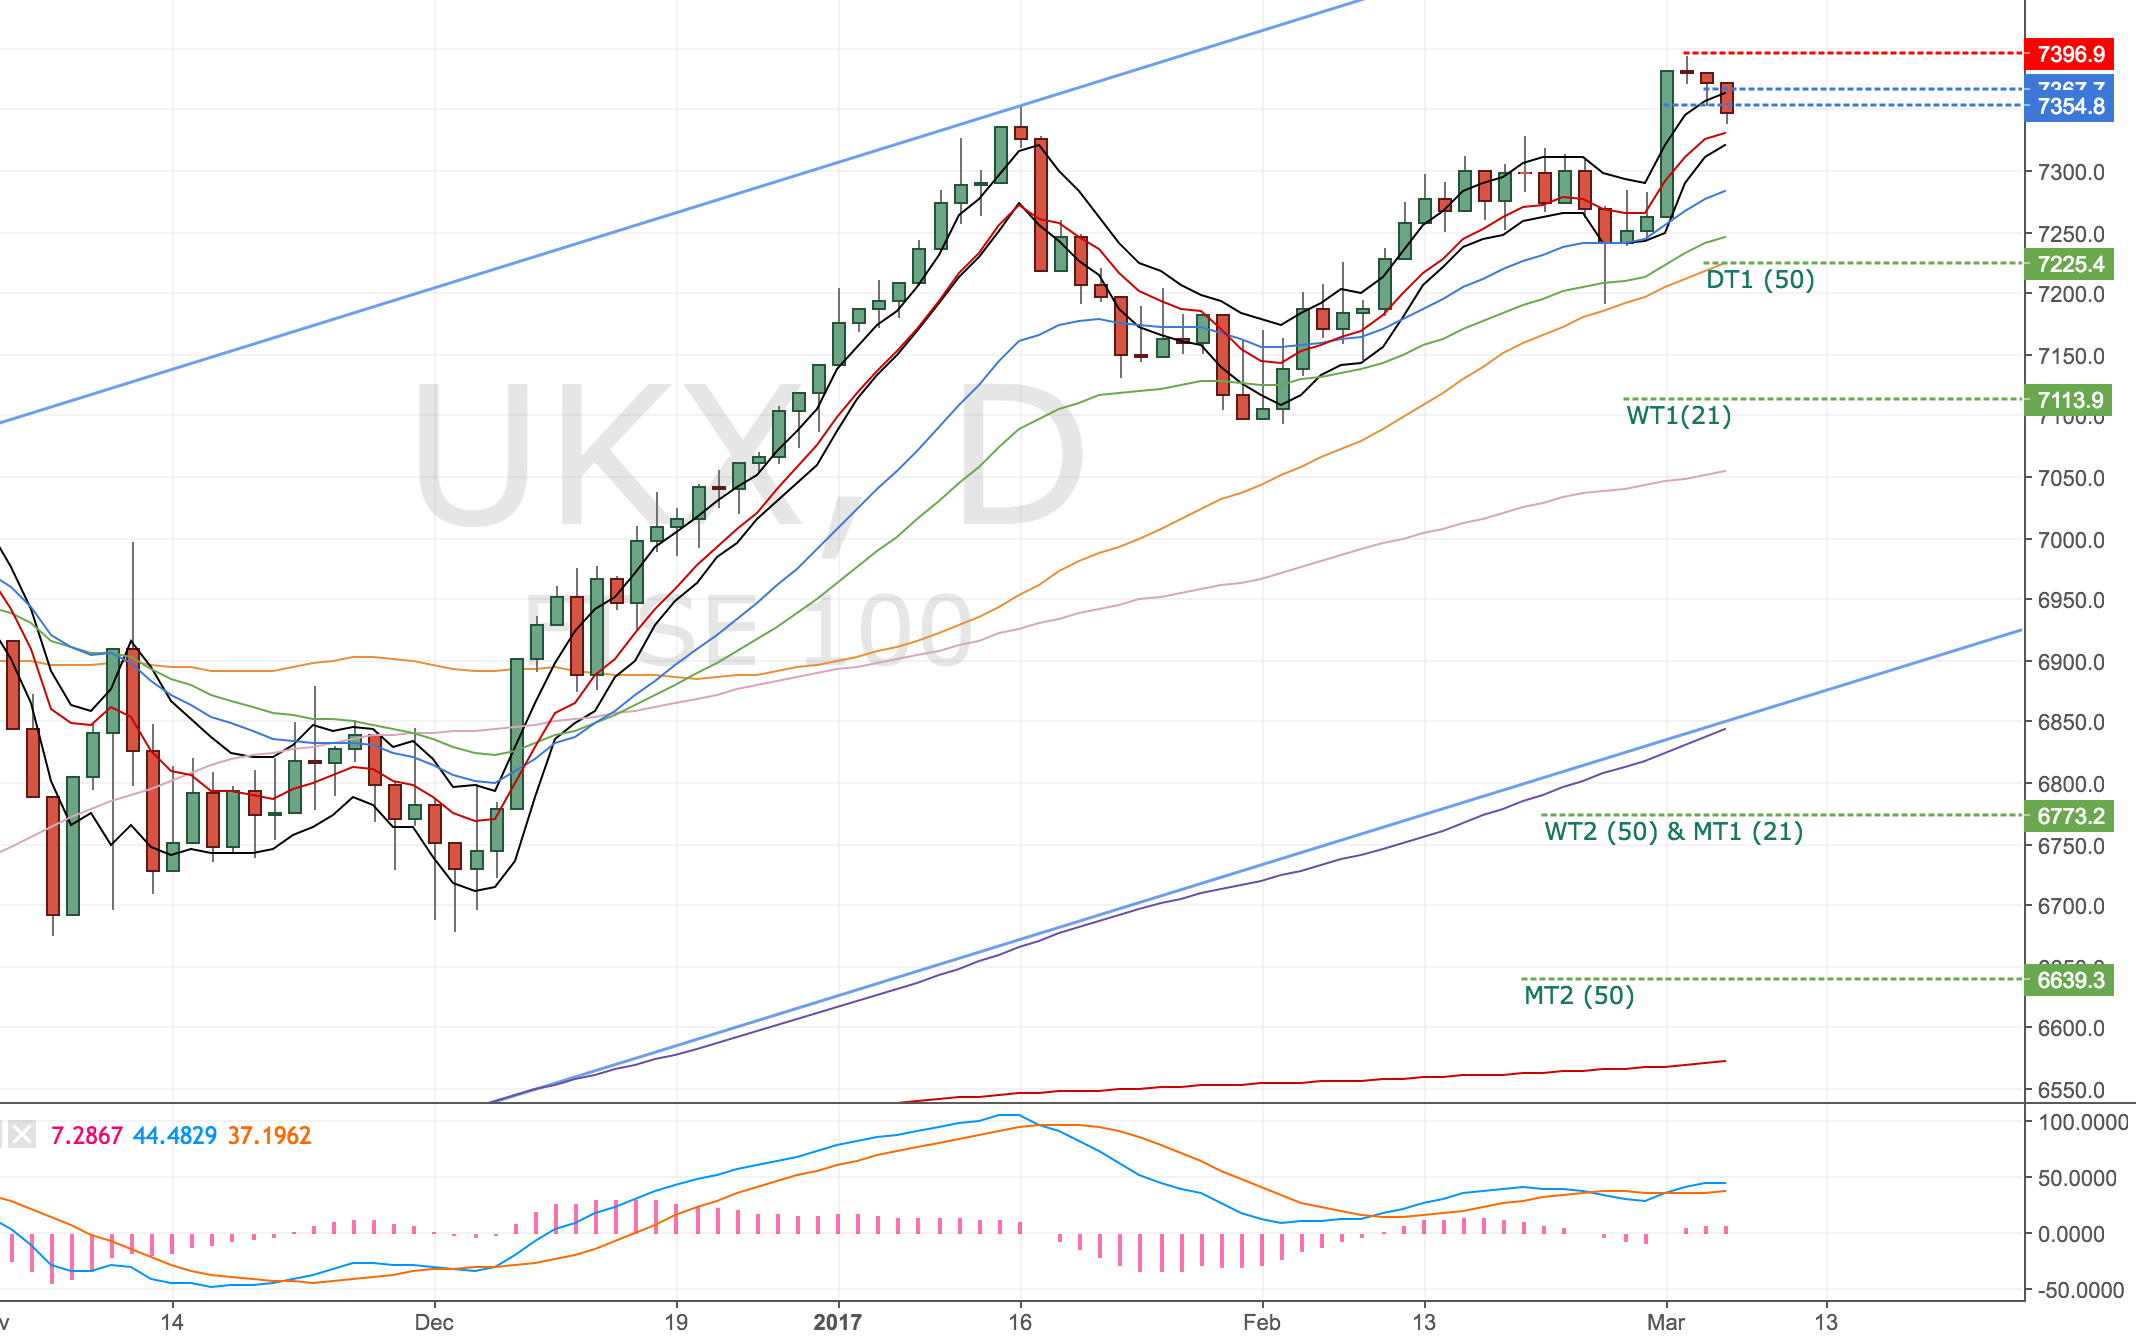
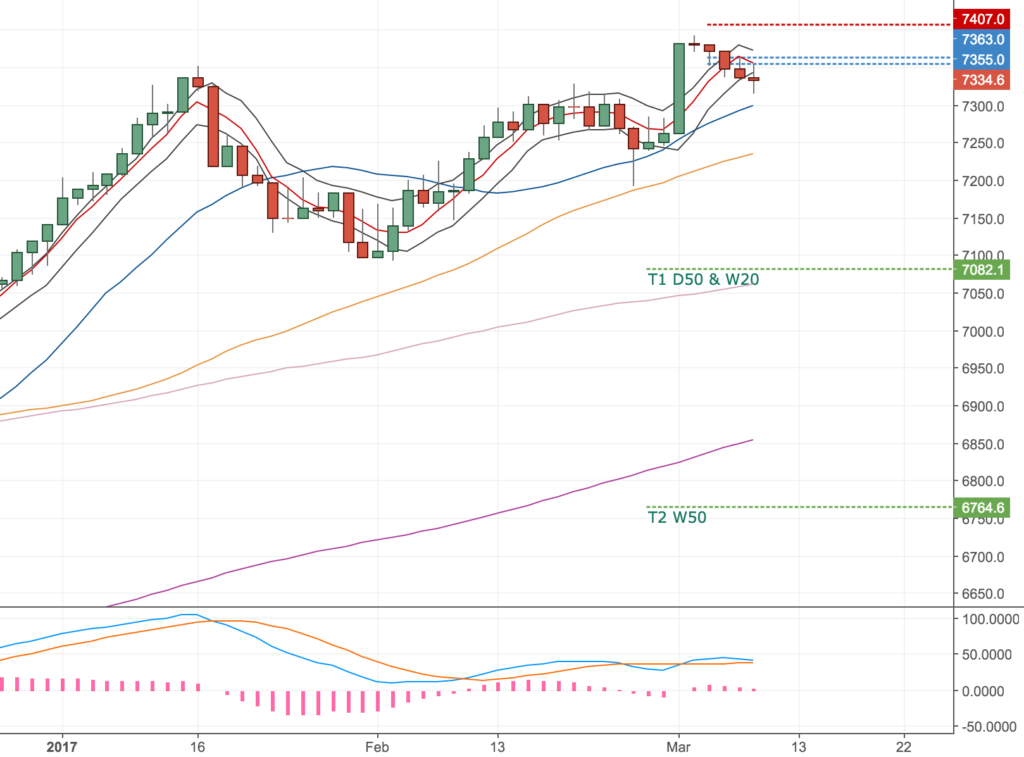
This trade has been in the making for a while! The FTSE has broken to new highs and we’ve got a divergence showing on the 4H, Daily and almost the Weekly (Not sure about the monthly yet). There are so many juicy targets as well, I just can’t wait to see how this plays out. I’ve got the feeling this might be one of the better trades of the year for me (just got to play it right!)

The set up is on the daily chart (I’ve entered a little early on the 4H chart)

Daily chart set up

FTSE 100 Daily Chart – 6 Mar

I’ve entered the first portion of my trade at 7355 manually from the 4 hour chart. The remainder will be entered at the upper band. I’d like to be trading more than 3 units but I’m already on the smallest position size with ETX I don’t want to risk more than 1% on this trade right now. Maybe if we had a double or triple divergence I’d feel different.

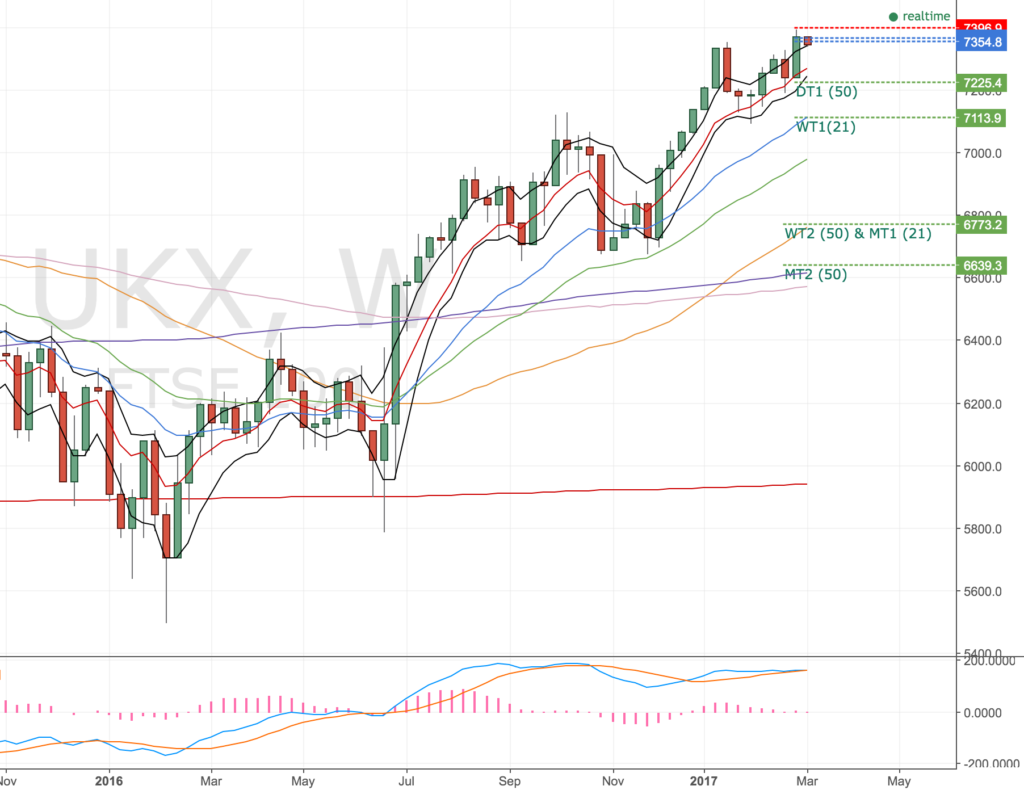
Weekly chart

FTSE 100 Weekly Chart – 6 Mar

Not quite confirmed but price has moved inside the bands, a decent close under 7340 would confirm the weekly divergence. Monthly chart would set up if we closed under 7255.

This one is a big time wait and see job. It could take weeks to work its way down to my target.

Update 1 – Second part of my position has triggered – 6 Mar


Date: 06 Mar 17
Account Risk: 0.6%
Short: 1x 7355 & 1x 7362
Stop: 7408 (1x 53 pips & 1x 46 pips)
Tgt 1: 7113, W 21MA (242 pips 4.5 RR)
Tgt 2: 6773, W 50MA & M 21MA (582 pips 10.9 RR)
Mindset: Ok for now – waiting for a decent break-down. Not sure about adding to my position now.

The second part of my trade has been triggered now, so my average entry is 7359. I originally wanted to go up to add 2 units to increase the trade size to 1% but if I’m being honest with myself I’m not ready for it. Just not used to it and I’d like to build up some trading mileage and a bigger margin before I up my position size.

So I’m happy to risk £50 per trade for now.

Here’s the set up I’m trading.

FTSE Daily Chart – 6 Mar

I’ve noticed people at work talking about buying shares, I don’t get the impression people are greedy though, just that getting into equities is on their radar – so I can imagine a scenario where price goes higher yet.

The opposite to that though, I can easily see price on the weekly & monthly charts closing inside the bands. If the monthly chart sets up, I may have to move my targets to the monthly 21. At the moment the weekly divergence is in play so my targets are set for the 21 and 50 weekly MA.

Update 2 – Stopped out – 16 Mar

Got stopped out of the trade. Two things surprised me about this:

  1. When the fed raised rates, prices went higher. Higher interest rates are usually bad for equities – debt is more expensive and there’s less money for people to spend on stuff.
  2. How long this trade took to decide anything. Just not been used to that much waiting around!

I have to be honest and say I was disappointed about this stop out. Bruce Lee sums it up pretty well for me.

Down on my luck again

I know I shouldn’t be, but I’ve had a few losers lately, trading costs are adding up and I was hoping this trade would cover those losses. I’m not used to this – probably the first time I’ve experienced it – although I’m covering many markets now and these losers are spread around, so it’s to be expected but it wasn’t what I was planning for March.
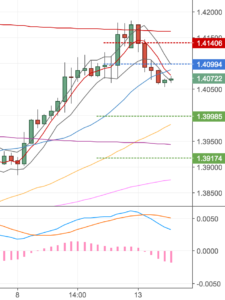
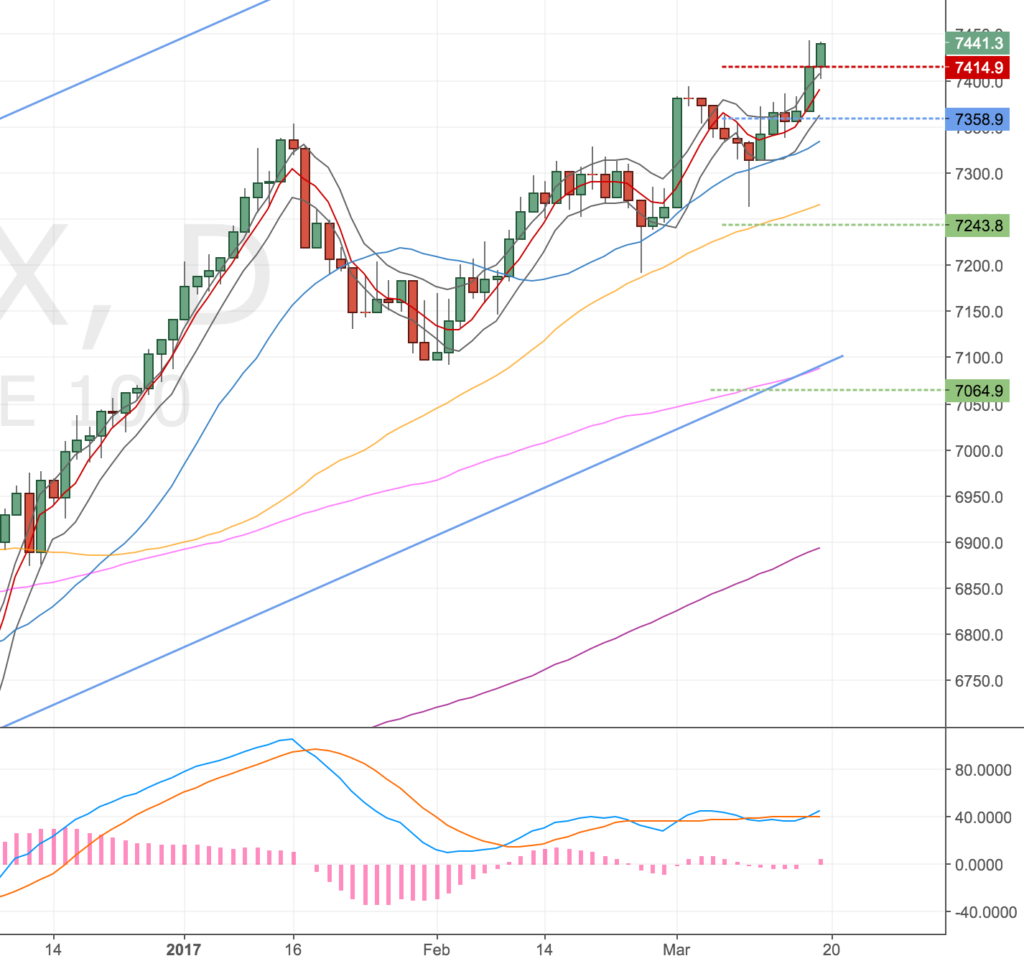
Here’s the final chart.

FTSE 100 D Chart – 17 Mar

Looks like we still might get other set ups coming. Gotta keep plugging away. I’m sure I’ll look back on this one day and shake my head in disbelief at how easily up set I was.