EURUSD DST Long – 3 Mar


Account Risk: 1%
Long: 2x 1.0515 & 2x order 1.0505
Stop: 1.0475 (40 pips & 30 pips)
Tgt 1: 1.0556, 4H 50MA (41 pips, 1x RR)
Tgt 2: 1.0655, 4H 200MA (140 pips, 3.36x RR)
Tgt 3: 1.0975, D 200MA (410 pips, 10.25x RR)
Mindset: Optimistic

Update #1 – First Target hit – 6 Mar
Update #2 – Wait and see – 8 Mar
Update #3 – Final Target hit – 10 Mar


I’m about to start building work on the house and so my time is seriously stretched at the moment. It’s not the ideal situation for trading – late nights, lots going on and generally feeling tired. I need to be aware of my stress levels and mindset over the next few weeks. I may have to take a break if my routine isn’t consistent enough.

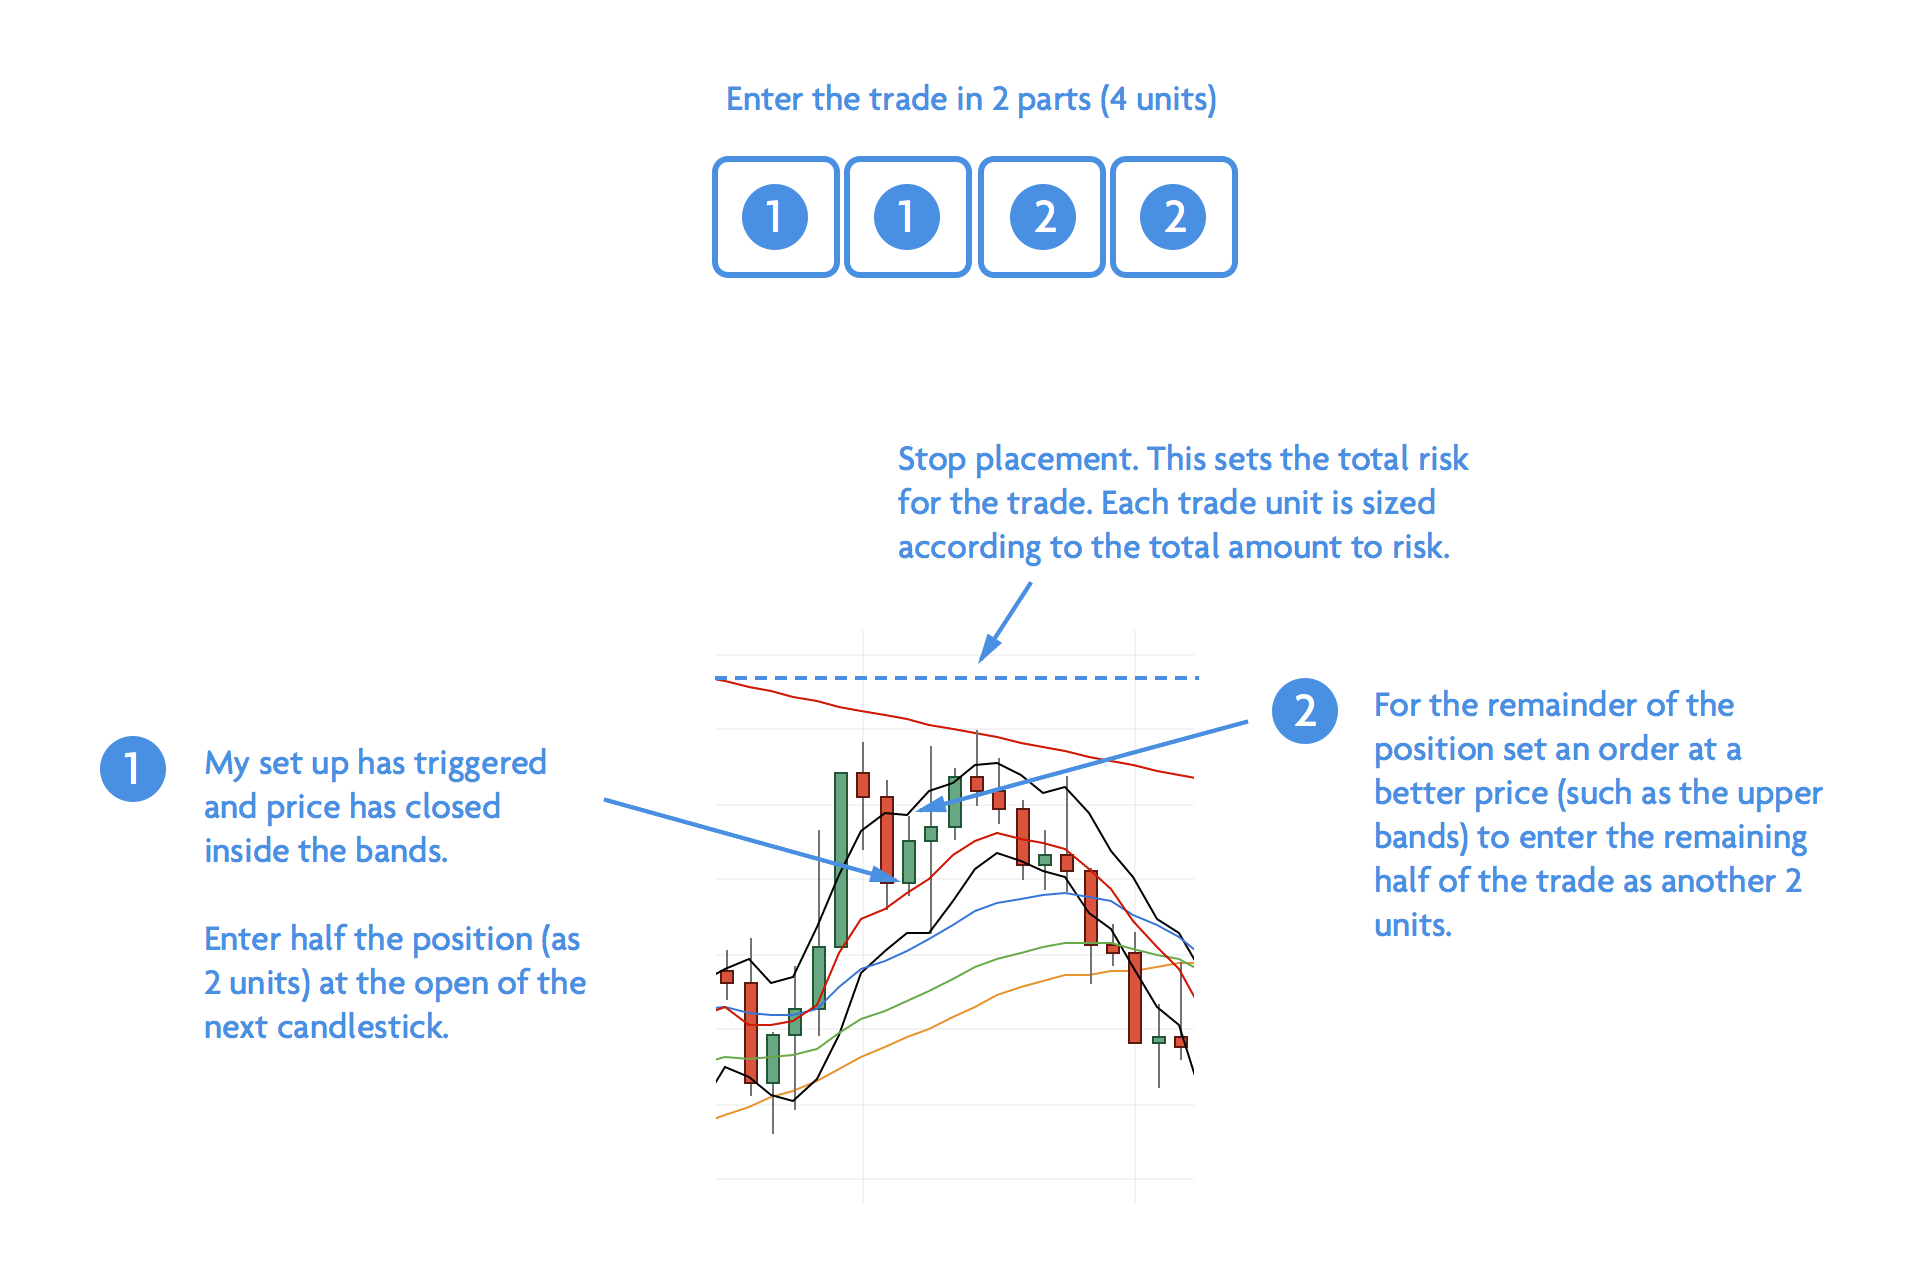
Anyway, for now the situation is manageable. I saw a EURUSD trade set-up I’d been monitoring on the 4H chart. This trade has been my first opportunity to test out my new position sizing approach. The idea is to scale in to positions at a better price within, and at the edges of, the bands.

General approach is to enter the market with half the position and try and get a fill on the other half at a better price using a market order.

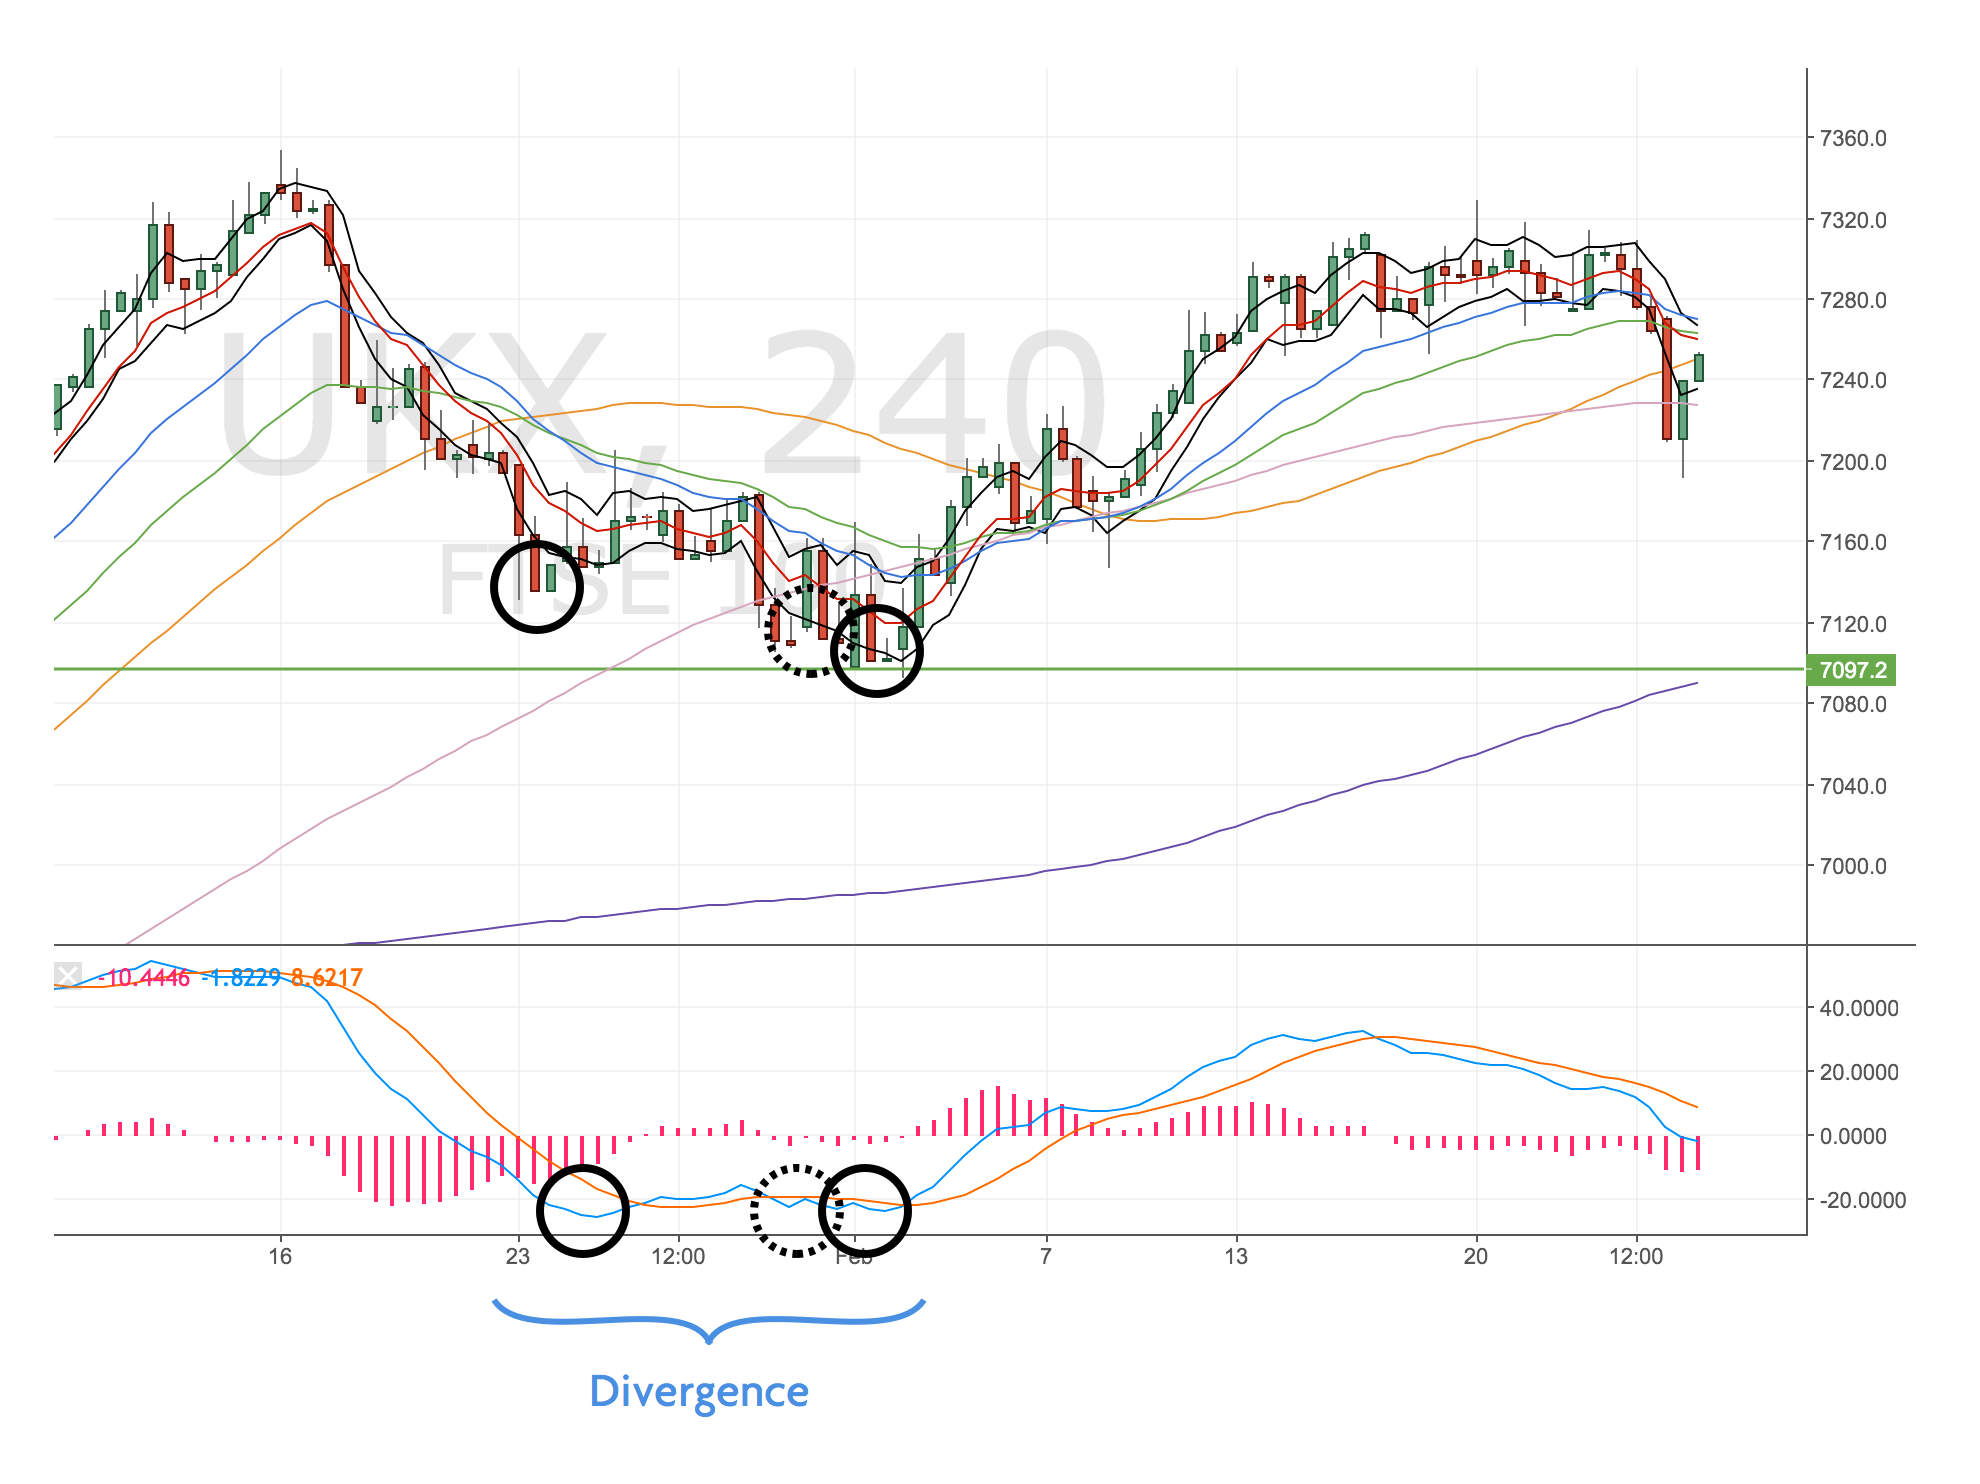
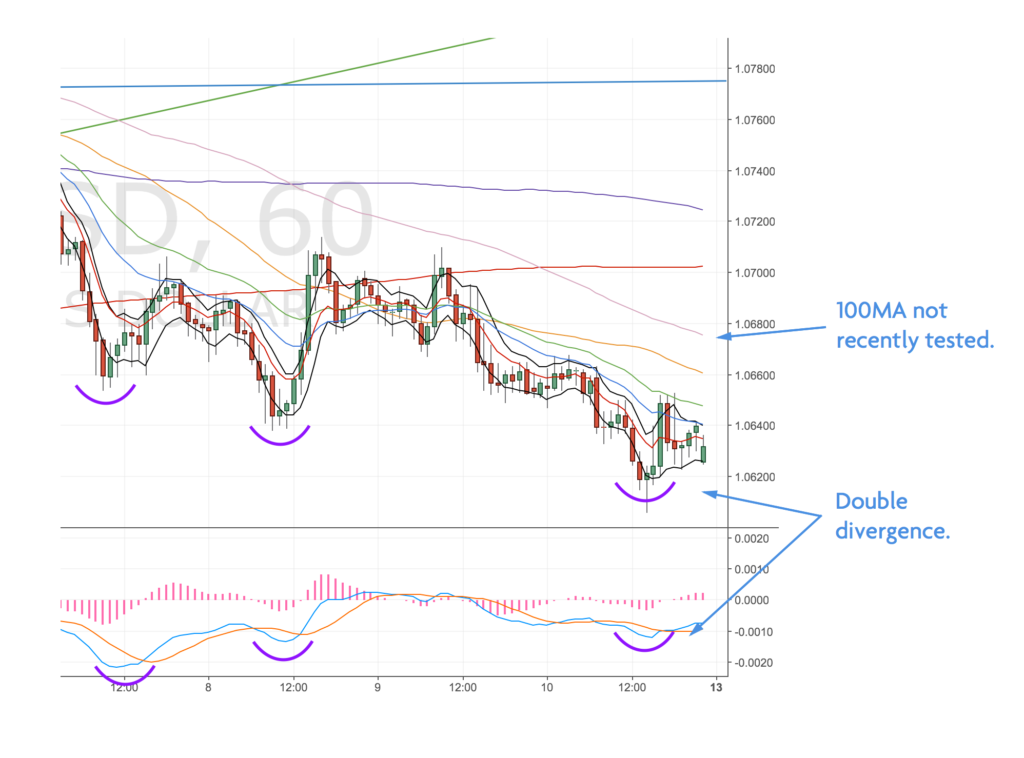
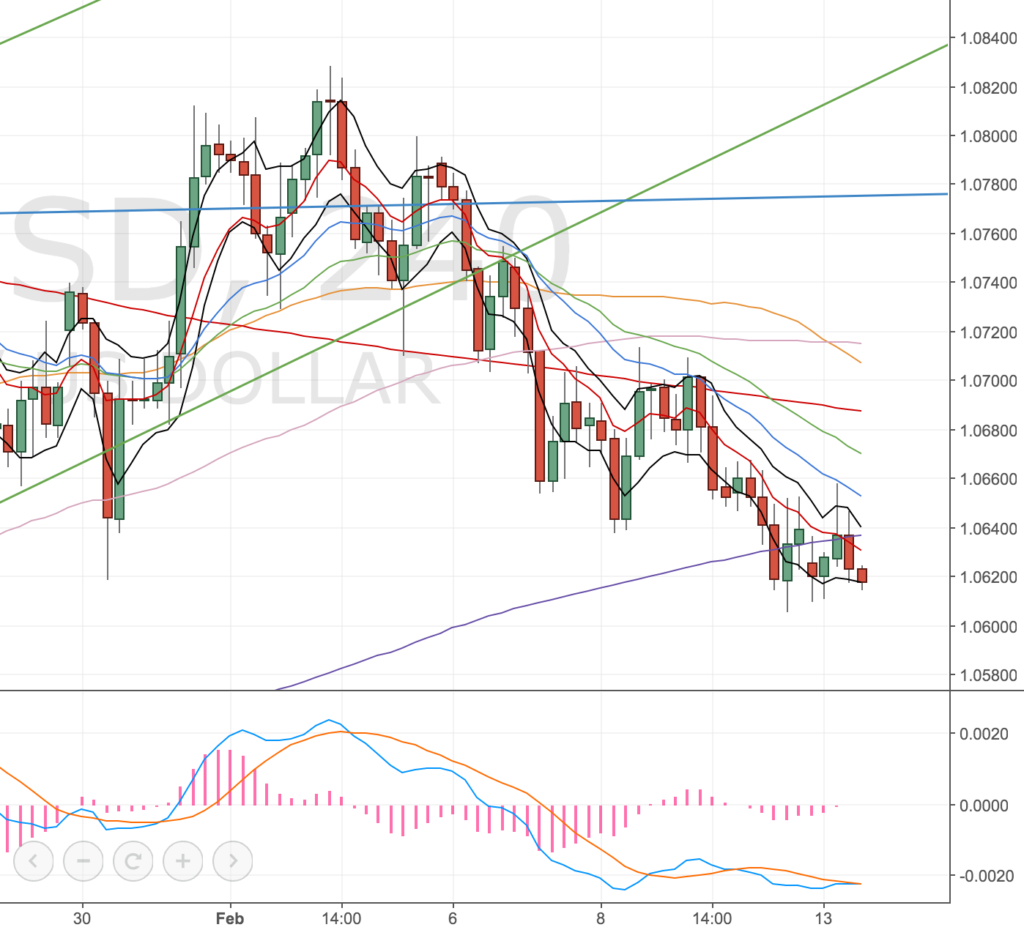
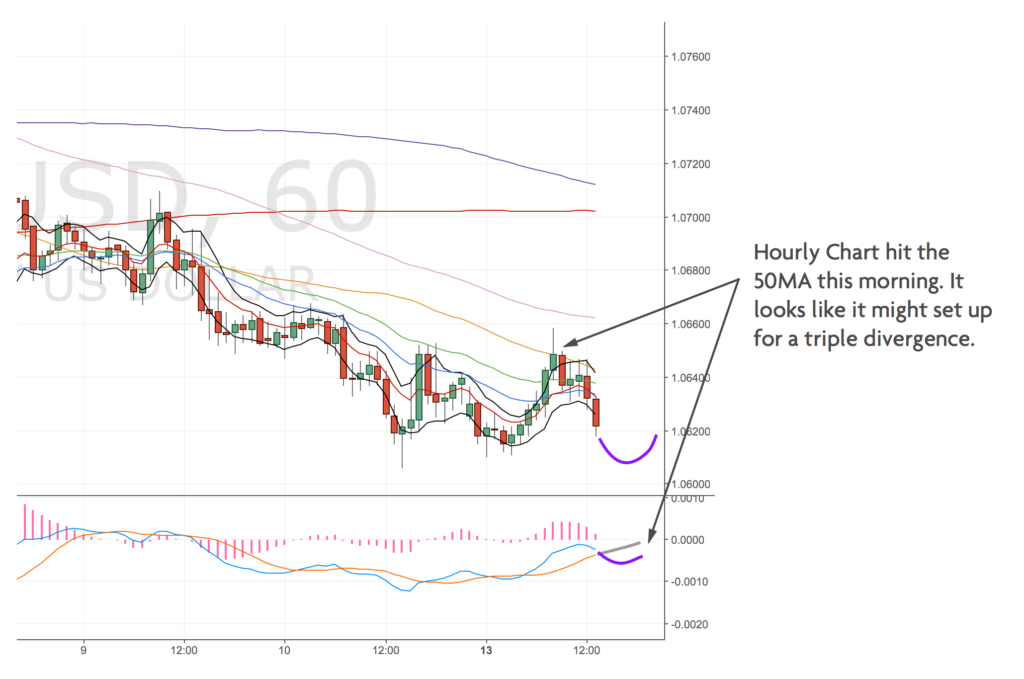
Here’s the set-up on the EURUSD.

4H Chart – set-up chart

EURUSD 4H Chart – 3 Mar

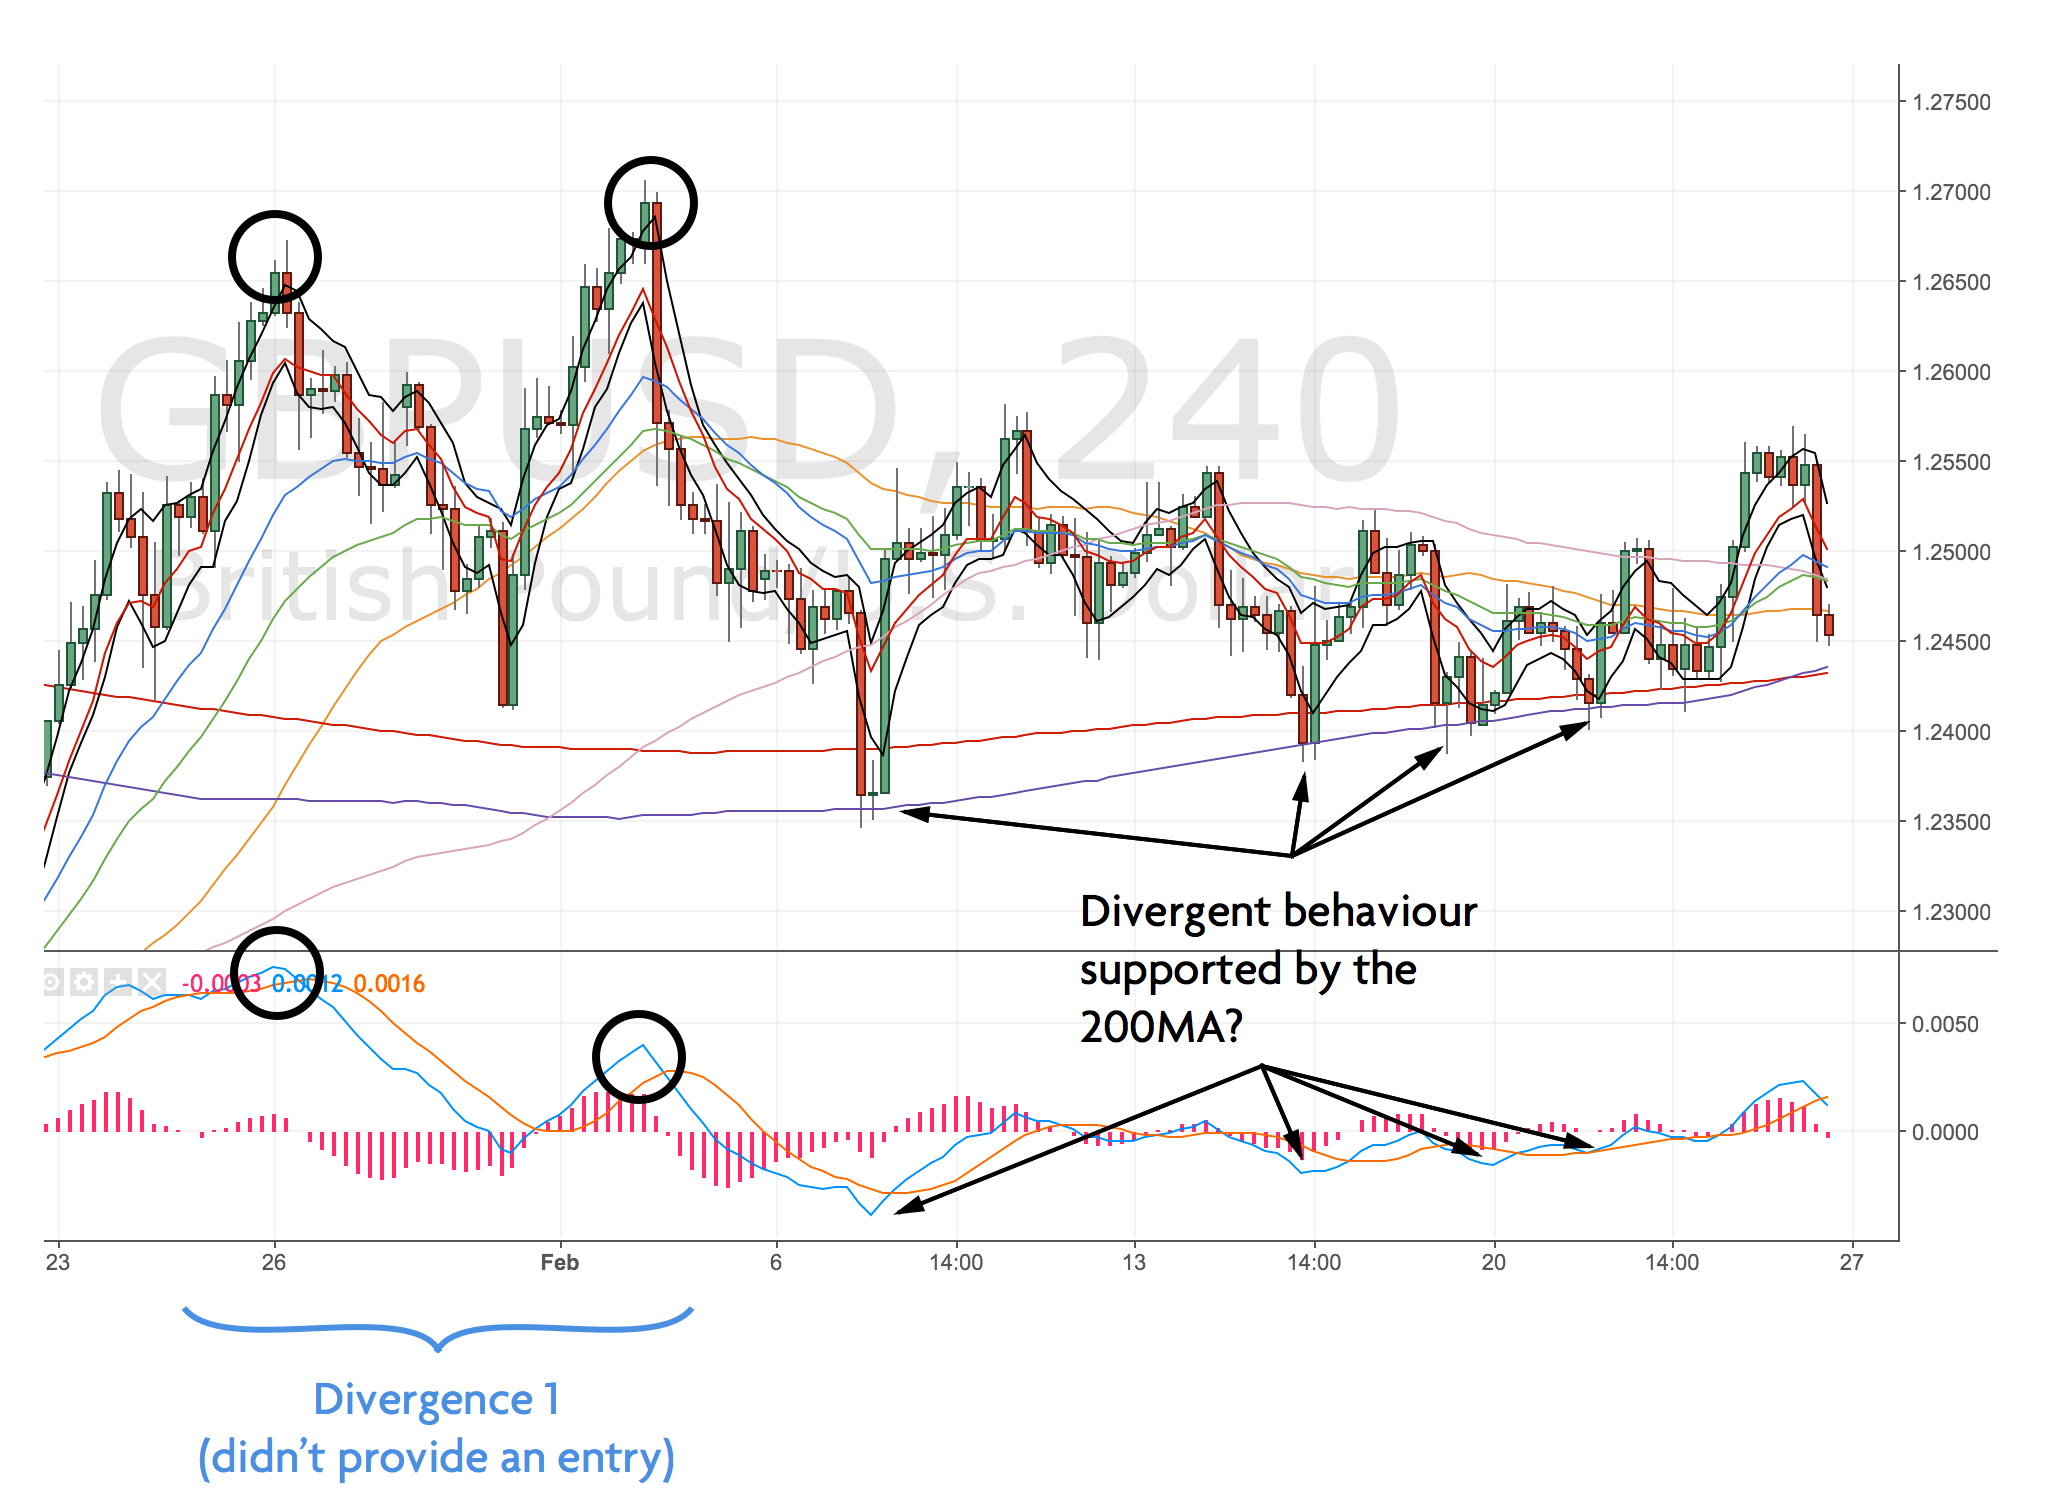
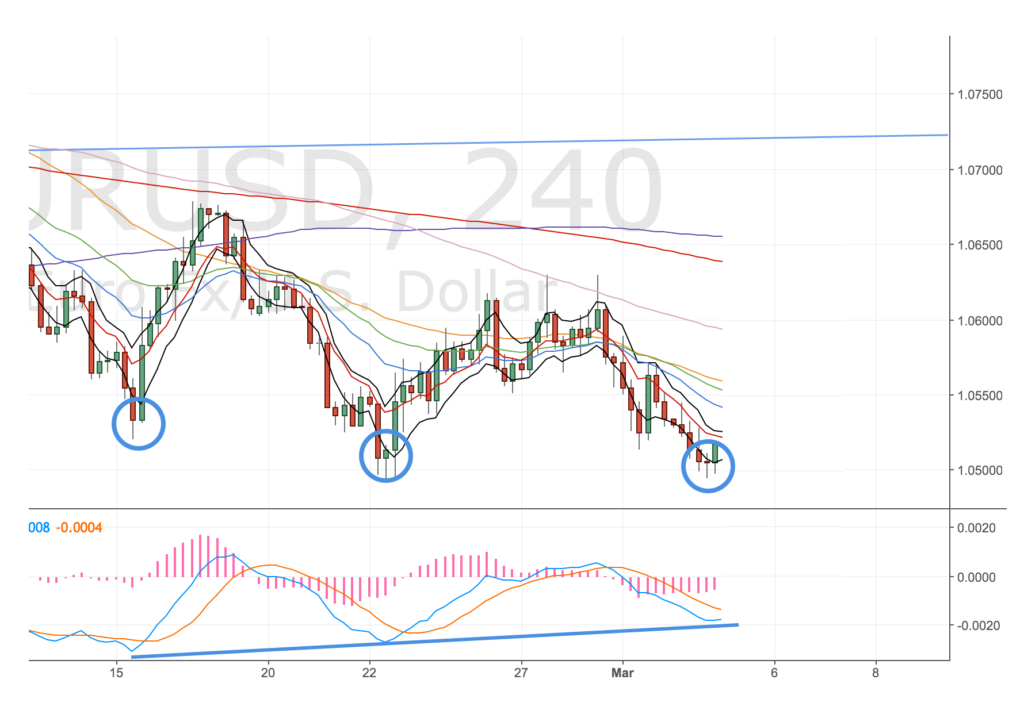
The price action is showing a 4H double divergence. When you add in the daily chart, things get a bit more interesting.
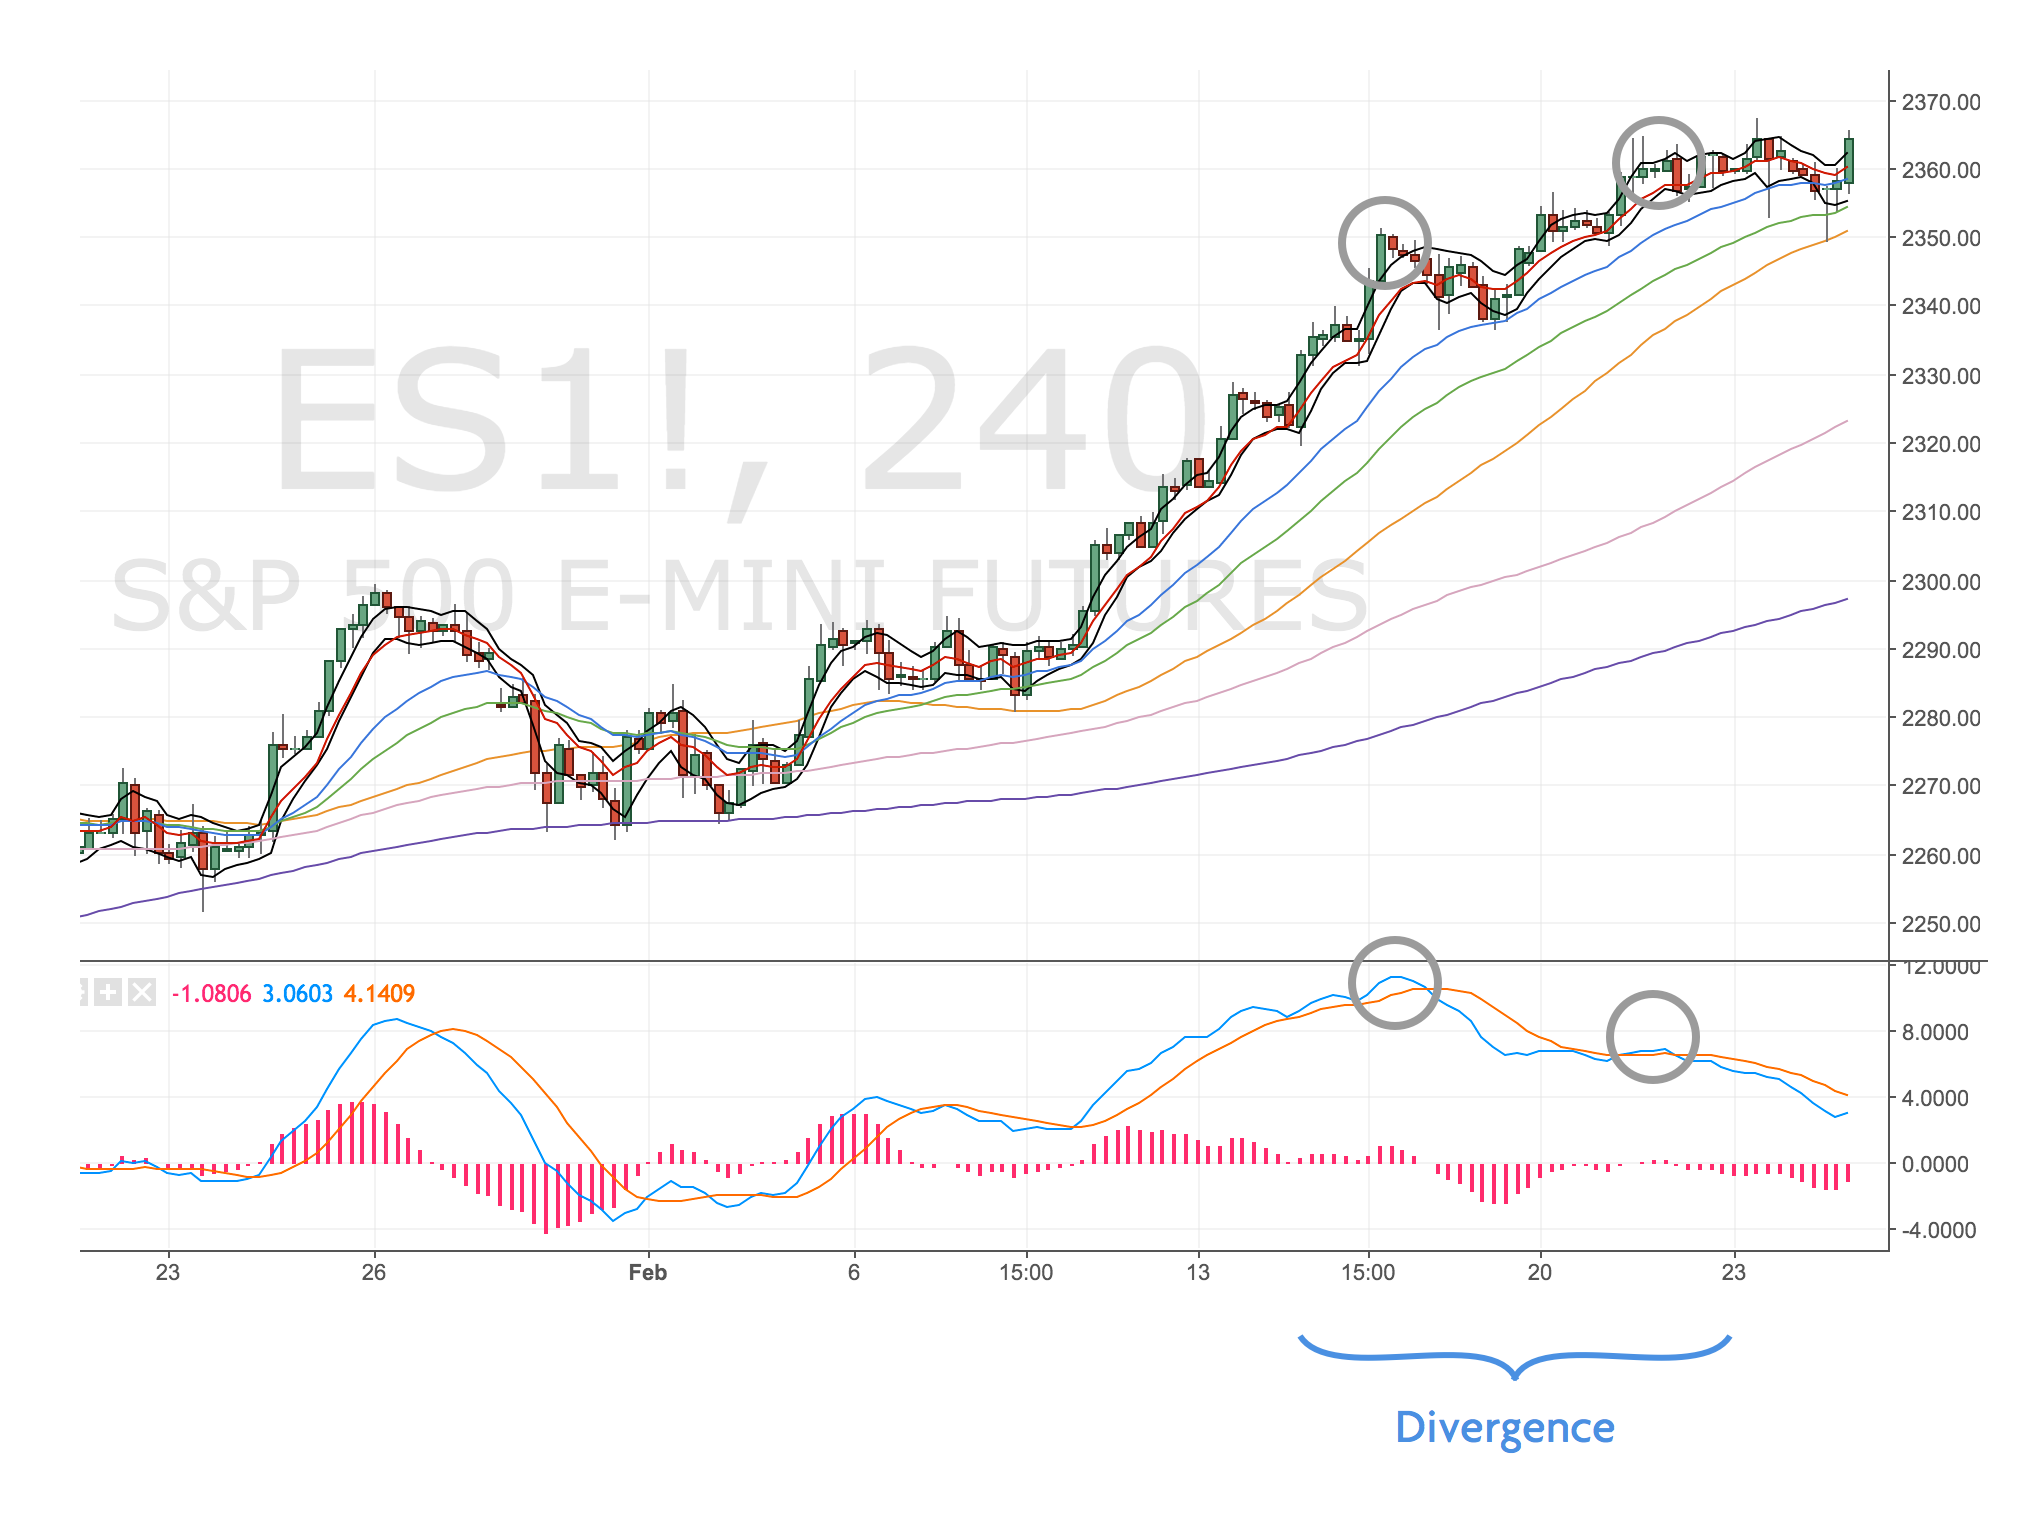
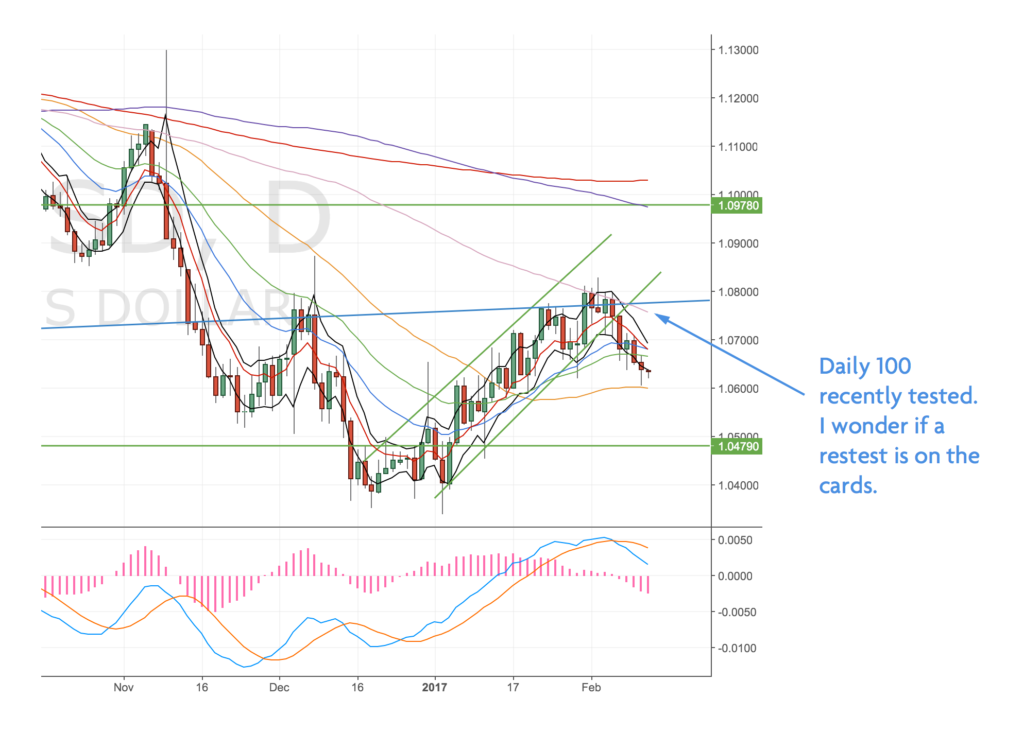
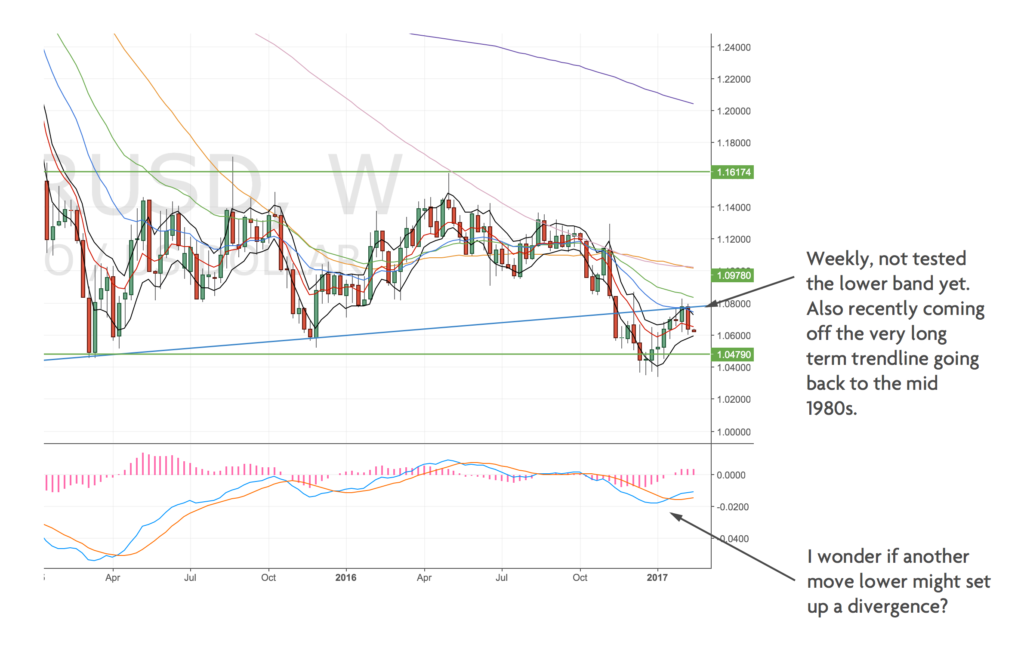
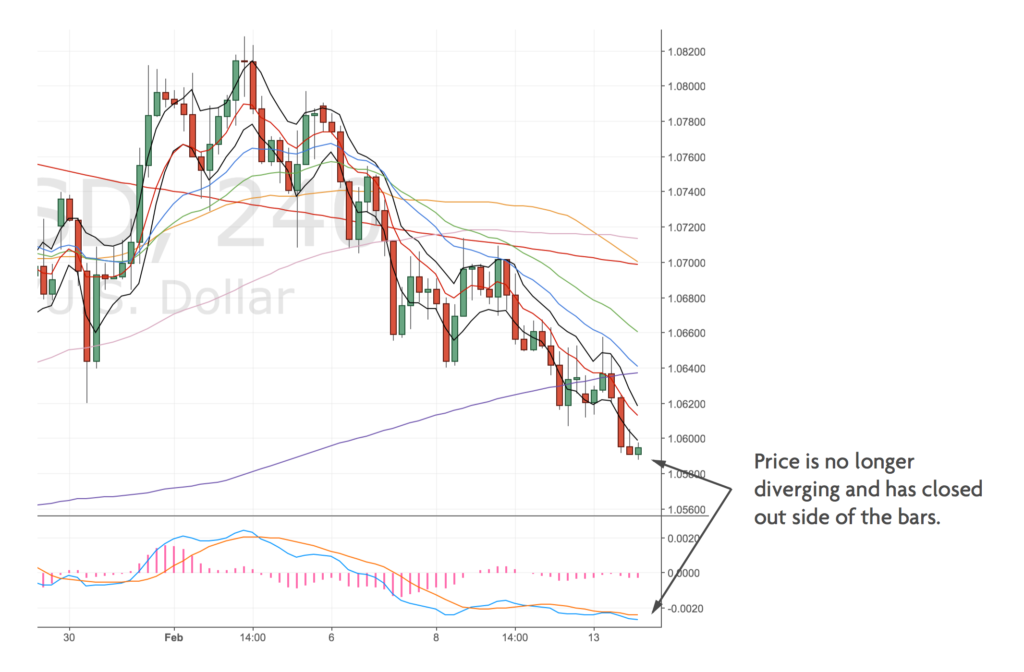
Daily Chart

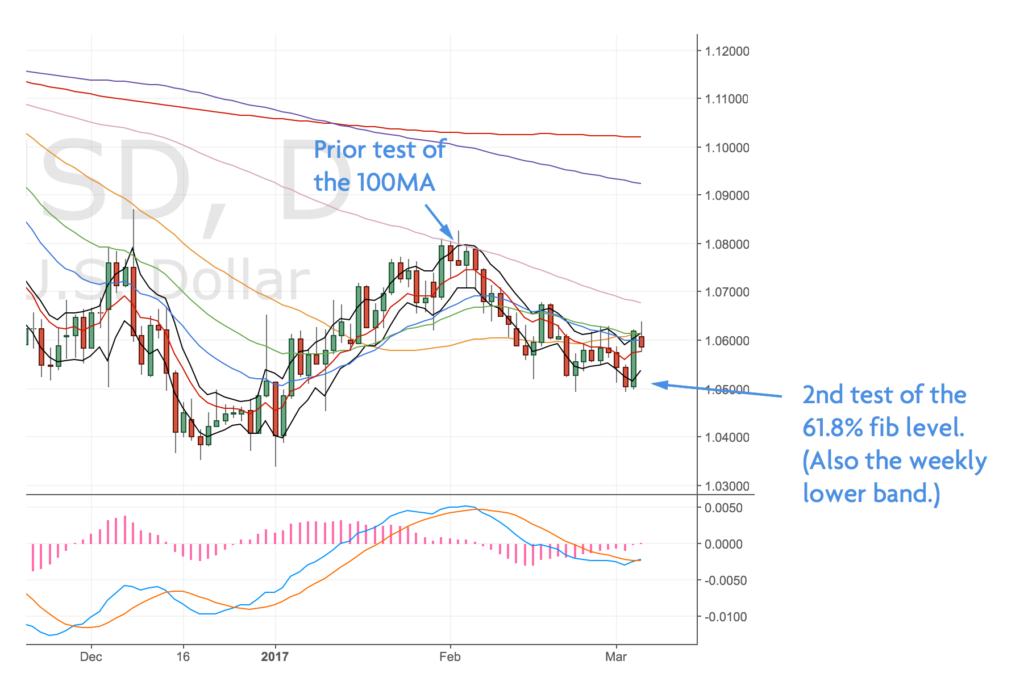
EURUSD Daily Chart – 3 Mar

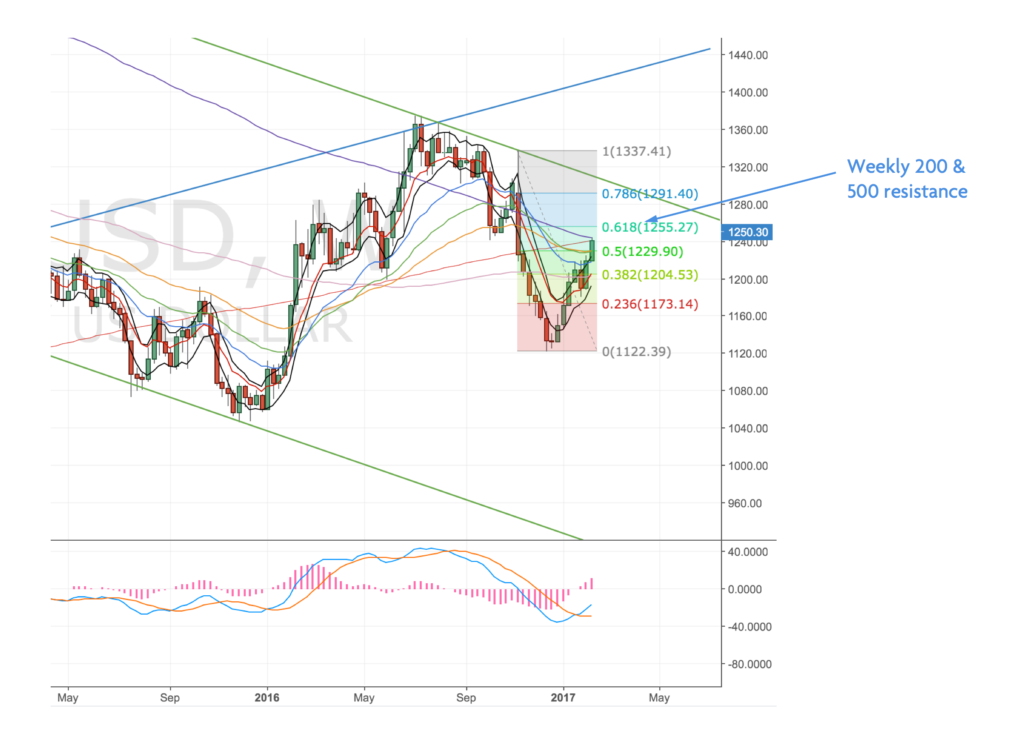
We’ve already tested the 100MA and we’re currently on the 61.8% fib retracement (2nd test). Price is also testing the weekly lower band.
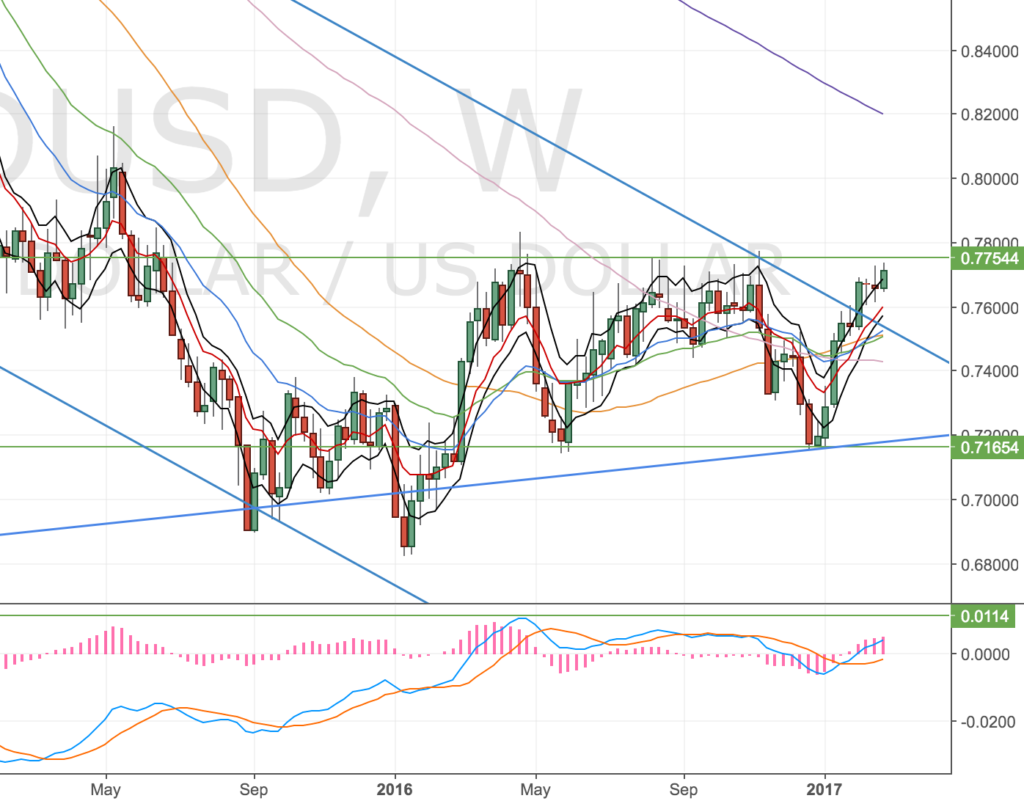
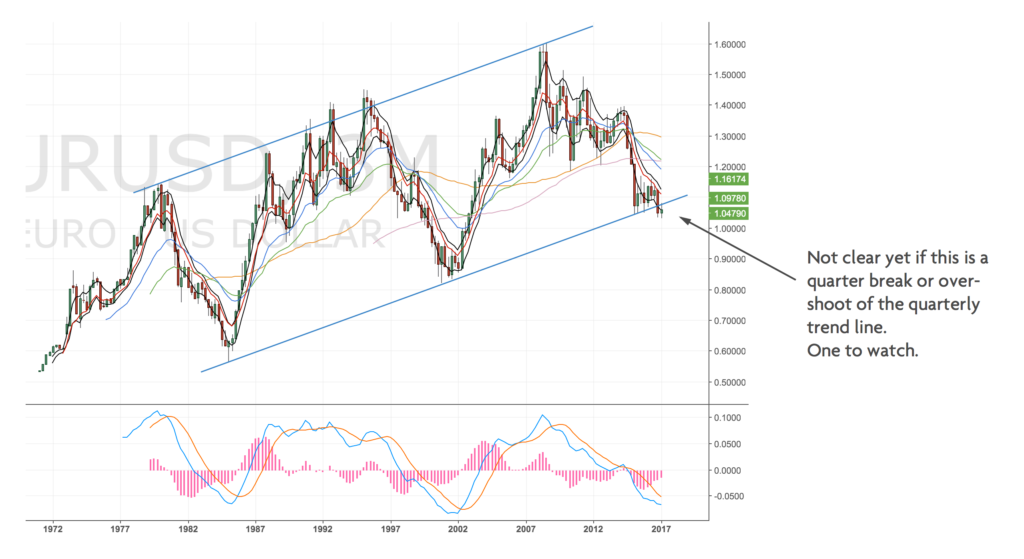
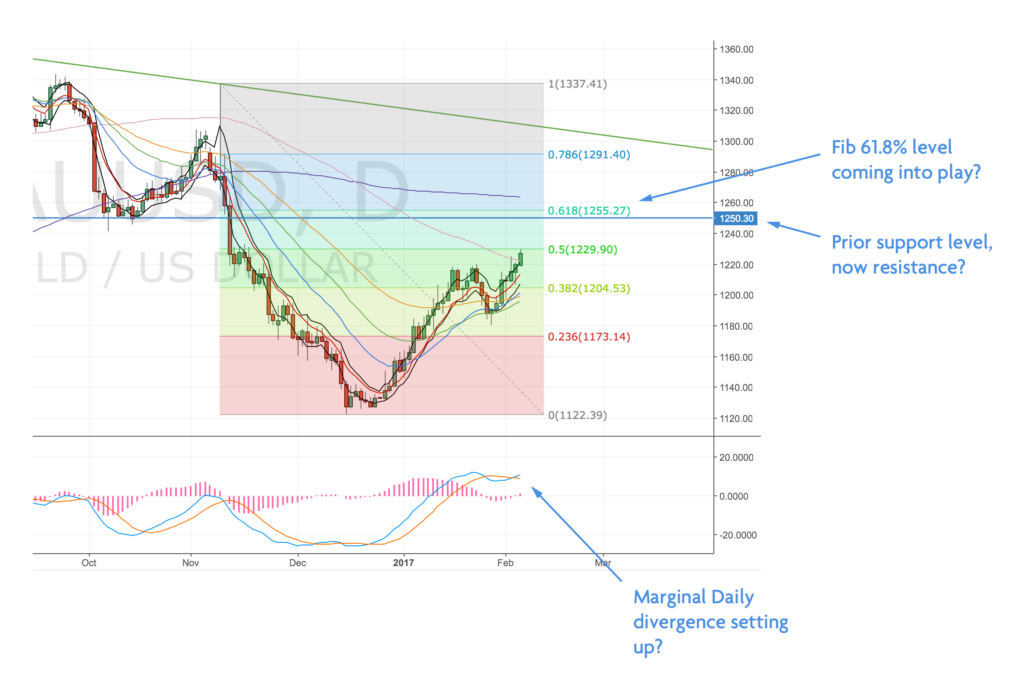
Monthly Chart

I wanted to include this too, we are on an ultra-long term trendline of support today (lower blue line).

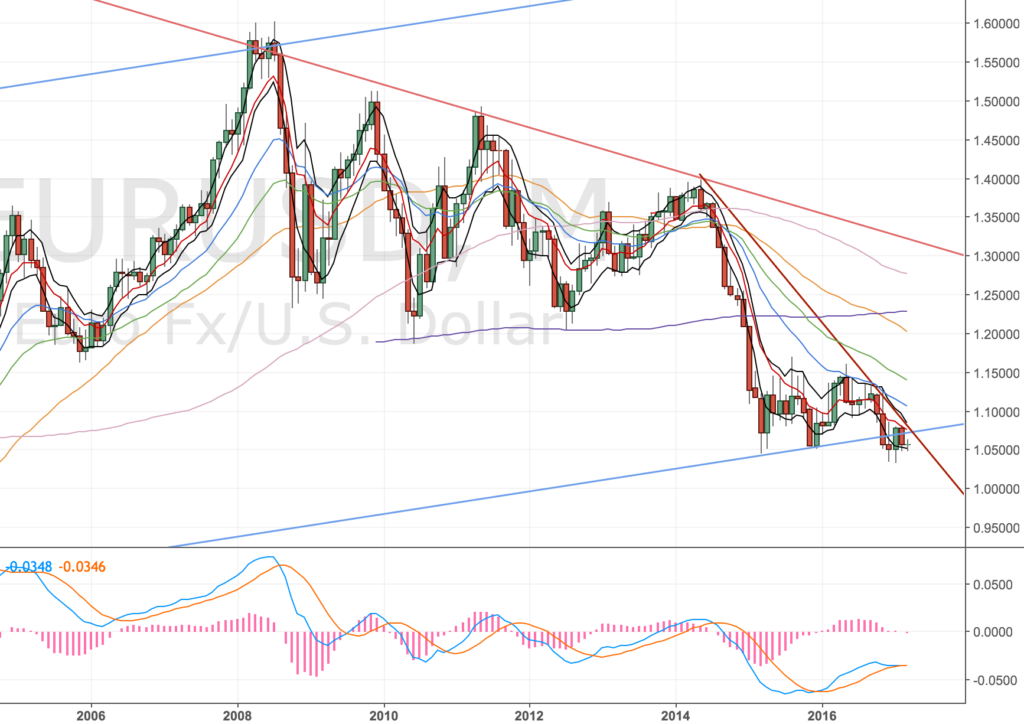
EURUSD Monthly Chart – 3 Mar

But what caught my eye on this chart was the trend channel break-away. This was a pattern a recall learning ages ago – I have no stats to prove that it works or doesn’t – but the trader I learnt it from said it was a particular favourite of theirs.

Price is in a down-trend channel (red line) but then accelerates away, steepening the trend (dark red line). Price can often retrace that move just as quickly back to the original trend line.

Hopefully the chart mark-up makes sense.

Nothing I can actionably trade, but interesting nonetheless. If my full position is triggered I might be tempted to hold on to the last position for a while.
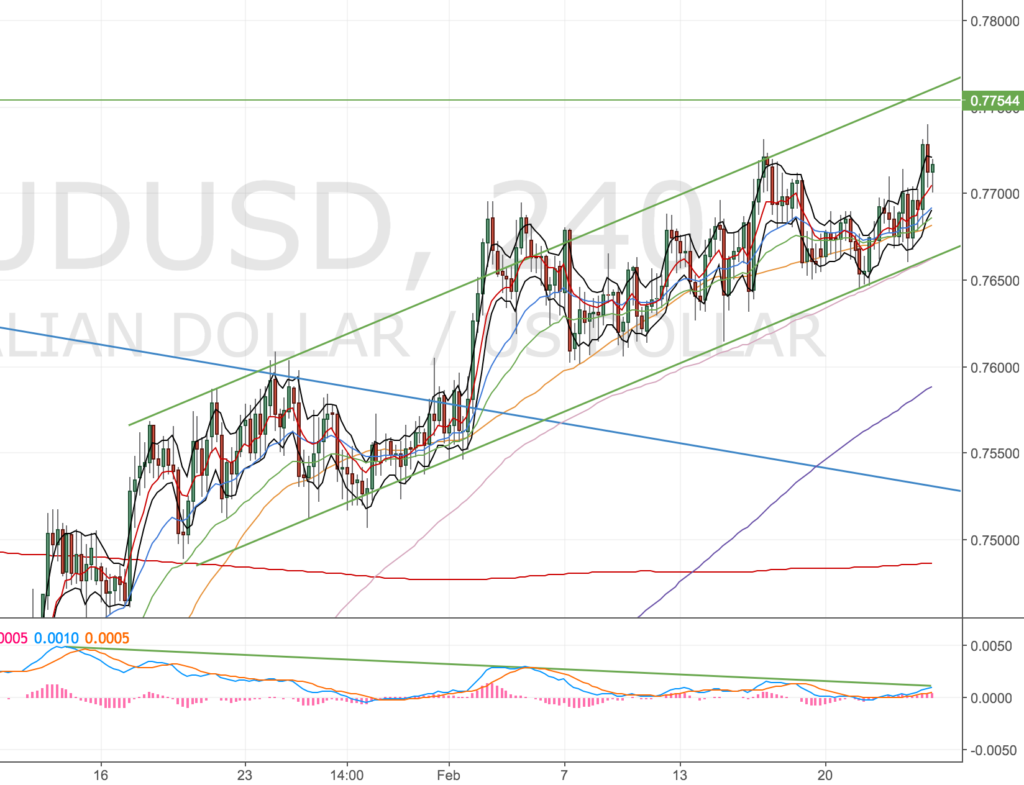
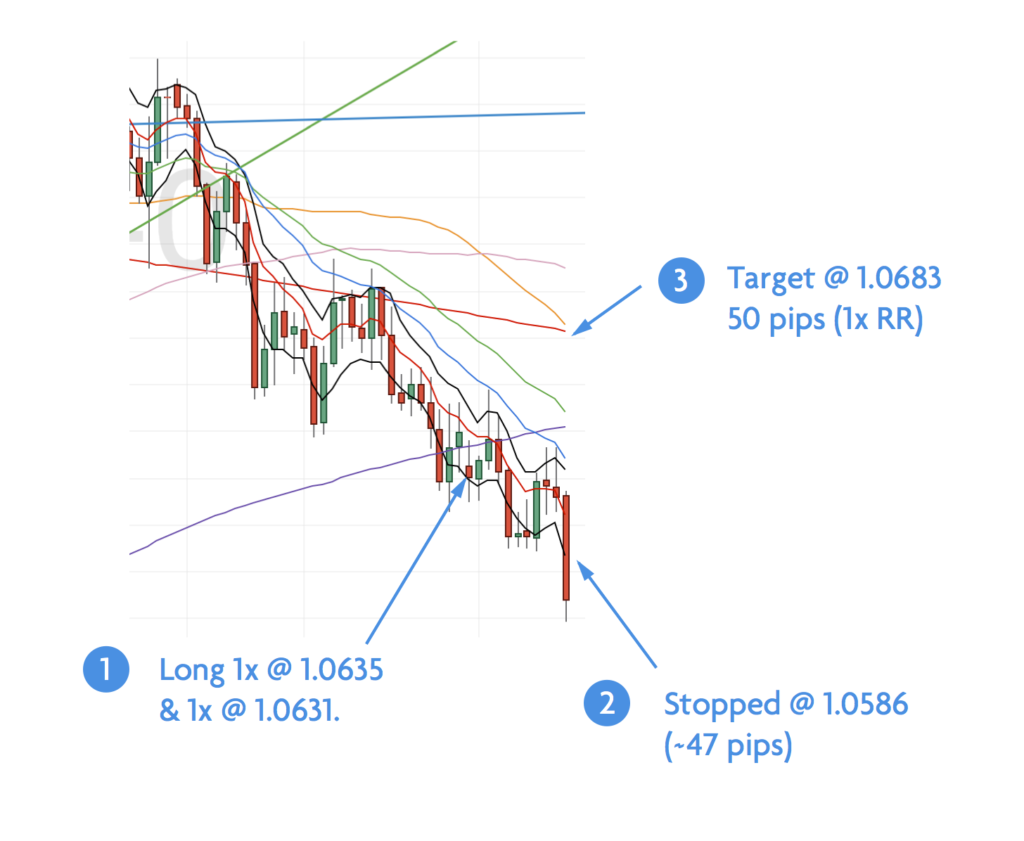
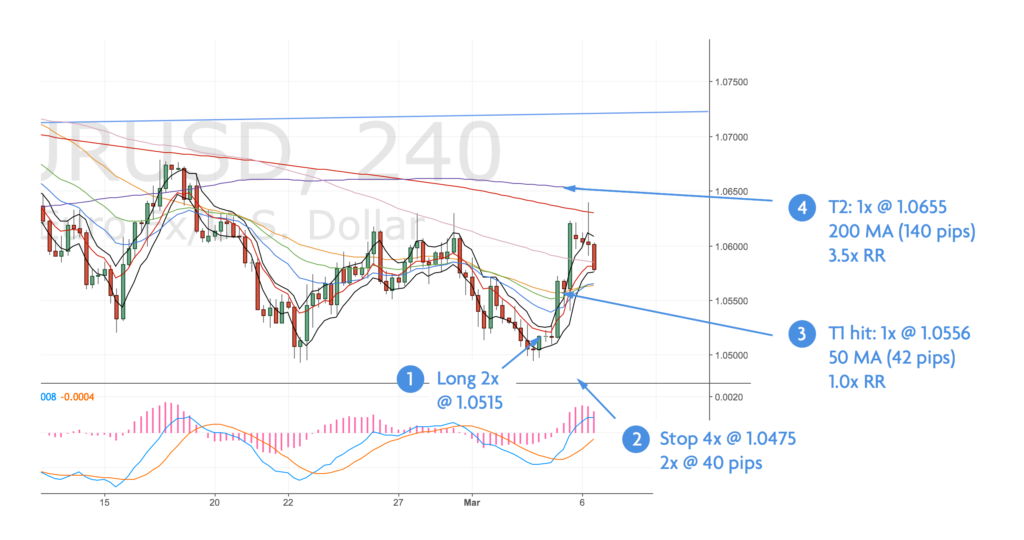
Executing the trade

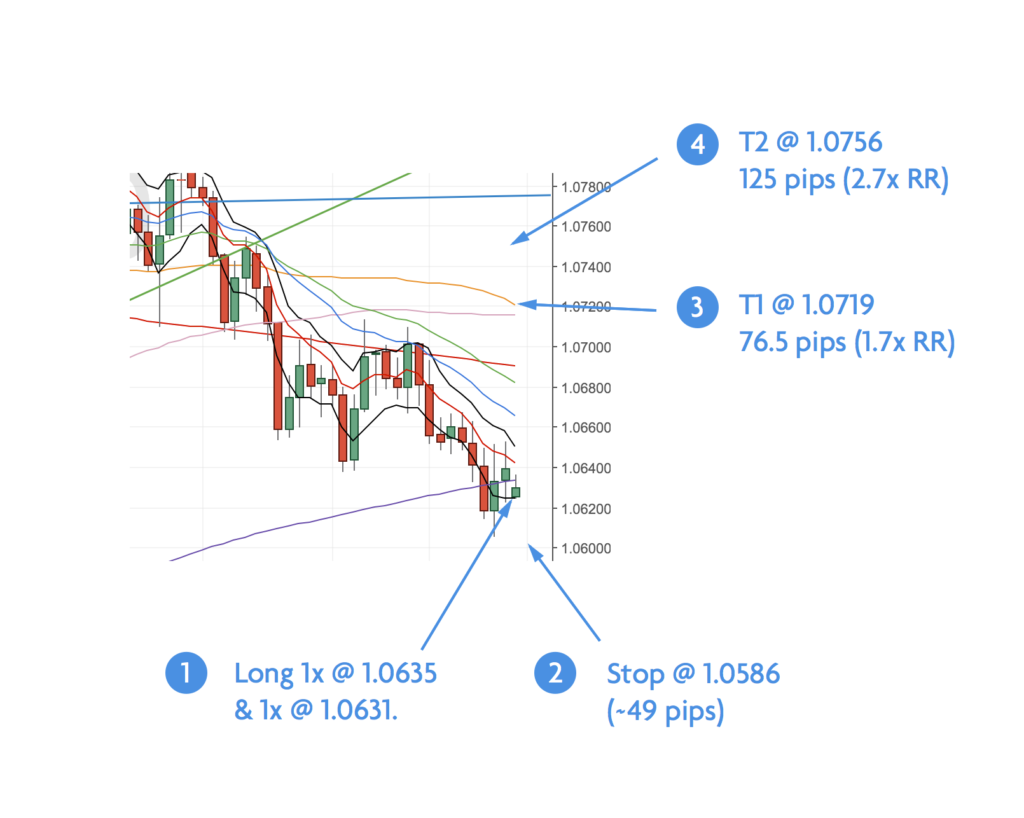
With my new approach to position sizing, my charts are very busy! But here’s the trade – I’ve manually opened the first 2 units. I’m using an order for the remaining 2 units.

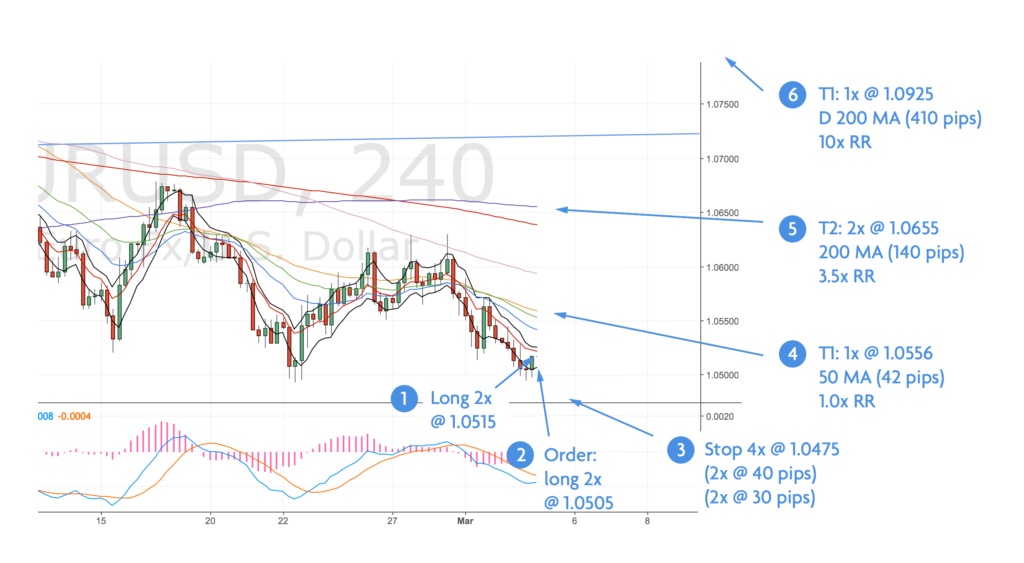
EURUSD 4H Trade Chart – 3 Mar

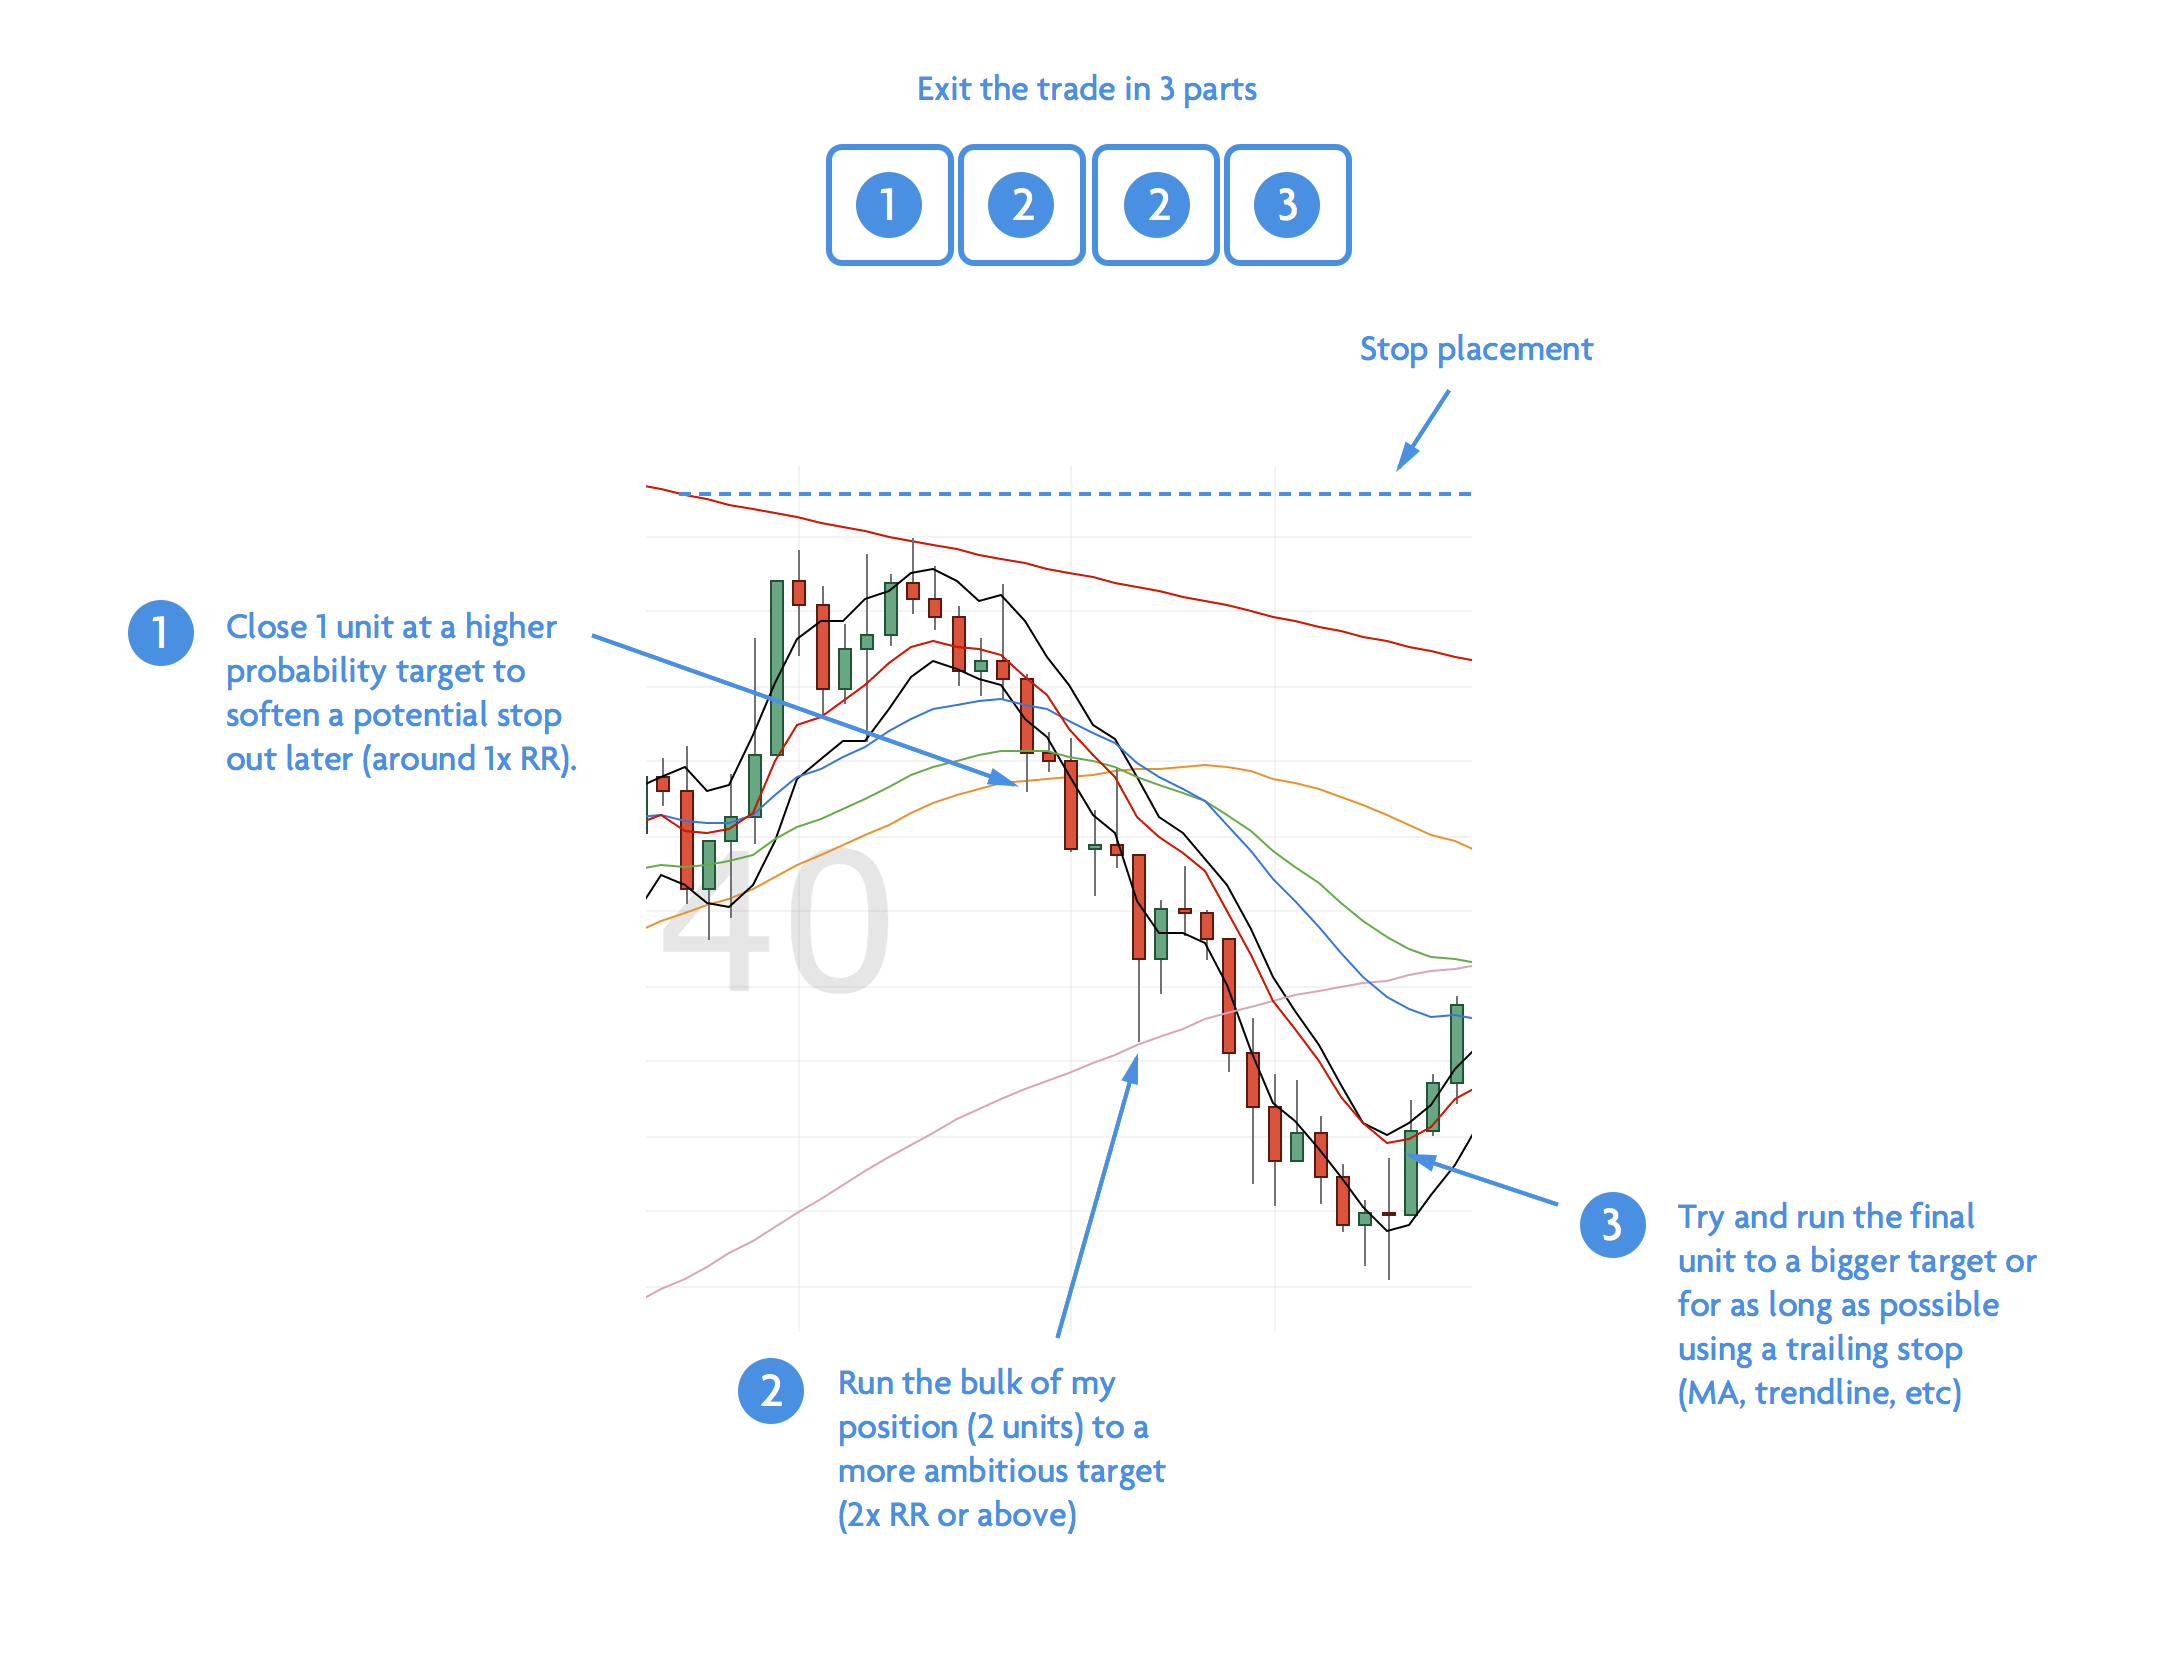
Targets are spread across as follows.

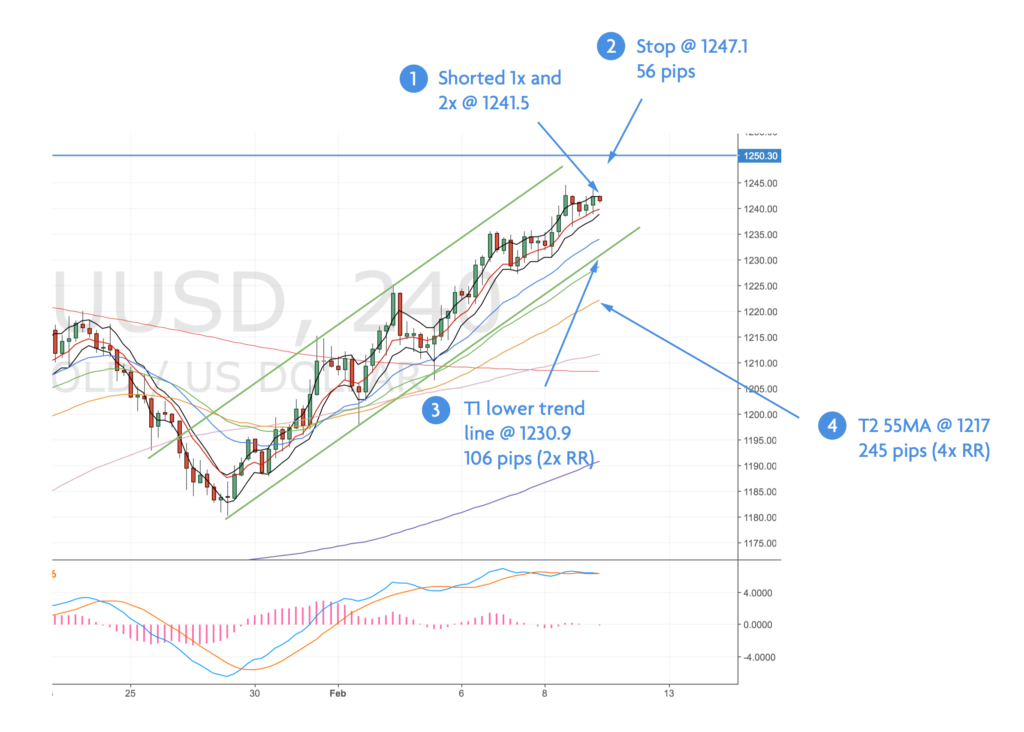
  1. 1x @ 4H 50MA. This will be the first target to hopefully limit my downside. It’s my alternative to moving my stop.
  2. 2x @ 4H 200MA. I thought about the 500 but they are so close I think it is fair to shoot for the 200. The 100 has been tested a few times, so I’m aiming for more pips.
  3. 1x @ D 200MA. the 100MA was recently tested on the daily chart, so I’d like to run the last position to the Daily 200MA.

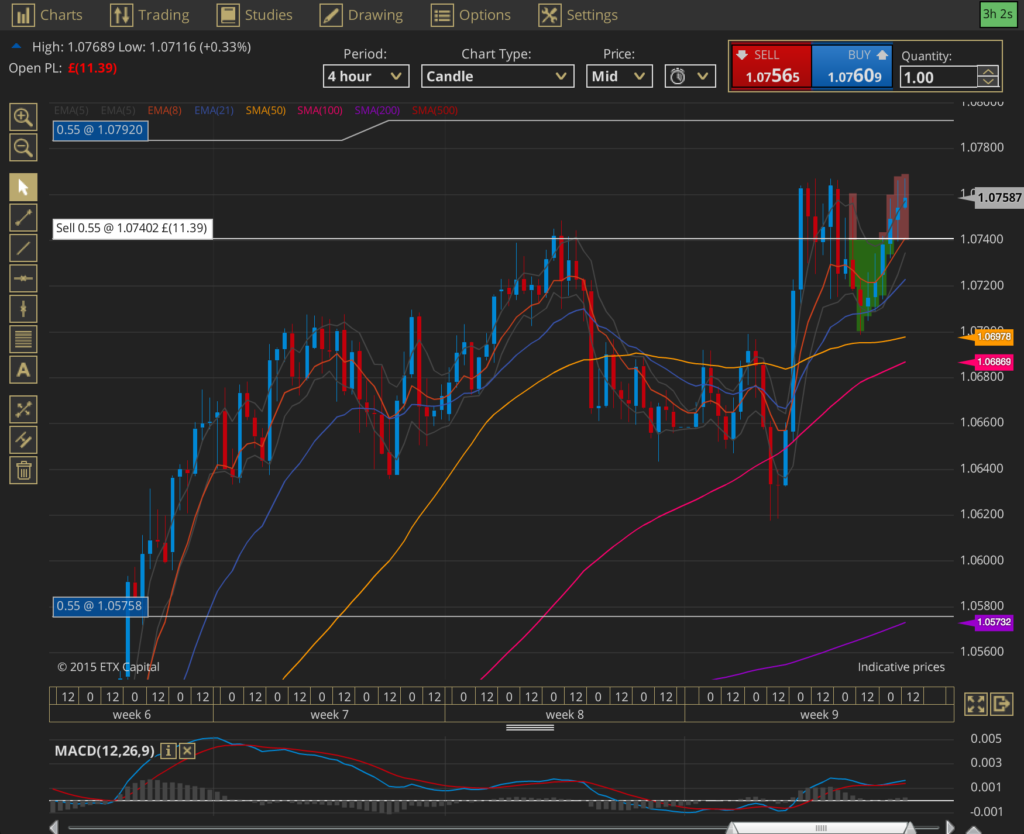
With the orders, stops and limits, my ETX chart looks terrible! I’m glad I’m using two different chart packages so I can keep things clean.

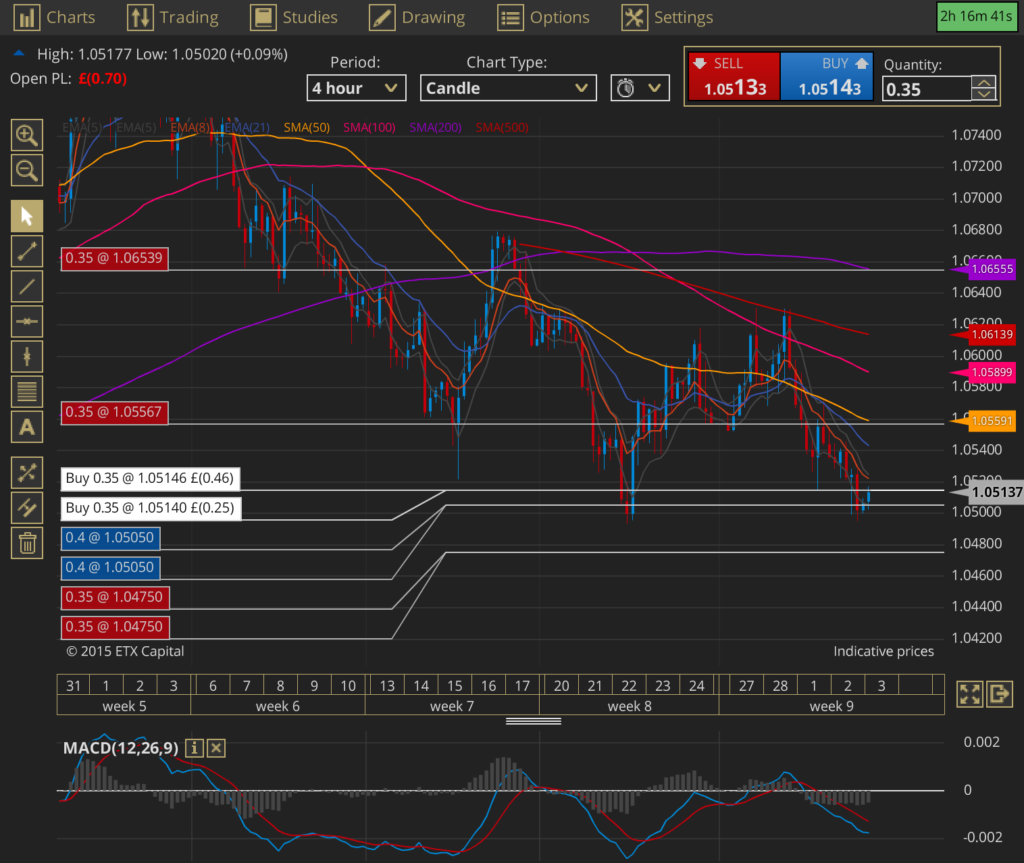
EURUSD 4H ETX Chart – 3 Mar

Update 1 – First Target hit – 3 Mar


Account Risk: 0.4%
Long: 2x 1.0515
Stop: 1.0475 (40 pips)
Tgt 1: Hit @ 1.0556, 4H 50MA (41 pips, 1x RR)
Tgt 2: 1.0655, 4H 200MA (140 pips, 3.36x RR)
Mindset: Not good, not bad

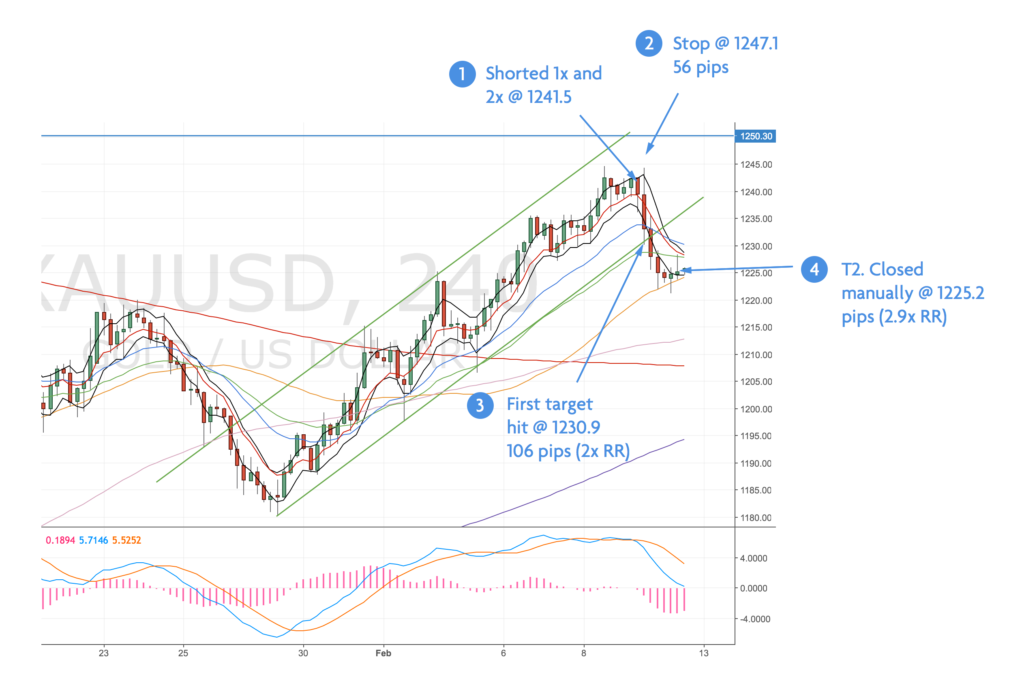
The second half of my position didn’t get triggered before price has moved higher. I’ve been surprised how quickly price has moved. I hit my first target within hours of placing the trade. Feel fortunate to have caught that wave.

For now, I’ve cancelled the remaining long orders and will watch price action.

My final target is still the 200MA. I saw we hit the 500MA this morning and price dropped back sharply. Maybe I’ve been too greedy to go for the 200MA? Time will tell – it’ll probably hit the 200MA at the exact same price level !

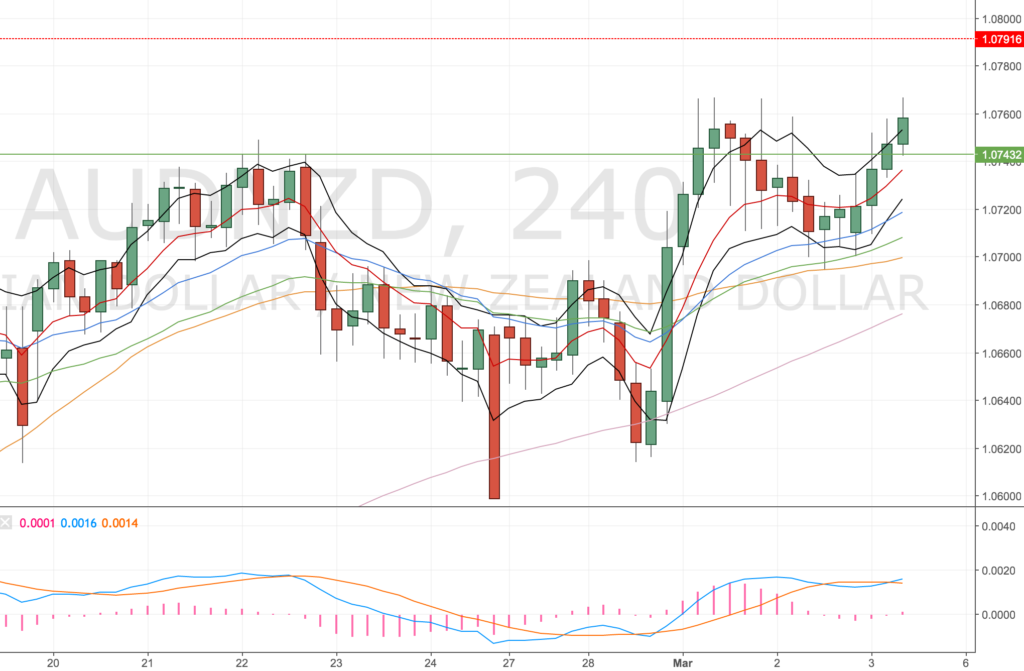
EURUSD 4H Chart – 6 Mar

I’d say the trade is break-even, since hitting my target, but I’m paying rolling charges so it might not be when I’m threw!

Update 2 – Wait and see – 8 Mar

I can’t claim not to be a frustrated with this trade, I was quite close to getting my exit but price has drifted away now.

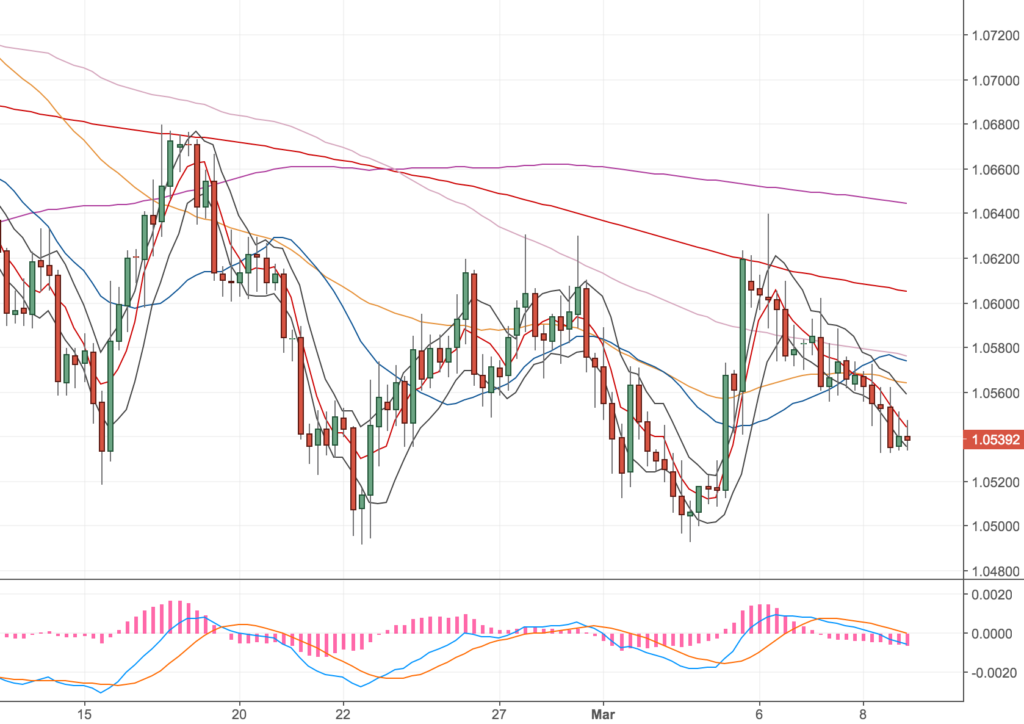
EURUSD 4H Chart – 8 Mar

Following the bounce and the fast move up I thought we might be into a trend change. However since hitting the 500MA price has just slowly ebbed away. I’m starting to think I’d been too greedy going for the 200 over the lower 500MA.

Hard to say, I wonder if we will move down to retest the lows and set up another divergence?! If we did that would be great for another long. Given the news events over the next two days I’m really not sure how to trade this if it does set up. The ECB meeting is today and includes rate decisions (one of the biggest factors of a price move) and forward guidance on the interest rate will move this currency.

The NFP figures are out on Friday too and the ADP figures (which forecast the NFP figures) were a big beat. So price movements could be huge.

I’ve really not decided what to do yet.

Update 3 – Final Target hit – 10 Mar

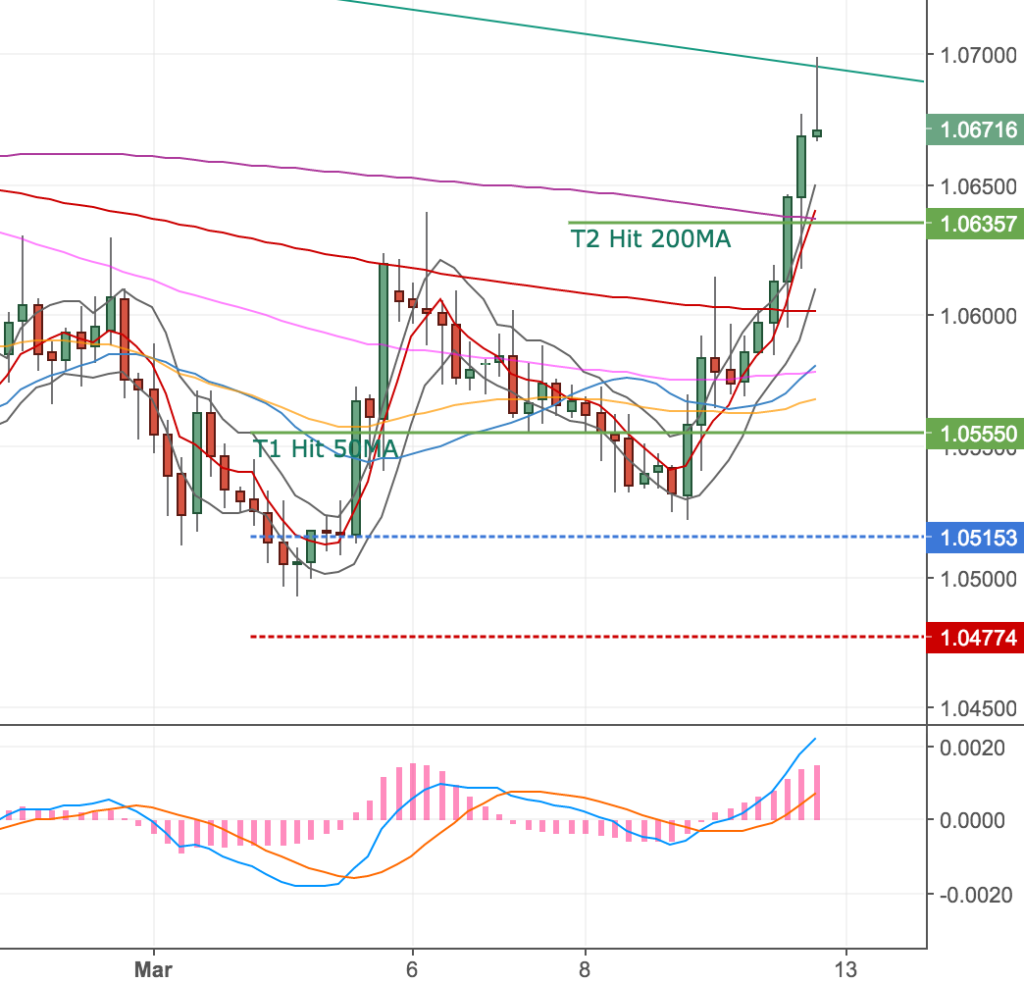
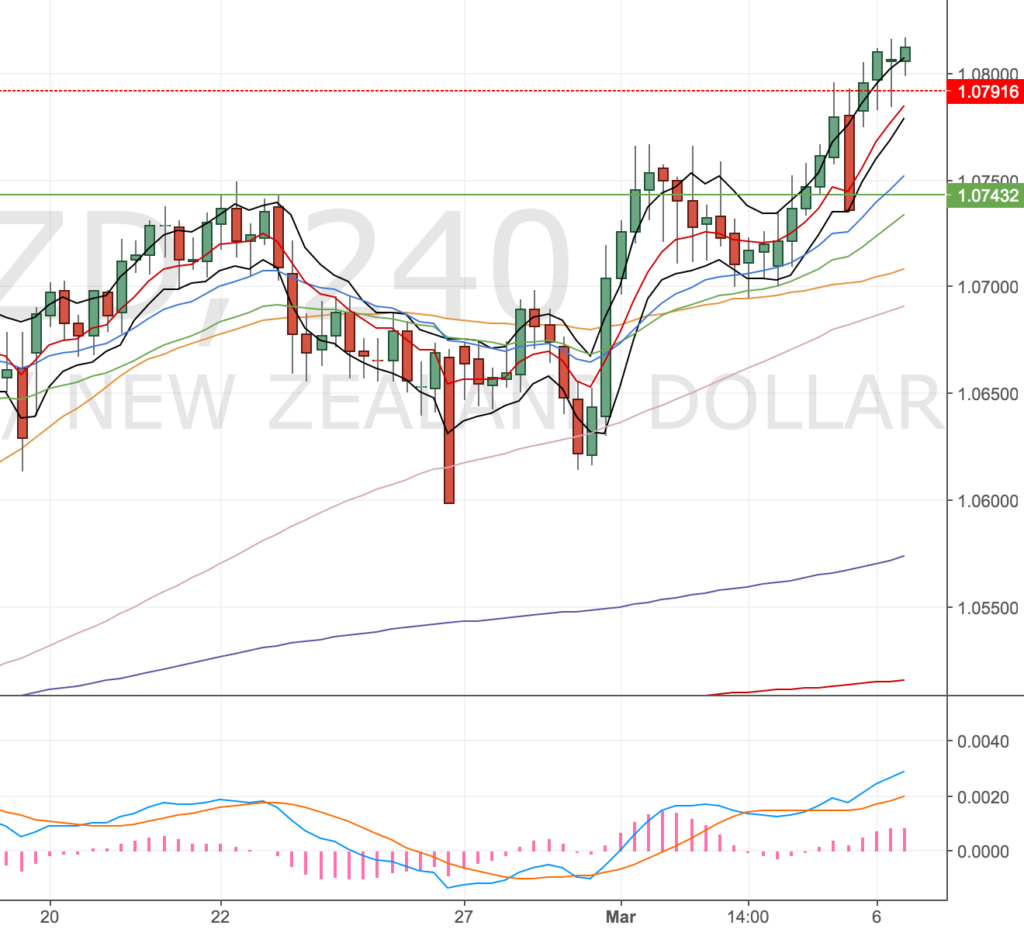
EURUSD 4H Chart – 10 Mar

My final target has been hit, feel pretty lucky about it now, after my call with Charlie last night he agreed going for the 200 over the 500 was probably too ambitious πŸ™‚

Anyway, I feel pretty lucky about this, price got up there real quick and I my limit order closed me out of the trade. The only frustration was that it wasn’t a full position like intended, just a half size. Makes me wonder if trying to scale into a position is worth it, it would marginally reduce loses but ultimately it would reduce the winners if only half the position gets triggered (hmmmm?)

I’m starting to think that trying to get better entries is probably not worth it. Question for Charlie!

Here’s the final trade.

Account Risk: 0.4%
Long: 2x 1.0515
Stop: 1.0475 (40 pips)
T1 Hit: 1.0556, 4H 50MA (41 pips, 1x RR)
T2 Hit: 1.0635, 4H 200MA (120 pips, 3x RR)

Now this position has closed I can add to my GBPUSD without maxing out my USD exposure, so I’ve added a final position. I wonder if I’m too early on the Β£ trade as the Fed rate decision is due Weds evening. Hopefully we can get some breathing space on the GBPUSD to handle any shock reactions to the market.

Position sizing

The time is too early o’clock, on a weekday morning, and I’m sitting down with my boy watching Numberblocks. (It’s a pretty good show for 1yr olds – you should check it out if you’ve got a little one who likes to get up early to watch TV!!)

The idea of the show is to teach kids numbers by combining and pulling apart blocks in various ways. It’s a nice visual way to teach sums.

Anyway, it dawned on me that this is exactly how I have been visualising my trades. By breaking down my trades into smaller units I can – ideally – average in at a better price, slightly increase the position size (whilst maintaining the same level of risk) and be more flexible with my exits.

It also allows me to participate in a trade in the event it just runs. I’ll only have half the position on, but I’ll be participating. Here’s how I see the entries and exits working.

Sizing trade entries

Here’s a typical entry example (shorting the market).

Entering a trade in a number of units

To summarise, the entry is broken down into two parts:

  1. As soon as the setup is confirmed, place half the trade at the open of the next candlestick
  2. Wait for a better price to place the remainder of the trade. This could be the band, an MA, a % amount retracement of the previous bar, etc etc.

The idea is to break down the trade into a number of smaller units so you have flexibility to go for multiple targets.

Closing the trade

The trade will close in one of three ways:

  1. A total stop out. 1% of the account is lost
  2. A partial stop out. 0.75% (or less) of the account is lost
  3. Winner winner chicken dinner.

Here’s an ideal example of how I might close my trade.

Exiting the trade in parts to be more flexible

The point is that by entering the trade with many units, you have the flexibility to pick several targets or even trail stop positions to try and catch a run.

This is where the MBT methodology comes in to get a feel for how the trade should be exited.

AUDNZD Short – 2 Mar


Account Risk: 0.4%
Short: 1.0740
Stop: 1.0792 (52 pips)
Target: 1.0565 4H 200MA & (likely) Daily 50MA (175 pips, 3.36x RR).
Mindset: OK – A little unsure, expecting a loser soon after my recent run of winners.

Update #1 – Just checking in – 3 Mar
Update #2 – Stopped out – 3 Mar

Saw this short set up during my morning scan. I actually quite like the trade because there are some good correlations on several timeframes and other aussie markets (AUDUSD and GBPAUD) are supporting the story that the aussie is looking weak.

I really want to get a DST set up on the GBPAUD so I’ve only gone for half my planned risk on this trade. This is so my total exposure to the aussie is within 1% account risk.

Here’s the trade:

4H Chart – the set up chart

AUDNZD 4H Chart – 2 Mar

Price has moved marginally higher and closed back inside the bands. (Although price has since gone outside the bands when I took the screenshot!) There’s also a marginal divergence playing out.

However the story of this trade is really on the higher timeframes.

Daily Chart

AUDNZD Daily Chart – 2 Mar

It’s this chart that really got me interested. Price has run into prior resistance, the 500MA and is showing a divergence from the last high on Oct 2016.

I also like the distance of the 500MA and 200MA from each other. When back-testing I often saw scenarios where price would ping-pong between bigger MAs (typical the 50 & 100 or 100 & 200).

Ultimately I’m looking for this chart to go higher to the weekly 200MA (see below) and the golden cross is currently in the making so I’m hoping we’ll get a fall to my target and a nice DST set up so I can get long!

Weekly Chart

AUDNZD Weekly Chart – 2 Mar

The chart shows the 200MA prior near miss, I’m looking for price to test the lower band before moving higher.

Outlook for now

I can see a lot of potential in this trade but I can also see this really kicking me in the balls! The momentum up to this point has been strong and the weekly chart does look good for a run to the 200MA.

It’s a wait and see affair. BTW never did get that long on the GBPAUD, price just flew away. Maybe in a few day’s time we’ll get another opportunity.

I feel like the pound is bottoming out and getting ready to make a resurgence.

Update – just checking in – 3 Mar

As part of my routine, I tend to any open positions at lunchtime. Being optional Friday at work (where everyone seems to work from home) – I also took a bit of time to reanalyse my trade and target. At the moment price is against me but I still see a decent amount of potential in this trade. (I need to be careful here though – I’m worried I’m getting too one-sided in my view.)

Here’s the current price action on the 4H chart. Green line is my entry, red my stop.

AUDNZD 4H Chart – 3 Mar

There’s potential here for a short-term, marginal divergence, to set up on this timeframe. I still won’t increase my position as I’m looking at other markets (long on the GBPAUD for example) but if the divergence does set up and I decide not to trade the GBPAUD, I would consider it.

At one stage the trade was with me by ~50 pips and touched the 50MA; so if we do get a divergence coming in, it would give me more confidence that we would hit my 200MA target. This is particularly true when you see the two prior touches of the 100MA and the proximity of the 50 and 100MA.

Incidentally, the divergence is not there on my ETX broker charts. Something that has confused me before (getting in too early on GBPCAD) but the very recent price action shows a spinning top and shooting star.

AUDNZD 4H ETX Chart – 3 Mar

However the AUDUSD looks to be bottoming and the AUDJPY is looking strong. So it’s a coin flip in my mind.

We’ll have to wait and see – but it’ll be interesting to see how this turns out. I’m feeling level enough to see this go either way.

Update – Stopped out – 3 Mar

Just got stopped out, Friday PM – no great shakes – the divergence is still there on the daily chart so might set up again.

AUDNZD 4H Chart – 6 Mar. Stopped out for a 0.4% loss

In hindsight looking at the aussie and the kiwi against other currencies they are both quite weak at the moment. so I was shorting one weak currency against another, so maybe I should’ve been happy to take the 50MA target.

Again I would’ve liked to have split my position down to scale out of the trade at the 50MA first target and then shoot for my original target 200MA, but I need to grow my account some more to trade like that.

Finally the GBPAUD hasn’t come to the level I need it to, however I can see a divergence setting up on the GBPUSD 4H chart which looks like it could be a good entry.

My daily scans are showing that we have a few set ups in the making on the Β£. To me the Β£ is looking like it’s ready to move higher. Same for the €. I wonder if the circus is moving out and the triggering article 50 will be seen as a good thing and we’ll start worrying about stock markets and the US economy? The budget is also this Weds 8th Mar – so may mark a turning point.

GBPCAD Short – 1 Mar 2017


Account Risk: 0.4%
Short: 1x @ 1.6469
Stop: 1.06529 (50 pips). Above 500MA
Target: 1.6374 (95 pips, 1.6x RR). 4H 50 & 100MA.
Mindset: Unsure, I jumped into the trade.

Saw the divergence setting up on the GBPCAD in my morning scan. I do my scans from a FXCM data feed which doesn’t correspond with my ETX bar open/close times. I had a divergence setting up on the FXCM feed, but no close inside the bands yet. My ETX chart showed a close inside the bands – but I didn’t notice the MACD wasn’t diverging on this chart until after I’d placed the trade. So technically I shouldn’t have taken this trade.

Here’s the trade …

GBPCAD 4H Chart – 01 Mar

I did spot a couple of other things that supported my case to get short. Price was at the top of a daily wedge pattern and the 4H 500MA was overhead acting as a resistance point.

GBPCAD Daily Chart – 01 Mar

However, there’s a weekly bullish double divergence in play which indicates I’m going against the direction I should be looking to trade.

GBPCAD Weekly Chart – 01 Mar

Once I realised my mistake, I thought about cancelling the trade, but decided to leave it and see how it worked out, even if it wasn’t a true divergence it was still interesting to see what happened.

Note: One thing that surprised me when placing the trade was the spread (5 pips) – I’m used to EURUSD and GBPUSD (1 pip) – so the stop and target both had added space for the 5 pip spread.

Update: Target hit – 01 Mar 2017

I feel very fortunate about this trade, my limit order hit just after lunchtime for almost 100 pips. Some news came out in my favour and drove price down. I feel lucky about this. The chart doesn’t show the divergence I was looking for and I think it was a mistake and I got away with.

During back-testing I’ve said to myself to take the marginal divergence trades – even if they are not strictly meeting the criteria. However if I had lost this trade I would’ve been berating myself. So I’m grateful it worked in my favour.

Next time I’ll wait for a close on the timeframe I’m studying and then move to the ETX timeframes. Also I will try and maintain the spirit of being open to opportunities and not being a perfectionist about trades.

Final GBPCAD 4H Chart – 01 Mar

Gold DST Short – 27 Feb


Account Risk: 0.7%
Short: 2x @ 1254.8 & 3x @ 1258.7
Stop: 1266 (112 & 80 pips)
T1: 2x @ 1235 (198 pips, 1.75x RR). 4H 100MA & Daily 21EMA.
T2: 3x @ 1200 (587 pips, 7.3x RR). 4H 500MA, Daily 50MA & Daily 500MA
Mindset: Pretty even

Update: Part of order triggered – 1 Mar
Update: Limit order reached – 2 Mar

Been trying to improve on my routine for checking the markets and setting alerts. I just had an alert on Gold which has spiked up and come straight back down – across the bands. I’m waiting for a retest of the 8EMA to get short and then another re-test of the upper band to get short some more (building my position). The position size for each part is slightly different because the risk is less with the upper band set up.

The good thing about this trade is the two chart set up divergence on the daily and 4H charts. So I’ve tried to optimise my entries by going short for a smaller position on the 8EMA and a slightly bigger position on the upper band.

The targets are both set by the daily chart being the 21EMA and 50MA (which correspond with 4H MAs for now)

Here’s the two chart set ups.

Daily chart

Gold Daily Chart – 27 Feb. Marginal divergence from early Feb until now.

4H chart

Divergence and price action put in a decent down bar – crossing the bands.

It’s just an order for now but it’ll be interesting to see if I can get filled! Here are the details…

Gold Order Details – 27 Feb

First part of trade triggered

The first part of my trade was triggered. Price moved away from my entry and after initially moving my order down, I decided to wait and see if price action would come back up to my original order levels (partially because it had already hit the 4H 21EMA). So I put the orders back where they were. I was happy to take a lose at those levels for a run down to the Daily 21EMA.

Price came within 1 pip from filling the second part of my order, but it didn’t get hit so here’s where I am currently.


Account Risk: 0.3%
Short: @ 1254.8
Stop: 1266 (112 pips)
Target: Daily 21EMA @ 1233 (208 pips, 1.8x RR).
Mindset: Good – albeit feeling impatient. Dunno why!?

Price so very nearly hit my limit order, but pulled away since. I am looking for a reversal now down to my order. I wouldn’t be surprised to see this get stopped out now and another divergence set up on the higher timeframe.

One other thing to note: it’s great having a divergence show on the daily timeframe and therefore have a legitimate daily target to aim for. it makes managing the target so much easier.

Gold 4H Chart – 01 Mar 17

Limit order triggered

Well the price has yo-yo’ed around but it has now hit my order. I am pretty pleased with the trade, it’s a shame the other portion wasn’t part of the trade because I’d like to still see if we can run the remainder to the daily 50MA.

Here’s the final trade chart.

Gold 4H Chart – 2 Mar

Conclusion

Overall I’m really happy with the way I traded this:

  • Didn’t chase the market to get an entry
  • Didn’t get upset about my order not getting triggered
  • Didn’t panic when price missed my target and came against me
  • Didn’t close my position in frustration

Monthly review – Feb 2017

Overall I’d give myself a grade C
Account performance +0.16% (basically scratch)

Not a great month. I started trading on 23 Jan and we’ve now done a month of trading. The biggest failings have been my lack of routine (not checking the markets at set times so missing set ups) and trading too few markets (having no skin in the game). I started out the month looking at Daily and 4H charts of EURUSD, GBPUSD, EURGBP and Gold.

It seems to me you need to build up your trade history/mileage to get comfortable – so I need to be in more markets seeing more varying price action. Making a handful of trades each month won’t help me improve that quickly. So I need to expand the markets I trade and aim for around 10 – 20 trades a month (see updated trade plan)

In the later week I started following more of the major crosses, although I still managed to miss most trades due to lack of routine. So that’s something I’ve got to get licked ASAP!
In summary here’s what worked and didn’t.

Trade summary

This month I took 4 trades, 3 were winners, 1 loser. I also opted not to take a trade on the AUDUSD because although it set up, it was very close to resistance so felt like I might get needlessly stopped out. I also felt if I did try and trade it, I wouldn’t trade it well with my current level of experience.

Of all the markets I now follow there were 24 DST trades: 19 winners, 5 losers (so it should’ve been a great month).

Here’s a run-down of the markets and set ups.

  • Blue annotations are winning trades taken
  • Red annotations are losing trades taken
  • Black circles are missed DST set ups (they appear in pairs or triplets)
  • Dotted black circles would be missed DST trades that would’ve been a loser (I recorded these to help with my confidence)
  • Grey circles are DST set ups I wouldn’t know how to trade

Gold

XAUUSD 4H Chart – Jan & Feb 2017

There were only set ups on the 4H chart. I spotted two and took both – the second was marginal – but worked out. I was relatively happy with both trades, felt my target selection was good, but I did lose 40 odd pips by not moving my limit order in the morning.

EURUSD

EURUSD 4H Chart – Jan & Feb 2017

I didn’t realise my first trade was a double divergence, so I should’ve set my targets higher given the recent price action testing the 100MA. My other trade was a loser – a divergence that set up but then ultimately didn’t and proved me wrong.

What was frustrating was missing the next trade. I was following on my phone but didn’t check the market at the right time, so missed my entry!

Again no daily set ups.

EURGBP

EURGBP 4H Chart – Jan & Feb 2017

Missed these two trades, both would’ve worked out and the second trade was a double divergence so would expect price to go higher for the rest of this month.

GBPUSD

GBPUSD 4H Chart – Jan & Feb 2017

Watched this first divergence really closely but the price action flew past any realistic entry. In hindsight I did wonder about trying to enter on the lower timeframe 1H. In theory it would’ve been possible but might’ve been difficult to juggle with work.

Here’s the chart. Would’ve definitely resulted in two attempts to make it stick.

GBPUSD 1H Chart – Jan & Feb 2017

The only other thing I noted was the divergent like behaviour testing the 200MA. Although price didn’t close lower, the MACD kept rising and it made we wonder if the 200MA was distorting price action a little?!

This is more obvious on the next chart.

BTW no Daily set ups again.

GBPAUD

GBPAUD 4H Chart – Jan & Feb 2017

Here’s the better example of the 200MA distorting price action. Interesting to see if that plays out in the future.

Just one true divergence which I missed entirely! Looking back, I reckon it would’ve taken 3 attempts to make it stick.

GBPCAD

GBPCAD 4H Chart – Jan & Feb 2017

Just one marginal divergence – I did spot this but just didn’t realise what was going on until it was too late. It’s much easier to spot a divergence once price action has been printed on the chart!

AUDUSD

AUDUSD 4H Chart – Jan & Feb 2017

This market has been trending like crazy – there’s a nice trend channel in play. The first divergence on the chart I missed but worked out fine, the second one I bottled because it was so close to the upper resistance line. My stop would’ve been on or near the resistance area so it seemed stupid to me to take the trade.

Technically I should’ve taken the trade – my goal was a flawless month of taking DST trades, but I just didn’t feel comfortable taking this one.

USDCAD

USDCAD 4H Chart – Jan & Feb 2017

Two really nice divergences missed here. The second one is marginal again but I always included these scenarios in my back-testing. Disappointed to have missed these two especially as the first one coincided with a Daily divergence so I could’ve ramped up my targets.

USDCAD Daily Chart – Jan & Feb 2017

USDJPY

USDJPY 4H Chart – Jan & Feb 2017

Not sure I would’ve taken the first divergence, with the wicks going lower than the prior low and the decent divergence in play, I’d like to think I would’ve πŸ™‚ The second divergence almost materialised into a double. Given the price action I could see this as a good place to add to a position if risk allowed.

Interesting to me how both were not really clear cut trade scenarios.

FTSE

FTSE 4H Chart – Jan & Feb 2017

Just the one divergence, but I can see another nice one in the making! Nothing on the daily.

SPX

SPX 4H Chart – Jan & Feb 2017

Feels like the rise in the S&P is relentless. There’s a definite short setting up at the moment but again another set up I saw but didn’t really know how best to trade the price action (being inside the bands and not really having any clear swings higher or lower).

Nothing on the daily.

What worked

  • I didn’t break my rules
  • I’ve had a couple of +2x reward to risk trades
  • I generally picked good targets

What didn’t work

  • Due to a lack of routine. I missed the majority of set ups and wasted 40 pips by not closing one position!
  • My entries could’ve been better. I should scale in to positions more.
  • My position size wasn’t really big enough. I should increase this to 1% so I can build the account quicker.
  • I started off trading too few markets for my timeframes (not enough set ups coming along). I’ve expanded to most of the major currency crosses now.
  • Reviewing all timeframes before making a trade (forgot at least twice), so I didn’t know whether I was with or against trend and whether my targets might not be realistic.

Changes for the next month

THe key changes are more markets, more routine, looking back further and using the 1H timeframe for entries.

I also need to update the plan to include:

  • The change in markets markets
  • Revise my goals to be achievable for next month.
  • Add a section on routine (Morning, Lunch and Evening quick market reviews i.e. 10 minutes)
  • Start adding calendar reminders to review my plan at the beginning of each week
  • Set alarms to remind me to check the 4H charts when they are setting up
  • Get better at setting alerts

Mindset: Method hunting treadmill and importance of risk management

Trading is about managing pain, you’ve got to get used to losing and not thinking that you’re making a mistakeanon trader

Just heard an interview on Chat with Traders and felt there were a number of great pointers for people like me grinding it out in the early parts of the trading journey.

One thing that really surprised me is the part on systemising a strategy and how the discretionary element of the strategy can make something that seems profitable, unprofitable (starts at 14:40).

The following also felt particularly applicable to me and some of my old habits:

11:52 – 14:15 The ‘method hunting’ treadmill of new traders who obsess over entries and win rates.
21:20 – 22:24 Really understanding your strategy and accepting a lower win rate.
33:28 – 41:35 The importance or risk management and position size
49:30 – 52:14 Lack of risk management for a given strategy and not looking at position size, market correlation and trade approach together
52:14 – 53.45 The mistake of trying to achieve a linear performance and not truly appreciating that you win some, lose some.
53:50 – 54:40 Why you should only review performance in batches of trades so your changes are valid and meaningful.
55:50 – 56:03 The best advice of all, riding out the pain of a run of losers

Some other good quotes

(new traders) focus on the entry and when things stop working they go back to the drawing board … down the rabbit hole looking for Alice. That’s the treadmill most retail traders get on in the beginning. We call it method hunting.
new traders aren’t willing to accept a lower win rate because it doesn’t feed the psychology. They don’t want to experience any pain … human beings are always uncomfortable with risk but it’s really about how you manage it (that makes you a successful trader).
Being a good discretionary trader is about managing discomfort
The most important thing is risk overlays: how you bet, what size and how you’ll adapt to volatility over time.
Each time you trade the deck has been reshuffled and if you lose it really doesn’t mean anything … you win some you lose some and you have to be comfortable with that. So start thinking about blocks of trades rather than analysing one or two losers
If I lost this trade it must mean I made a mistake, and if I win this trade it must mean I’m pretty smart. Unfortunately the truth is neither is true. You win some you lose some and you have to become very very comfortable with that and grind it out

AUDUSD Set up – 23 Feb

I really want to take this short trade but as it currently stands the entry is too close to a major resistance level for me to be comfortable.

It’s a really tough decision given the triple divergence but I just feel it would be stupid to put a 20 pip stop off the high to coincide with that exact level of resistance.

Here’s the set up on the four hourly.

A triple divergence in play BUT price hasn’t hit the upper trend line or the prior resistance level.

I would typically be looking to take 2x positions at the 100MA and the 200MA as targets.

To mitigate this nearby resistance level I considered putting on a 40 pip stop, to give me more breathing space, but that blows out the risk to reward (goes <1). It would also just feel stupid to risk more. In these early days of trading a new system I don’t think it would do my confidence any good to break the odd rule just yet.

Price has recently broken out of a monthly channel going back 4 years. So a trade down to retest the monthly upper channel (blue line) would be a great target – but I would only run the trade to that level once I’d booked some profits on the majority of my position.

So I’m standing aside for now. I will wait and see if price wants to come higher (whilst diverging) to enter the market. It might not, but I wouldn’t be happy to have a wider stop or place a stop right on the resistance line.

Here are the higher timeframe charts

Monthly

Long term trend line recently broken to the upside. Could a retest be on the cards?

Weekly

Price has been in a sideways channel for 18 months. There’s also a weekly divergence in the making.

Daily

A divergence might be setting up here too.

EURUSD DST Long – 12 Feb


Account Risk: 0.7%
Long: 1x @ 1.0635 & 1x @ 1.0631
Stop: 1.0586 (45 & 49 pips)
T1: 1x @ 1.0719 (85 pips, 1.7x RR). 4H 50MA.
T2: 1x @ 1.0756 (125 pips, 2.7x RR). Daily 100MA.
Mindset: 50/50, ok set up. My long term view is up, short-term view might be down. Lots of MAs to bounce around.

Update 1 – Something’s bugging me – 13 Feb 2017
Update 2 – Divergence didn’t materialise – 13 Feb 2017
Update 3 – Stopped out – 14 Feb 2017

Watched this chart into the close on Friday to see if price action would close inside the bands. It’s a divergence on the 4H but also a double divergence on the hourly chart. I’m really 50/50 on this trade, my instinct tells me that prices are going to go lower (not higher). But I’m about trading the divergences I see rather than my opinion so I’ve placed a trade.

I’ve slightly upped my position size to nearer 1%. I’ve got two targets in mind so I’ve opened two positions. My first target is the 50MA on the 4H chart. The other is the 100MA on the daily chart. Price has recently tested the daily 100MA, before coming down to the 50MA, so I’m looking for a retest.

4h Chart – Set up

4H EURUSD Chart – 12 Feb 17

Hourly Chart

Here’s the hourly chart that gave me more confidence to place the trade.

Hourly EURUSD Chart – 12 Feb 17

Daily Chart

Here’s the Daily chart showing the 100MA target I’m looking at.

Daily EURUSD Chart – 12 Feb 17

Update 1 – Something’s bugging me

I judge how well I’ve executed a trade by how often I check on price (e.g. how nervous I am). Usually I just let it do it’s thing, but something was bugging me and I kept checking on the price action during the day. I think it was the way I set up my targets, I am happy with the 4H target, but I have no real justification for the Daily target (there’s no divergence setting up on the Daily chart).

I’m also not happy about the number of bigger MAs in the way of my targets. I don’t have a great feel for their significance yet.

So I’ve gone back over my charts to recheck what’s going on.

Quarterly Chart

Quarterly EURUSD Chart – 13 Feb 2017

We’re on the lower trendline of a major trend channel going back to the 80s. I think it’s more likely to assume we’ll continue in this trend until proven otherwise (for me that would be a number of quarterly closes below the trend line) and the monthly chart pointing towards more downside.

Monthly Chart

The monthly chart kind of looks bullish to me. We’ve got an almost formed divergence.

Monthly EURUSD Chart – 13 Feb 2017

Weekly Chart

This looks to me like we may come lower to test the lower band. So perhaps more downside on the cards before any move higher?

Weekly EURUSD Chart – 13 Feb 2017

Thoughts going forward

The Daily and 4H Charts haven’t really changed from above. I don’t think I have justification to aim for a daily 100MA target without a daily divergence. This morning the hourly timeframe hit the 50MA (21MA on the 4 hourly).

So I think I need to rethink my targets.

Looking again at the Hourly and 4H charts

On the four hourly chart we’ve tested the 21MA 3 times (the last time was this morning), we’re chopping around the 200MA but I’m ignoring it for now – from back-testing this happens quite a bit.

4H Chart – 13 Feb 2017

The 500MA looks like a fair target for a retest to me and the 50 is heading down so I can see price hitting both MAs at a similar level. So I’m happy to pick that as a target.

As I’ve been typing this the Euro has been heading lower, but it looks to me like a triple divergence might set up on the hourly chart (see my purple and grey lines)

Hourly Chart – 13 Feb 2017

If it does and sets up with the bands I’m currently thinking I’ll up my position to the full 1% and target the hourly 100MA. Something I wasn’t thinking I’d say when I set out to update this post.

The hourly 50 got tested this morning and the divergences are fairly clean (for now).

So – at the moment – the trade is:


Account Risk: 0.7%
Long: 1x @ 1.0635 & 1x @ 1.0631
Stop: 1.0586 (~47 pips)
Target: 1x @ 1.0684 (1x RR, 50 pips) 4H 500MA.
Mindset: Happier with the target but not the RR.

I will watch the hourly chart for the triple divergence set up.

Update 2 – Divergence didn’t materialise

I set some alarms and checked the 3, 4 & 5pm closes on the hourly chart and price didn’t make it back into the bands. The 4H divergence also didn’t materialise, price headed lower. So this looks like being a loser (not stopped out yet).

4H EURUSD Chart – 13 Feb 2017

Interestingly stops should really be set as points at which you’ve been proven wrong. I feel pretty satisfied that I’m not right on this trade. So maybe I should be reducing my stop margin?

Can’t say I don’t feel a little disappointed about this trade, the set up seemed pretty sweet at first. If the hourly chart had closed inside the bands this afternoon it would’ve been a text book set up too. Oh well, I heard a trader interview with someone called Michelle Koenig she made an interesting observation about trading emotions and taking loses.

To take the emotions out of trading you need a trading plan/strategy which tells you why you’re getting into those trades and how you’re going to manage those trades; but also time in the seat, so as time goes on, the big emotional roller-coaster becomes more like rolling hills which then becomes a washboard or driving down a bumpy road.

Update 3 – Stopped out

Just got stopped out of my trade, I thought it might turn around after a small dip overnight, but no such luck. The position closed at 1.0586. No great shakes.

4H Chart EURUSD – 14 Feb 17

Thinking about the trade execution:

  • I definitely could’ve picked better targets initially. I was happier with them in the end.
  • The entries were okay but for future I might look to lower timeframes to get confirmation and a better entry price and risk to reward
  • The risk to reward was verging on sub 1 (so not worth the risk). I need to be more careful of this scenario
  • I’m glad I was trading at a bigger size – I want to be moving on with my account
  • I think the trade was fine to take – even though the divergence didn’t work out

Question for Charlie: When trading off the hourly timeframe would he trade a divergence in the early evening (when price seems to drift sideways)?

Gold DST Short – 9 Feb 2017


Account Risk: 0.5%
Short:(1x & 2x) @ 1241.5
Stop: @ 1247.1
T1: 1x @ 1230 (2x RR)
T2: 2x @ 1217 (4x RR)
Mindset: πŸ™‚ Doubt it’ll work out, but happy to pay for the opportunity.

Update 1 – T1 Hit – 8 Feb
Update 2 – Closed the trade – 9 Feb

I’ve been routinely checking the markets for potential set ups and saw this on the Daily chart which looked like a set up was potentially building to get short on Gold. It looked like price was also running into a cluster of resistance which meant that any trade could well not work out, moving higher and hitting a stop.

Daily Chart

Gold Daily Chart – 06 Feb. Divergence setting up?

Weekly Chart

Gold Weekly Chart – 6 Feb. Resistance levels above.

The Daily set up didn’t materialise – price went higher – but it did develop on the 4H chart.

Four Hour Chart

When I checked this chart (a couple of days later), price had already closed inside the bands and moved higher so I had a nice level to get short with a marginal divergence.

Gold 4H Chart – 9 Feb. A marginal divergence has set up.

I doubt this trade will work out given:

  • The four or five resistance levels slightly above price
  • Gold is spikey as hell and likes to test levels

For now, the trade is on. Short @ 1241.5. Two positions: one small, one medium. My plan is to run the small position to the trend line (near the 21MA) and the bigger position to the 55MA, which hasn’t been tested for a while. The idea with this is the first target will cover some of my risk if price doesn’t get down to the 55MA before moving higher.

Slight deviation from my normal approach but the trend channel is pretty clear and makes for a good target as it’s slightly further than the 21MA.

Update – T1 Hit – 9 Feb 2017

Price broke down almost straight after I placed the trade. Very lucky with the timing!

My first target got hit pretty quick. Now running the rest to the 55MA. 56 pips banked, albeit at a tiny position.

Update – T2 Hit – 10 Feb 2017

My second target was hit early this morning. BUT, I wasn’t up in time to move my limit order higher (to track the 55MA) so I didn’t get filled! Ops. As the market has already tested the MA I just closed my position when I got to work.

Final Gold 4H Chart – 9 Feb. Not the best execution but an OK trade.

Pretty poor mistake. Gave back 40 odd pips! Sloppy.

The good thing is, I didn’t get stressed and rush about to close my position. I kept it together πŸ™‚ It’s another lesson learnt, set alerts ahead of your targets when you’re not going to be around. I wonder how I would’ve been following a string of losing trades? (Would probably need to upgrade that gif!)

Final RR was 2x and 2.9x (should’ve been 3.5x!!!) It’s good to be closing some 2x+ RR trades though.

What was good about this trade was the better entry allowed me to up the position size without risking more money. So I’m happy enough with the trade.