Author Archives: admin

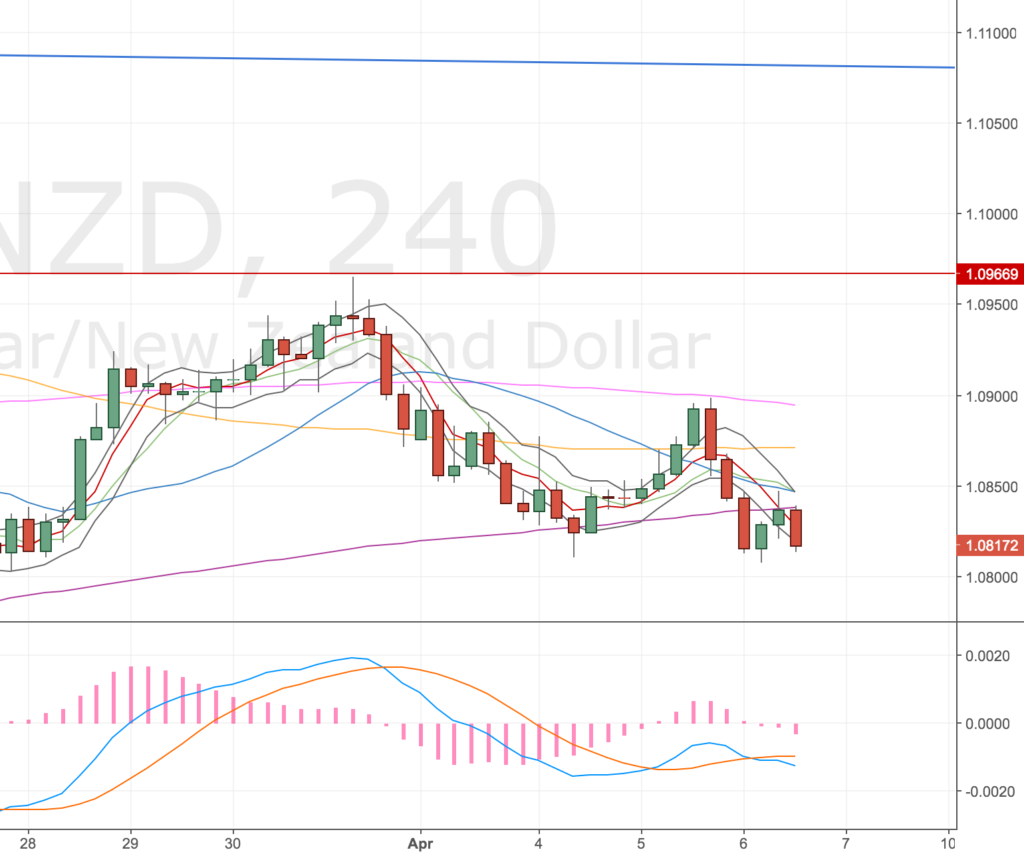
AUDNZD DST Long – 6 Apr 17


Risk: 0.2%
Long: 1.0817
Stop: 1.0803 (15 pips)
Target: 1.0893 (4h100, 76 pips, 5 RR)
Confidence: Medium

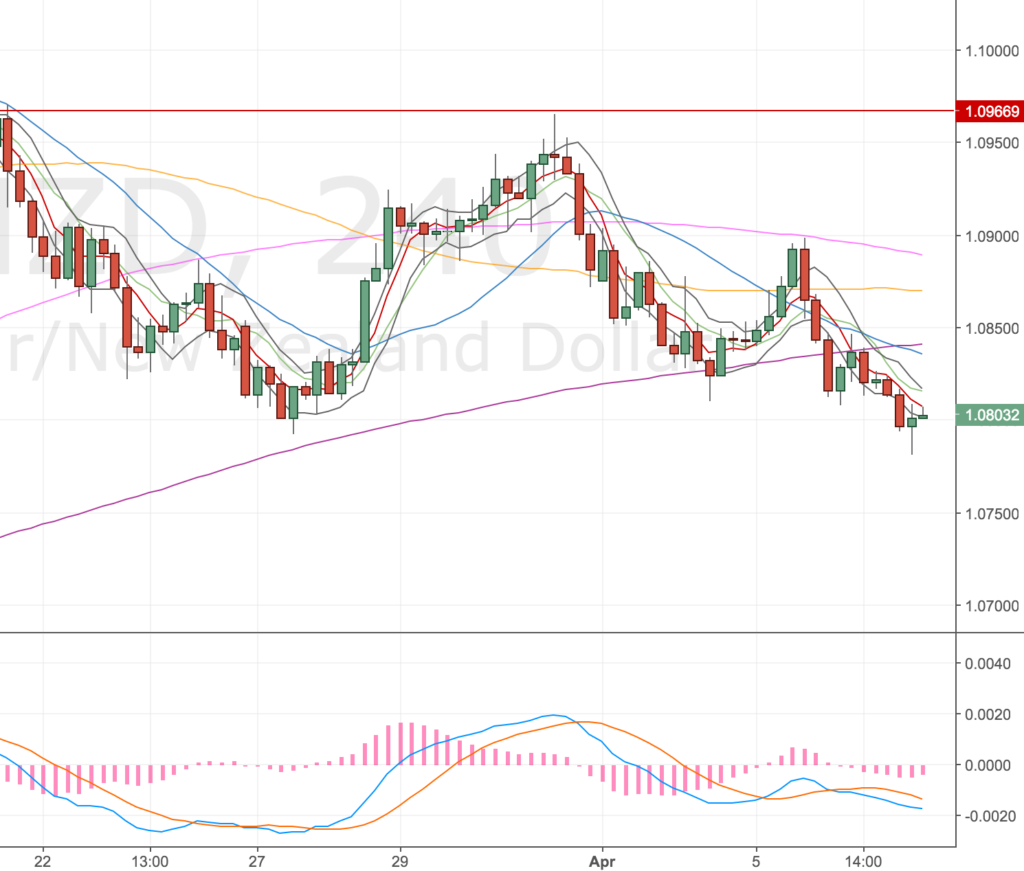
Stopped out – 7 Apr

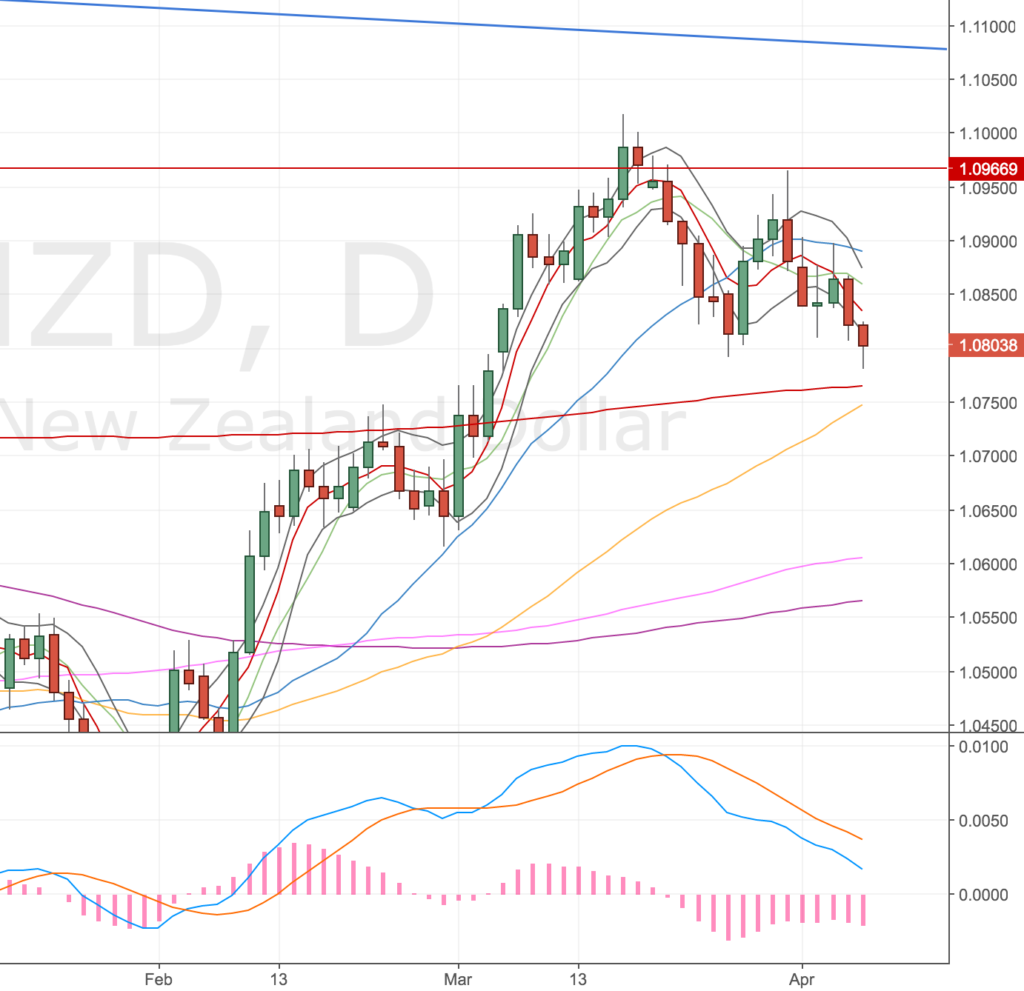
Just put this trade on the AUDNZD, has set up a marginal, but allowable, divergence on the 4h chopping around the 4h200. On the daily and weekly we are close to the upper trendline which makes for a nice target. The daily chart does also show us close to the d500 though, so we may get more downside yet.

AUDNZD 4H Chart – 06 Apr 17

My entry was on the lower band – just outside – but I figure you’re going to get price action like this from time to time, so I’m classing it as a fortunate entry. I tried to add an additional unit to my position but price rallied 5 pips almost immediately so I waited and then it continued to move higher. In hindsight I should’ve probably put in an order for any retests of the level, but I didn’t. I have my eye on the AUDUSD & AUDJPY too so wasn’t too worried.

My stop is now reduced to 5 pips following my chat with Charlie. I did some brief analysis on my last month’s trades and it turns out that a tighter stop is more profitable, despite getting stopped out more often and having to re-enter the market (when a valid signal is still there). It worked out between 15 – 30% more profitable (that really surprised me).

Stopped out – 7 Apr

I got stopped out overnight, minor nip out will look for further set ups if the arrive. One point, given the proximity of the d500 I will only trade this again at a smaller size. The 4h divergence I am trading is off the 27 Mar low, was a marginal double divergence until last night.

4h Chart

AUDNZD 4H Chart – 7 Apr 17

Daily Chart

AUDNZD Daily Chart – 7 Apr 17

CADJPY DST Long – 5 Apr 2017

Acc Risk: 0.35%
Long: 82.334
Stop: 81.900 (43 pips)
Target: 83.457 (4h100, 112 pips, 2.61 RR)

Update – Another mistake, forgot to cancel my order – 5 Apr

I’ve been watching the ¥ pairs quite closely as they are all setting up to the long side. I’ve left the GBPJPY alone for now; the tight range price action is confusing me, we’re also close to a major daily low, so feel it would be prudent to wait for that to be tested (hopefully with a divergence).

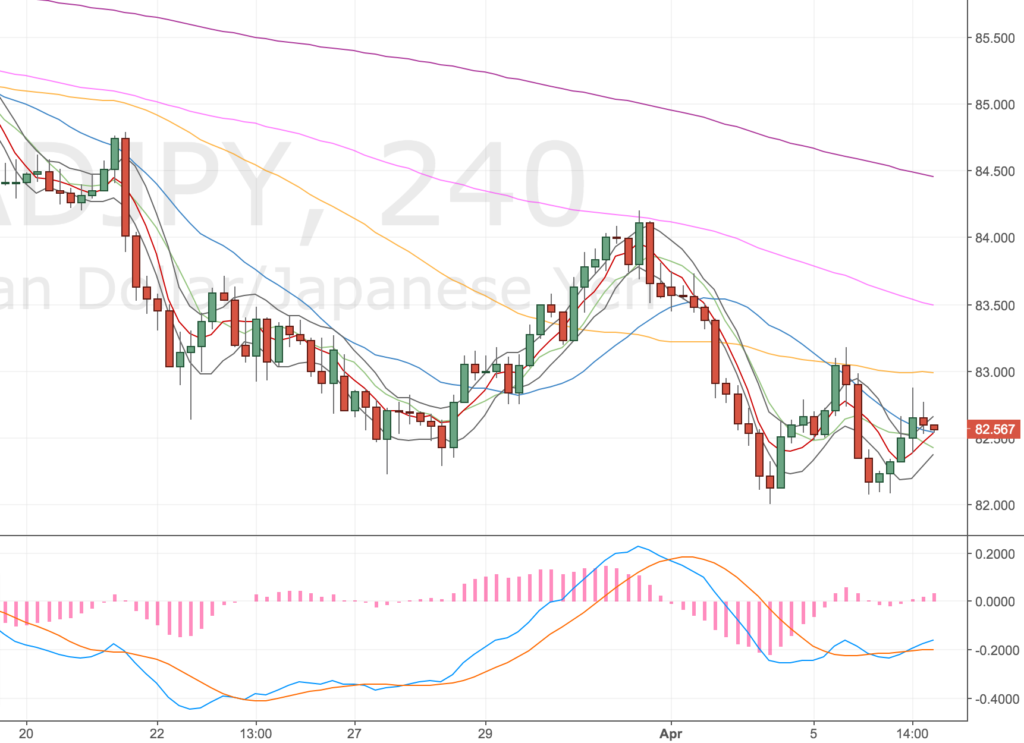
The price action at the moment on the CADJPY has set up a nice long. I had to set a market order to get in as price has headed higher but hopefully I’ll get a fill. I’ve only put in a half position as I have my eye on the EURJPY too. I think that might have better targets.

Again didn’t get a screenshot of the set up! Annoying.

Update – Another mistake, forgot to cancel my order – 5 Apr

So I got that fill !

Price has hit the 4h50 and I should’ve cancelled my order! But I forgot it was on and it got triggered – so I am long the CADJPY whether I wanted to be or not. Got my entry at 82.350. The chart still looks pretty good although the divergence isn’t there. However there’s some good upside targets as the 4h100 has been tested previously.

For now it looks ok to me.

CADJPY 4H Chart – 6 Apr

More bad discipline though! Being honest I’m trying to do too much and not prioritising my scans and managing my trades.

AUDUSD DST Long – 4 Apr


Acc Risk: 0.6%
Long: 2x 0.7609
Stop: 0.7571 (38 pips)
Target 1: 0.7669 (prior high, 60 pips, 1.57 RR)
Target 2: 0.7716 (major resistance, 107 pips, 2.8 RR)

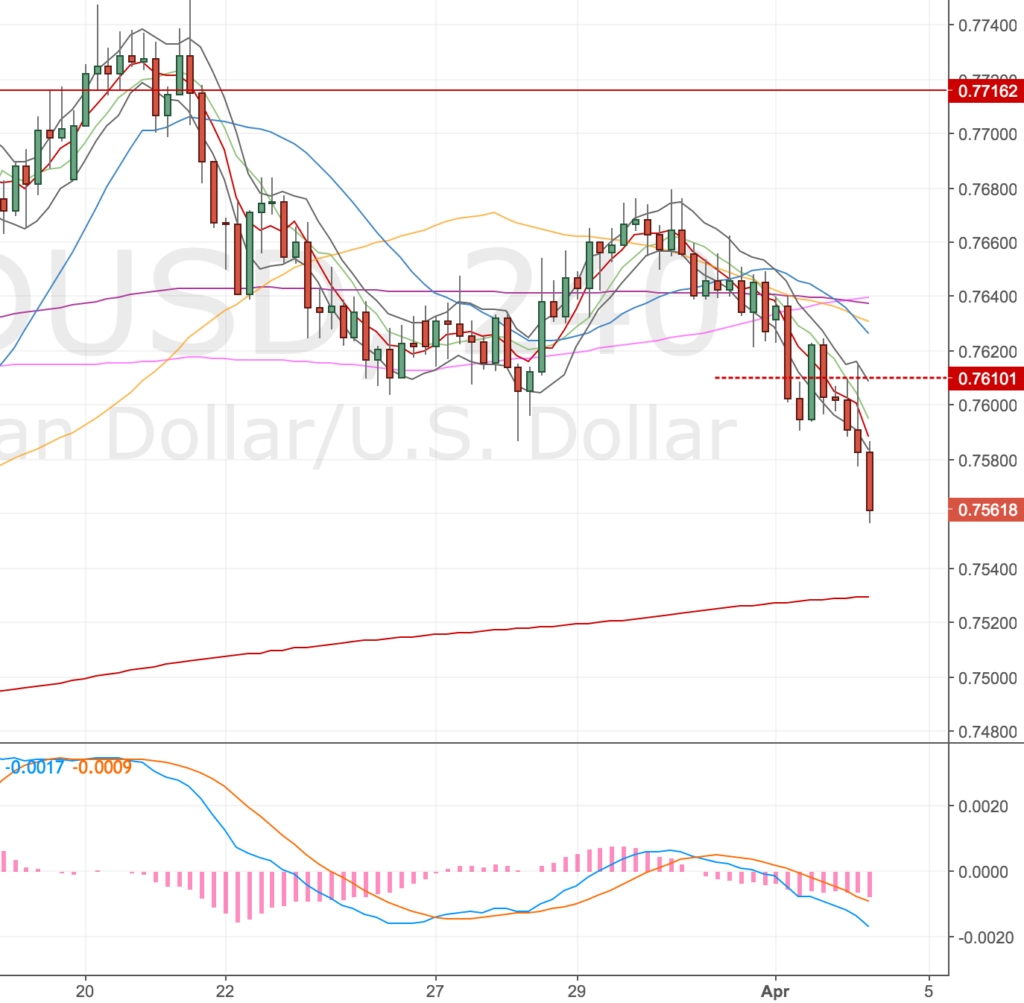
Well this is another one of those kick in the balls trades, that just goes against you straight-away (like it was waiting for the trade to be placed before showing you its hand). Price made a strong close inside the bands and I had a decent entry to get long but it just headed lower. Saw plenty of these situations in back testing so there’s not much to say.

One thing worth noting was the MAs were getting chopped around with price so the prior highs were my targets. Not had any trades that have been targeting prior highs so a bit of an unknown.

AUDUSD 4H Chart – 4 Apr. Red line was my entry, stop of the prior candlestick low.

Given the strong price action down, I think I’ll leave this one alone until price gets to the 4h500. See if we can get a long from there.

EURJPY DST Long – 30 Mar , 3 Apr & 10 Apr 17


Acc Risk: 0.4%
Long: 119.41
Stop: 118.85 (56 pips)
Target: 120.86 (4h200, 145 pips, 2.58 RR)

Update – Stopped out – 31 Mar
Update – Another set up – 3 Apr
Update – Stopped out again – 3 Apr
Update – Daily set up in the making – 5 Apr
Update – Still waiting – 6 Apr
Update – Going long again – 10 Apr
Update – Stopped out again, third time now 🙁 – 12 Apr

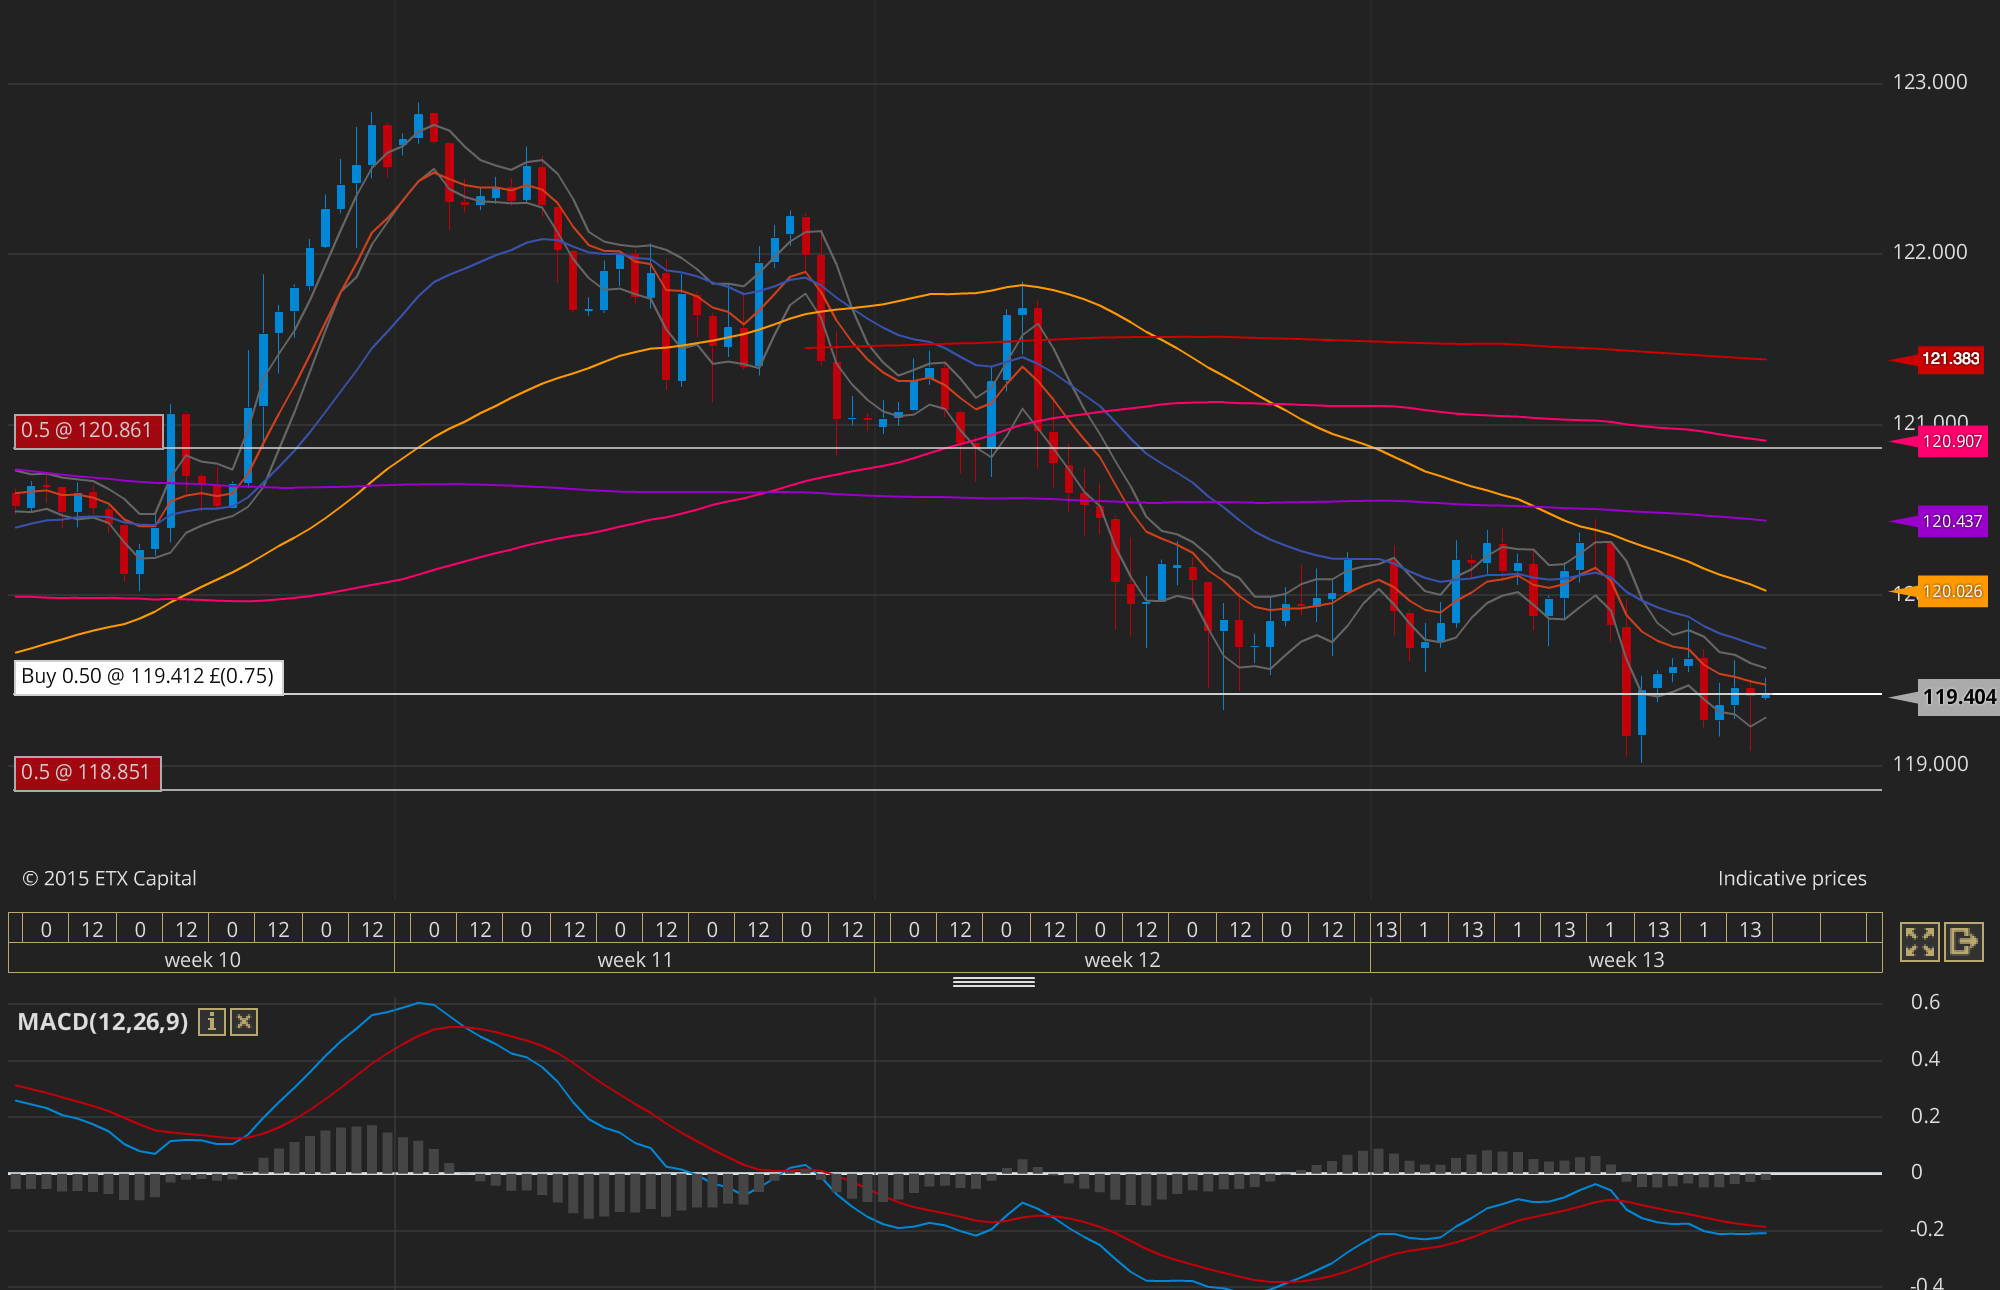
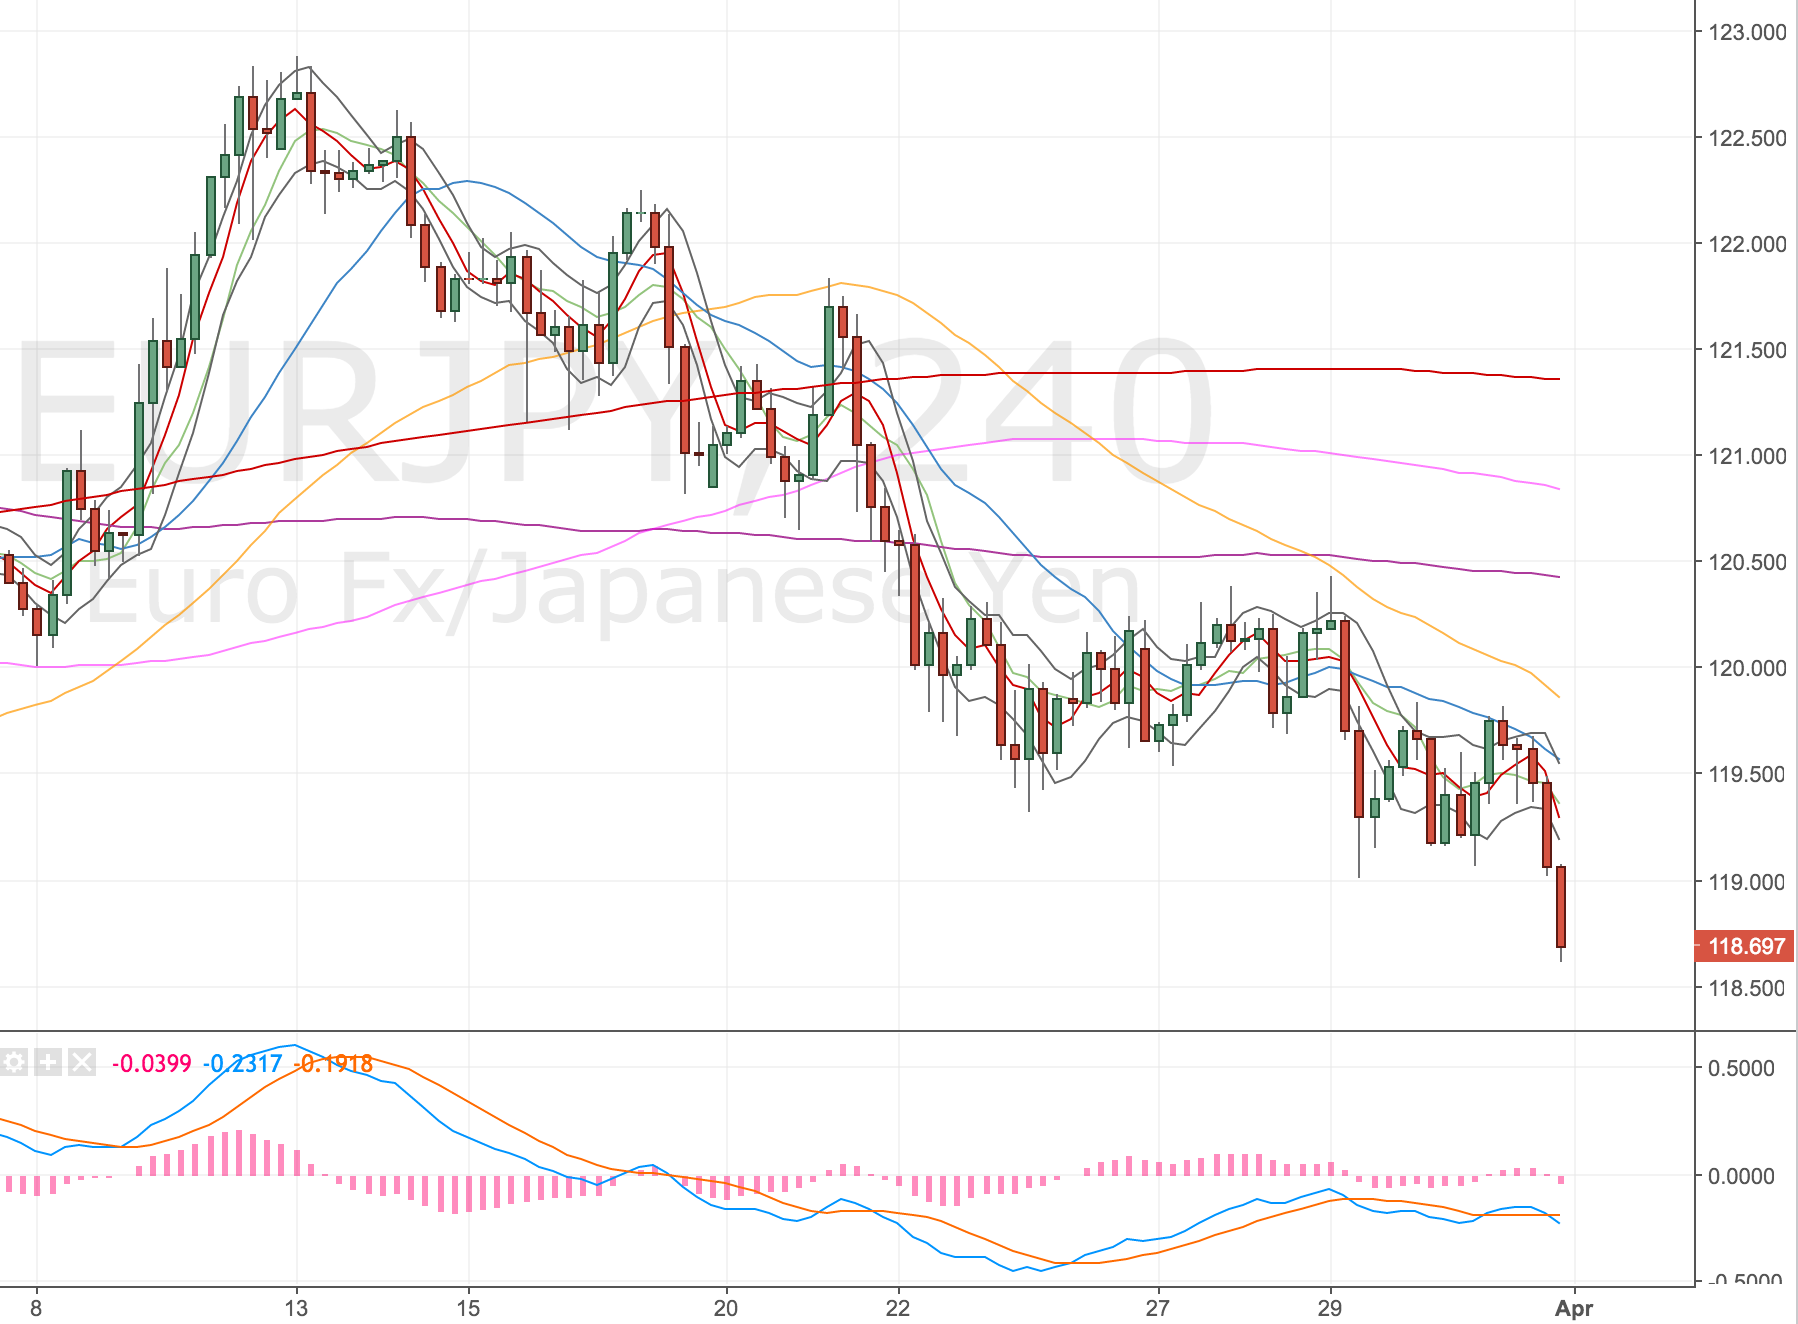
Just spotted this set up on the EURJPY, I’m already in a GBPJPY trade which is near 1% risk, so to trade this I’d need to stay under my 2% rule. The trend seems pretty well set down and so I’ve decided only to trade a small / half position on this set up.

Here’s the set up

4H Chart

EURJPY 4H Chart – 30 Mar 17

I’ve had a few winners in a row now and so I now find I’m reluctant to trade and ruin my streak 🙂 A nice position to be in I guess. I guess that’s why I’m downsizing too…

Update – Stopped out – 31 Mar

Just got stopped out of this trade, price has continued to sell off. Not much to say – I don’t think I did anything too wrong.

EURJPY 4H Chart – 31 Mar

Update – Another set up – 3 Apr

Just spotted another set up I fancy taking a pop at 🙂 I’ve made a mental note in my trade plan to go back in when I get stopped out. Another set up has materialised so I’m going again.

I screwed up and didn’t take a screenshot so I can’t share the entry, but here are the details.


Acc Risk: 0.4%
Long: 2x 118.442
Stop: 118.405 (37 pips)
Target 1: 119.736 (4h50 – 2 prior near misses, 130 pips, 3.5 RR)
Target 2: 120.251 (upper trendline, 181 pips, 4.9 RR)

Update – Stopped out again – 3 Apr

It was another same day stop out. I thought this one would definitely go but looking back on the chart it wasn’t actually a divergence set up. The price never closed up inside the bands. Ops! Anyway – I’m going to sit on this until price gets to the d200. It’s so close now.

If we can get a daily set up to run, I’ll be happy.

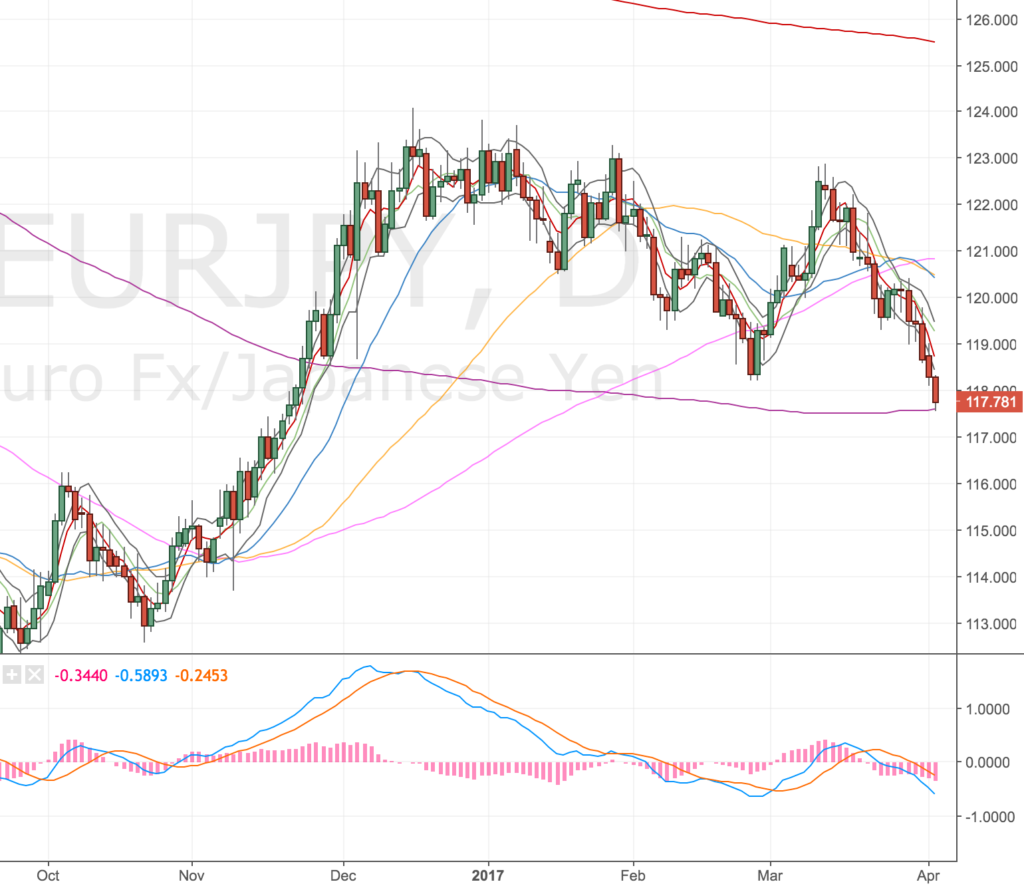
Update – Daily set up in the making – 5 Apr

EURJPY Daily Chart – 6 Apr

Price is hitting the 200 right now so be interesting to see how price develops.

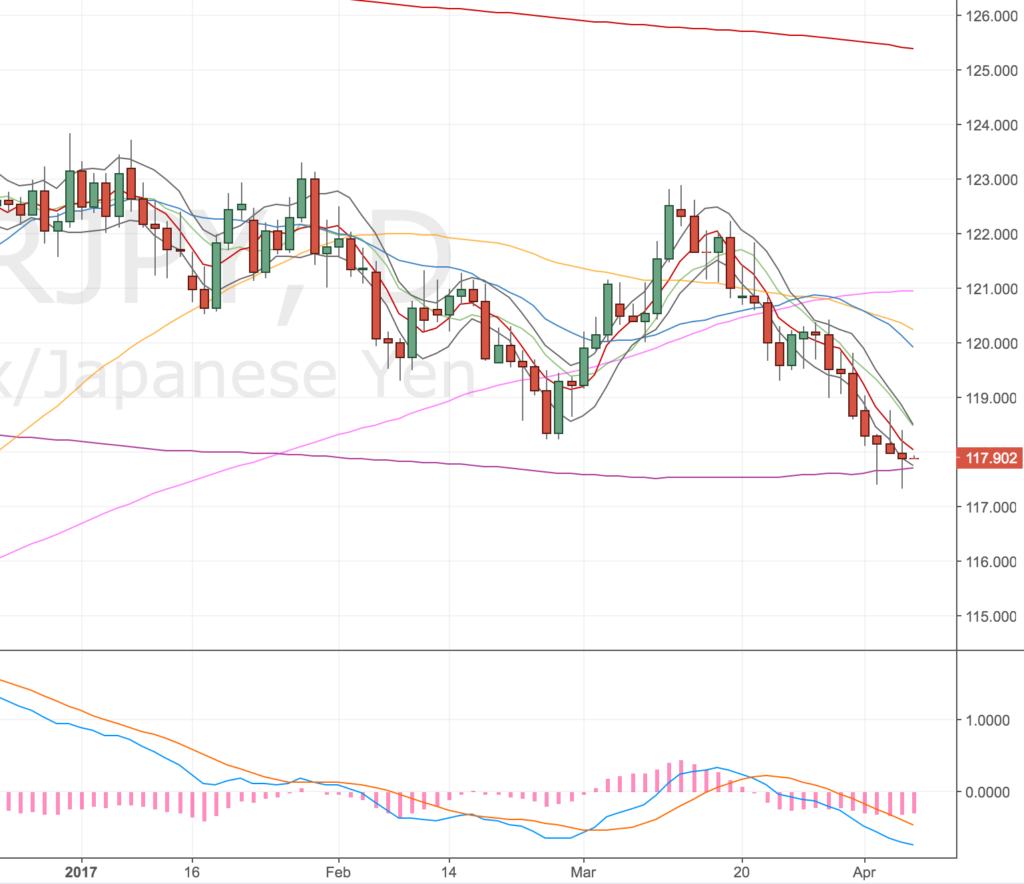
Update – Still waiting – 6 Apr

I know this is only a day later but I’ve looked at this chart so often and price always seems to be setting up before failing. One point worth noting though is the candlestick patterns now. A series of dojis up and down.

If I can get in on this trade I think I will go for it. It’s not strictly a divergence – the MA warping I mentioned before is occurring – but I think the MACD is close enough to warrant it being a trade to take. Let’s just hope the horse doesn’t bolt without me. Feels like we could get a decent move. The AUDJPY & CADJPY are all diverging to the upside.

EURJPY Daily Chart – 6 Apr

The one good thing about this is because it is a daily timeframe, I won’t be holding this over the weekend now. I don’t really mind but I did get gapped out the other week.

Update – Going long again – 10 Apr


Acc Risk: 0.45%
Long: 117.70
Stop: 117.27 (43 pips)
Target 1: 118.45 (4h50, 75 pips, 1.74 RR)

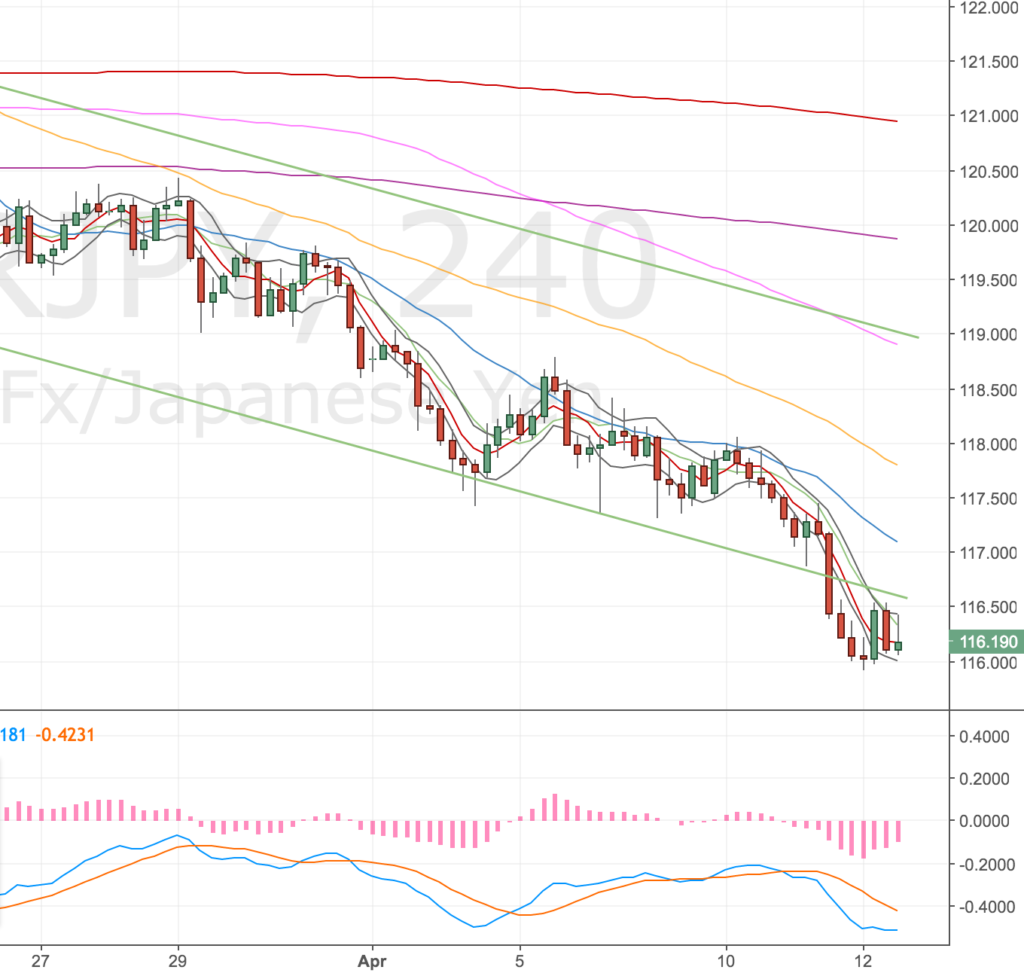
Going long on this market again, we’re now into the d200 and we have a prior test of my trendline (in green). Never put too much weight on trendlines. They can vary so much so they never make precise targets to me.

Again didn’t get a screenshot! Damn it.

Update – Stopped out again, third time now 🙁 – 12 Apr

Well, obviously I know this can happen and it did so I shoudn’t be surprised. The one change I will make from all this is to be more patient. Over the last few days I’ve taken positions when we’ve been near to major MAs (d200, d500 etc). I’ve seen examples where we’ve not tested them and gone in my favour but generally I’d rather wait for those set ups to trigger off those levels before getting long. I feel I should be more selective about my set ups and only take the more premium set ups.

Price has headed lower and is now outside of my trend channel. It may well handrail and come back in. So I will probably try this trade again if a set up occurs! Probably!? Maybe!? We’ll see.

EURJPY 4H Chart – 12 Apr

My mindset is relatively positive considering I’ve just spent £100 finding out I was wrong!

GBPJPY DST Long – 29 Mar 17


Acc Risk: 0.9%
Long: 2x 138.00
Stop: 137.40 (60 pips)
Target 1: 139.96 (4h200, 196 pips, 3.2 RR)
Target 2: 140.47 (d50, 247 pips, 4.1 RR)

Update – Revising my targets – 29 Mar
Update – 4h200 Hit – 31 Mar

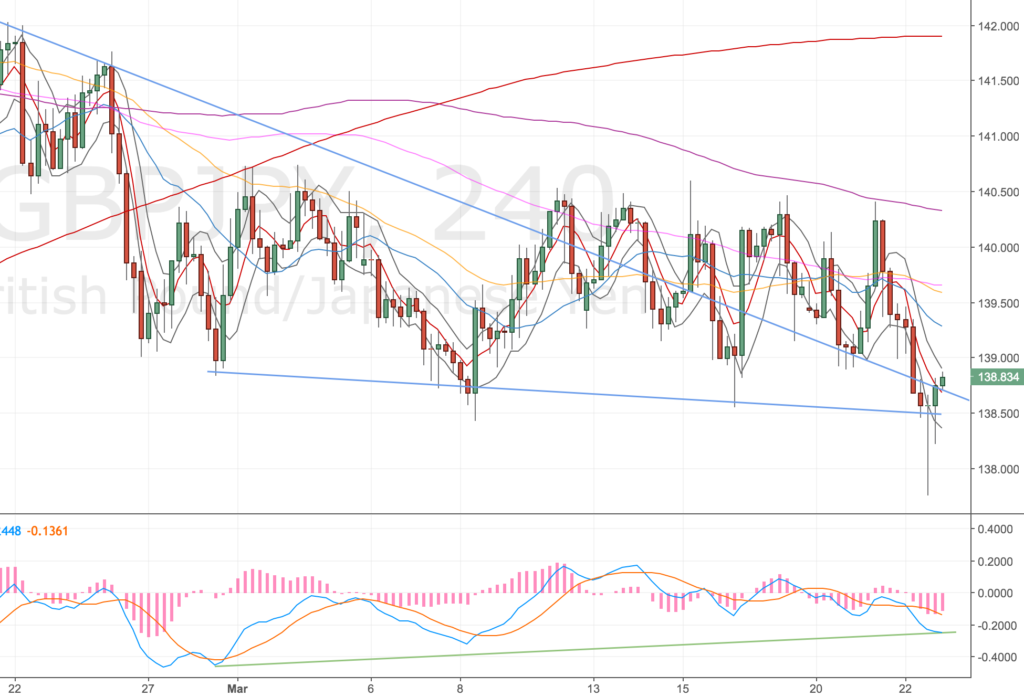
I’m really hot for the GBPJPY right now. Price is inside a bullish daily wedge (we’re at the narrow end) and we’ve got a quadruple divergence in play! I’ve traded this from the 4h timeframe but I’m really looking for a breakout of the daily wedge pattern and higher targets as we’ve been chopping around the 4h50 and 4h100 for a while.

Here’s the set up.

4H Chart Set up
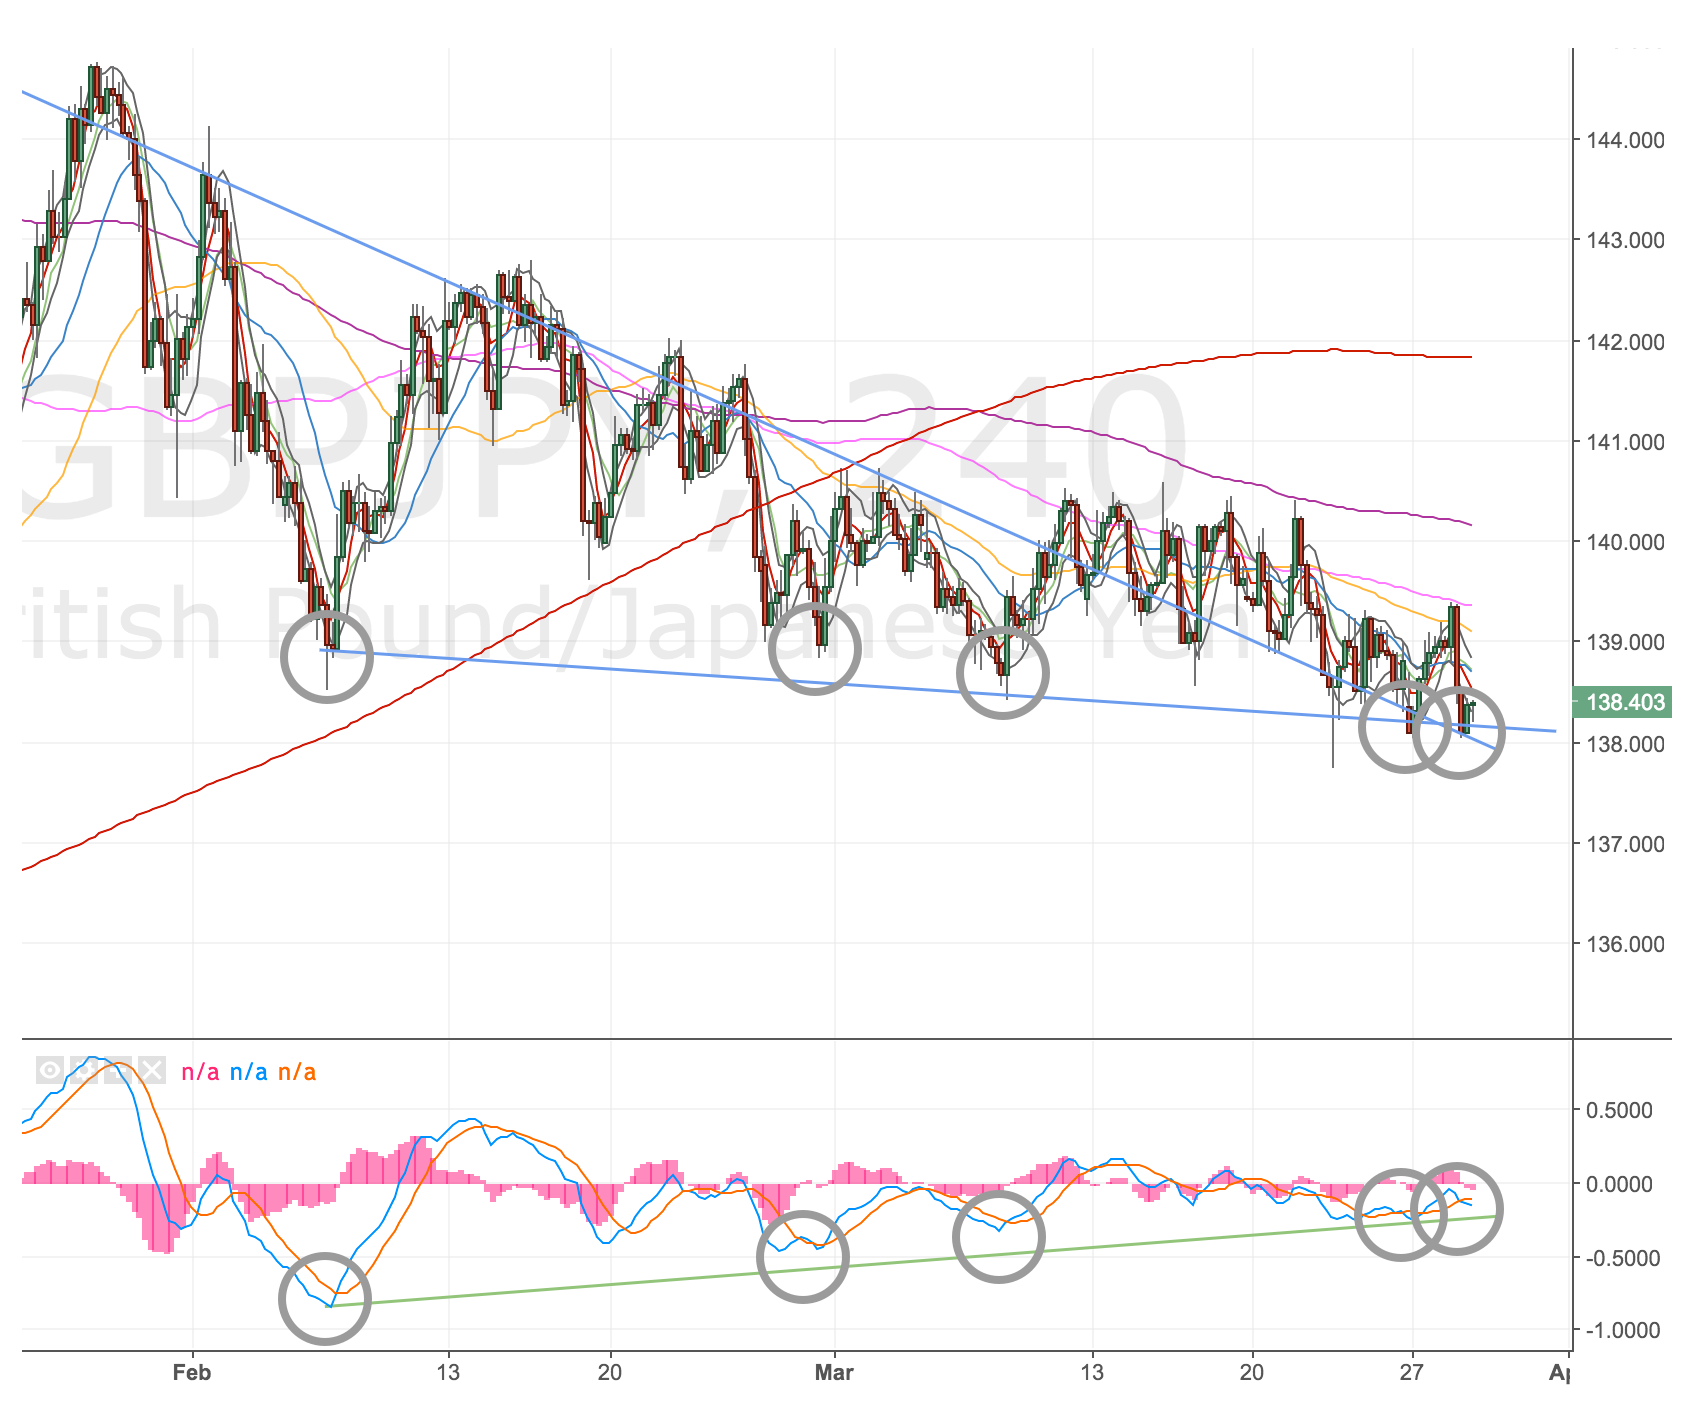
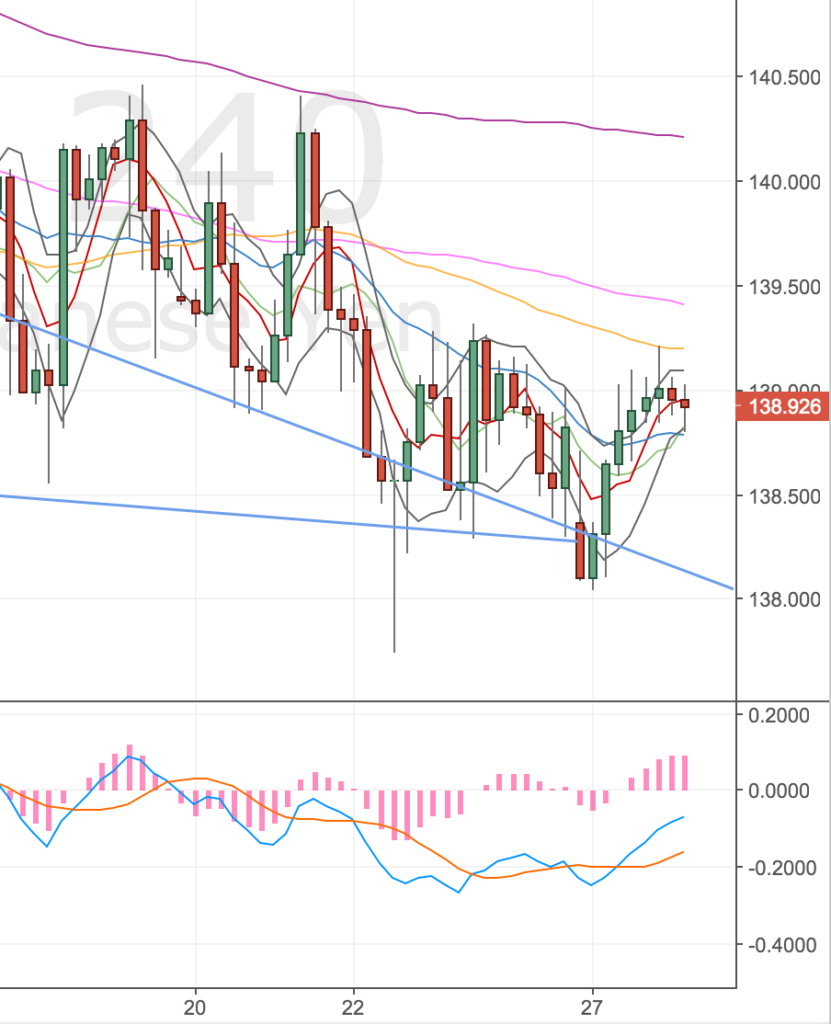
GBPJPY 4H Chart – 30 Mar

Quadruple divergence in play!

Daily Chart

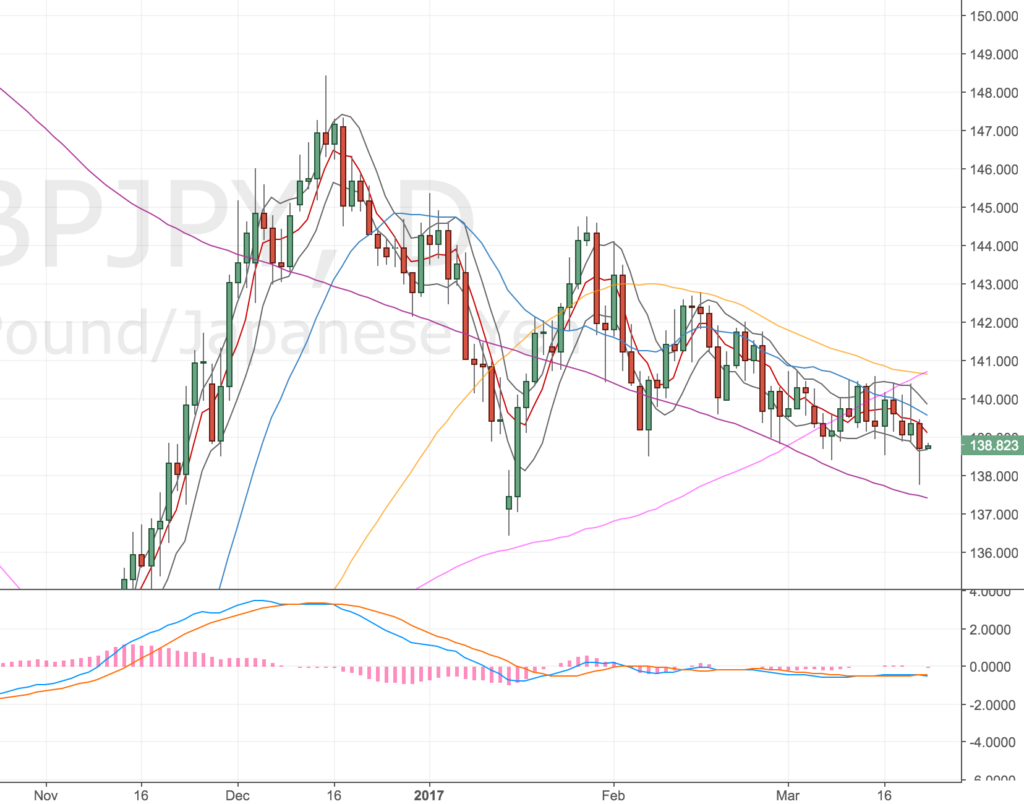
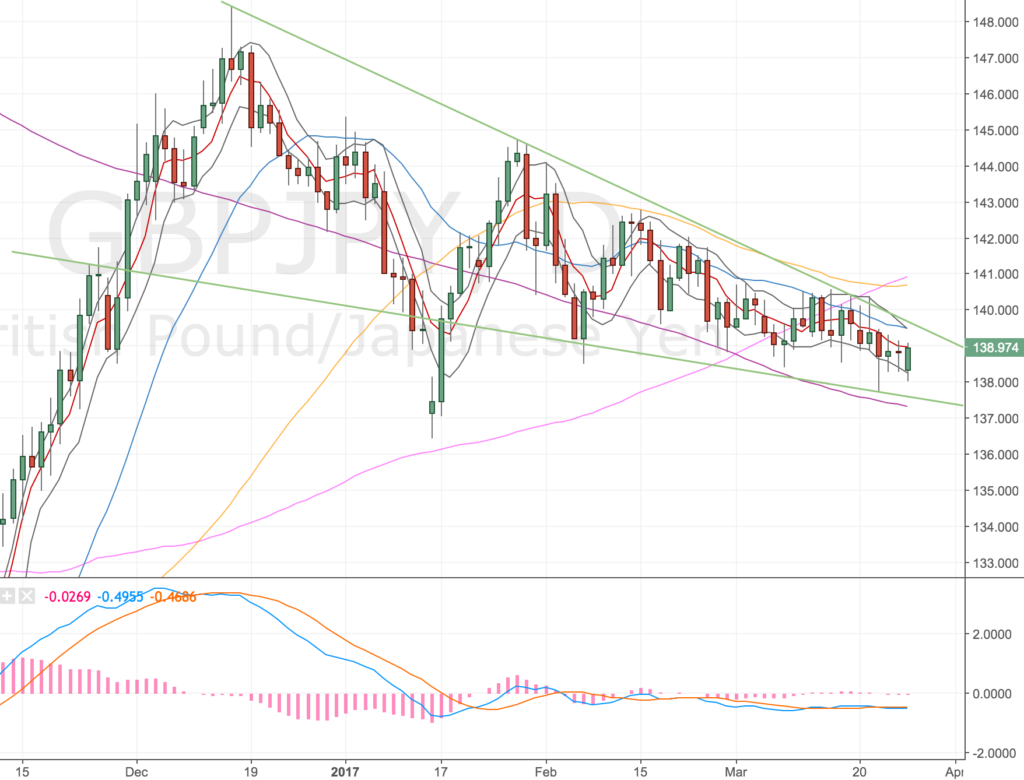
The daily chart really shows the long bullish wedge. Where could price go if we broke out from here?
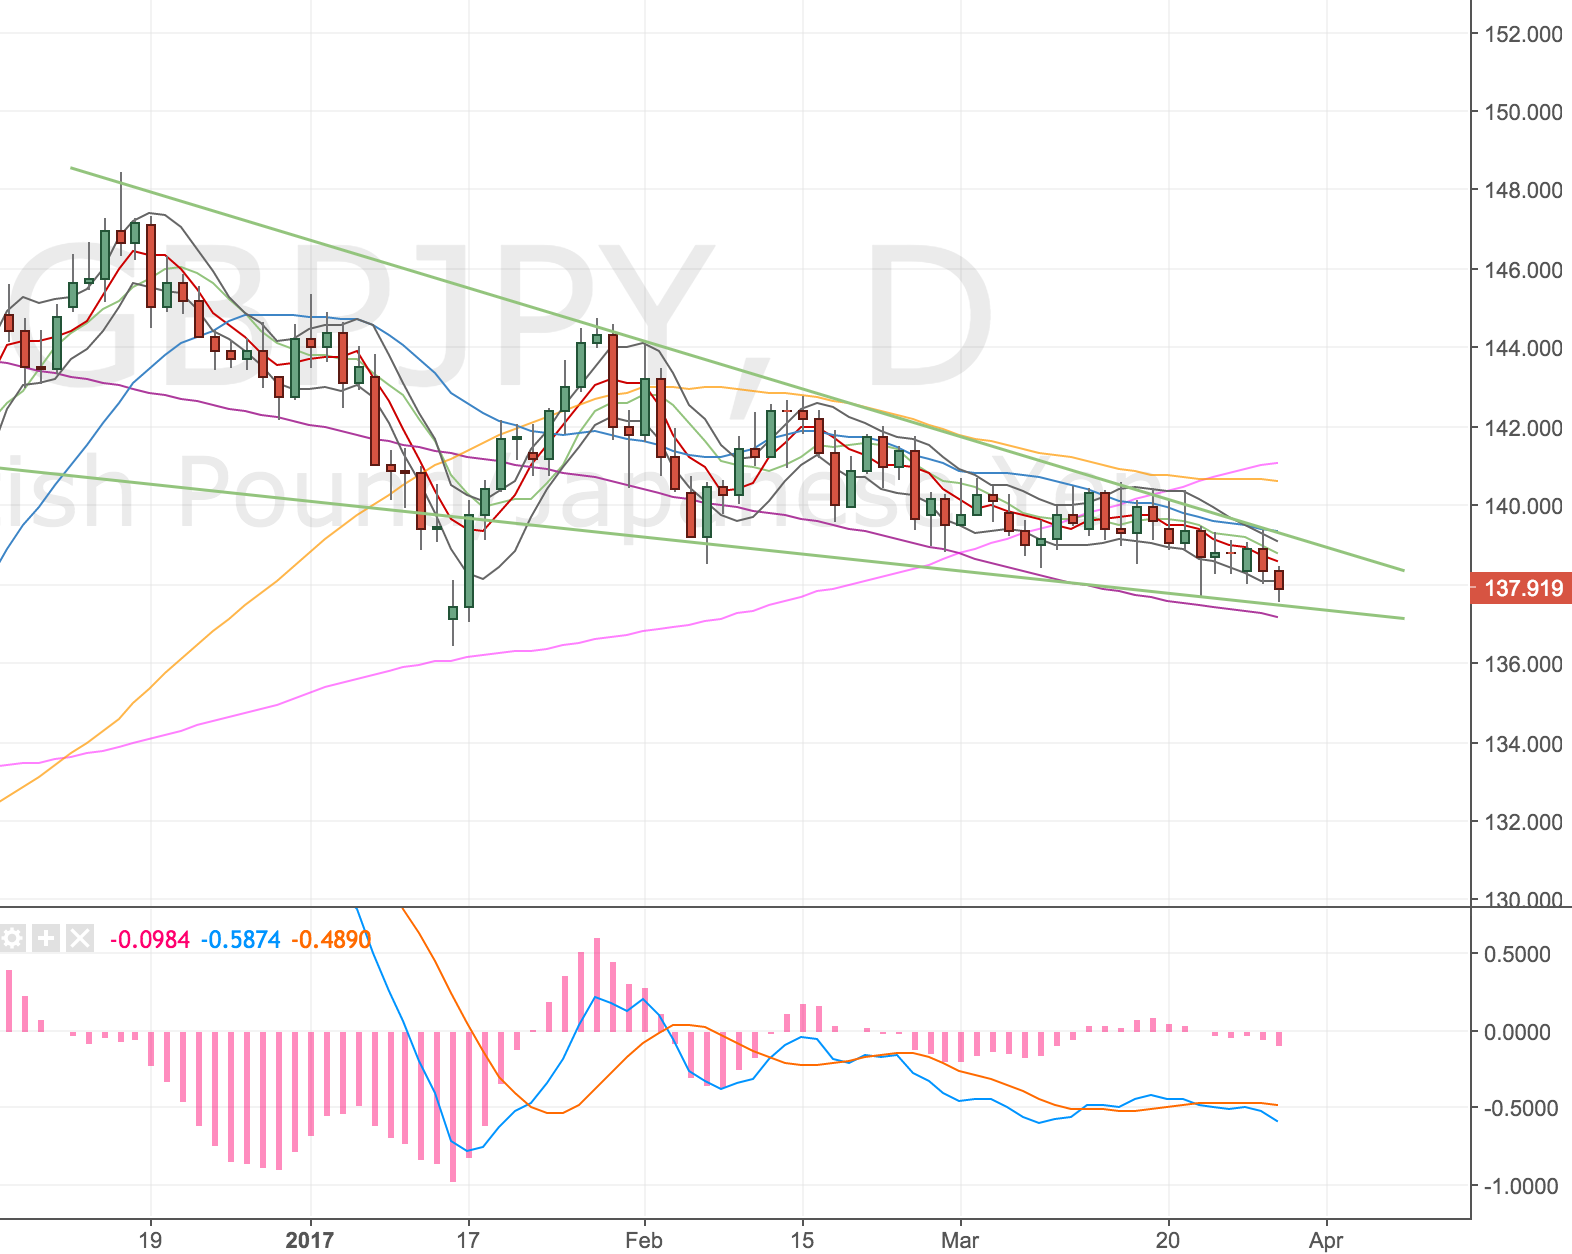
GBPJPY Daily Chart – 29 Mar

The trade is on and I’ll wait a see where we end up.

Update – Revising my targets – 29 Mar

I’ve been thinking about this trade quite a bit and I’ve decided I’d be cutting myself short to not aim for a higher daily target. My plan has changed a bit, here’s what I’m thinking.

  1. Close half my position on the 4h200, in case we just roll-over again. This would cover the remainder of my position and half of any future add in.
  2. Look for a daily wedge breakout to get to prior highs @ 148
  3. Any breakout pullbacks add one more position, wide stop below the prior low (currently 137.50)
  4. Stop manage the remainder to the 127% fib level @ 155 which might coincide with the d500 & w500. (The other MAs are too near price action).
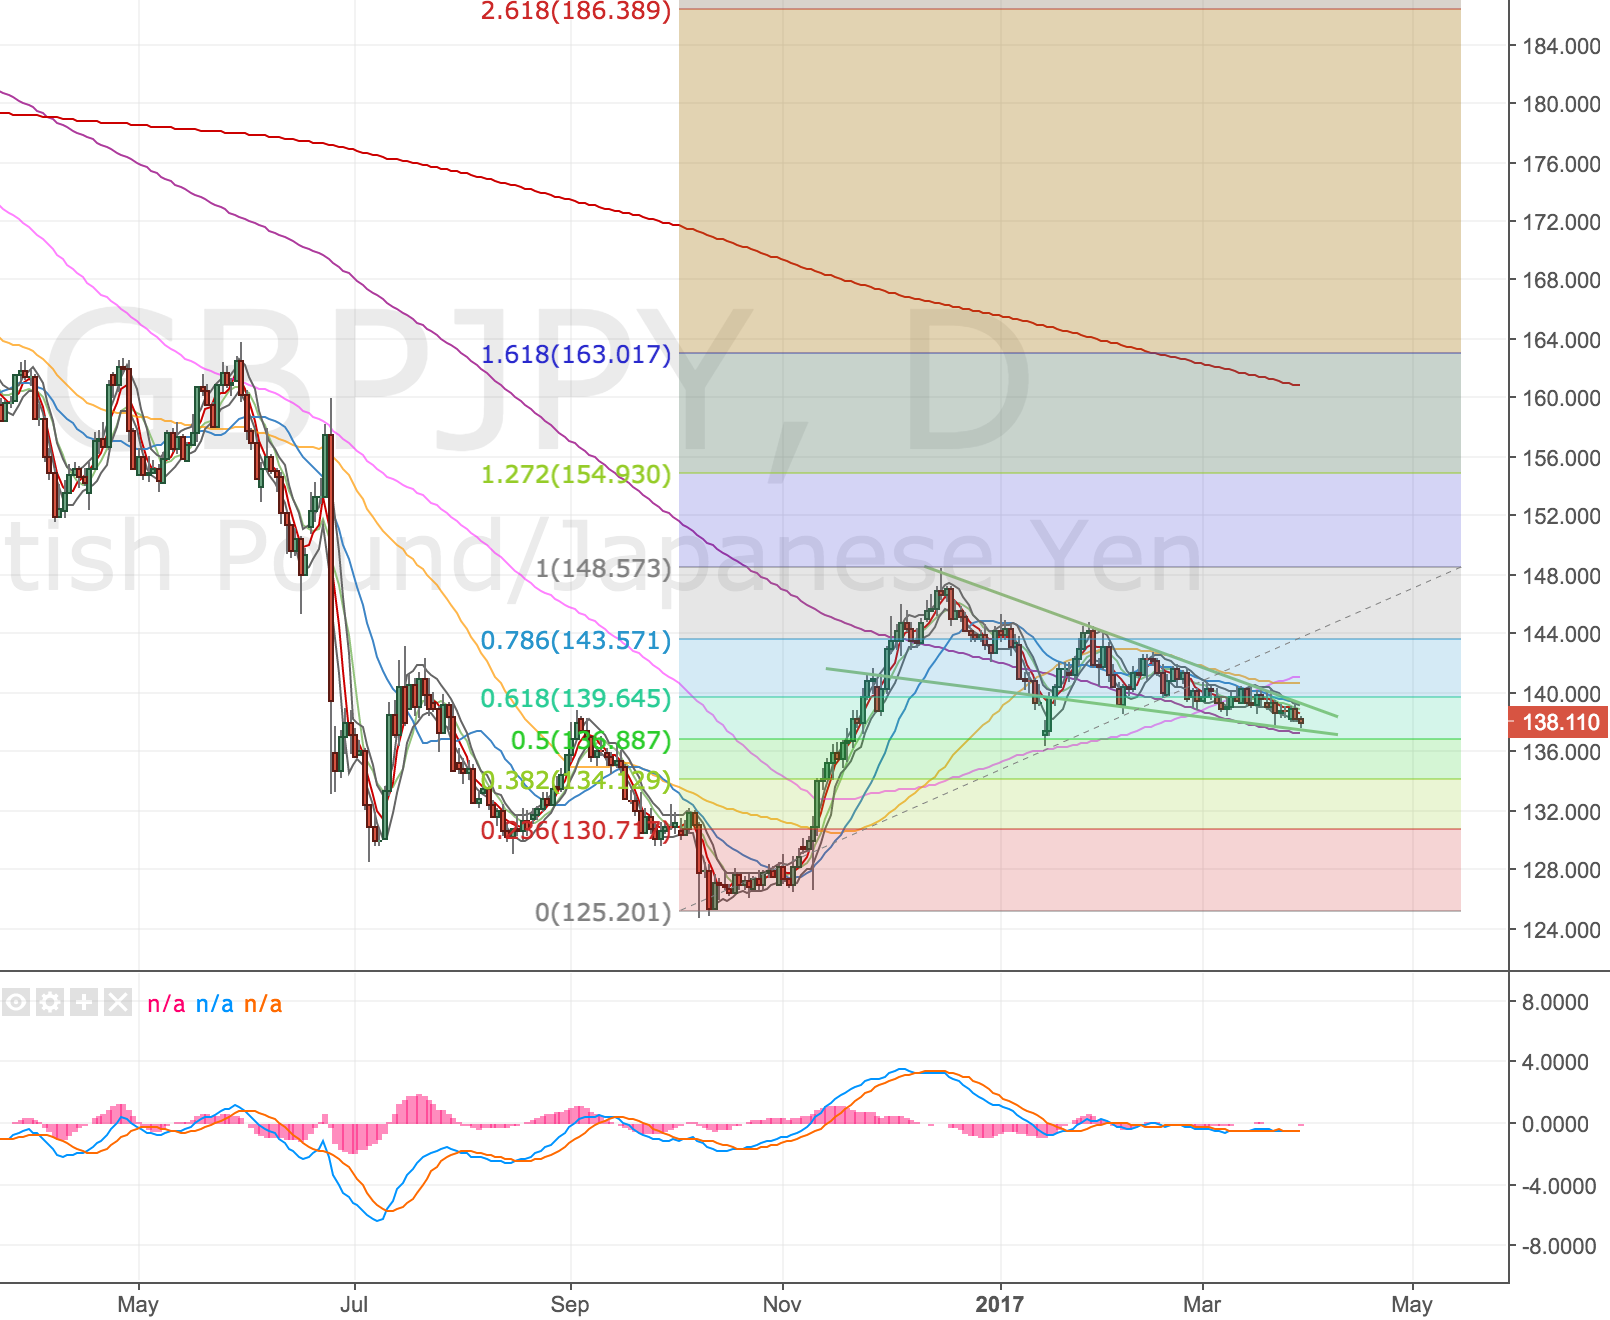
GBPJPY Daily Chart – 30 Mar

It might be foolhardy, I know it is very ambitious, but I can see huge upside potential and fundamentally I think the GBP is now the best place for a move higher. Trump seems to be struggling with his reforms (travel ban and healthcare both hitting the skids), the Euro is losing one of it’s top 5 (top 3?) countries, the Yen is still in QE and Japan’s inflation isn’t exactly bombing it! Another set of good GDP/inflation figures might force the UK to up interest rates soon too (we’re still yet to do so – the fed has done so twice). Markets move on expectancy not really actual data over the long-term.

I might be totally wrong though, Brexit is a big unknown and news leaks will probably send prices all over the place, hence taking some profit on the 4h200 target to cover the rest of the position and pay for half of any add in; but you’ve got to be in it to win it, so I’m hoping to be able to hold a position to higher targets. Hopefully I can stop manage this too with some decent swing lows for me to place my stops at on the way up and reduce my risk.

So here’s the set up now. The risk to reward ratios (RRs) look ridiculous:


Acc Risk: 0.9%
Long: 2x 138.00 (1x ~140 – depending on price action)
Stop: 137.40 (60 pips)
Target 1: 139.96 (4h200, 196 pips, 3.2 RR)
Target 2: 148.57 (Prior high & m100, 1057 pips, 17.6 RR)
Target 3: 154.93 (127% daily fib, d500 & w500, 1693 pips, 28.2 RR)

Separately, one thing I’ve noticed about GBPJPY price action is how spiky it is. Almost all candles have long wicks. Not something I’m used to trading in, so setting stops a fixed margin off the lows seems to make for some pretty wide stops. I can forget about those ultra tidy EURUSD 10 & 20 pip stops!

Update – 4h200 hit remainder stopped out – 4 Apr

Price hit my first target – the 4h200. I was holding for the higher fatter targets but price rolled over and stopped me out. It’s in a really tight range right now. I did notice a doji candlestick at the top of the trend channel on the daily timeframe so I guess the writing was on the wall. 🙂
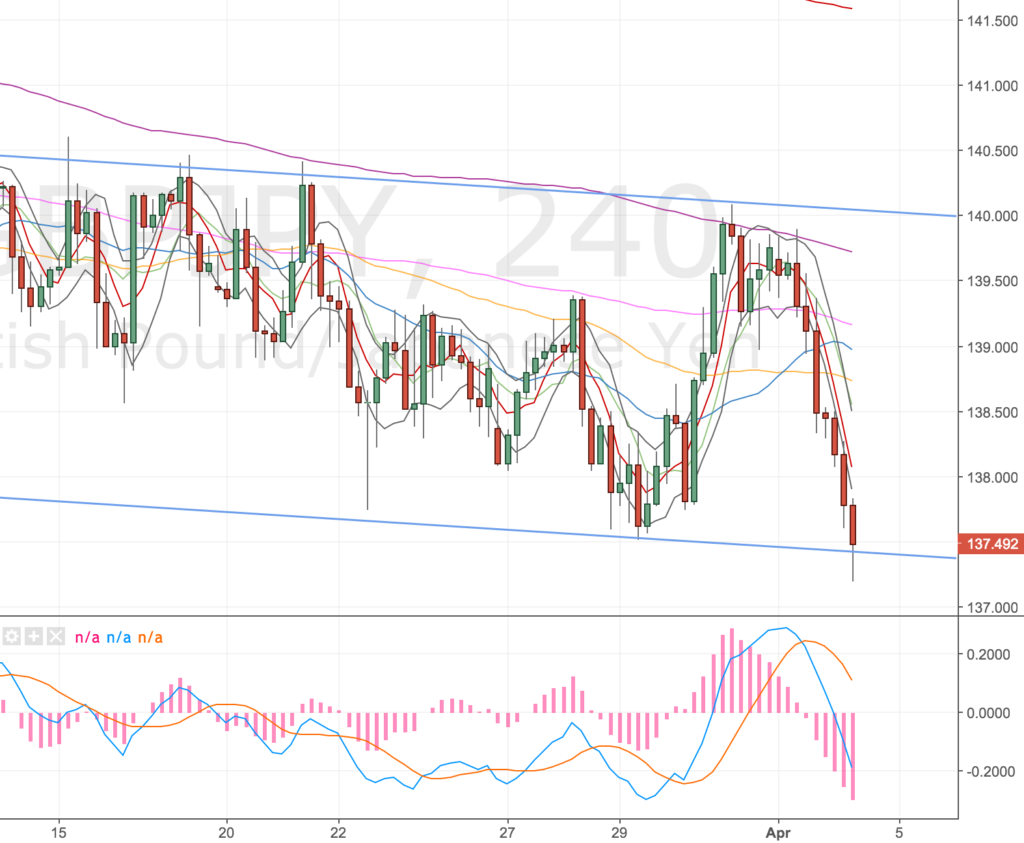
GBPJPY 4H Chart – 4 Apr

It was hard to watch a very nice profit (£200) become an OK one (£60). £200 would’ve been the bulk of my monthly target but I’ve heard so many traders say it’s the one or two odd trades that make your month or year, so you’ve got to keep something in the game if you think price can go higher.

Having said that, my strategy isn’t about holding out for those big targets, it’s about shooting at near term targets so I probably should’ve closed out. As Charlie said to me, there’s plenty of movement in price working up to a big target so there’s plenty of places to get long or short. Some more education there – price £140!

One last thing, I think I over thought the trade and probably wasted a load of time plotting my hero moment! As John Major said – it’s back to basics!

John Major getting back to basics
GBPCAD Short – 28 Mar


Account Risk: 0.6% (bigger than I’d like but my balance has decreased)
Short: 1x @ 1.6829
Stop: 1.6912 (84 pips)
Target: 1.6636 (193 pips, 2.3RR)
Mindset: Like the set up but doesn’t feel like momentum has turned yet.

Update – winner winner chicken dinner – 28 Mar

Another trade I like the look of (uh oh!) I’ve gone short the GBPCAD for a relatively small size. The stop is quite wide so the account risk is still on the normal side despite the small position.

There’s some CAD news out later which might have an impact.

Here’s the setup.

4H Chart

Have a divergence set up and some prior resistance (not marked) at 1.69 level, I doubt this is significant though.

GBPCAD 4H Chart – 28 Mar

Daily Chart

Have run into the 200

GBPCAD Daily Chart – 28 Mar

Update – winner winner chicken dinner – 28 Mar

Feel very fortunate about this trade, I was nervous about price action this morning and as often happens with my morning positions, I seem to get in just before the market volume arrives around 8am, So I often find myself sitting on a negative position quite quickly.

Anyway, the trade did go my way and my limit order was hit early evening.

I can tell I’m still on the emotional rollercoaster because I feel quite relieved about this trade. Didn’t think it would work out for me.

Here’s the final chart, a nice touch of the 50MA.

GBPCAD 4H Chart – 28 Mar

What’s also good about this is I can now look at GBP long set ups ahead of Brexit tomorrow. I have a few markets I’m interested in, particularly the GBPJPY.

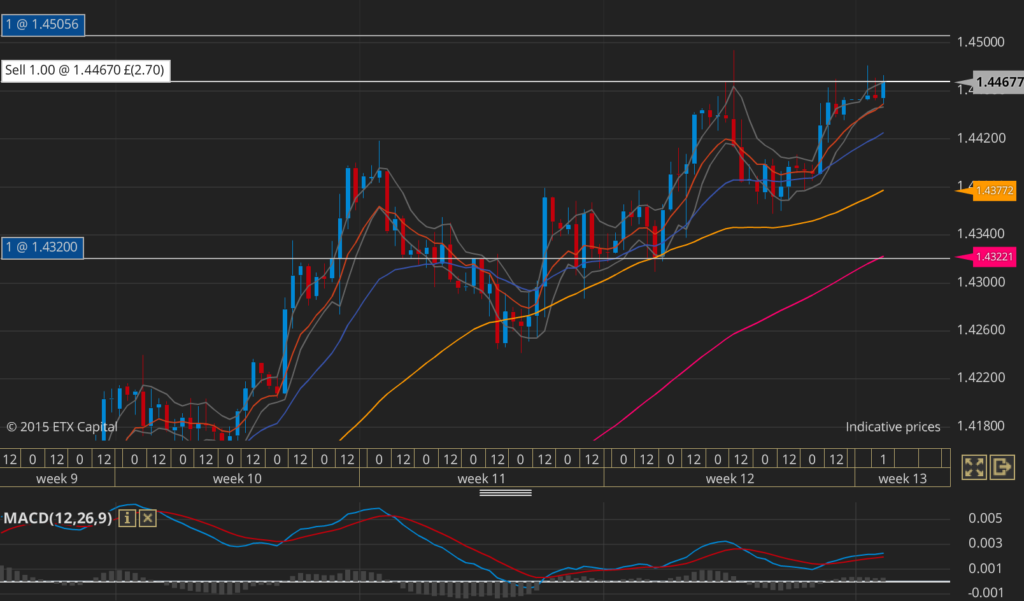
EURCAD Short – 27 Mar 17


Account Risk: 0.6%
Short: 1.4467
Stop: 1.4506 (39 pips)
Target: 1.4320, 4H 100MA (191 pips, RR 4.3x)
Mindset: Feeling OK, a little nervous

Update – Stopped out – 27 Mar

Thought I’d give this one another try, price didn’t make it down to the 50MA on the previous set up and another set up has materialised. I’ve got a decent enough entry to place another short again too.

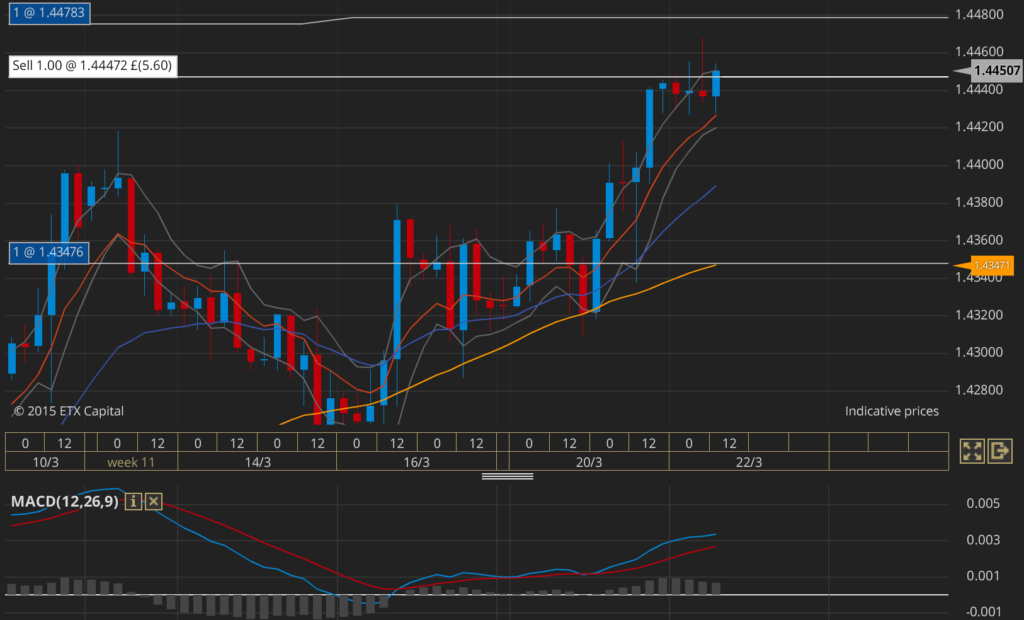
EURCAD 4H Chart – 27 Mar

Update – Stopped out – 27 Mar

Wow same thing happened again – it didn’t take 30 mins, this time it took a few hours to stop me out. I moved my stop a little higher (to 1.4511, 0.7% total account risk) to protect myself from the MA but it’s still gone higher anyway – not a terrible remove in retrospect.

The Euro has been on one hell of a run today, but with the gap and the dollar setting up for more upside, I wonder if it’ll reverse tomorrow?

The EURCAD isn’t a valid set up anymore but the EURUSD is, however surely everyone is getting short the Euro now? So it’ll probably be another stop out?

GBPJPY DST Long – 23 & 27 Mar 17


Account Risk: 0.3%
Long: 138.65
Stop: 138.06 (55 pips)
Target: 140.28, 4H 200MA (163 pips, RR 3.1x)
Mindset: Optimistic (bad sign 🙂 !)

Update – Stopped out – 27 Mar
Update – Re-entered the trade – 27 Mar
Update – Hit the target – 27 Mar

Woah not had a long in a while! Feels like I’ve been shorting everything lately. I’ve had a few set ups forming on the pound but this one has a decent spike down following the terrorism attack in London this week. It also has a good technical pattern and it looks like we’re trying to break-out to the upside.

So I’m in the trade, but I’ve downsized my position. I’ve done this for a few reasons.

  1. I’m in an account drawdown (albeit a small one)
  2. I found on trades where only part of my position was filled that I was much more carefree with the trade
  3. The thing I’m enjoying most right now is taking a position/being in trades, rather the stressing about making money.
  4. Being in a trade, but putting some money on the line, teaches me so much more about price action. Reviewing chart history and patterns is SO different to reading a chart at the right edge.
  5. My stops are generally tighter so I get better RR and can make similar money risking less

Here’s the set up …

4H Chart – set up

GBPJPY 4H Chart – 23 Mar

Two downward sloping trend lines that seem to have been broken to the upside. Price is currently hugging the trendlines. I’m looking for a break away to the 200. Price has been chopping around the others for a while!

Daily Chart

GBPJPY Daily Chart – 23 Mar 17

I can see the 50MA coming into play at some point, it’s not been tested for a while. Also the 50 and 200 are creating a nice price channel.

We’ll see how this plays out.

Update – Stopped out – 27 Mar

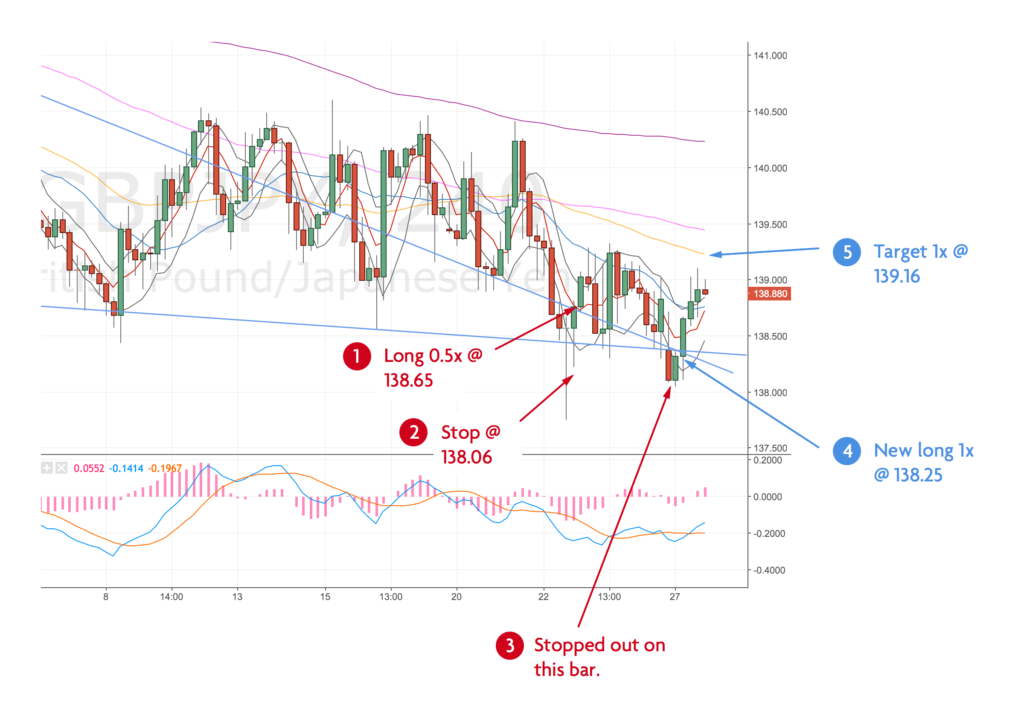
I adjusted my stop slightly over the weekend, I didn’t pick the absolute spike low (broke my rules) and picked the next lowest spike down. The currency pair is very spiky and the range meant my risk to reward wasn’t great.

I got stopped out overnight, but the set up is still valid.

Update – Back in the trade – 27 Mar

As the setup is still valid, I’ve got back into the trade this morning.


Account Risk: 0.3%
Long: 138.25
Stop: 137.89 (36 pips)
Target: 139.17, 4H 50MA (92 pips, RR 2.5x)
Mindset: Still optimistic, although price action isn’t great)

Here’s the current situation:

GBPJPY 4H Chart – 27 Mar. Red is the original trade, stopped out. Blue is the new trade.

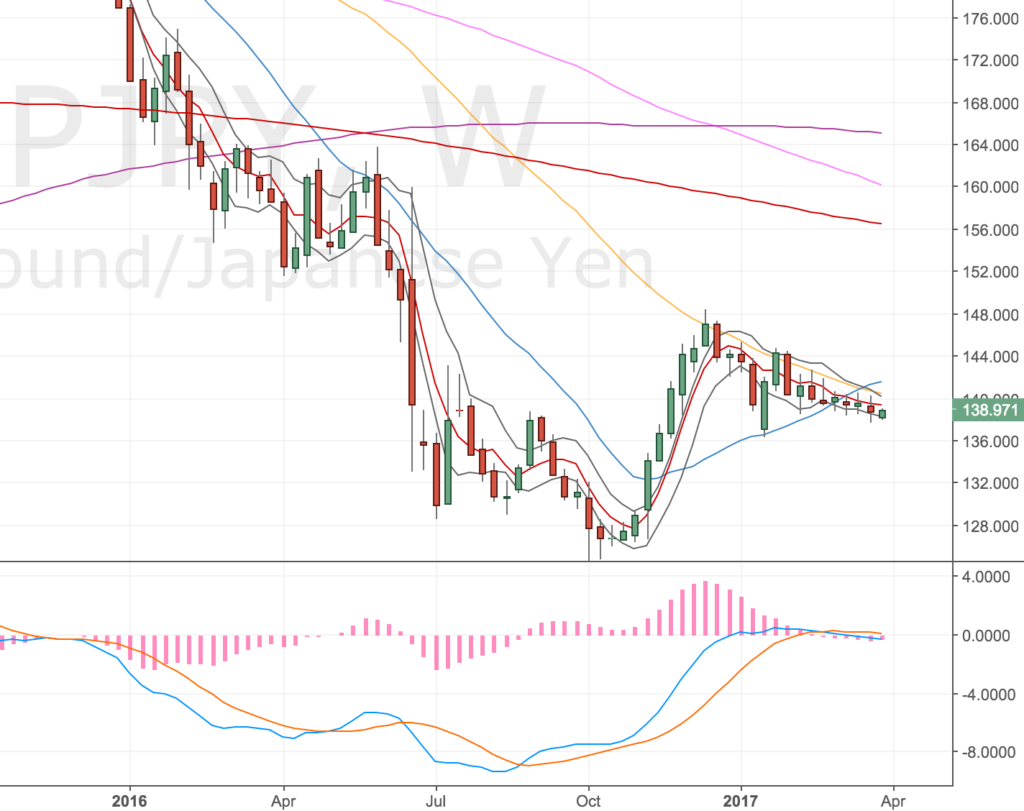
One last thing on this trade, on the higher timeframes, I like this setup for more upside.

Weekly

Handrailing the 50MA

GBPJPY W Chart – 27 Mar

Daily

Bullish wedge.

GBPJPY Daily Chart – 27 Mar

I want to hold on to this position for a much bigger target than I am currently aiming for but it isn’t disciplined to do so. So I probably won’t, but maybe I should paper trade this?

Update – hit the target – 27 Mar

Price went up to the 50MA target late last night and as I decided to keep my target where it was, closed my position. Here is the chart this morning. Let’s hope another set up comes along to get me in a breakout of this trade!

GBPJPY 4H Chart – 28 Mar. Nice touch of the 50MA.

EURCAD DST Short – 22 Mar


Account Risk: 0.4%
Short: 1.4447
Stop: 1.4478 (31 pips 🙂 )
Target: 1.4347, 4H 50MA (100 pips, RR 3.2x)
Mindset: Pleased with another tight entry and upping my Euro position

Update – Stopped out – 30 min later!

I’ve had a number of set ups forming on the Euro to get short, I missed adding to my EURUSD so I’m happy to be adding a small position on the EURCAD. Here’s the setup …

Set up – 4H Chart

EURCAD 4H Chart – 22 Mar

Daily Chart

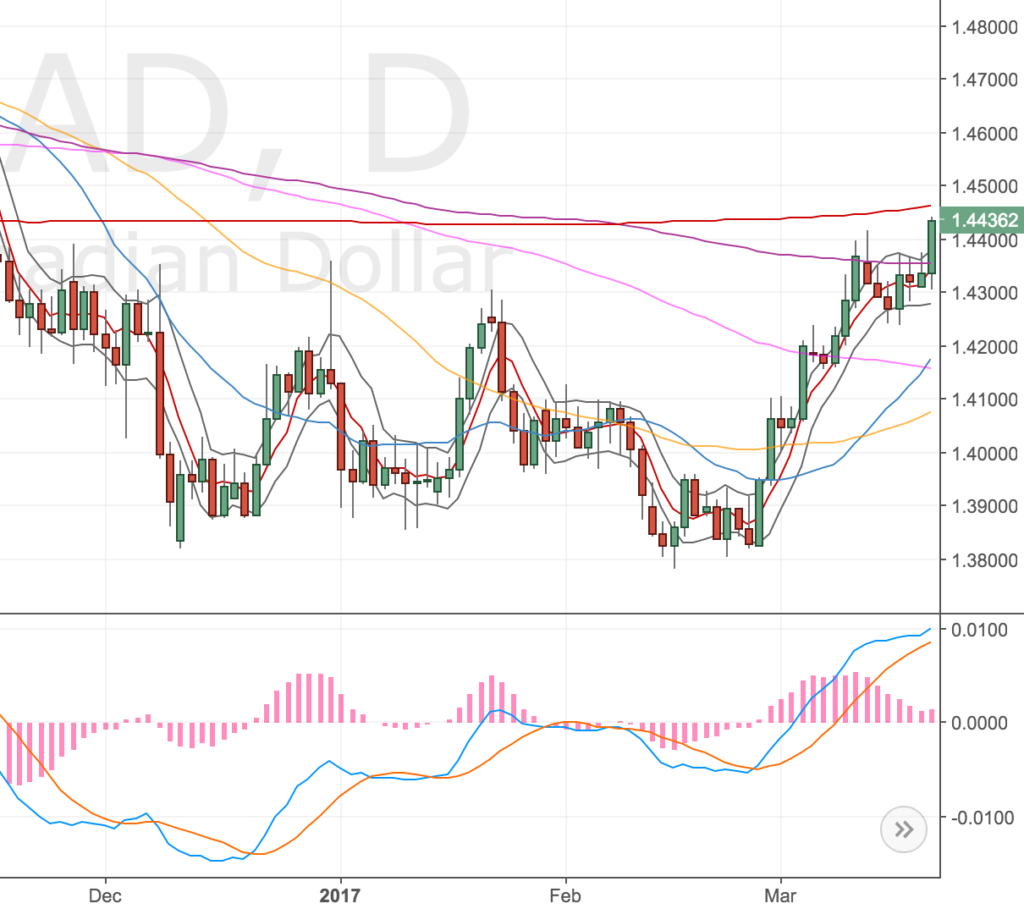
The daily chart is a little worrying though – we’re very close to the 500. I don’t think I properly checked this when I placed the trade. Think I was too keen to get my position in at the level I was being offered.

EURCAD 4H Chart – 22 Mar

Update – Stopped out – 30 min later!

Well I should’ve checked that daily chart – the MA got hit and I was taken out. Was feeling pleased with the entry and then the market went against me and gave me a thump in the balls.

Ooooff welcome the trading!

Looking back at this trade, the bar I entered on spiked higher and closed down. I should’ve taken this is a signal to re-enter the market on the short side, but I got burnt and being at work I didn’t have time so wasn’t in a rush.

EURCAD 4H Chart – 24 Mar. How different the candlestick looks to when I entered. Looks like a different chart!

How different the candlestick looks to when I entered. Looks like a different chart! Maybe that should be a lesson in not trading at lunchtime? It’s only one occurrence, so we’ll see.

On the positive side, you often get a few tests of a MA, so maybe I’ll get another chance, but for the time being I’m out of this market.

EURUSD DST Short – 21 Mar


Account Risk: 0.35%
Short: 1.0810
Stop: 1.0830 (20 pips! 🙂 )
Target: 1.0714, 4H 50MA (116 pips, RR 5.8x)
Mindset: Really pleased with the entry but still expecting to get stopped out again

Update 1 – Not much progress, but the daily divergence has set up – 23 Mar
Update 2 – Might be getting a double divergence! – 24 Mar
Update 3 – Got stopped out ;-( – 27 Mar

I saw this set up on the morning scan – and whilst I didn’t really want to take it – I had a really nice spot to enter on. On the daily timeframe there was also a divergence setting up (although not yet official).

The set up – 4H Chart

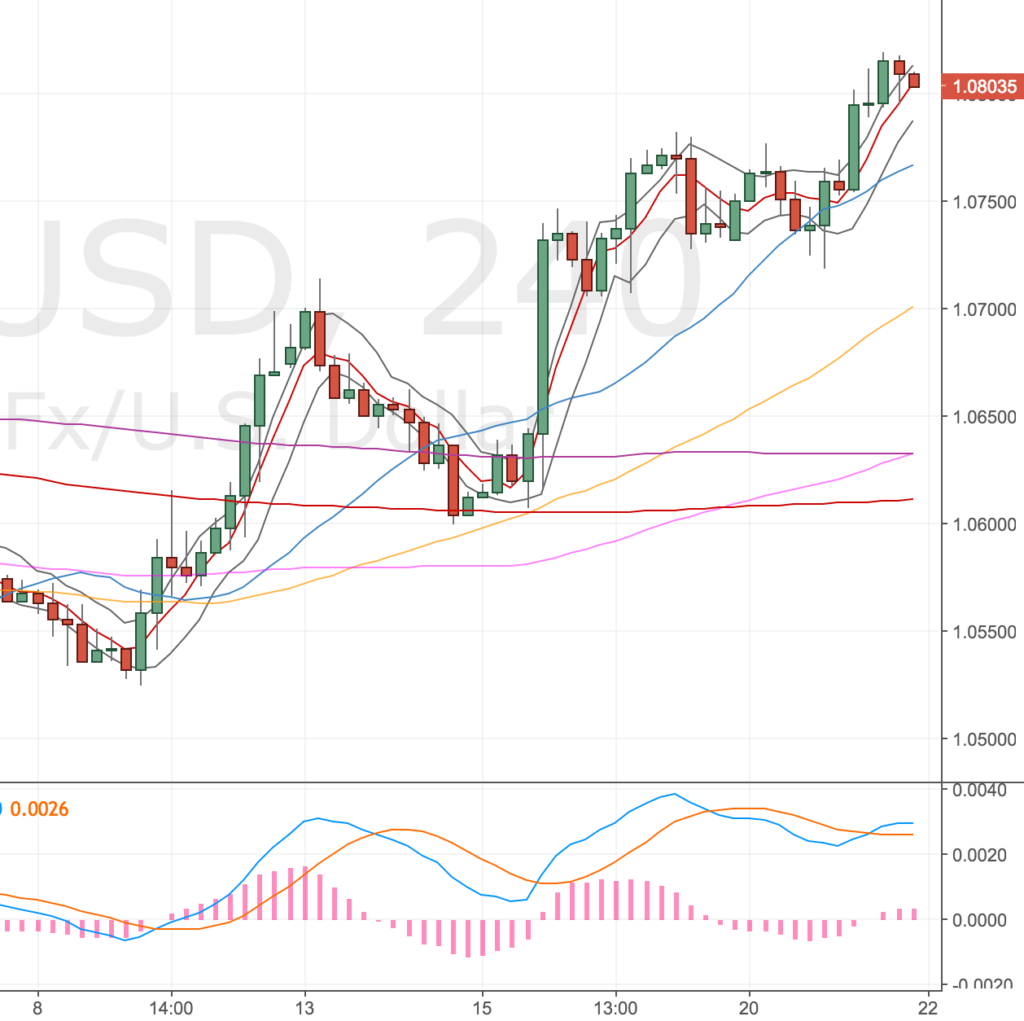
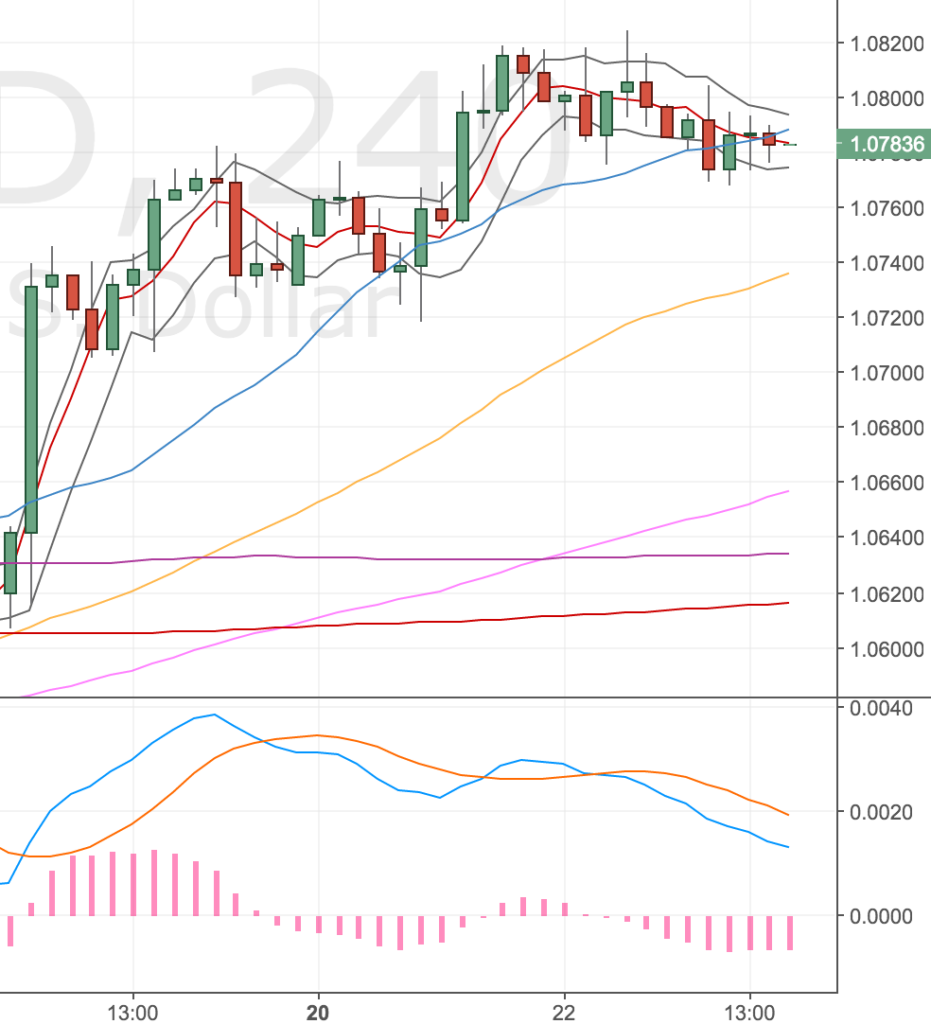
EURUSD 4H Chart – 21 Mar

Daily Chart

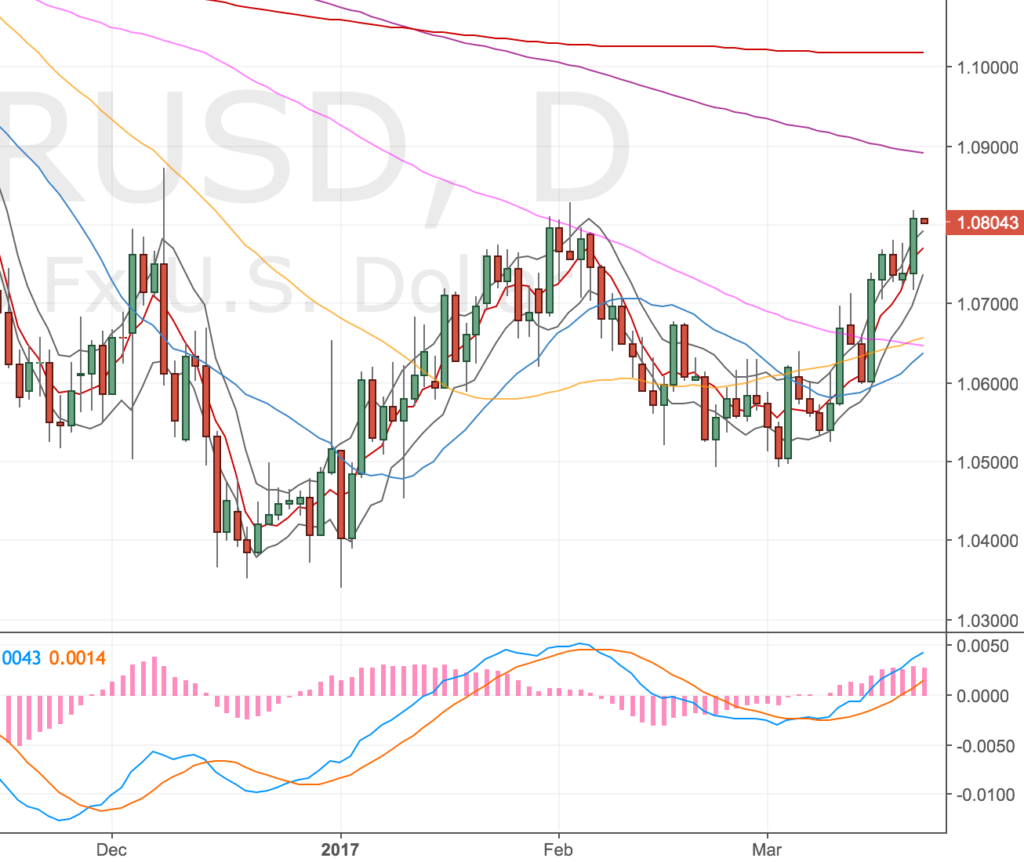
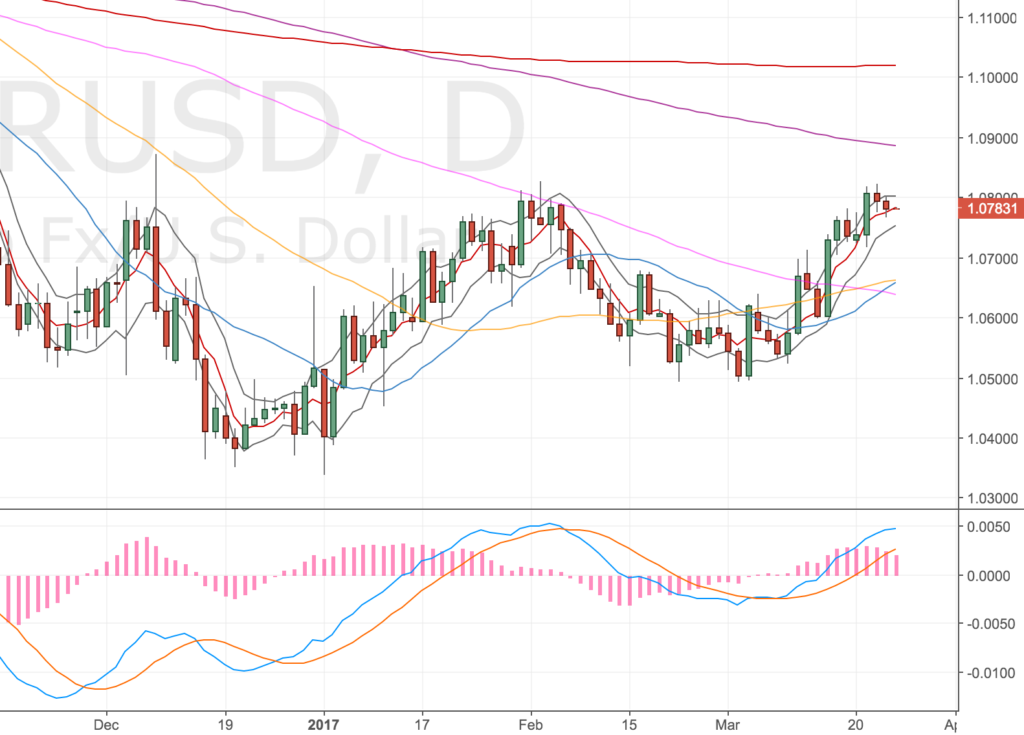
EURUSD Daily Chart – 21 Mar. Will the divergence materialise?

One thing worth noting is the proximity of the 200MA. It’s not a million miles away so may well get a move up to that.

So I put the first position on and was just about to put the second position on when my ETX quote locked/stopped quoting and I couldn’t place my second position for about 10 seconds. When it came back again the price had moved about 10 pips so I waited for price to come back to me but it just kept falling away.

Sell quote locked. Came back 10 pips lower.

I decided to wait but price didn’t come back so I closed the window. There are other set ups forming on other Euro pairs, so for now I’ll sit tight.

Update – Not much progress, but the daily divergence has set up – 23 Mar

EURUSD Daily Chart – 23 Mar. The divergence set up.

Small update the daily chart is now diverging and I’m unsure about what to do next. The daily 50MA is a nice distance away so I feel I should switch my target to that from the 4H 50MA. However, The 4H 50MA hasn’t been tested yet (according to my charts) it had an air kiss.

At the moment I’m sticking with the 4H 50. (I think mentor Charlie would go for the daily 50). I really wish I had those two positions now so I could target both!

For now I’m going to play safe, price action hasn’t been great. I can see myself getting stopped out of this trade and having to re-enter. Price is also hand-railing the 4H 20 so maybe we’ll get a blow-out to the downside?

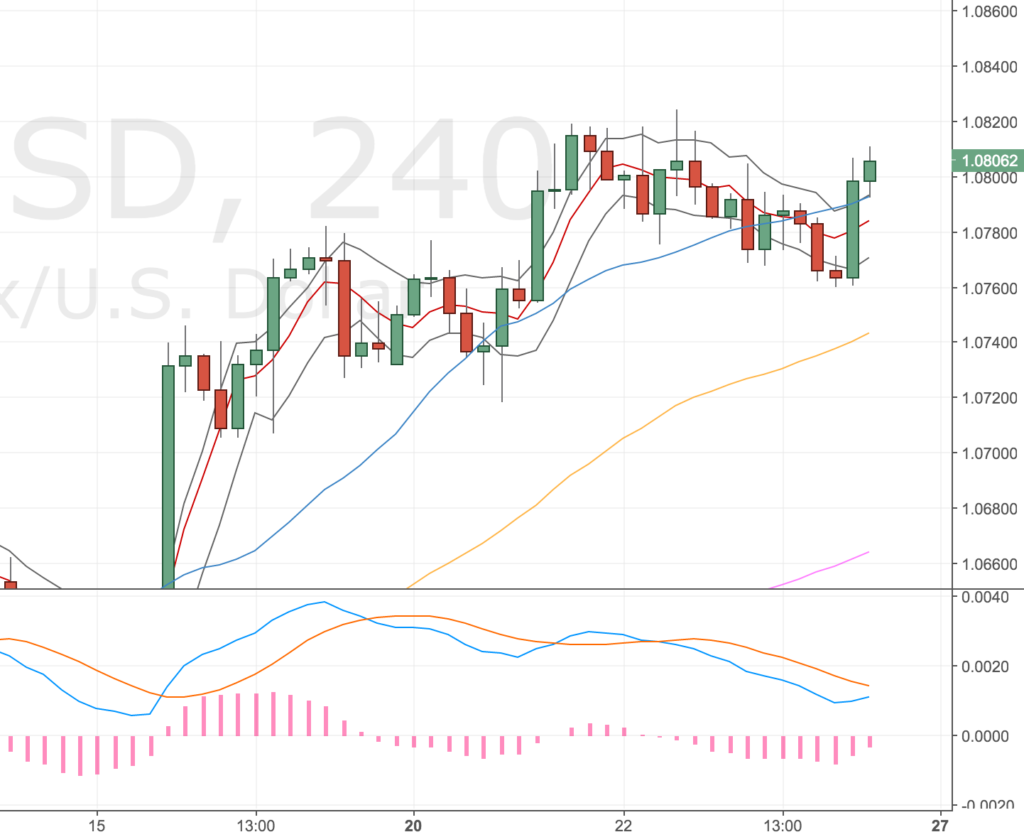
EURUSD 4H Chart – 23 Mar.

Update – Might be getting a double divergence! – 24 Mar

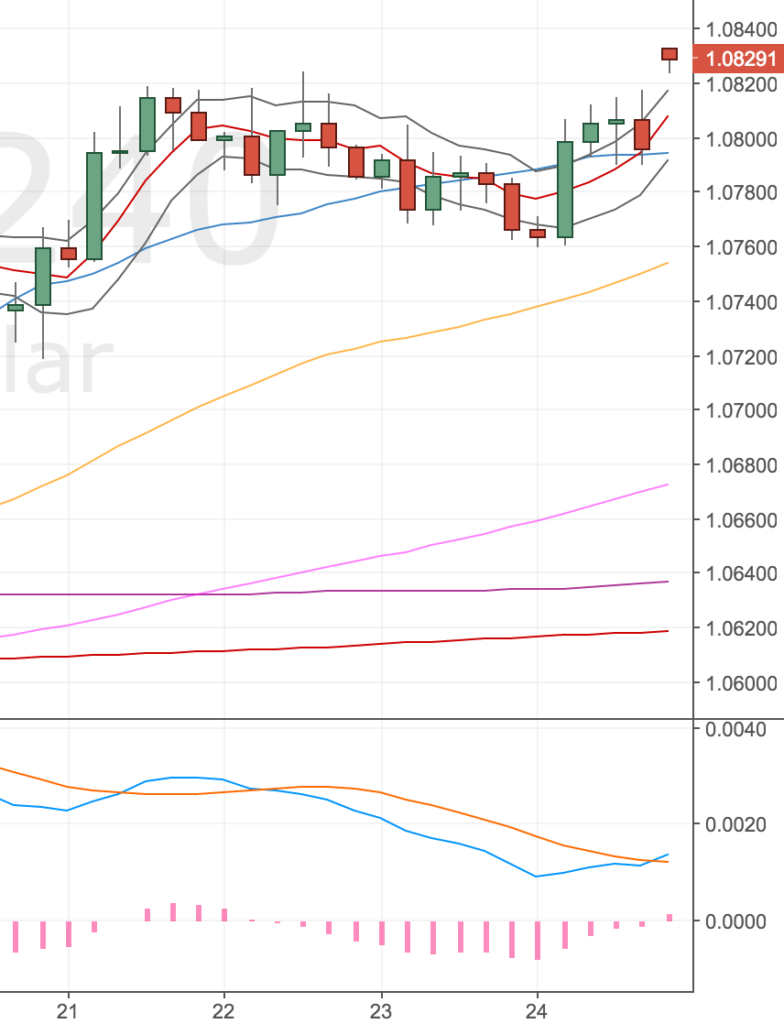
EURUSD 4H Chart – 24 Mar. Double divergence forming?

Just noted that price has moved up this morning against my position but I just wonder if we’ll get a double divergence setting up!?

Hmmm I wonder

If we do, I’ll be switching the next target to the 4h 100 which is very near the daily 50. Could be a tasty entry, we’ll see.

Update – got stopped out – 27 Mar

The Euro gapped up over the weekend and continued higher. I was stopped out of the position as the market opened on Sunday night. My first experience of getting gapped over my stop.

Wasn’t great – but I’m glad I didn’t get put off shorting again (even though I got stopped out again on my EURCAD trade!)

EURUSD 4H Chart – 26 Mar. Gapped and stopped out.

Will wait and see if I get another entry on this.