Long: 44.60
Stop: 44.11 (49 pips)
Target: 48.70 (110 pips, d50, 2.24 RR)
Mindset: Like the set up, but oil is spikey and the price range has been low
Attempts: I anticipate as many as 3.
Updates
Oops my trade expired! – 16 June
Sell off! – 20 June
Going in again – 21 June
Stopped out – 21 June
Third attempt – 22 June
Sitting tight, lacklustre price action – 23 June
Would like to close this on weak price action – 28 June
Hit target PM – 28 June
I’ve been watching oil for longs for maybe a few weeks now. I’ve been seeing divergences forming on the daily, 4h and h timeframes. I’ve also been asking Charlie to take a look at the set ups in the MBT Monday sessions (although I’m not sure he fancies the trade himself).
However, I can see a weekly trend channel in play and we are close to hitting the lower part.
Within the weekly channel we’ve been in a mini trend channel down, which is showing a divergence. The higher timeframe pattern says that we’re in a bearish pennant pattern so going long might not be so wise, but it’s been a while since we tested the daily lower trend channel.
So my expected pattern is for a bounce higher before a rollover.
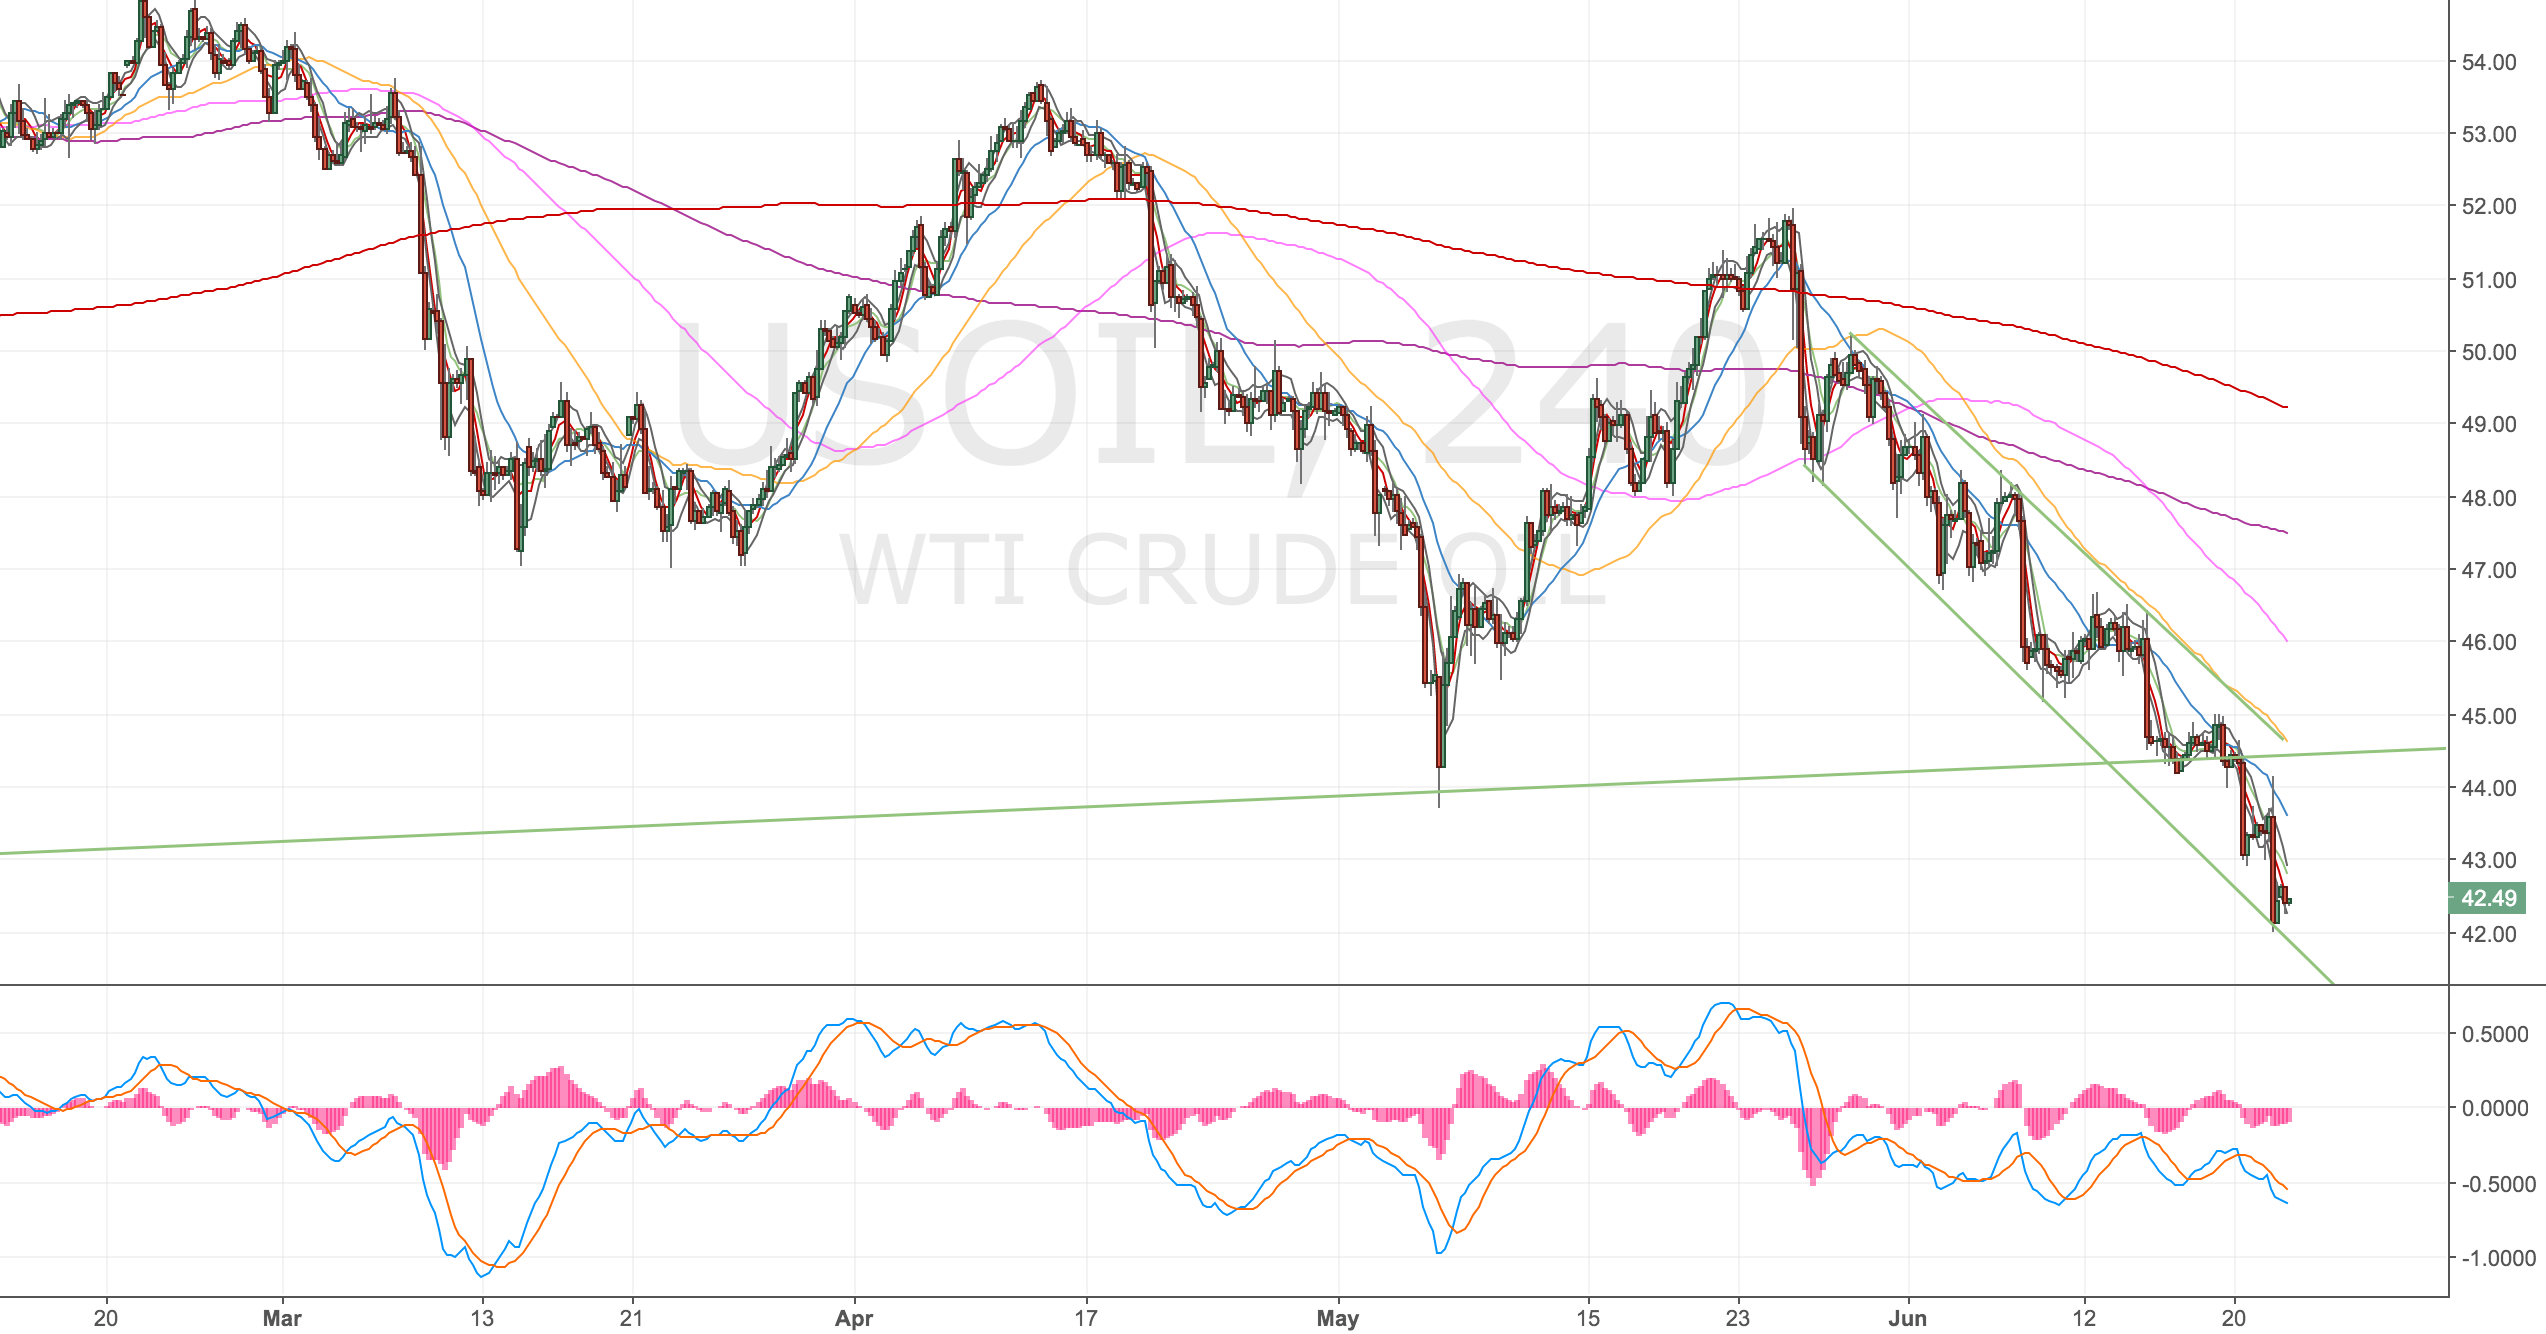
4H Chart set up

Oil 4H Chart – 20 June 17
Daily Chart
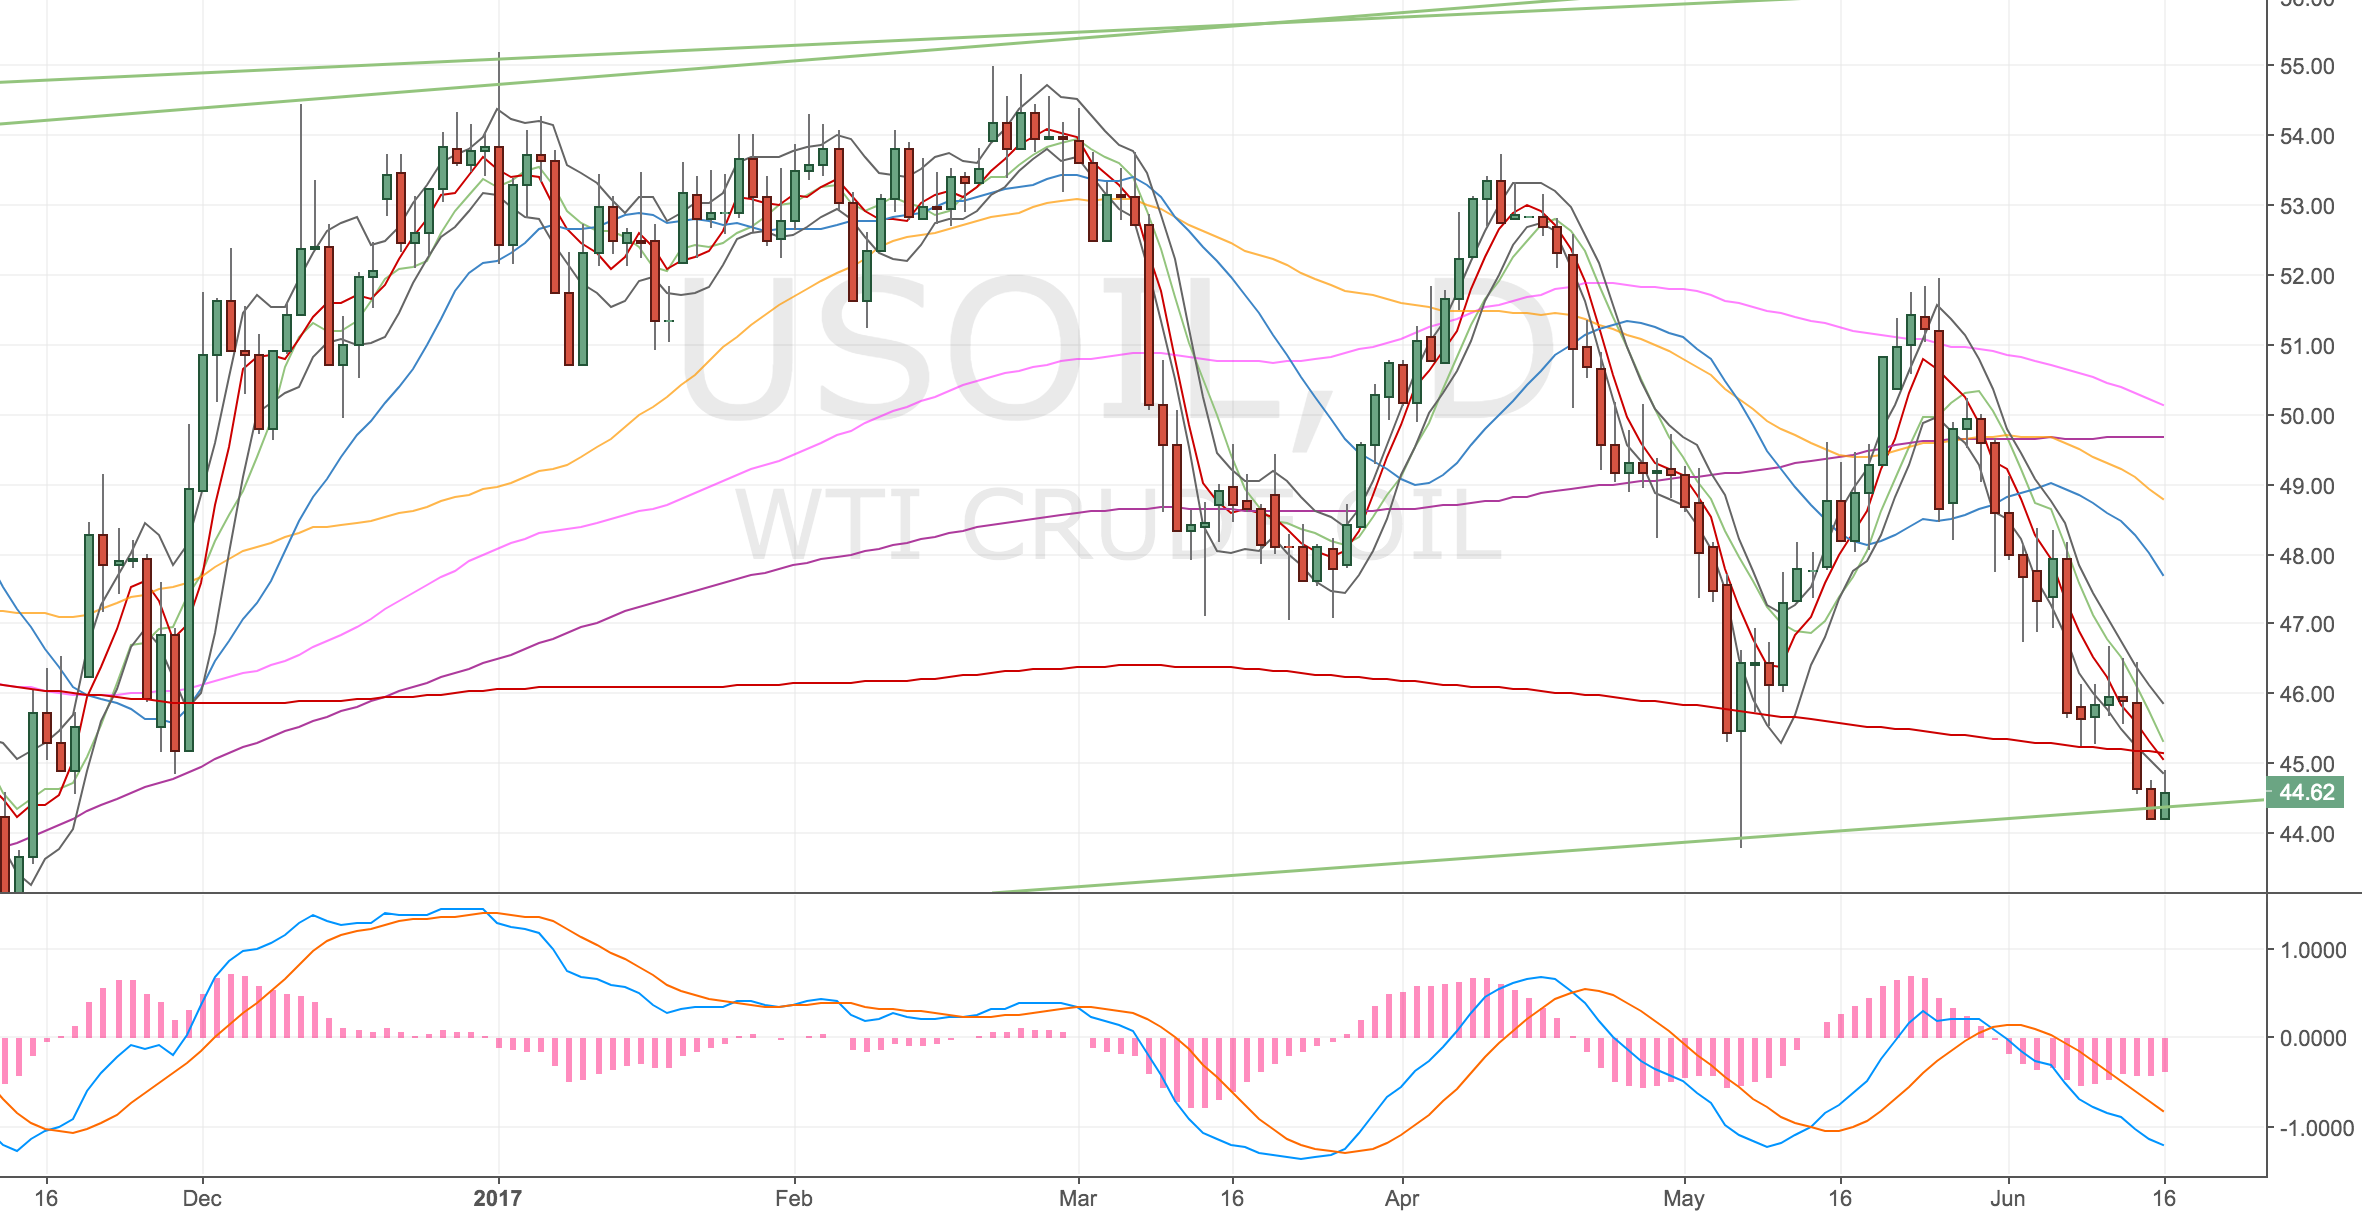
Oil Daily Chart – 20 June 17
Weely Chart
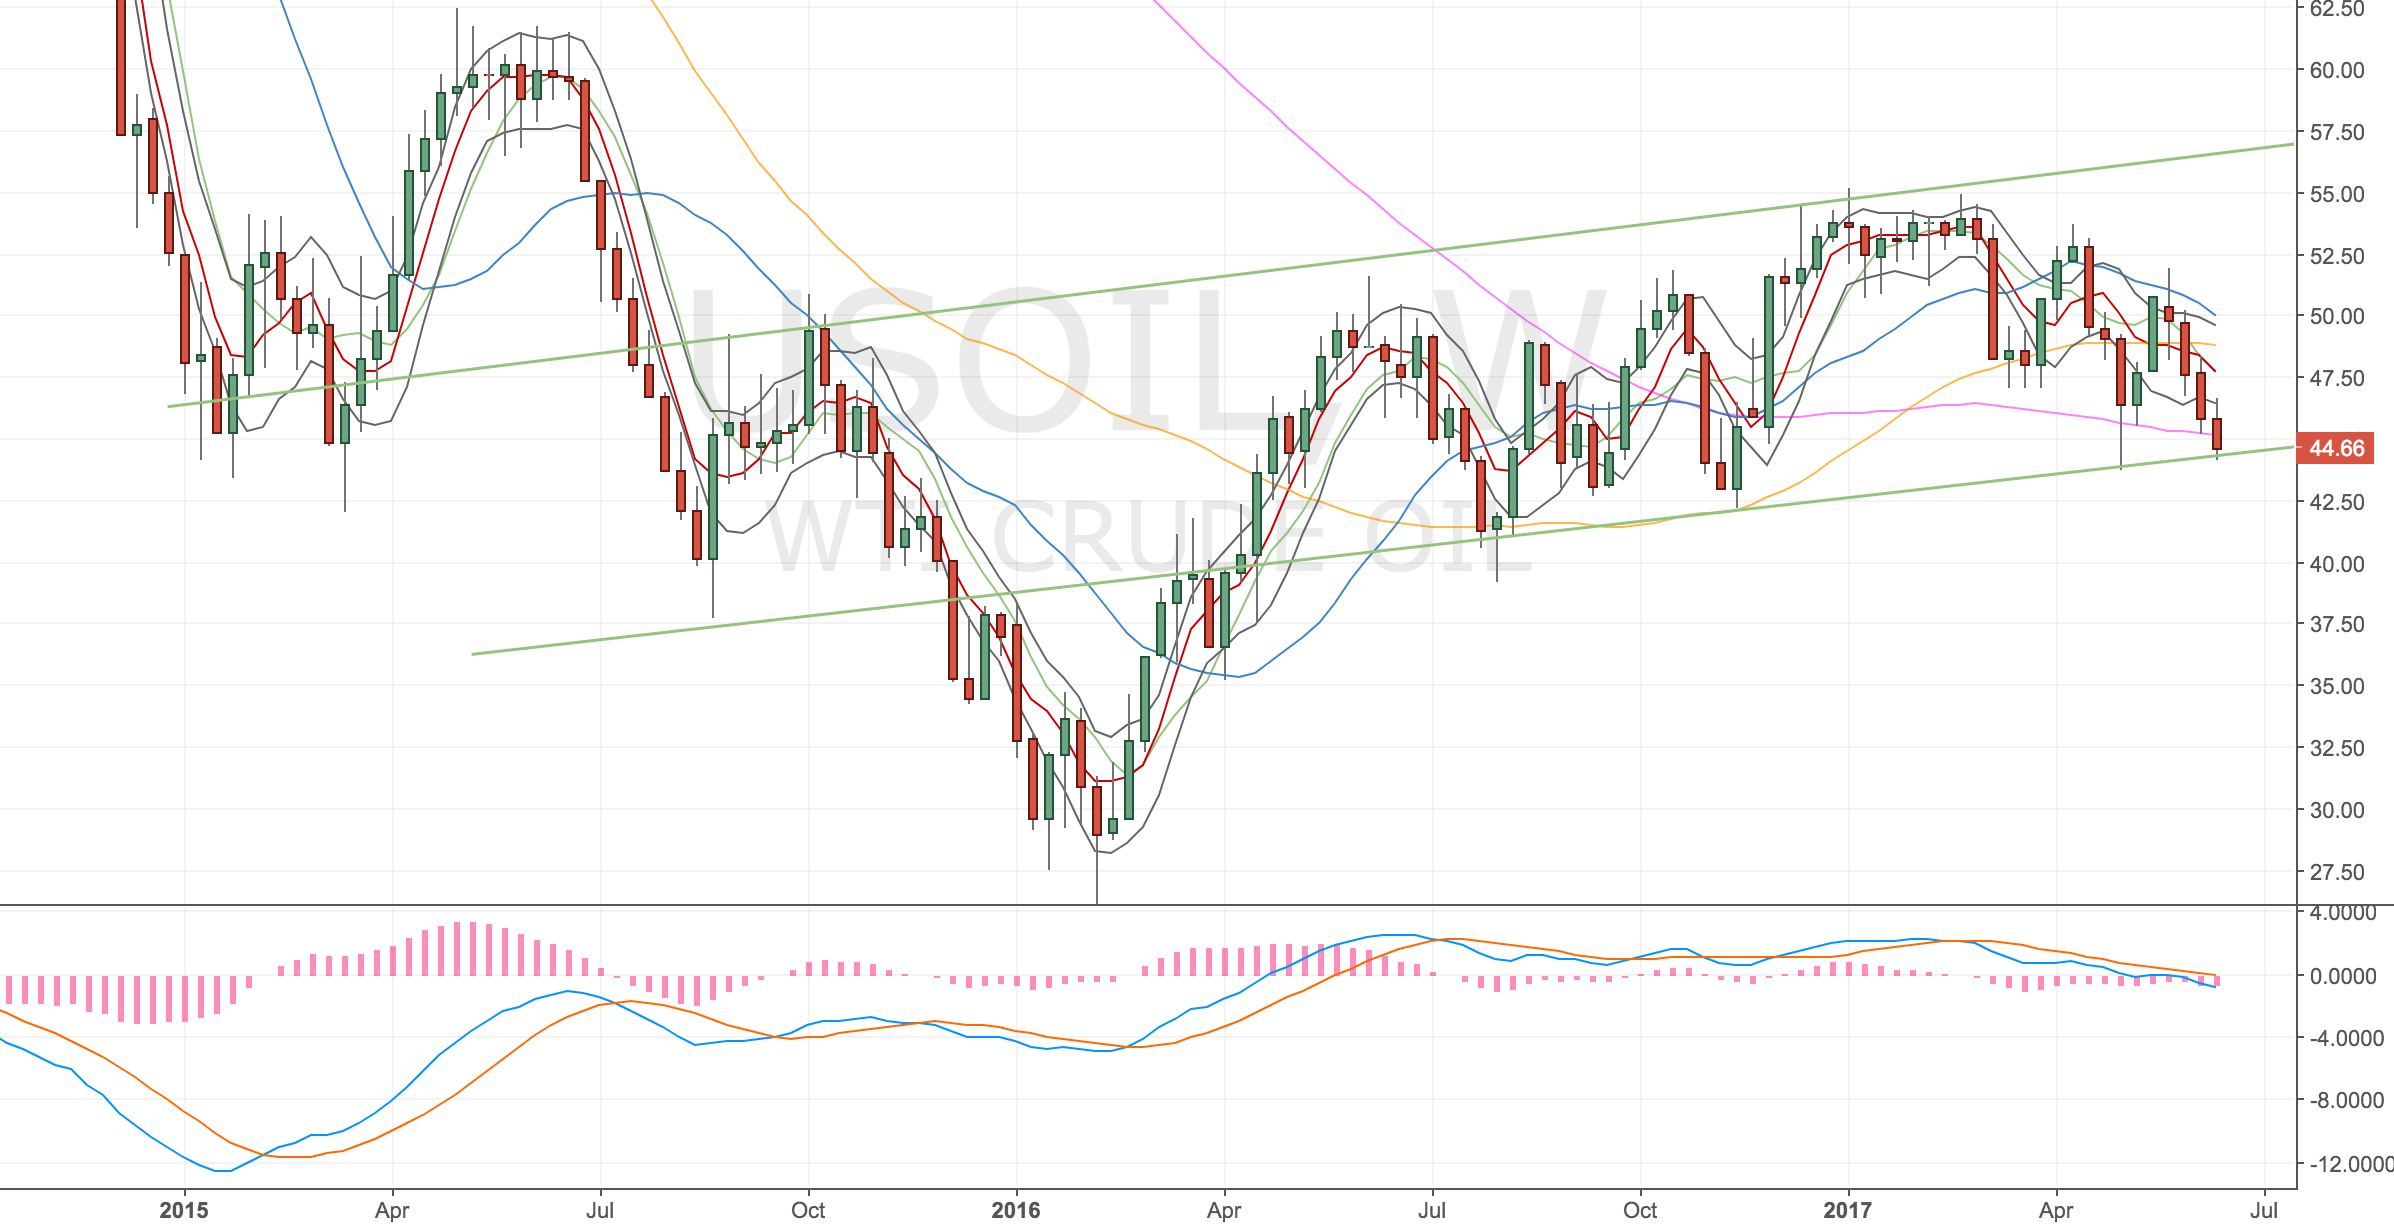
Oil Weekly Chart – 20 June 17
Oops my trade expired! – 16 June
Ops, I didn’t realise the market I chose expired daily! So my trade just got closed! Doh, should’ve checked more carefully before placing the order.
My plan now is to see how the market opens on Sunday night and re-enter the market.
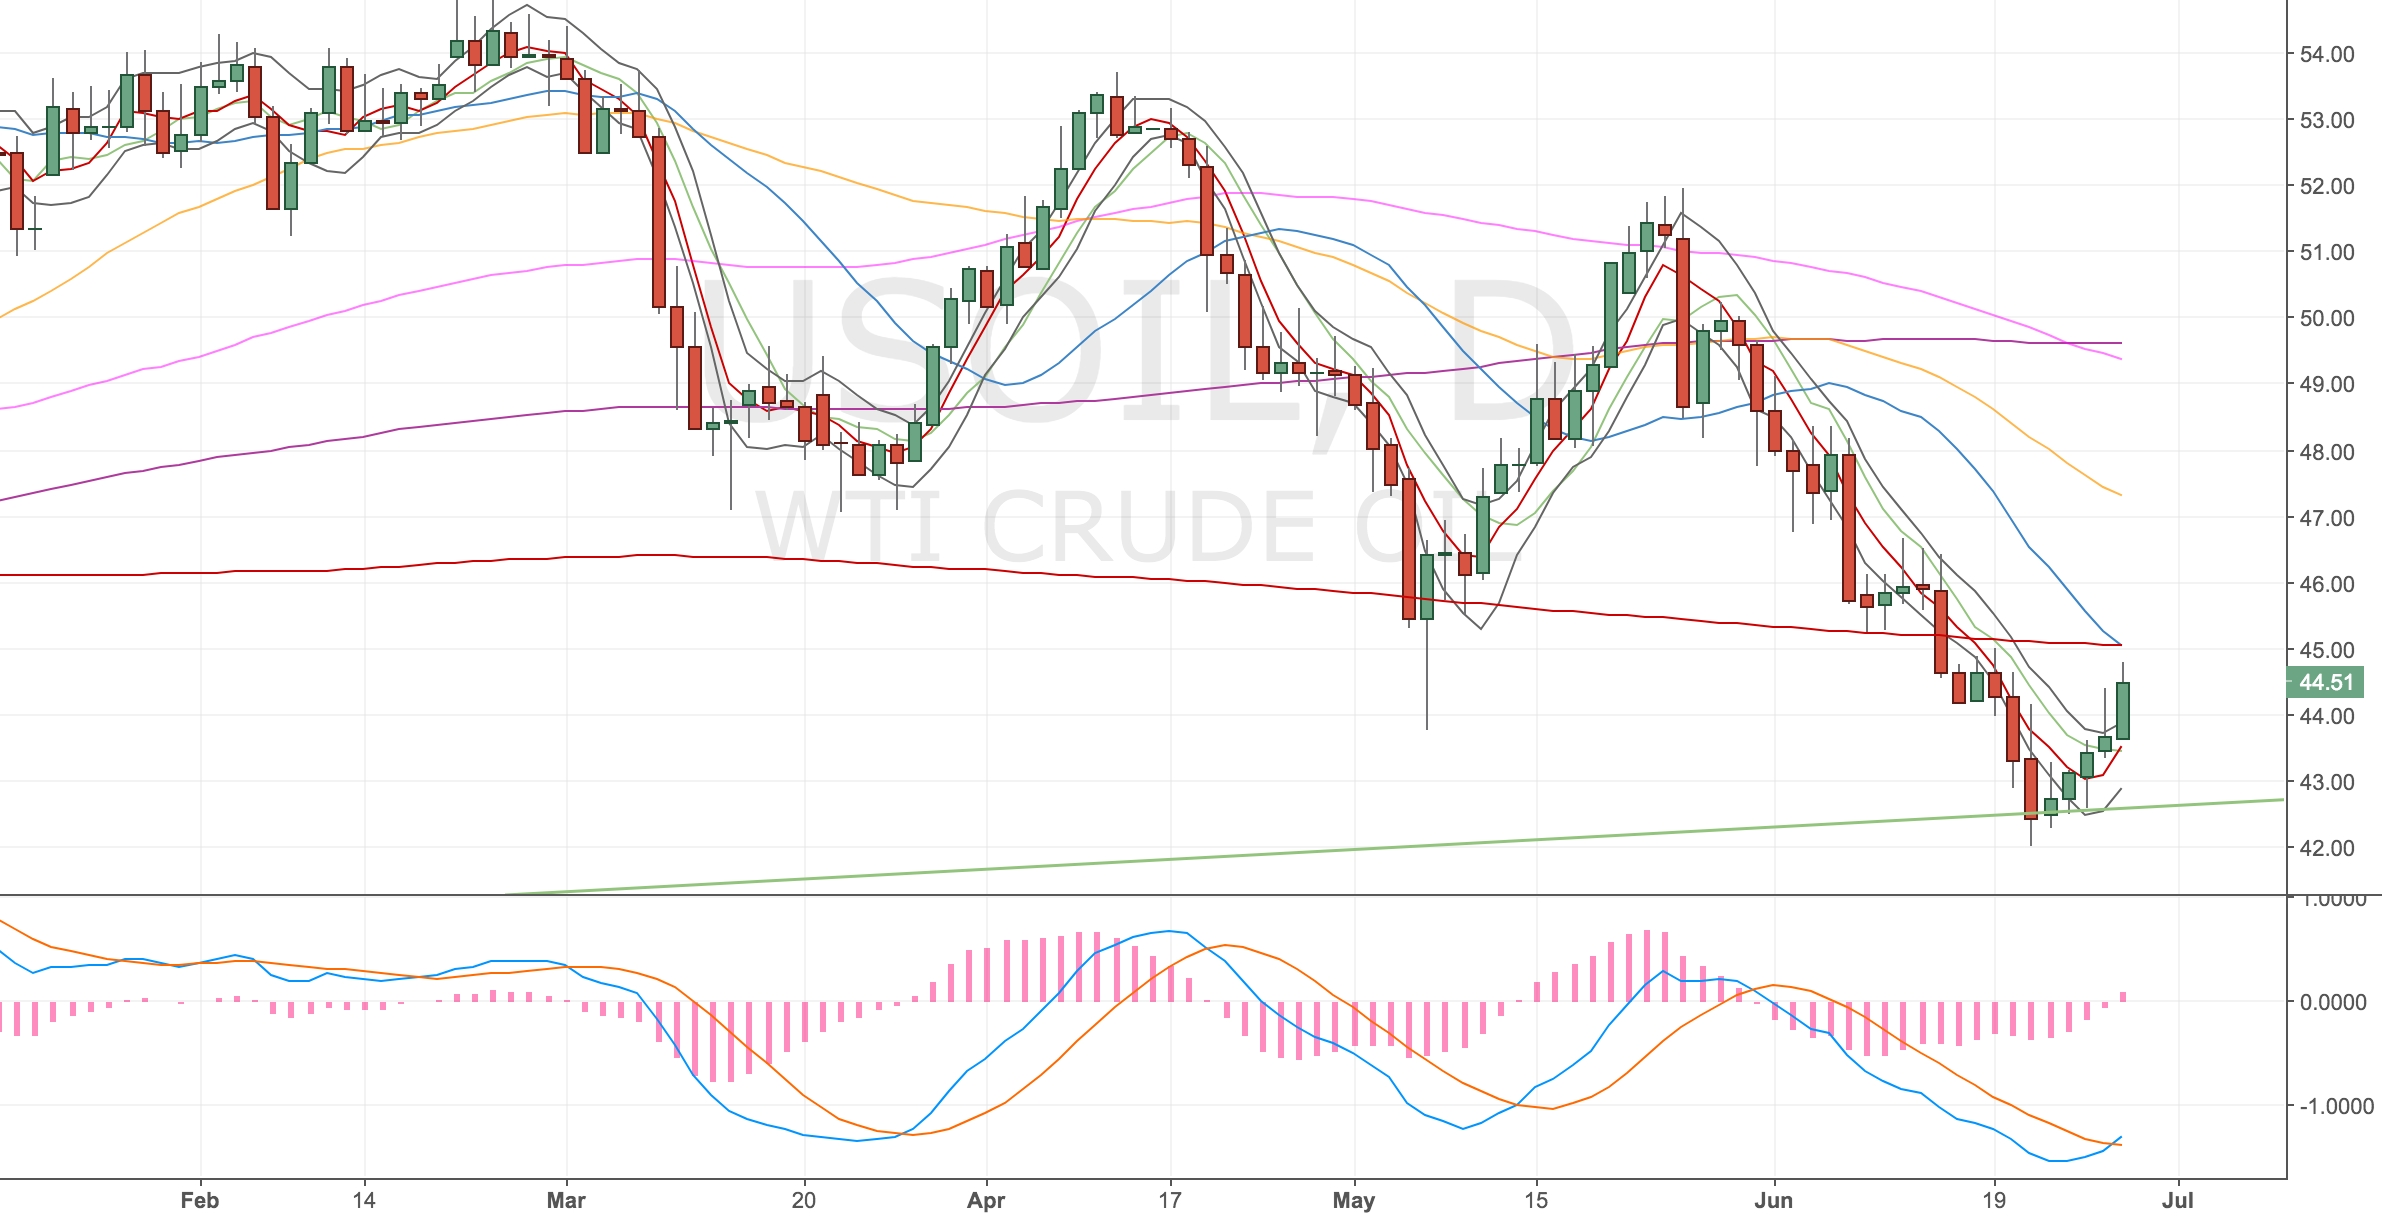
Sell off! – 20 June
Sometimes my lack of routine helps me, I didn’t get a chance to check on the market properly on Monday so I didn’t get back into my trade. It would’ve stopped me out, so the small profit I made on the trade expiring was fortuitous.
I’ve been struggling to choose a point to get back in as price action has been so lacklustre. So I emailed Charlie about it and went to work. Here’s the chart at the time.
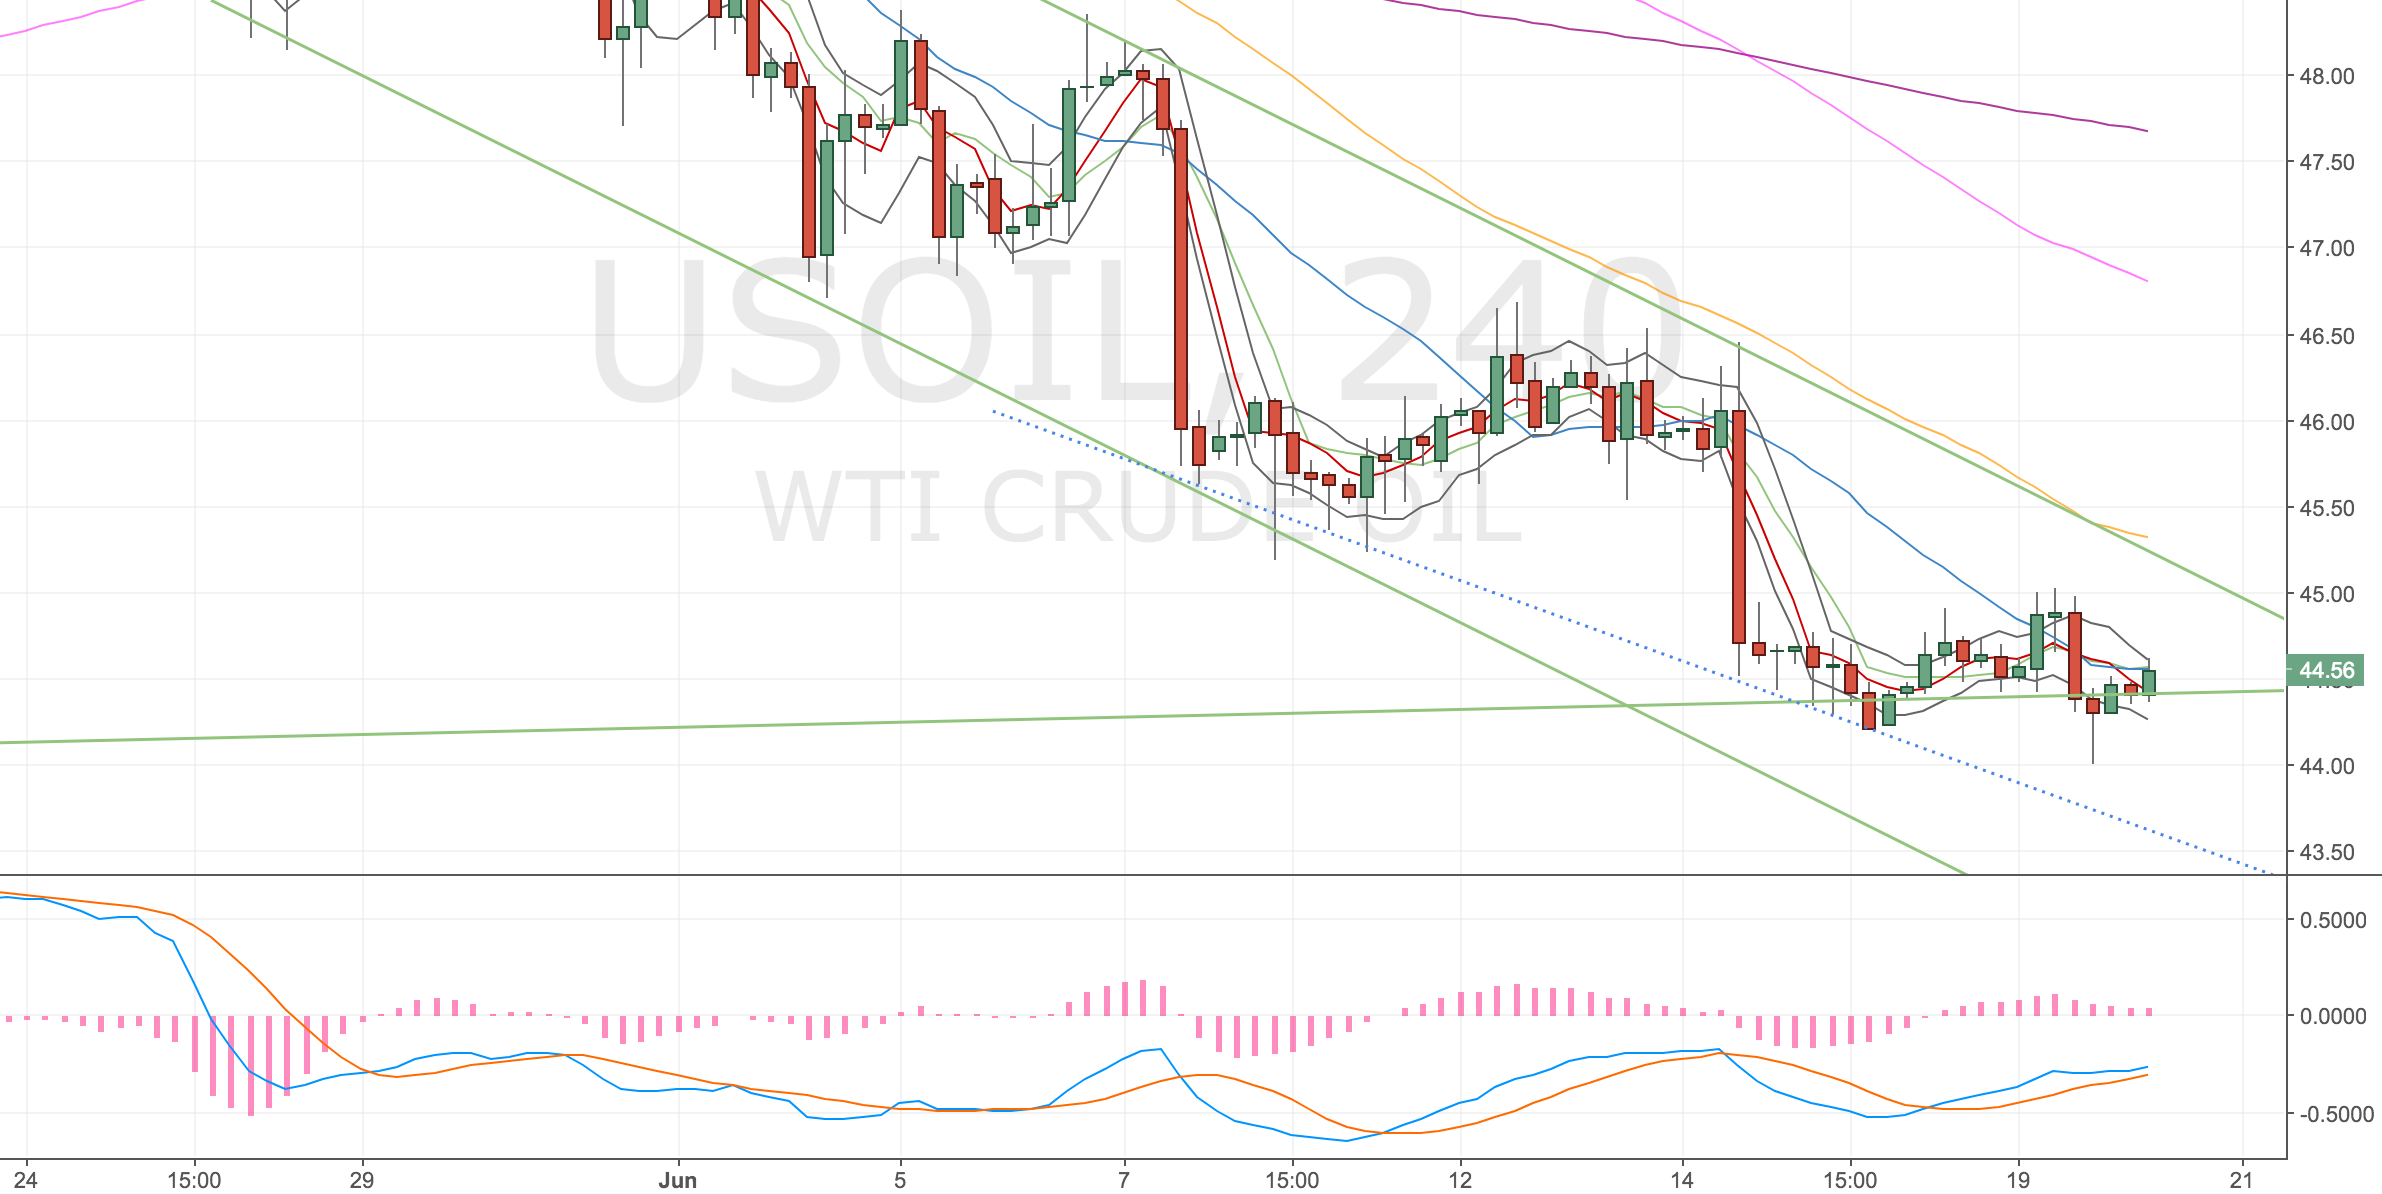
Oil 4H Chart – 20 June 17
My assumption was that I should just get back in – price of the time matched my previous entry level – and Charlie agreed the set up was still valid. However another fortuitous thing happened, as I was commuting into work, there was a big old sell-off underway so I didn’t get a chance to re-enter.
Oil 4H Chart – 21 June 17
Going in again – 21 June
Long: 43.46
Stop: 42.84 (60 pips – quite rich)
Target: 46.40 (294 pips, 4h100, 4.9 RR)
Mindset: OK, think I’ve got a good entry here. No daily divergence though.
Attempts: Just this one. I think this’ll stick now.
Ok the set up is here again and we’ve had a nice spike lower which got bought up so I’m going in again.
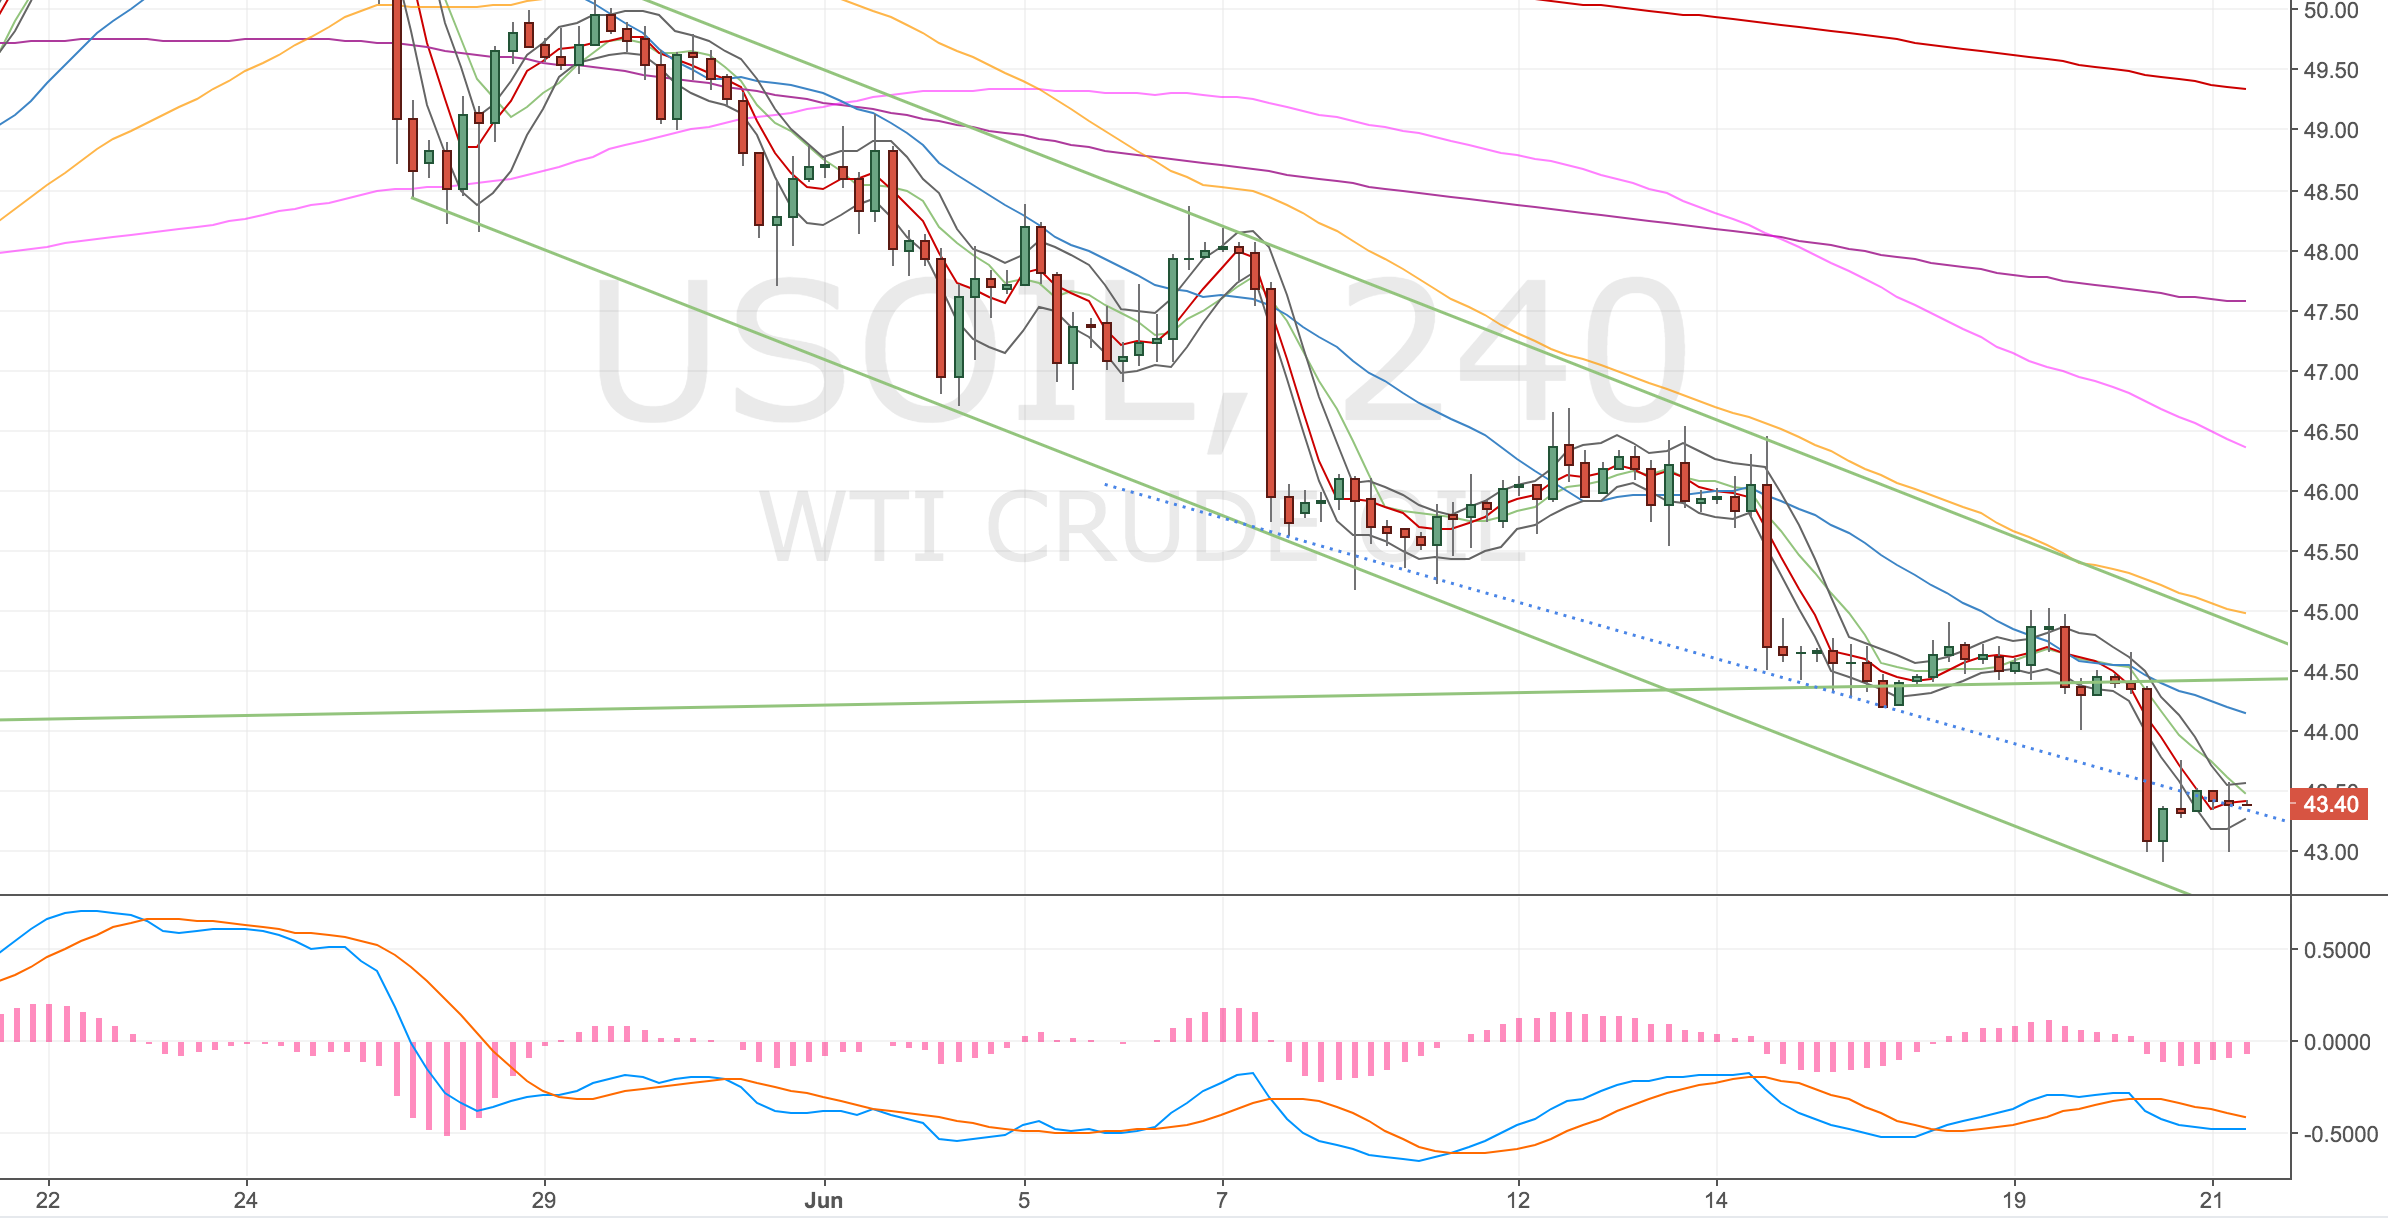
Oil 4H Chart – 21 June 17
Stopped out – 21 June
Got stopped out on another move lower, the trendline hadn’t been quite touched until now, so not too unexpected, but I never put much faith in my trendlines. Sometimes I think they should be drawn as fat bands to stop me putting too much emphasis on them.
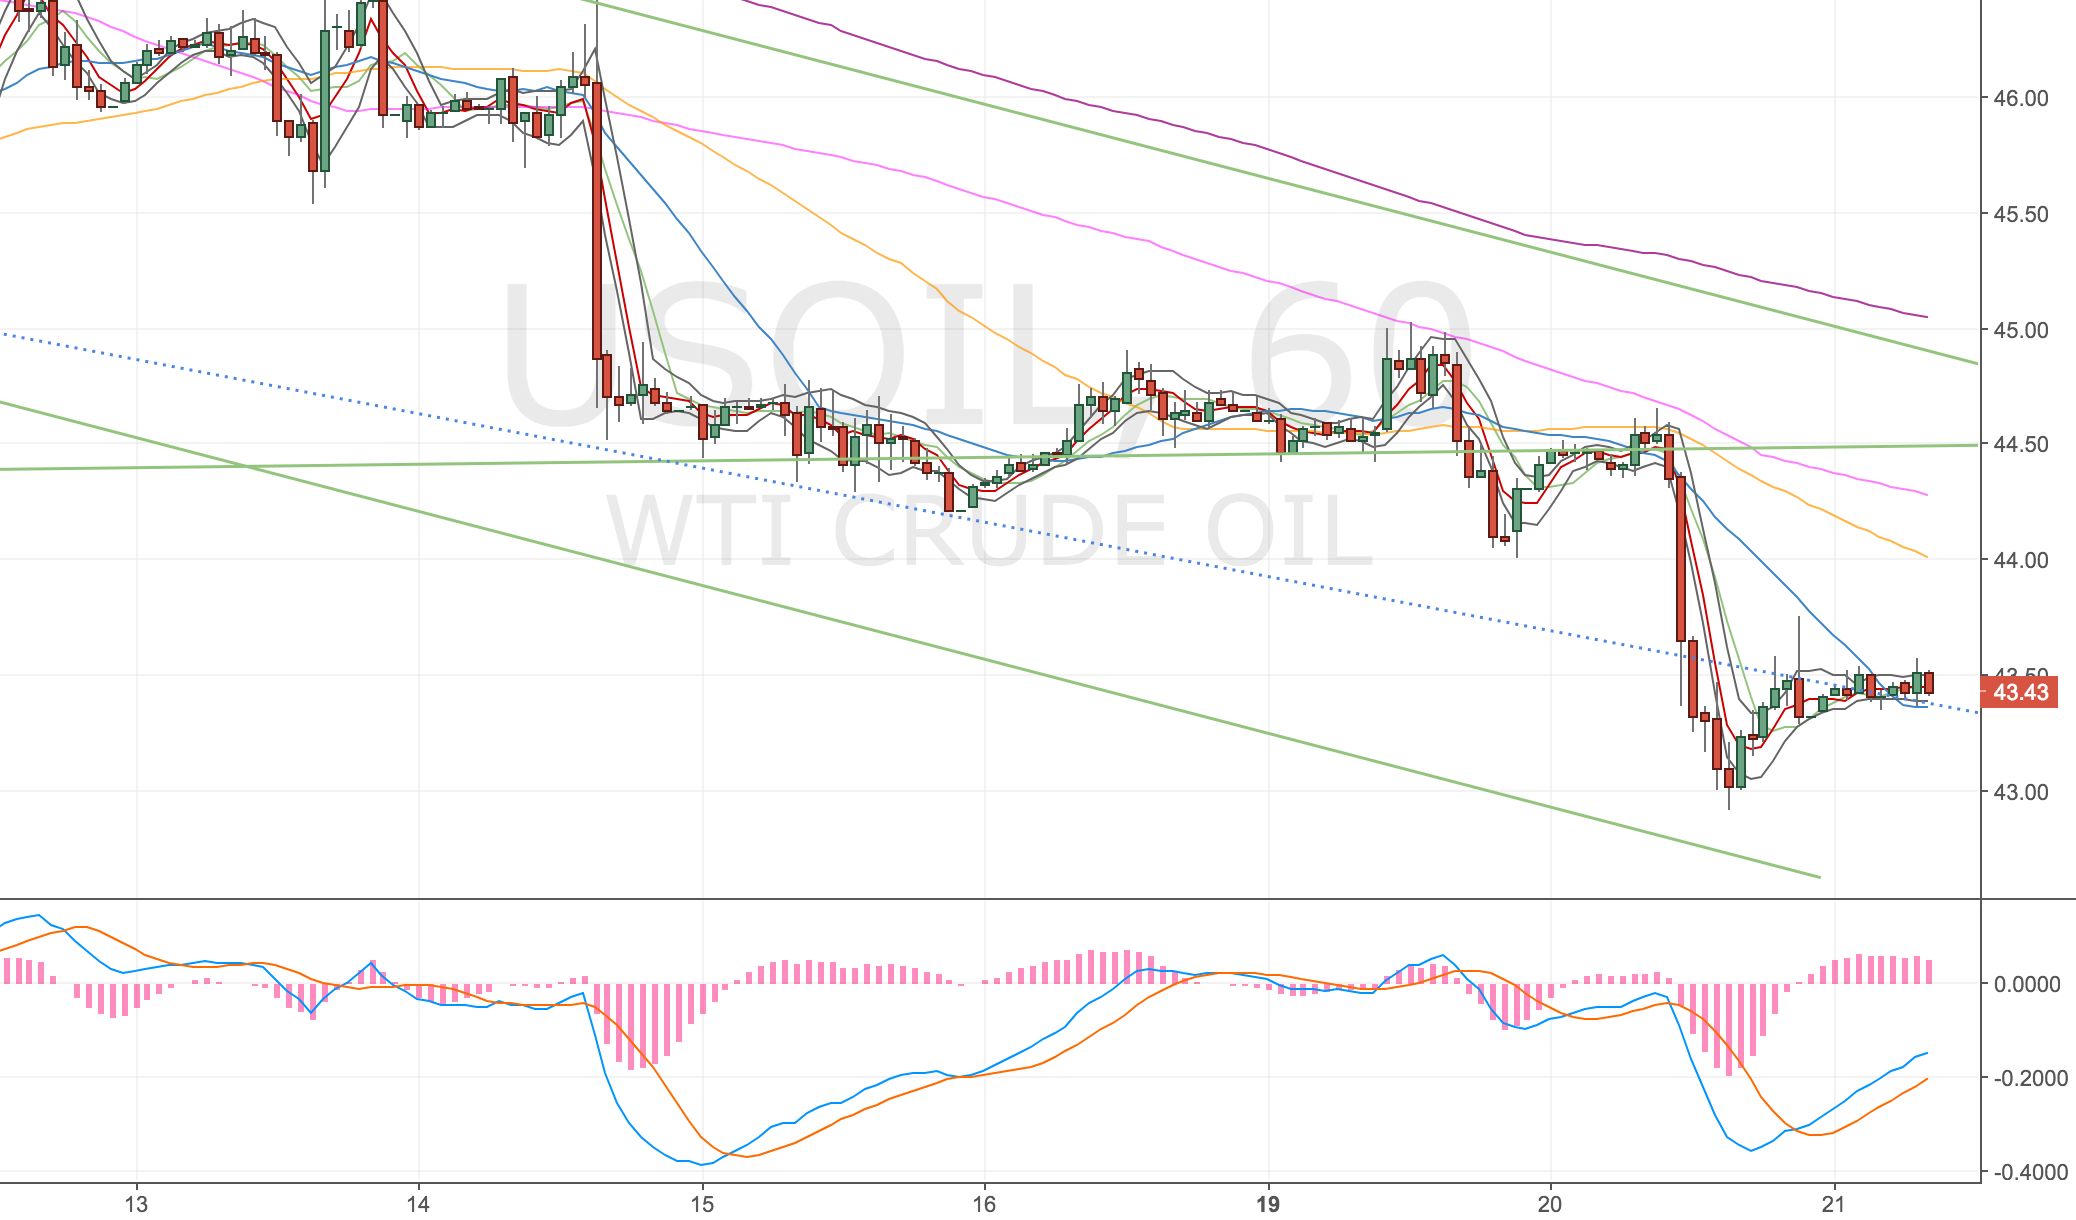
However, the price action has now set up another divergence on the hourly chart. I’m not entering just yet, as the 4H candlestick hasn’t closed inside my bands (although I’m very tempted too).
Oil 1H Chart – 21 June 17
Third attempt – 22 June
Long: 42.56
Stop: 41.95 (61 pips)
Target: 45.00 (244 pips, 4h100 & d500, 4 RR)
Mindset: Nervous about this as the trend down is so strong. Price rises get sold off quickly.
Attempts: 1 or 2. If it goes higher, I imagine it’ll jump around a bit and retest the lows again.
Price has closed inside the bands as of this morning. Price action looks pretty bearish to me, but it would with my strategy. The shame with this trade is that the spike low has upped my stop level so my position size has had to be smaller to keep my risk the same.
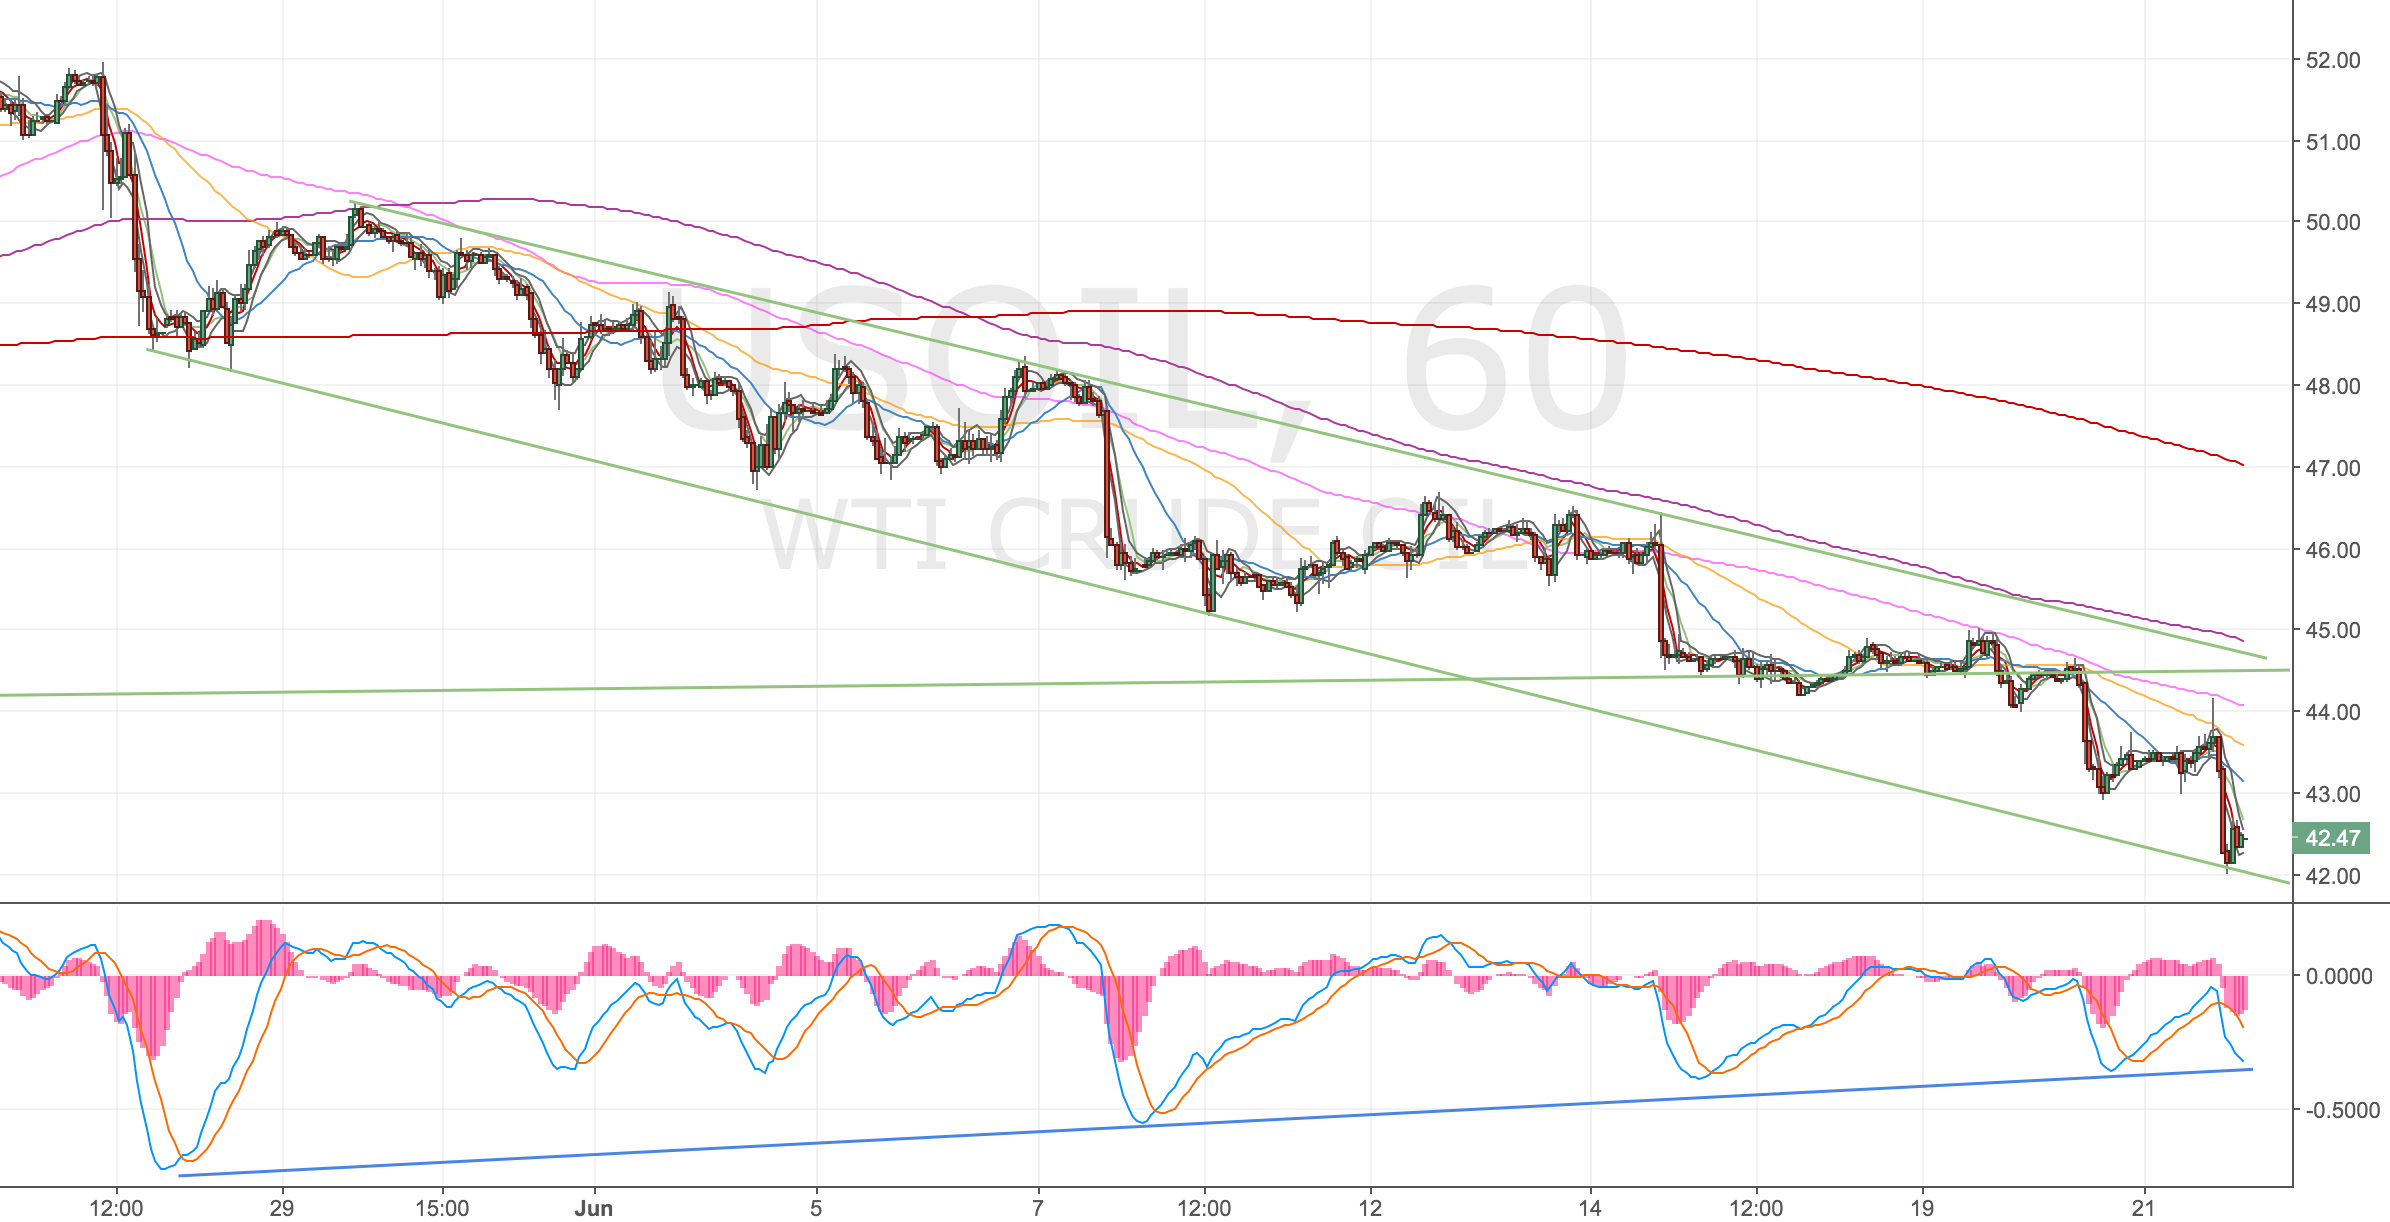
Oil 4H Chart – 22 June 17
Sitting tight, lacklustre price action – 23 June
Nothing is really happening with this trade, price jumps get sold off, it’s gone back to small range bars. I feel this is a bad sign for my trade, it looks identical to the previous price action before oil made another leg lower.
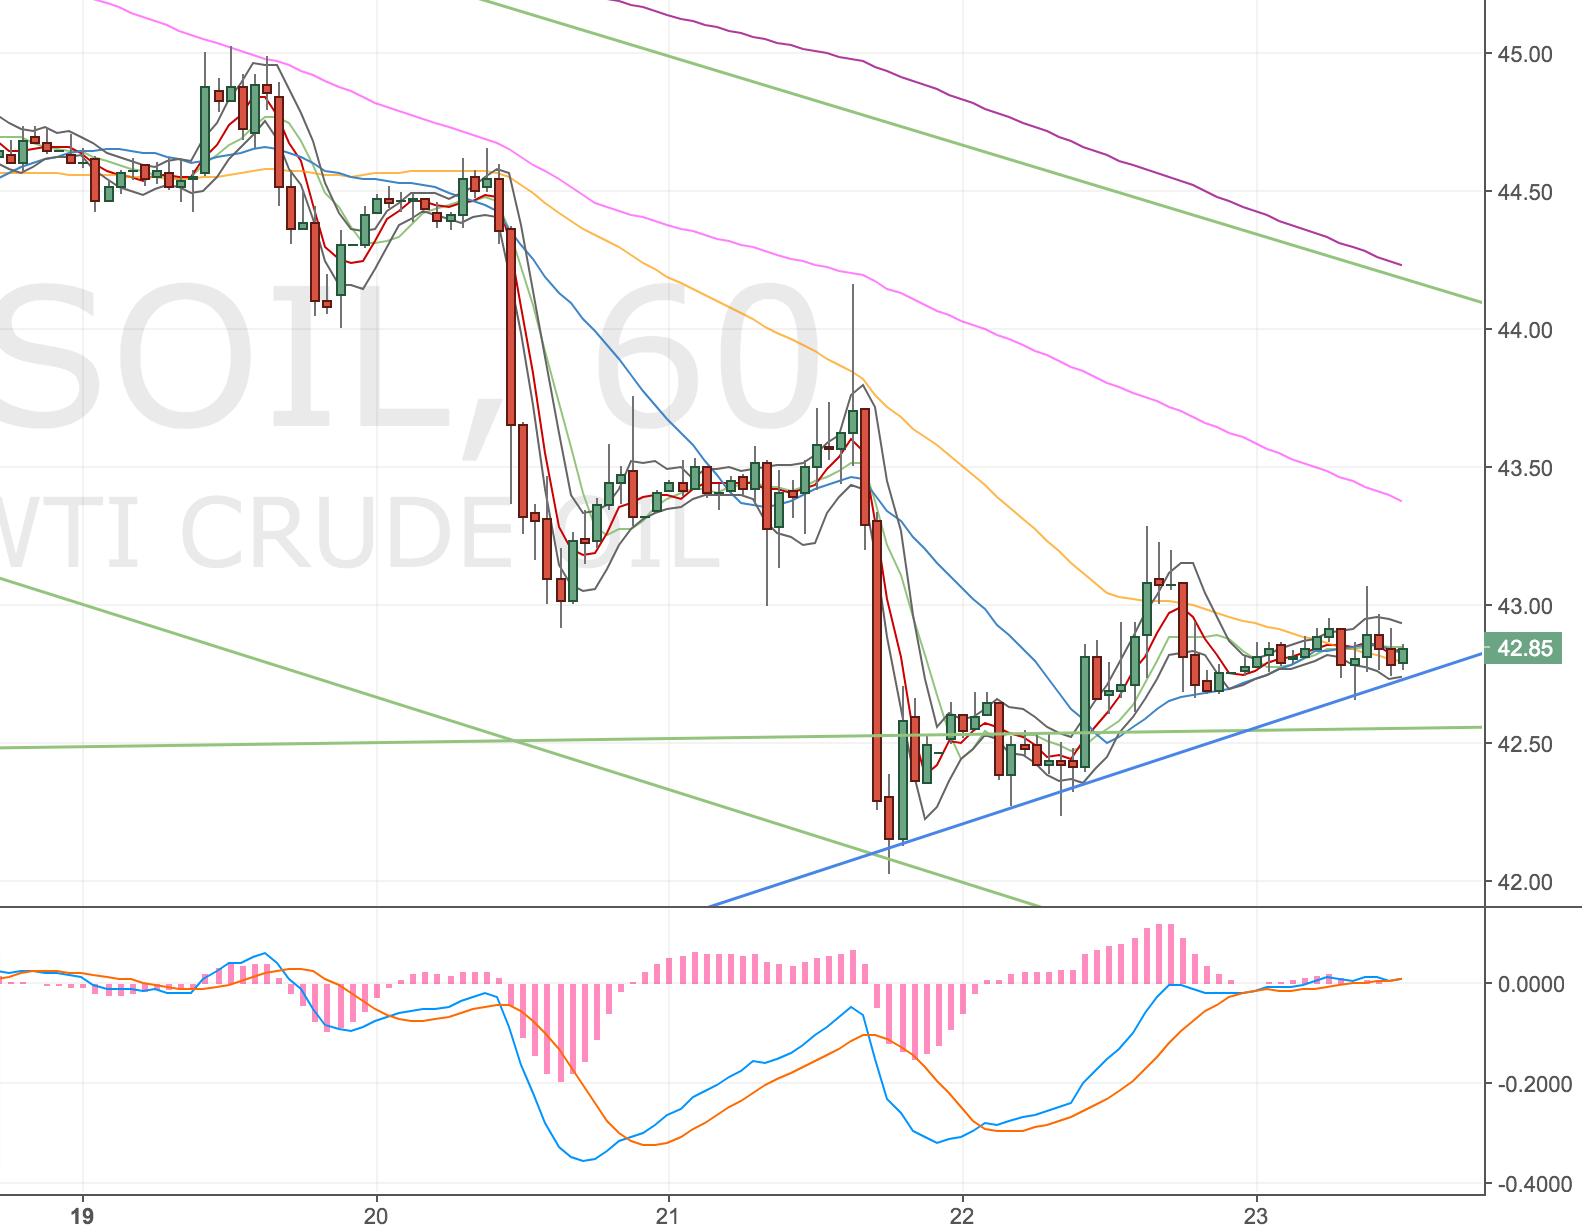
Oil 1H Chart – 23 June 17
Would like to close this on weak price action – 28 June
Just keeping an eye on this and the recent price action looks to be weak. I can see another pullback and a potential stop out on this. I’ve been reasonably close to target but haven’t come close enough to close the trade. I think I will be in this for a while longer yet.
If I wasn’t trading my system – I would close this trade. I’ve been resisting the urge to intervene. If I do close it though, it’ll become a trade I can’t properly learn from (I need to experience the discomfort of watching unbooked profits fluctuate) and I’ll be reintroducing bad habits (tinkering with trades and potentially underperforming the strategy).
So I’m sitting on my hands but yeah … I’d like to get out of this and wait for a better entry.
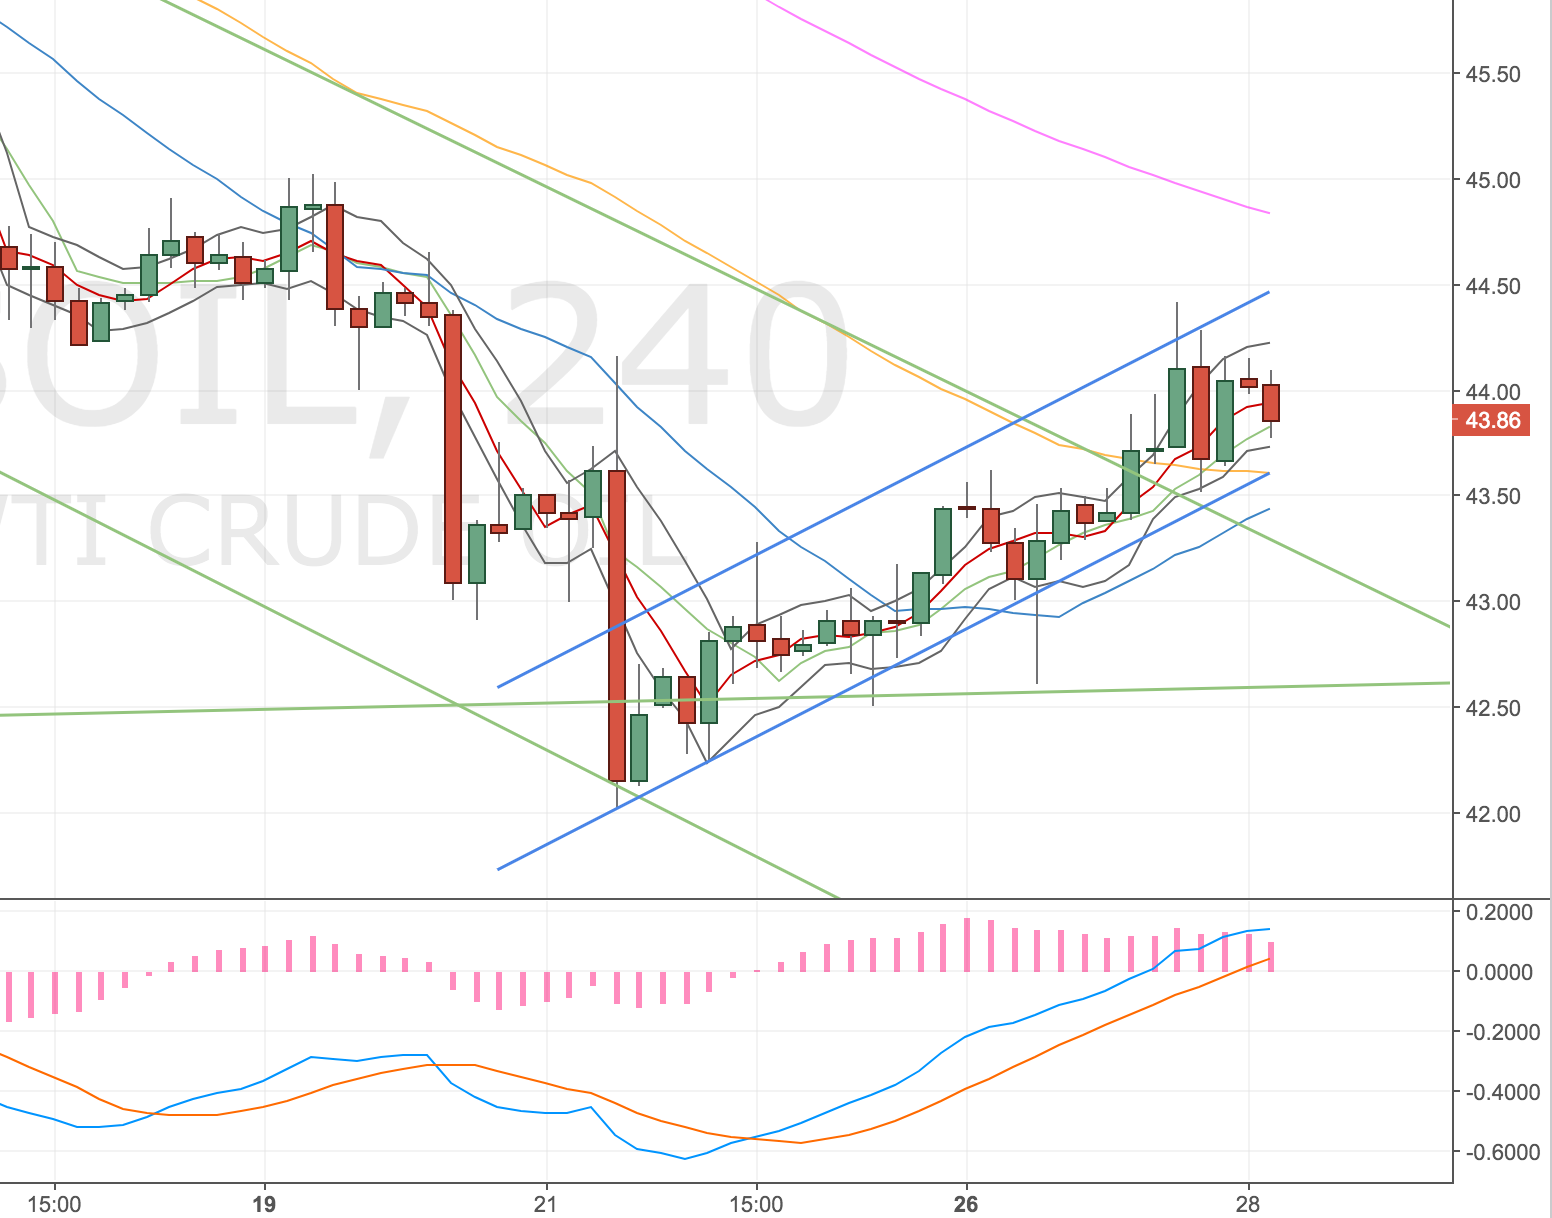
USOIL 4H Chart – 28 June 17
Hit target PM – 28 June
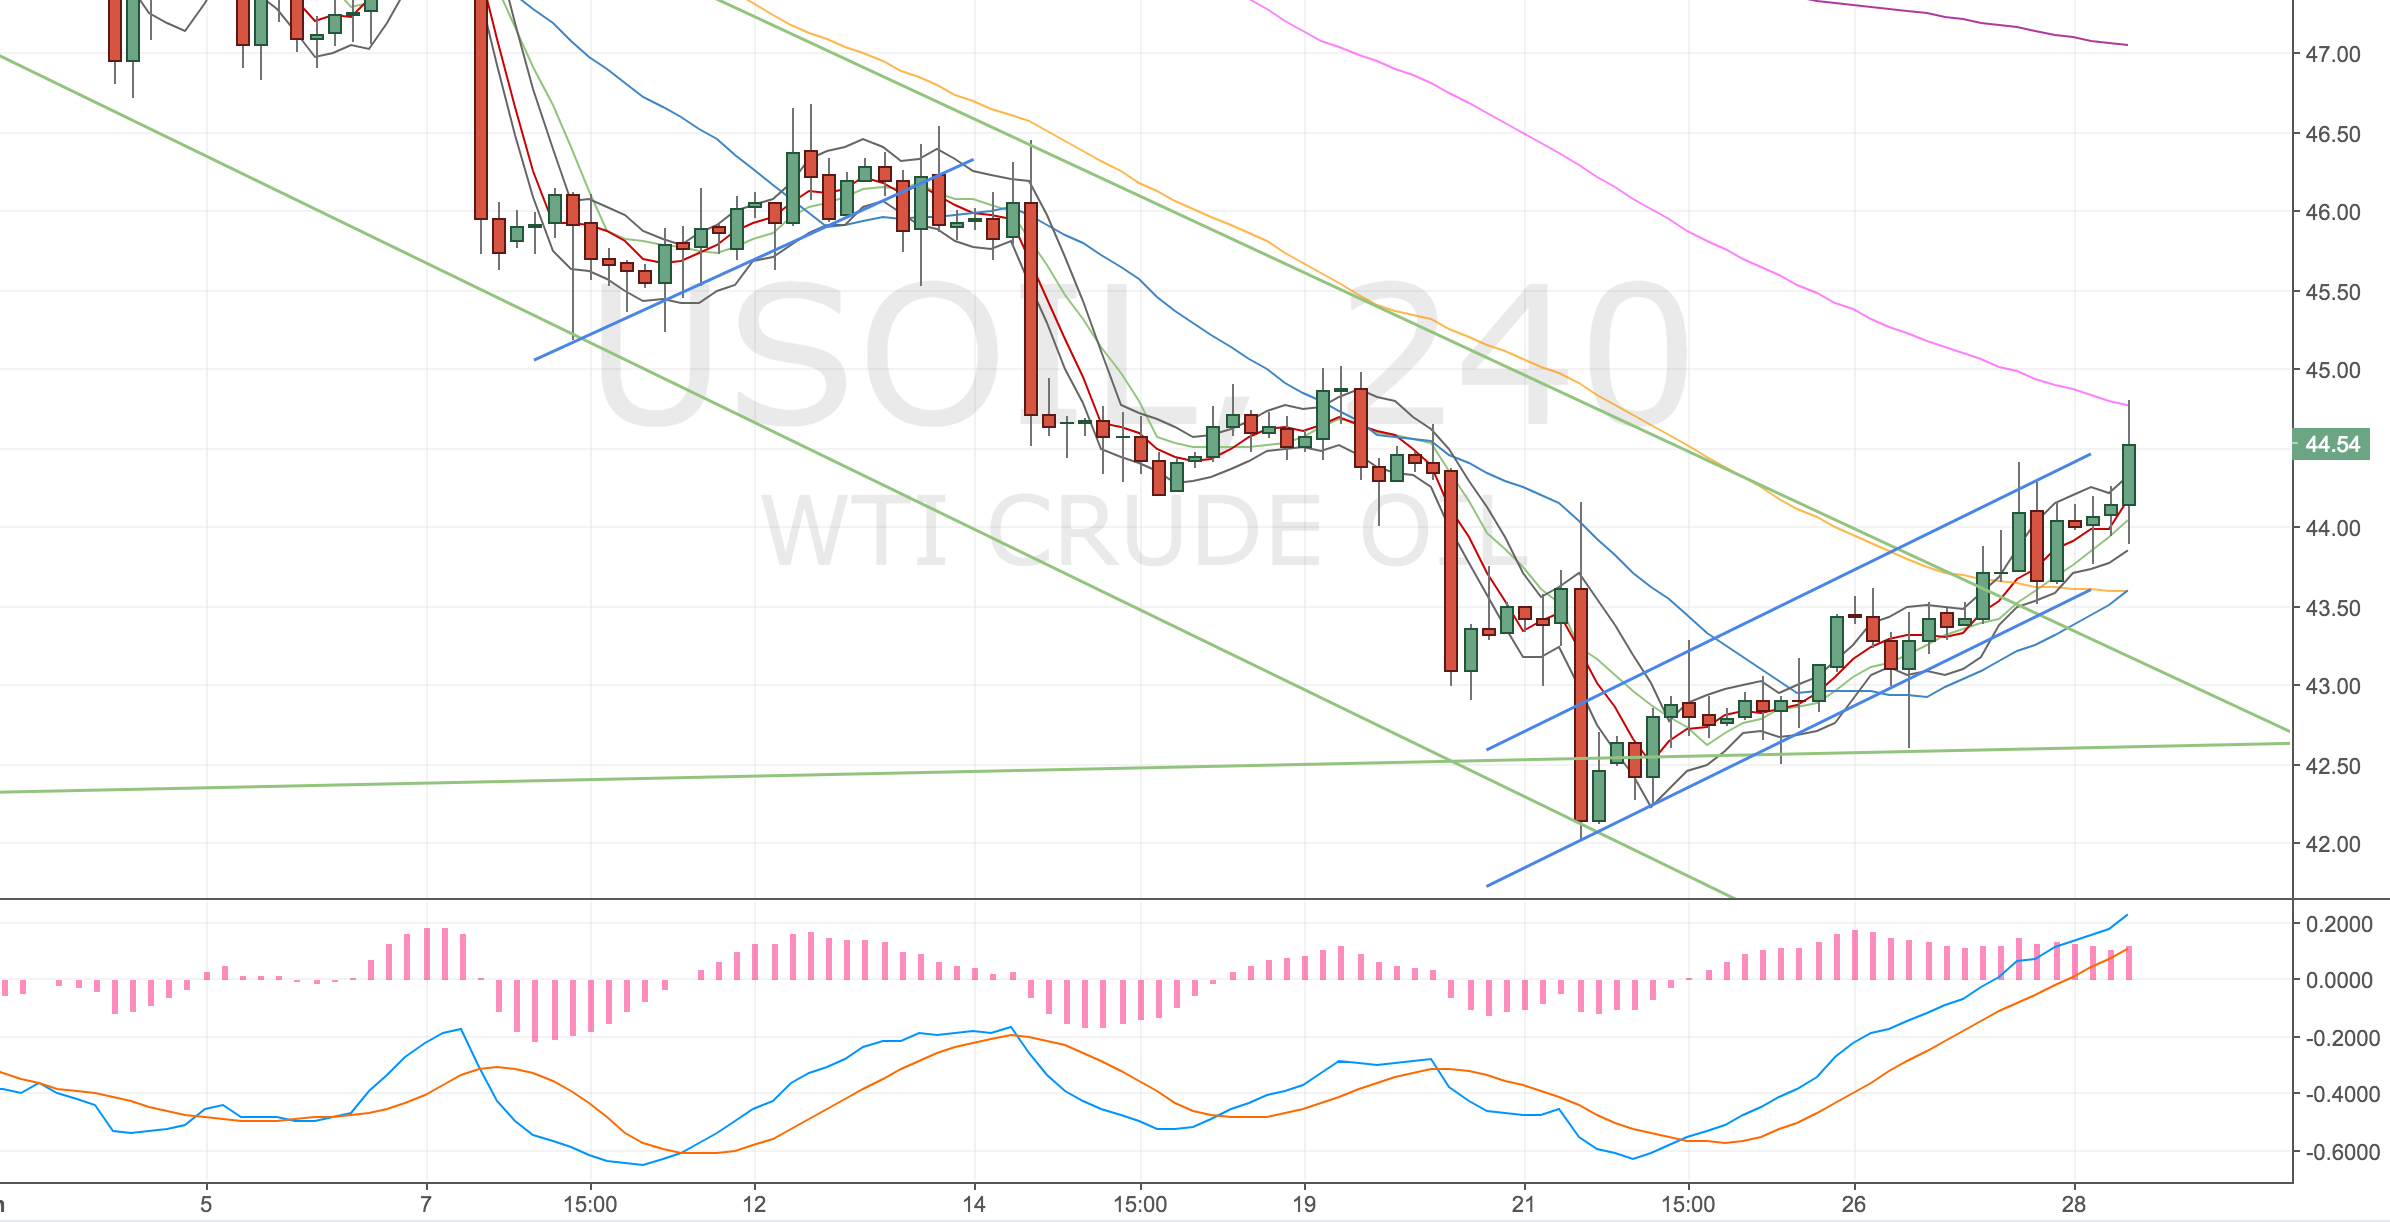
Oil 4H Chart – 28 June 17
Very mixed feelings about this, glad to have hit target and have booked some profits (in fact I feel quite relieved about it – felt like it was dragging on and Oil is pretty spikey) but at the same time I can see more upside! At least to 45 (d500)!
Oil Daily Chart – 28 June 17
Pretty typical I guess – always wanting more – but not being patient enough to wait for it.