Acc Risk: 0.6%
Short: 50.57
Stop: 51.15 (58 pips)
Target: 48.26 (d50, 231 pips, 4x RR)
Mindset: A little nervous again, low volatility in a traditionally spikey market.
Update
Chose the wrong instrument to trade! Trade closed scratch – 21 Sep
Found another entry – 26 Sep
Stopped out – 28 Sep
Some time later – 06 Oct
There’s an interesting pattern in Oil that I quite like a divergence forming on a couple of timeframes. So taken a small short. Here’s the low down.
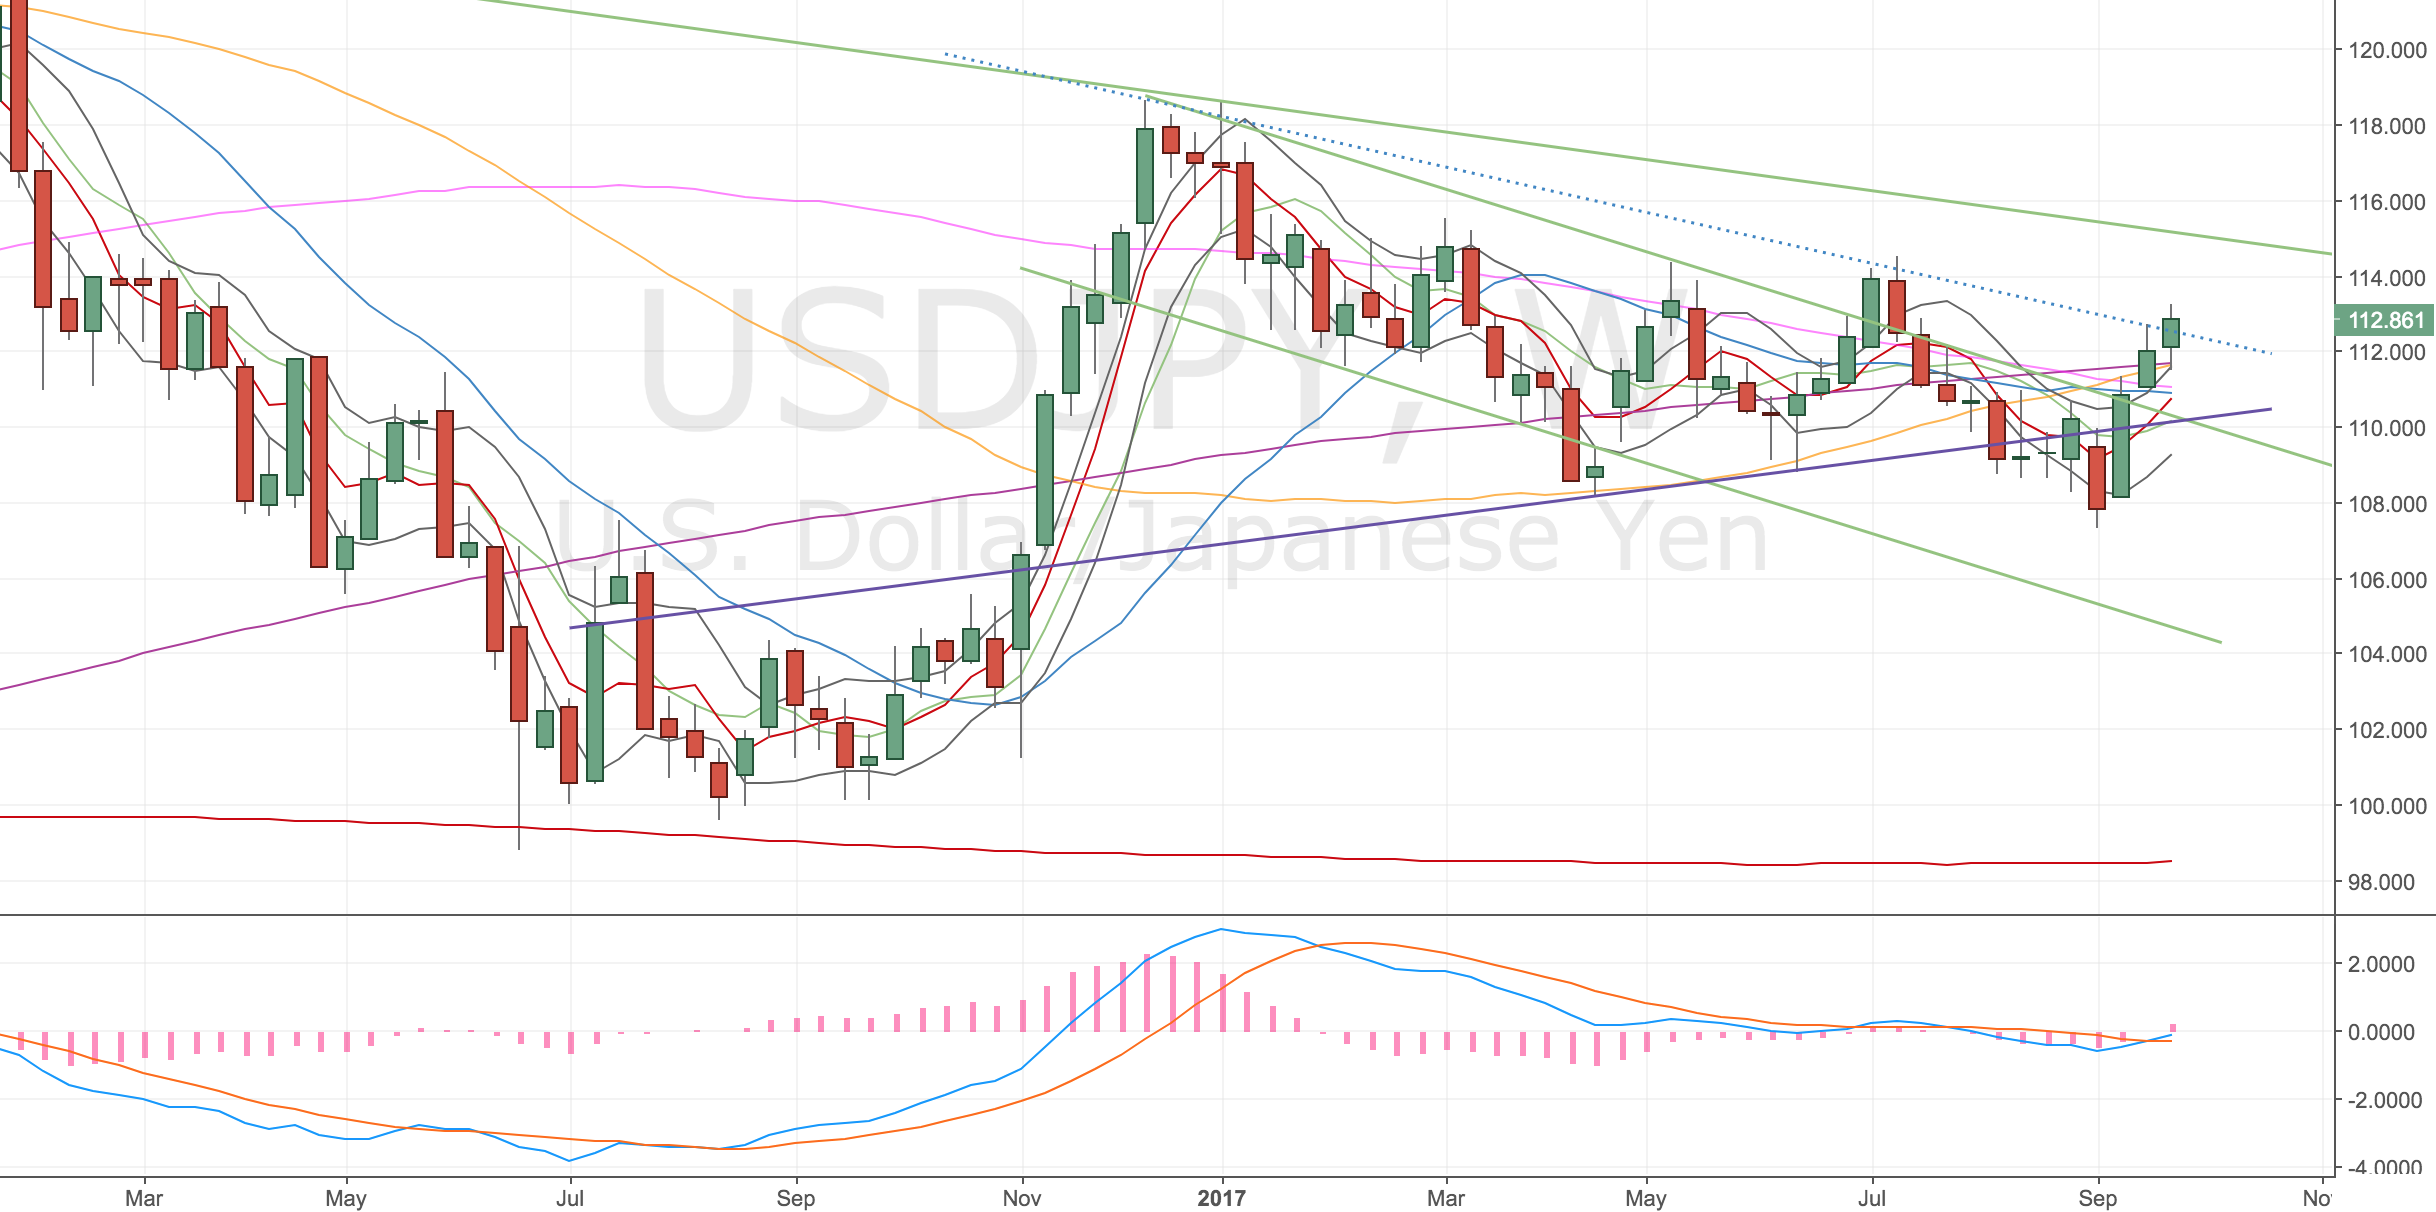
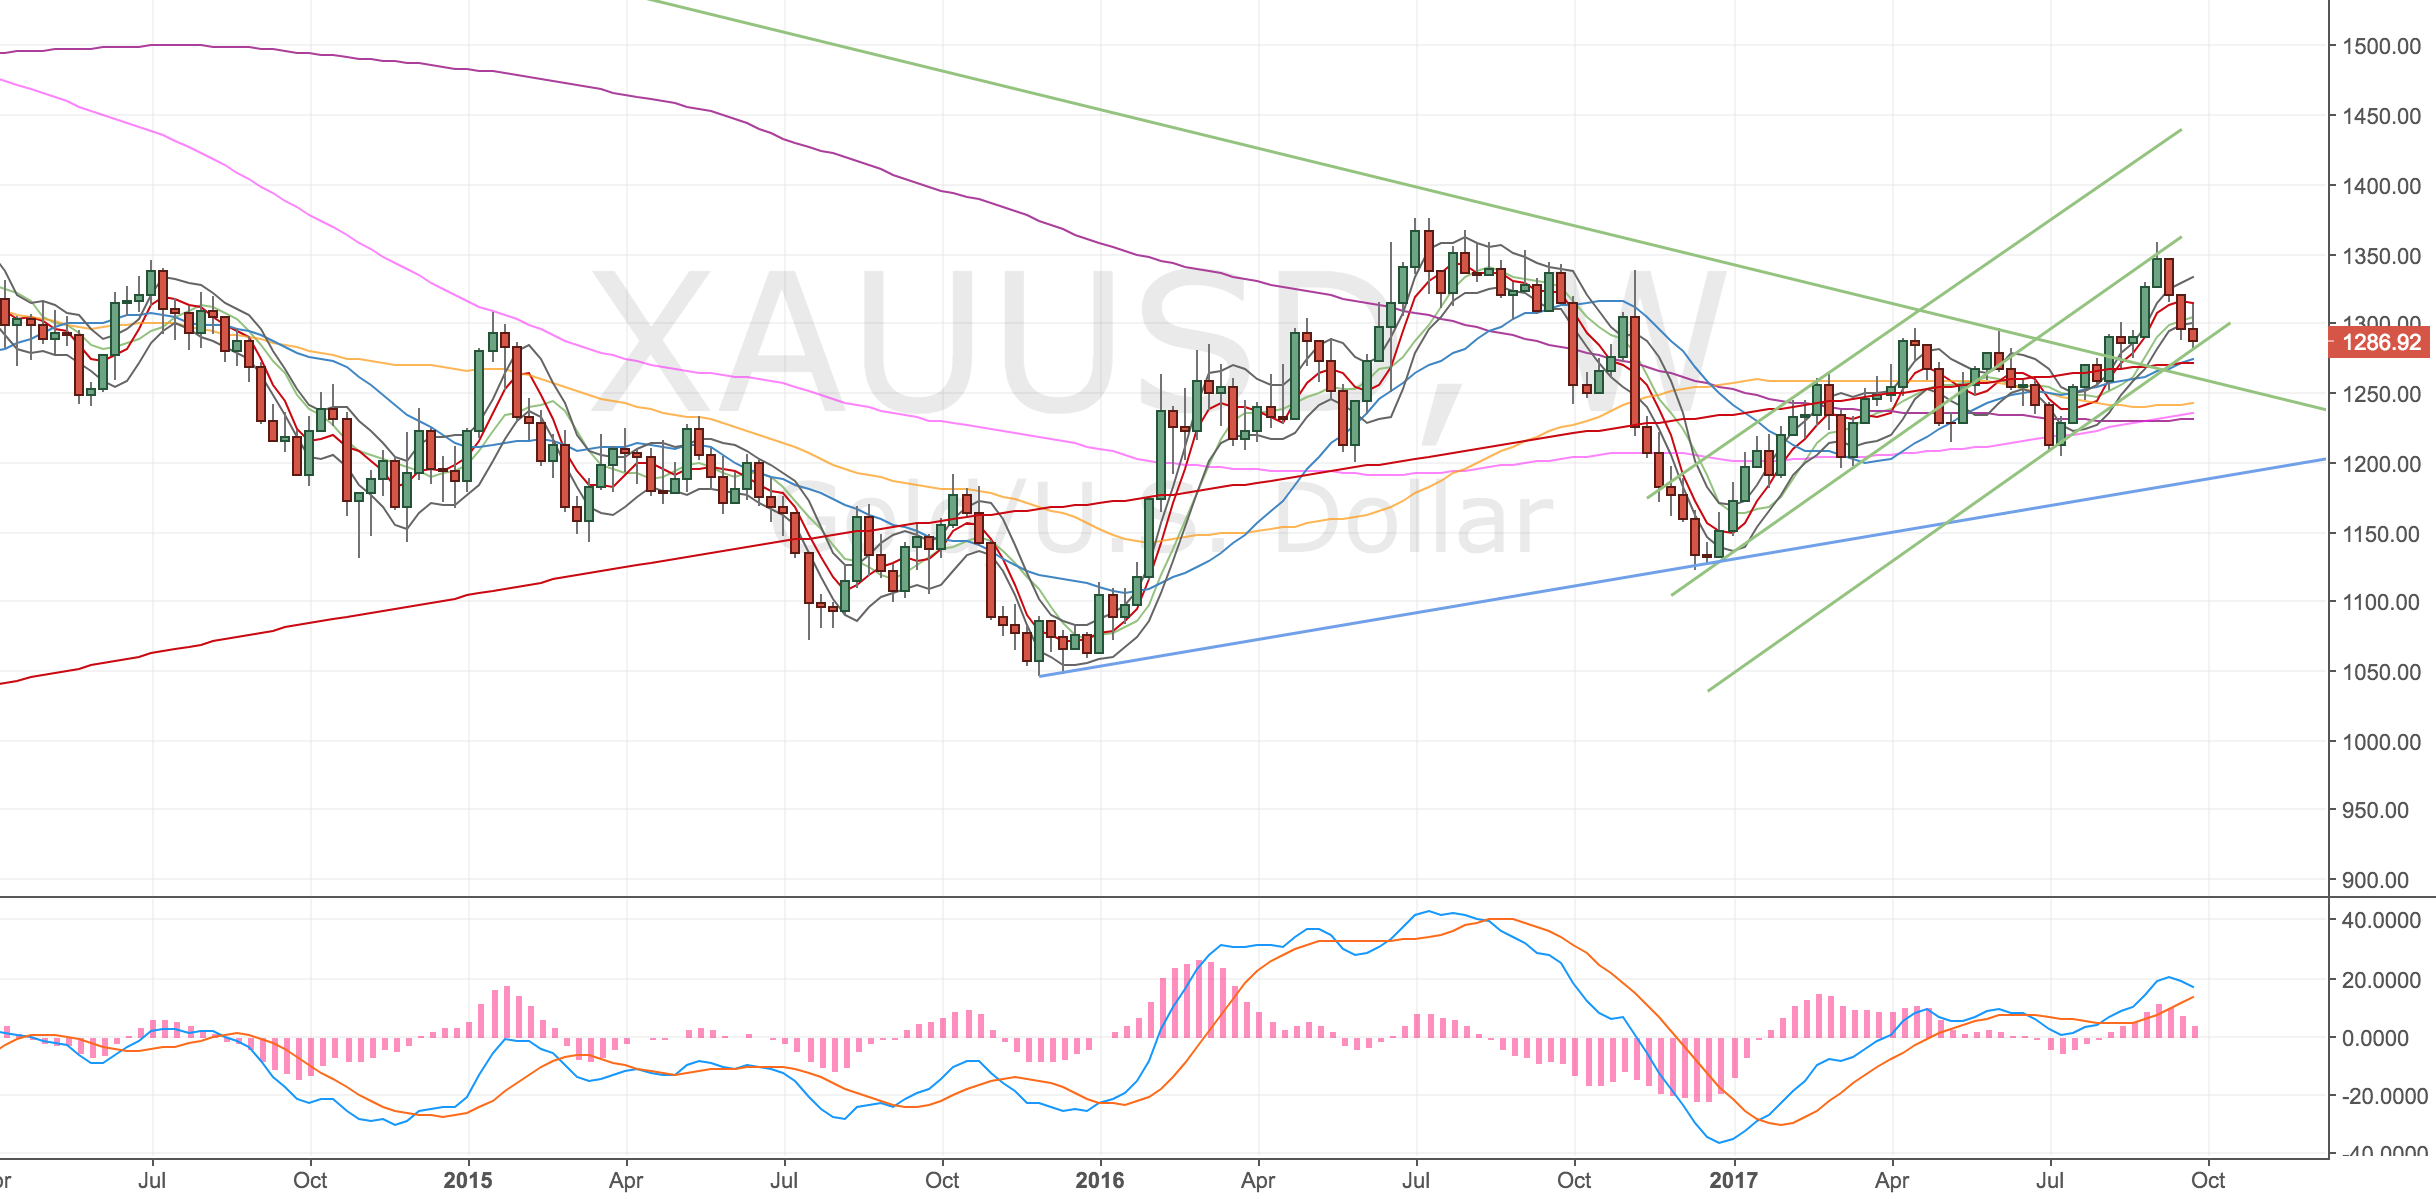
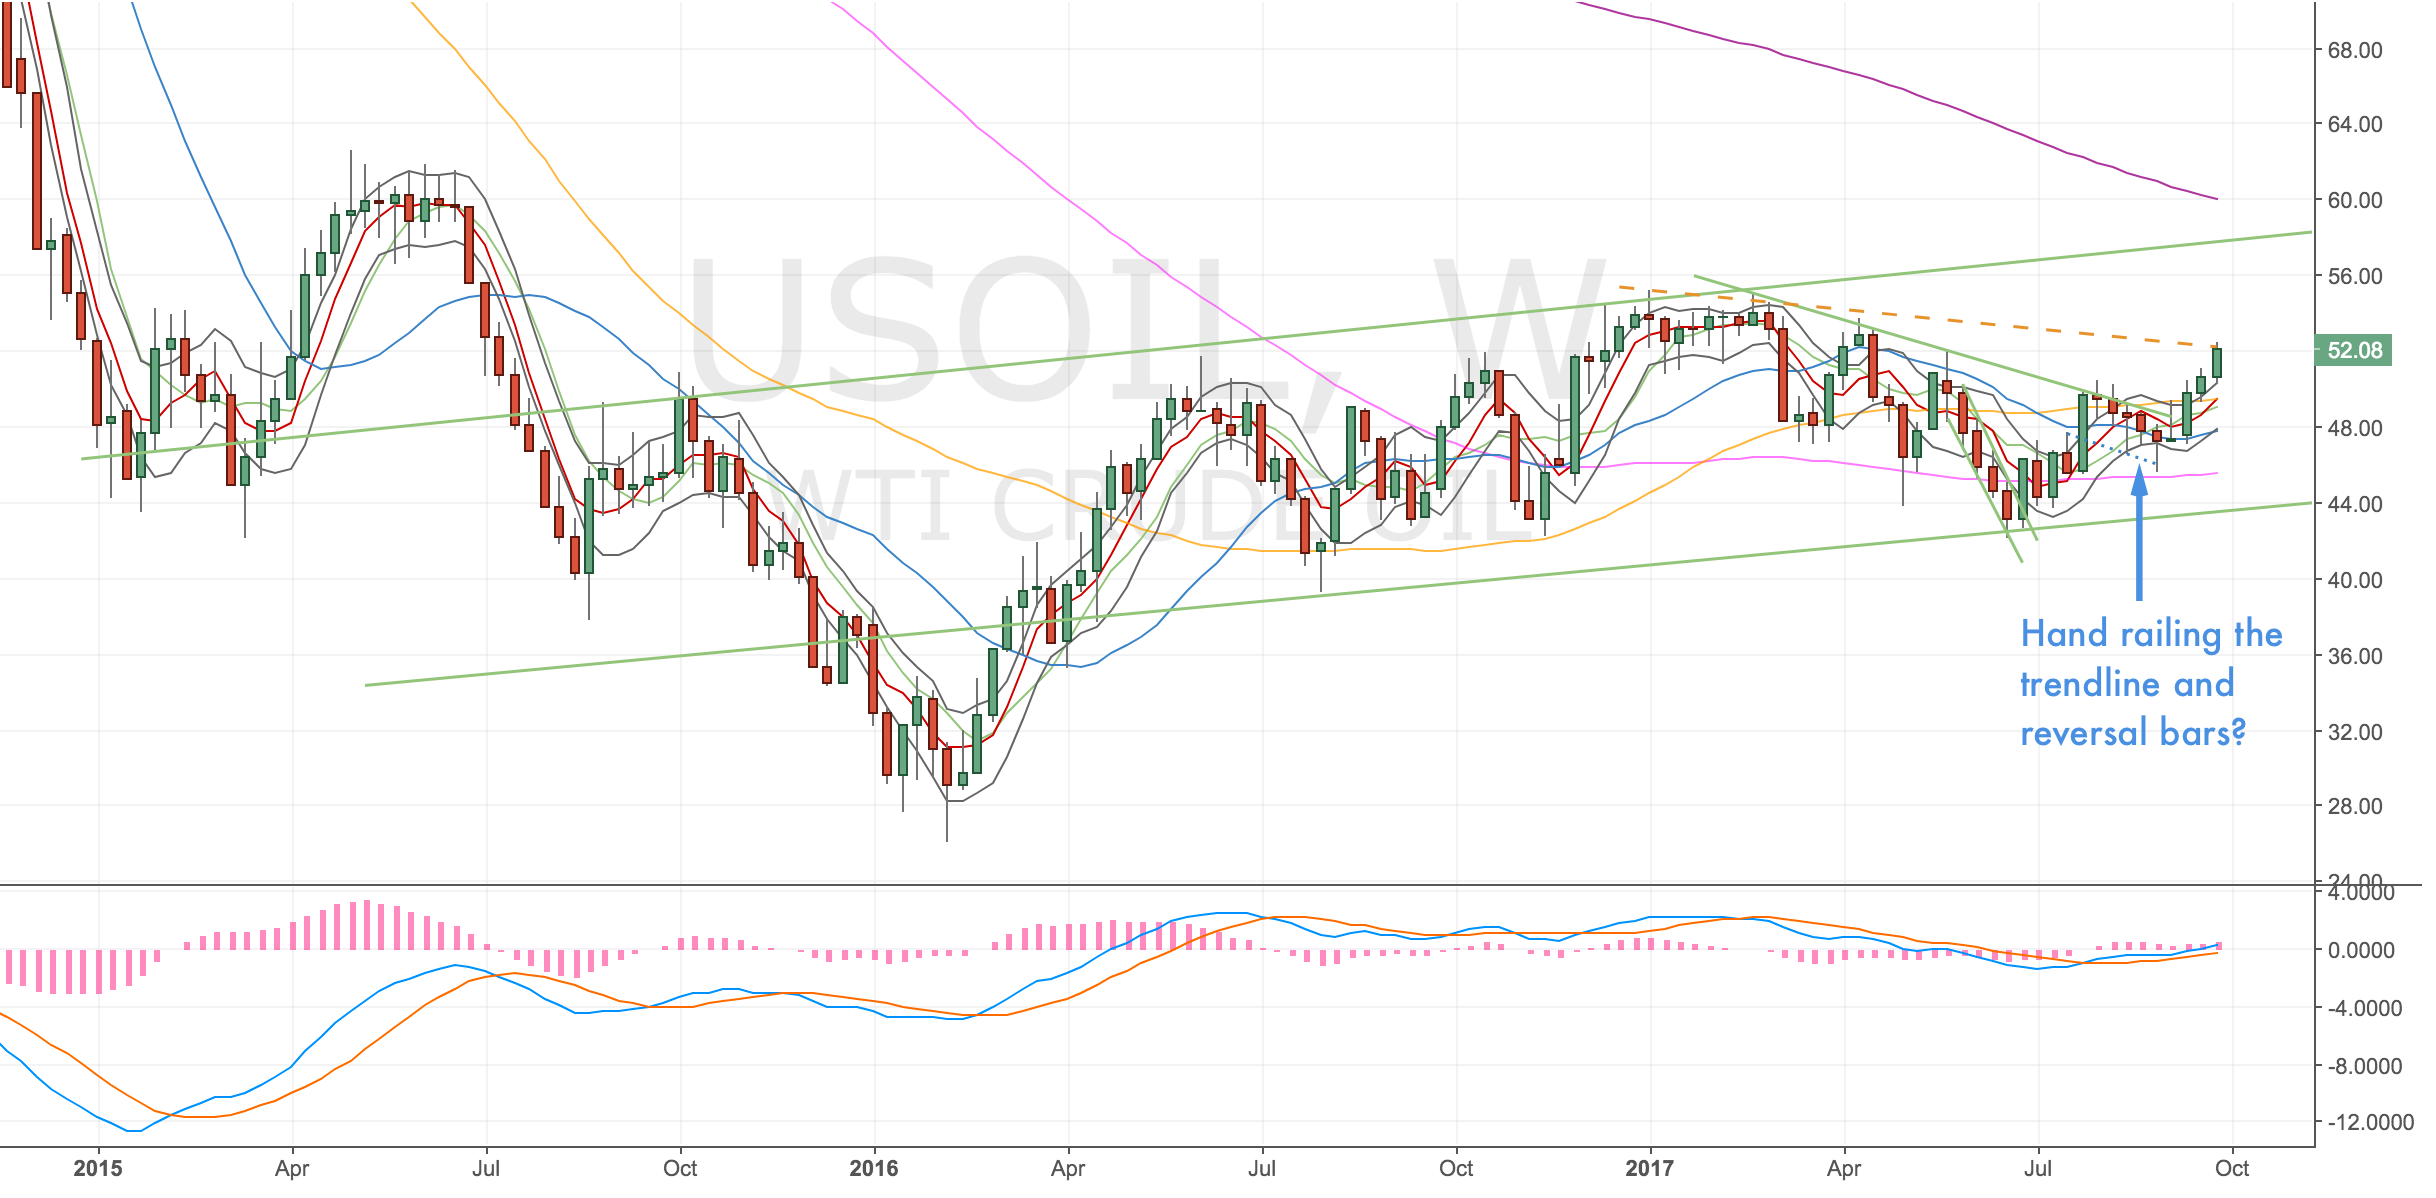
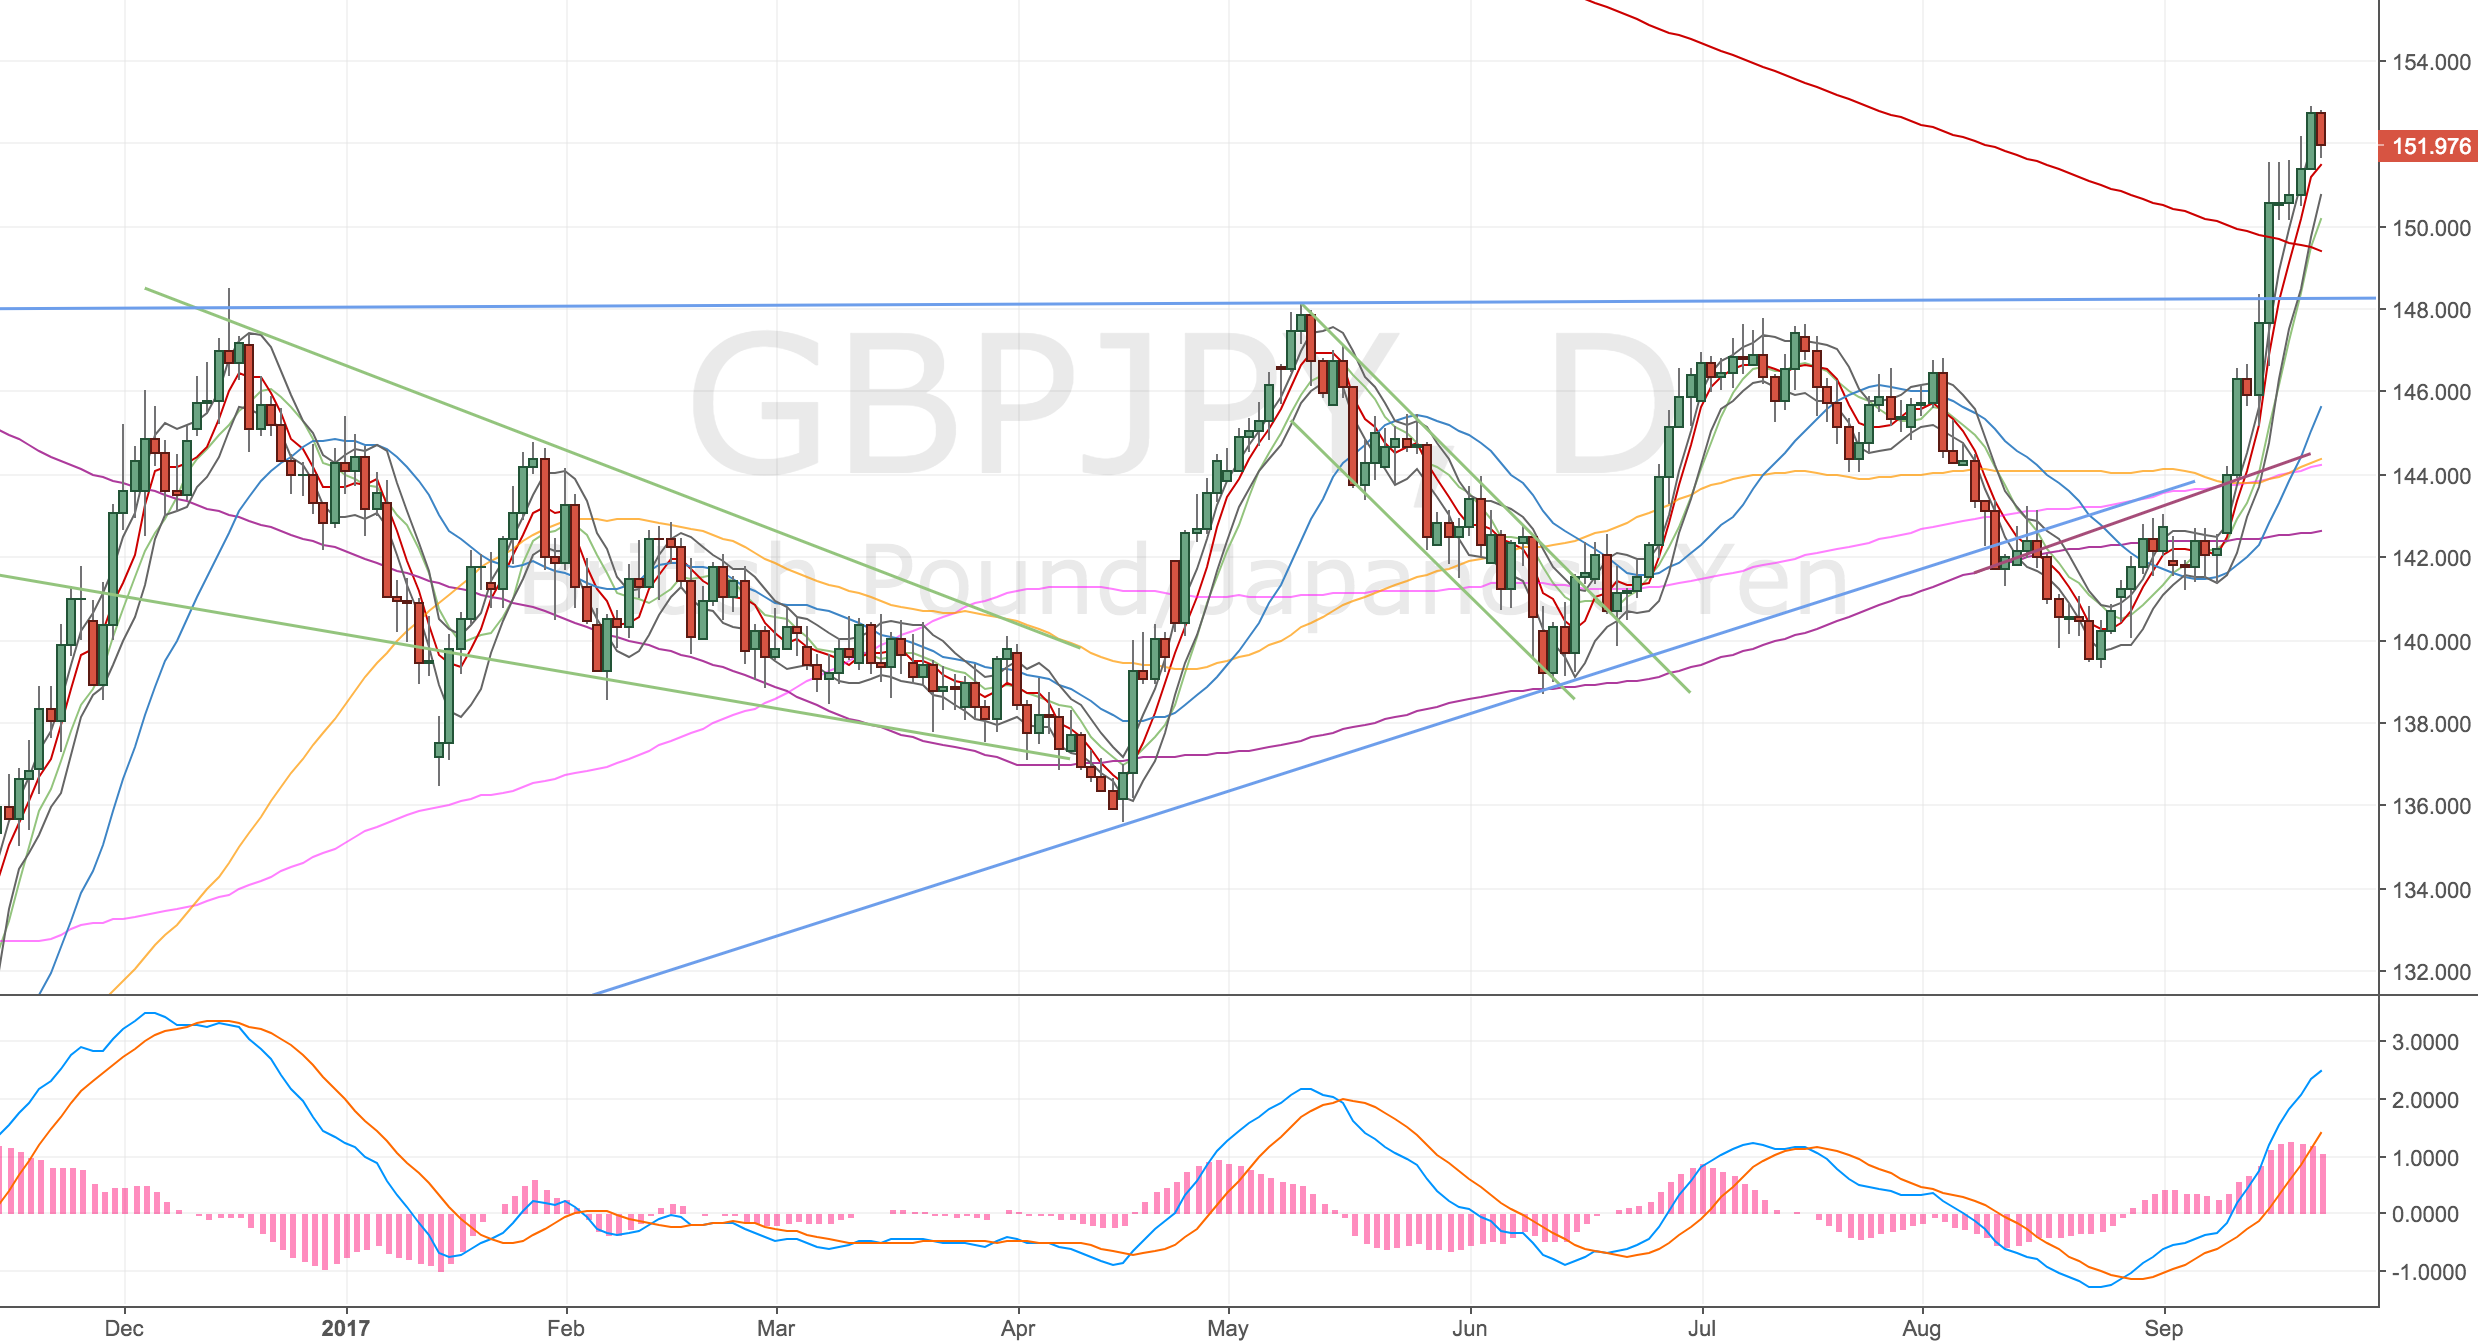
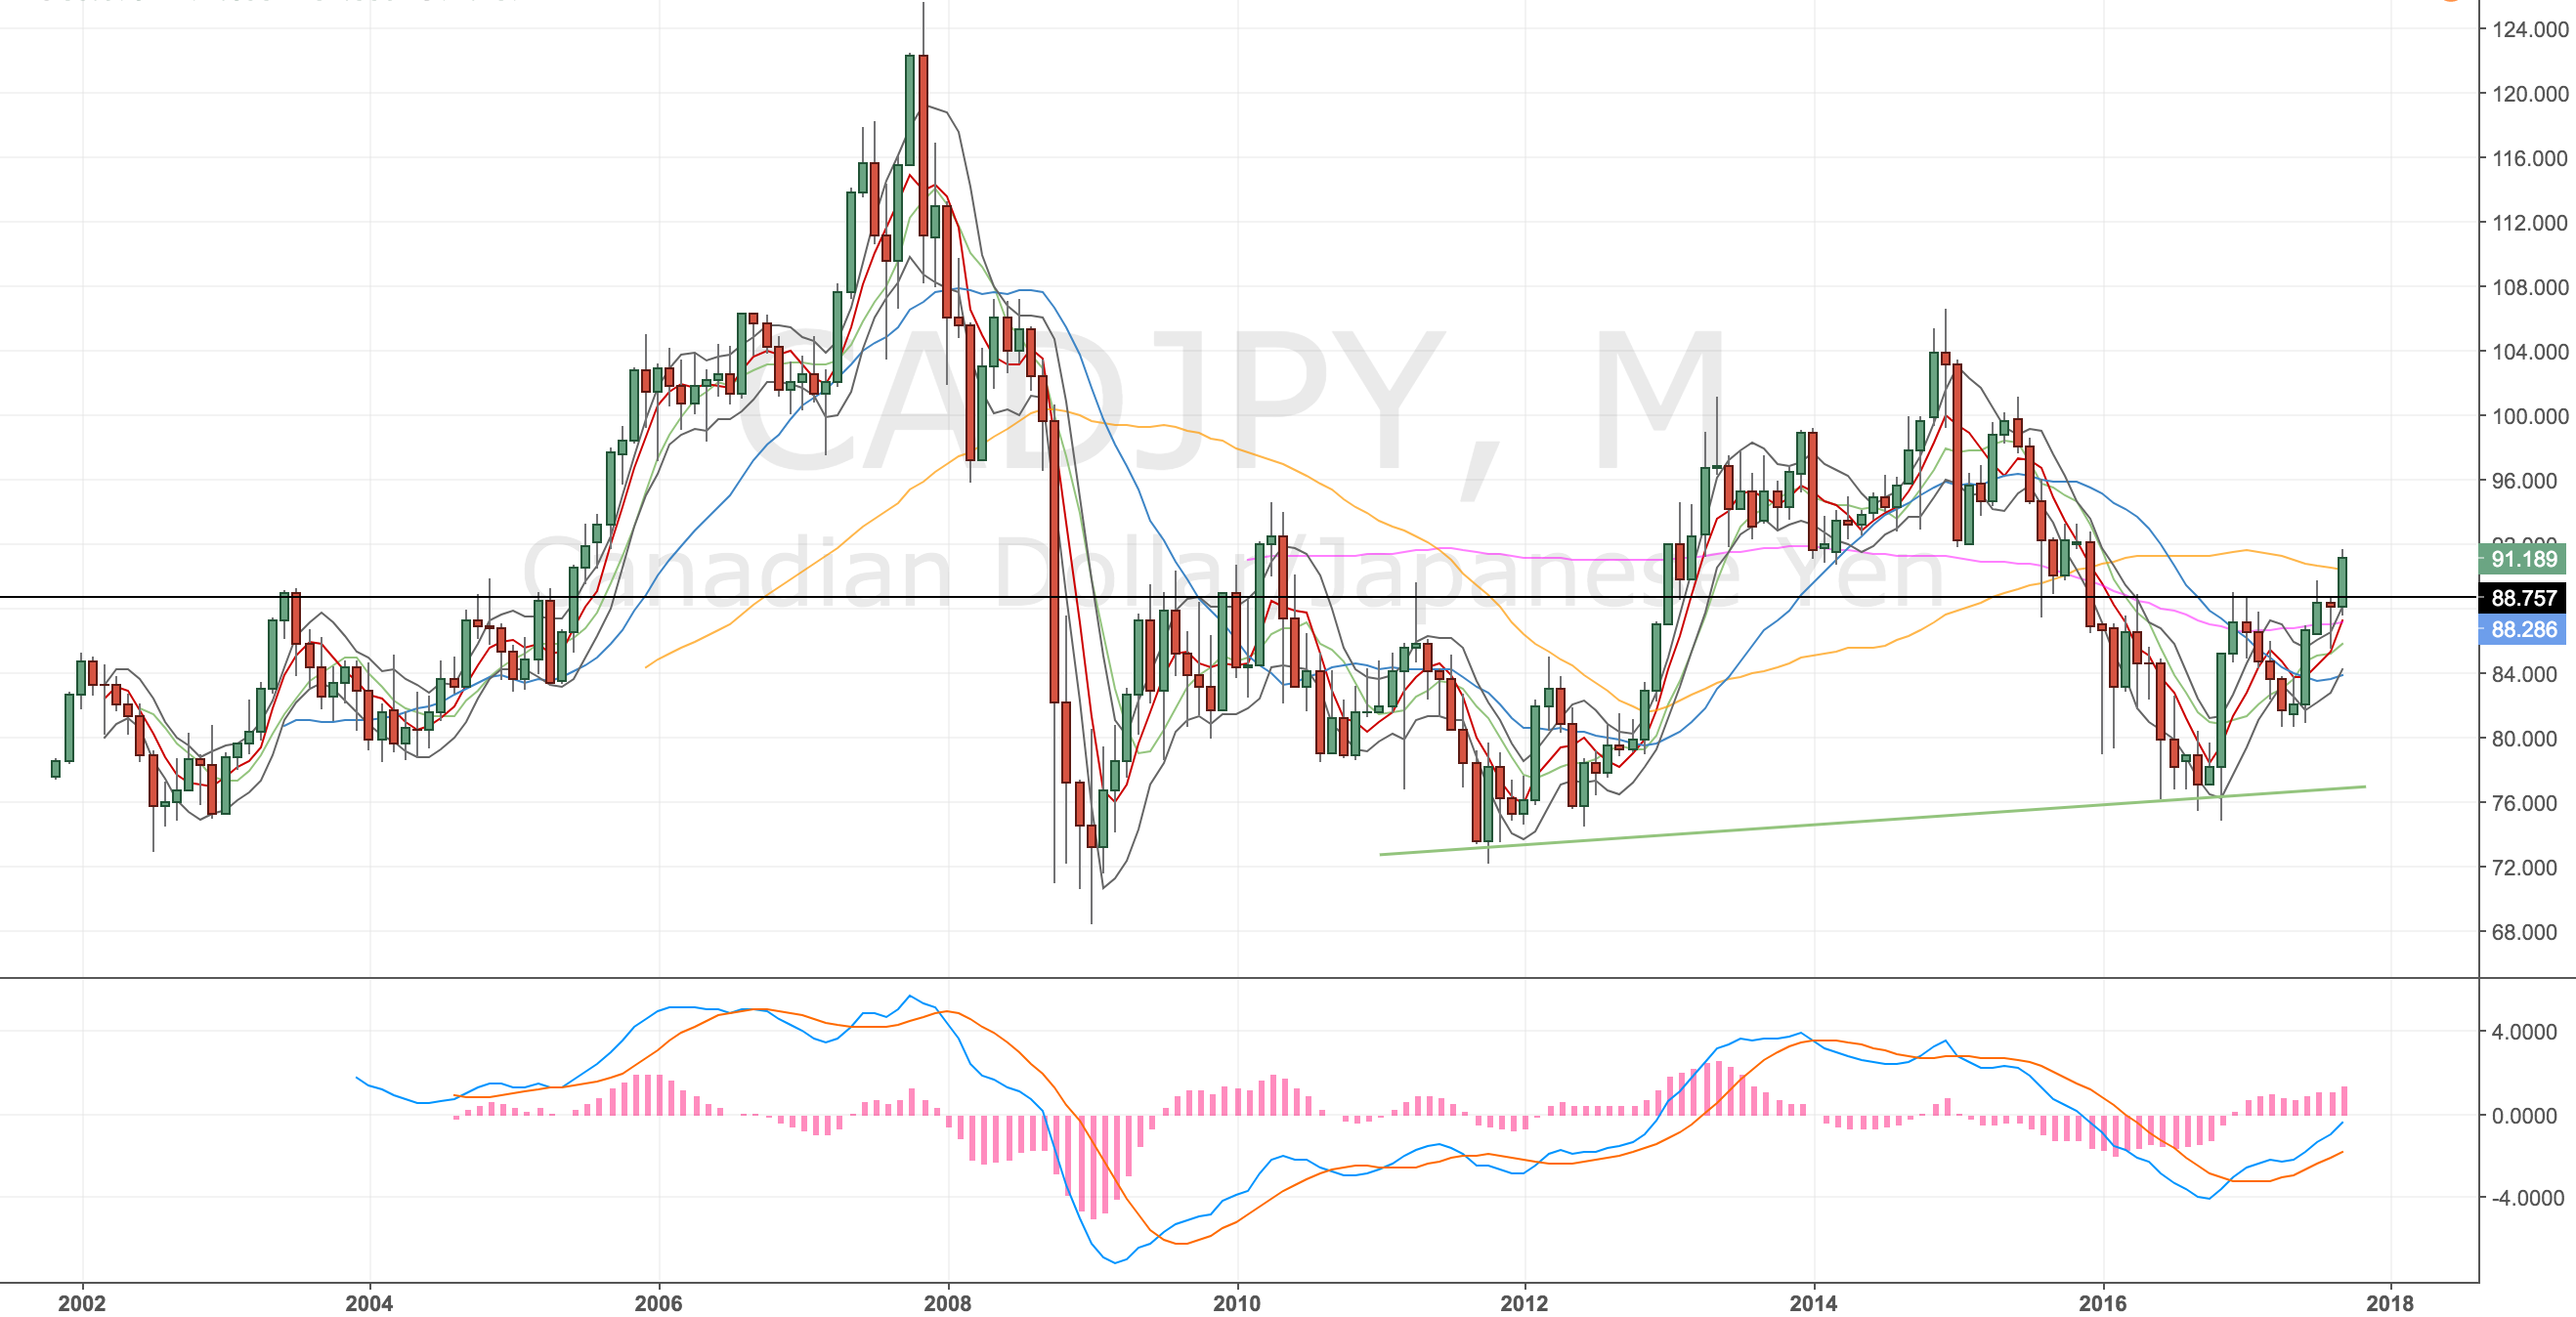
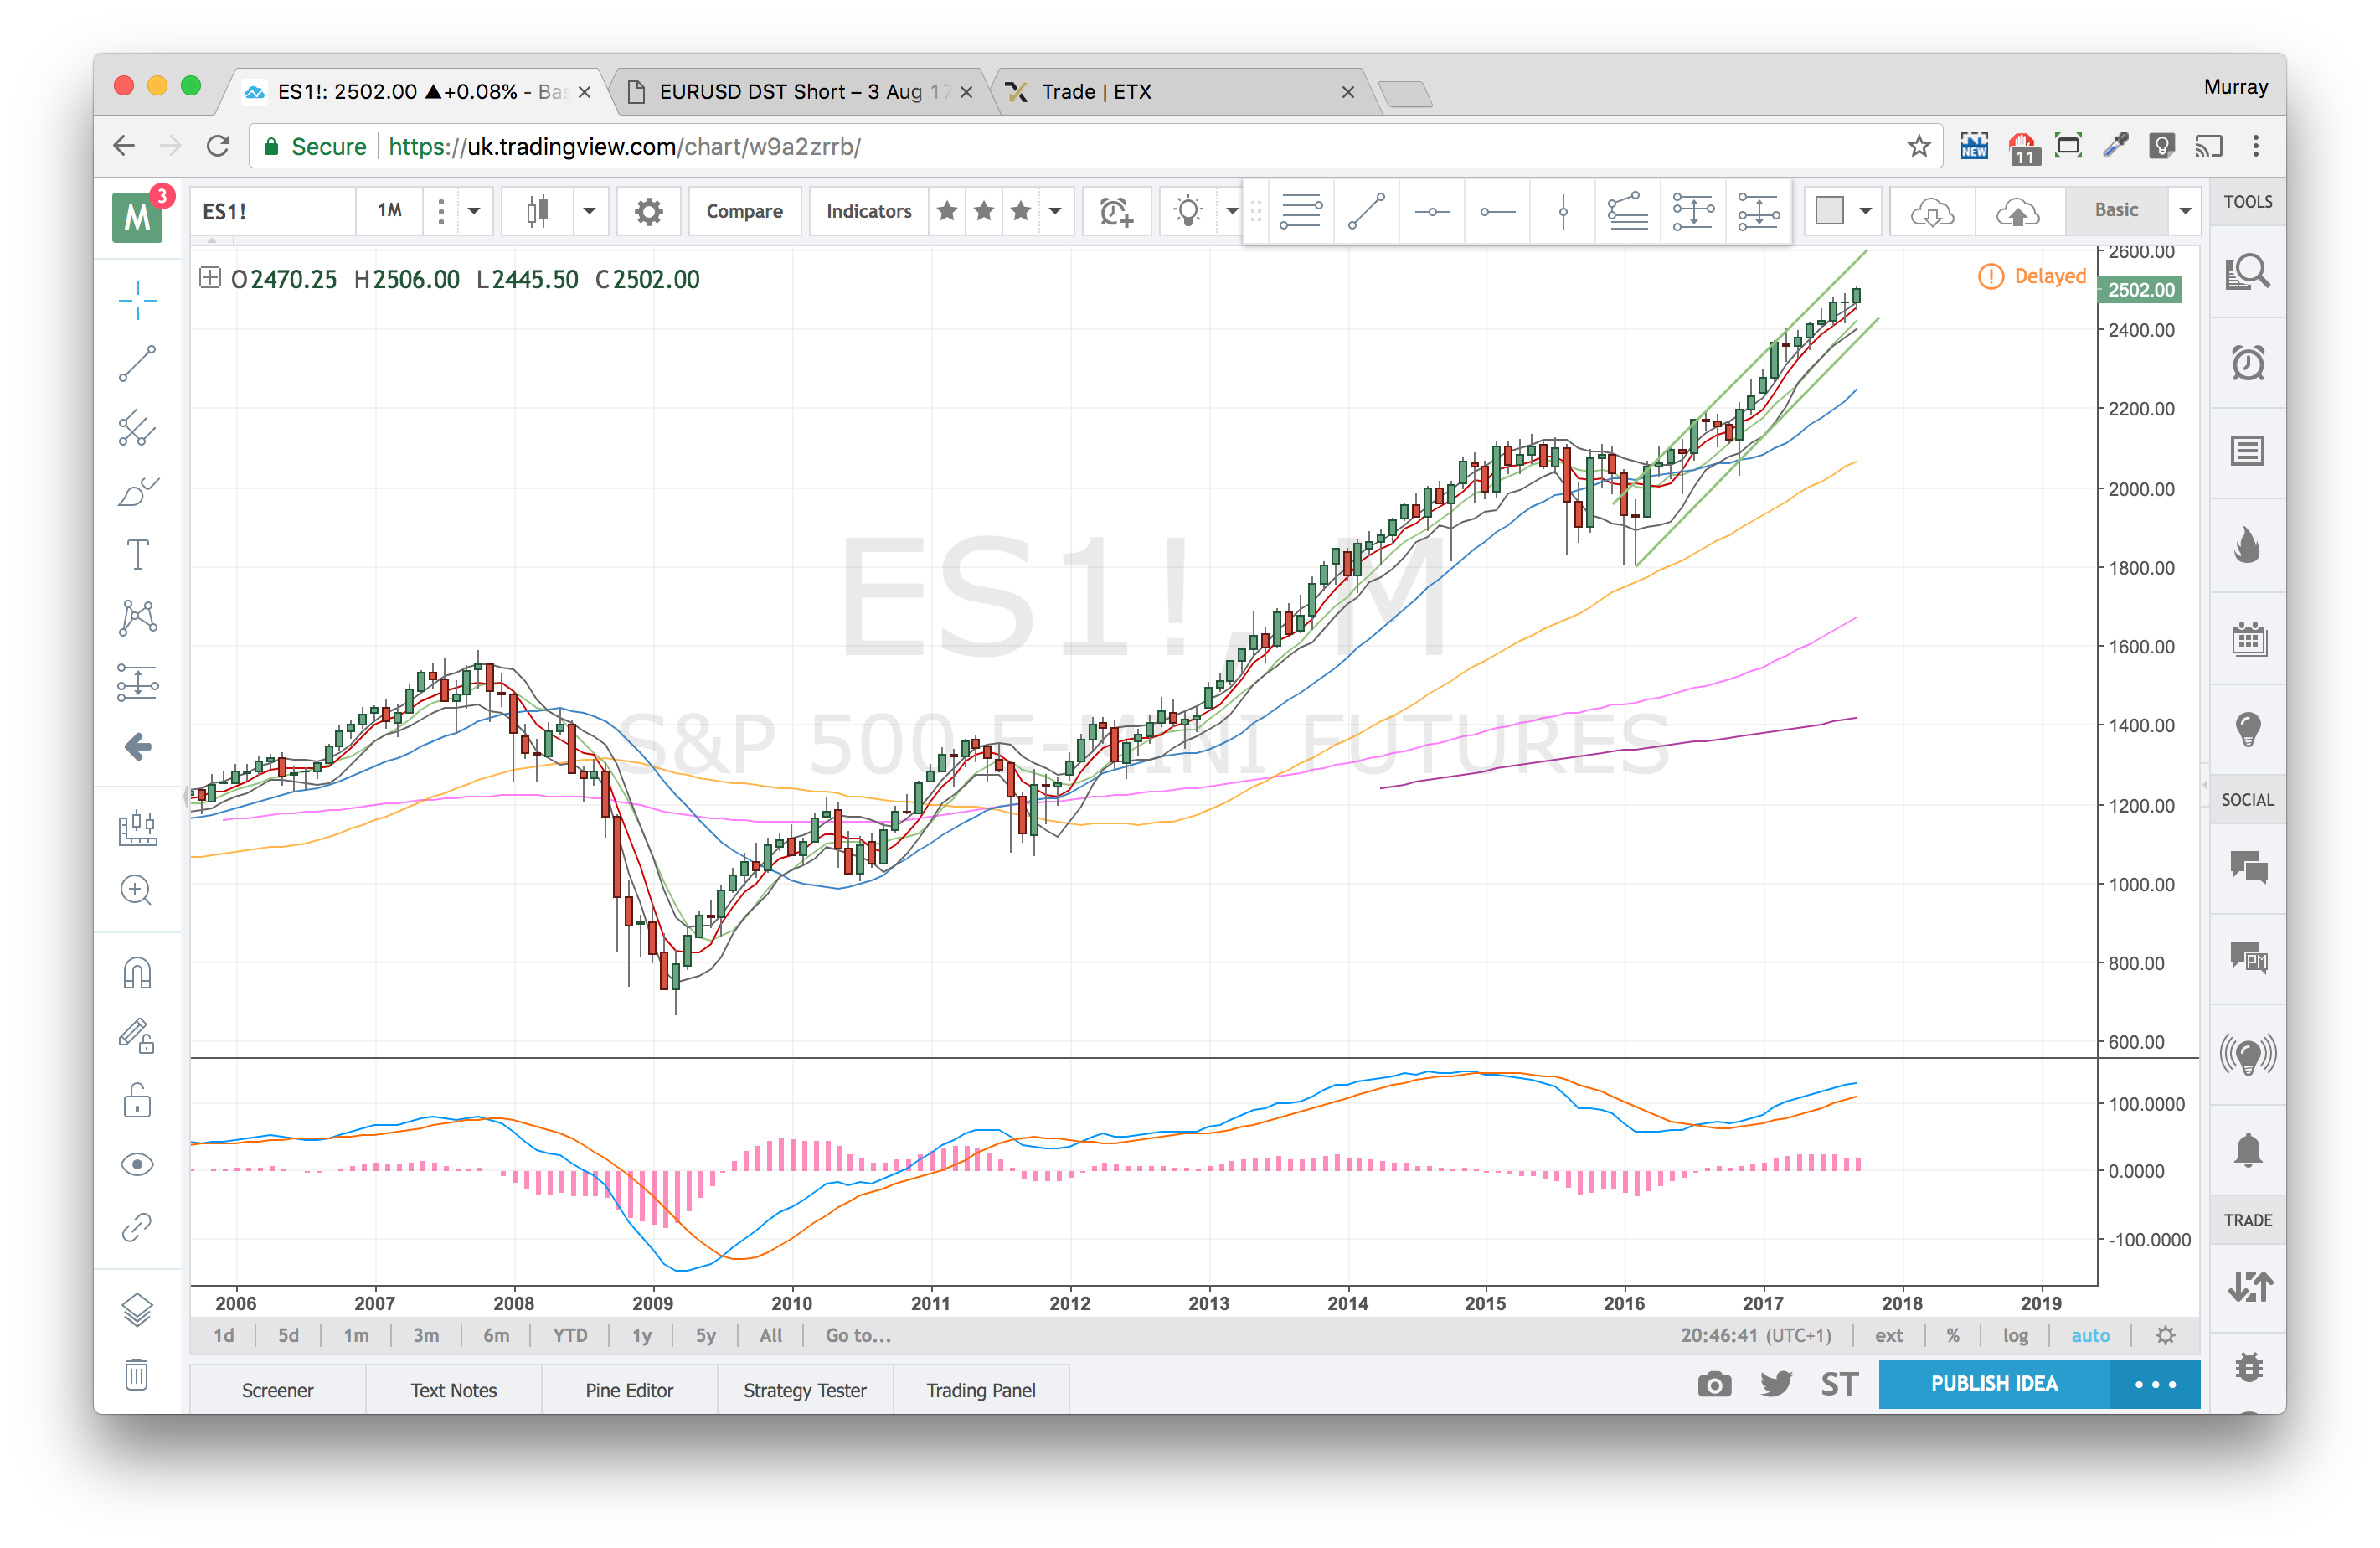
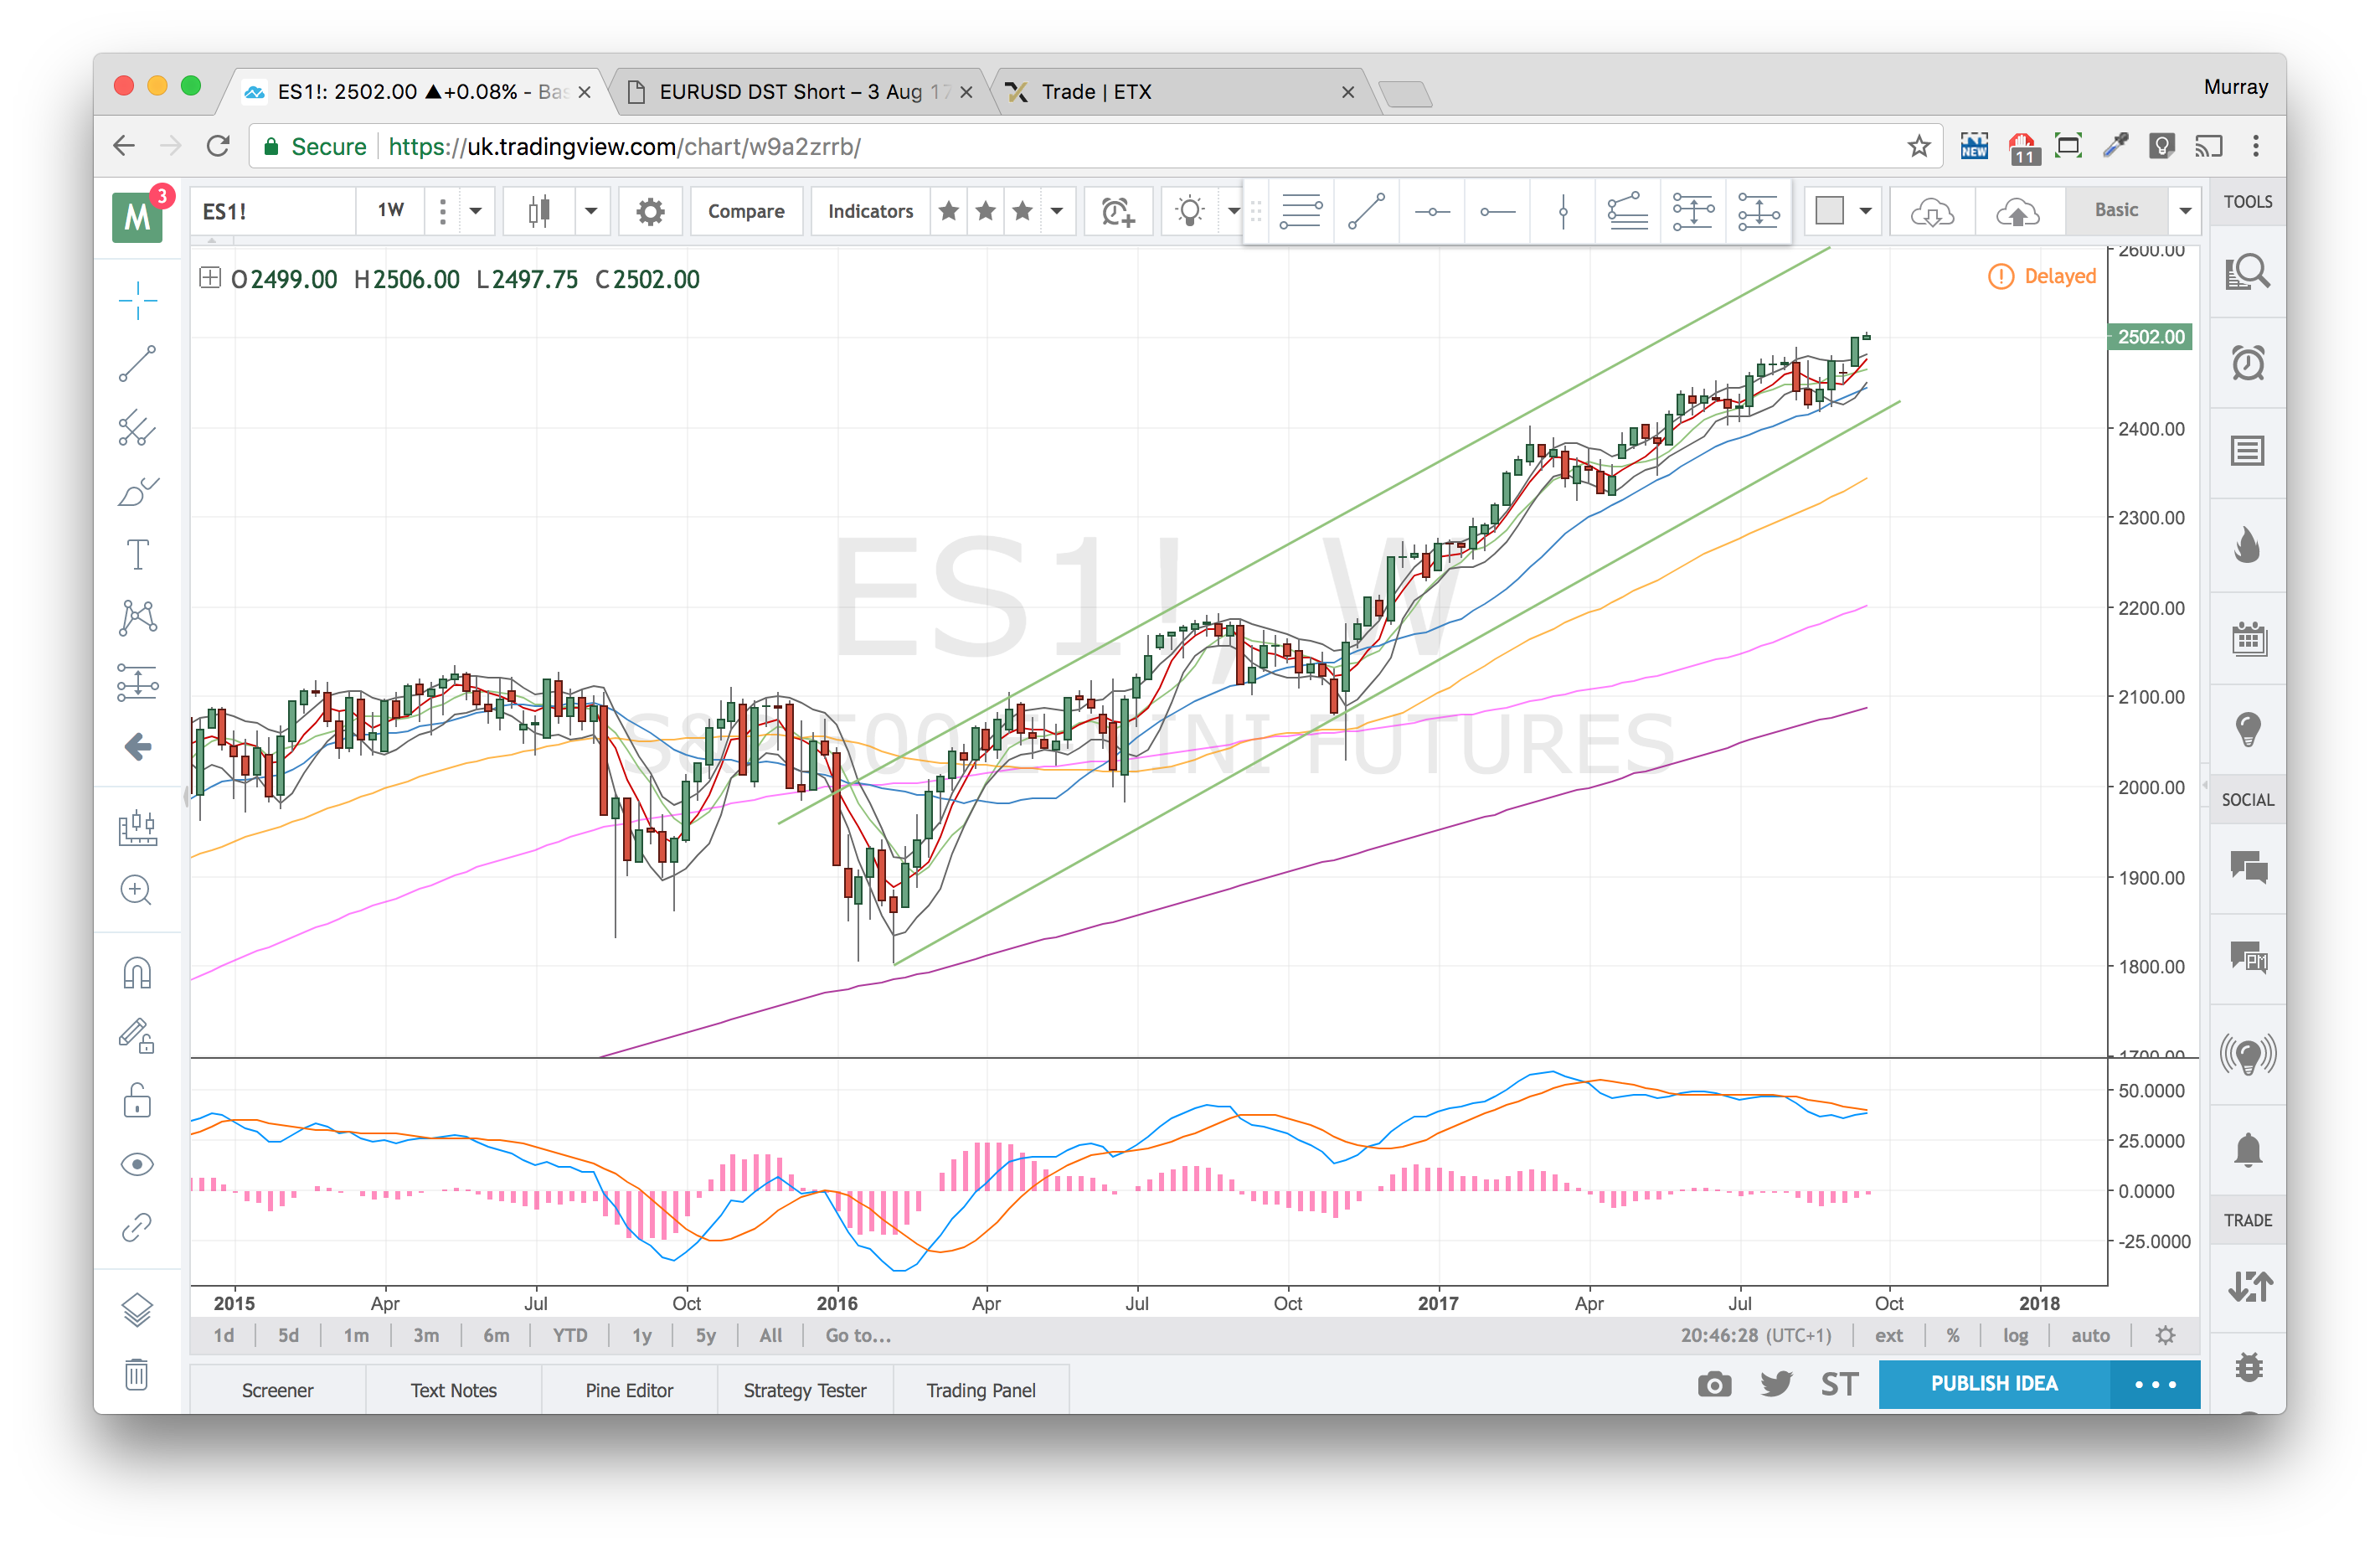
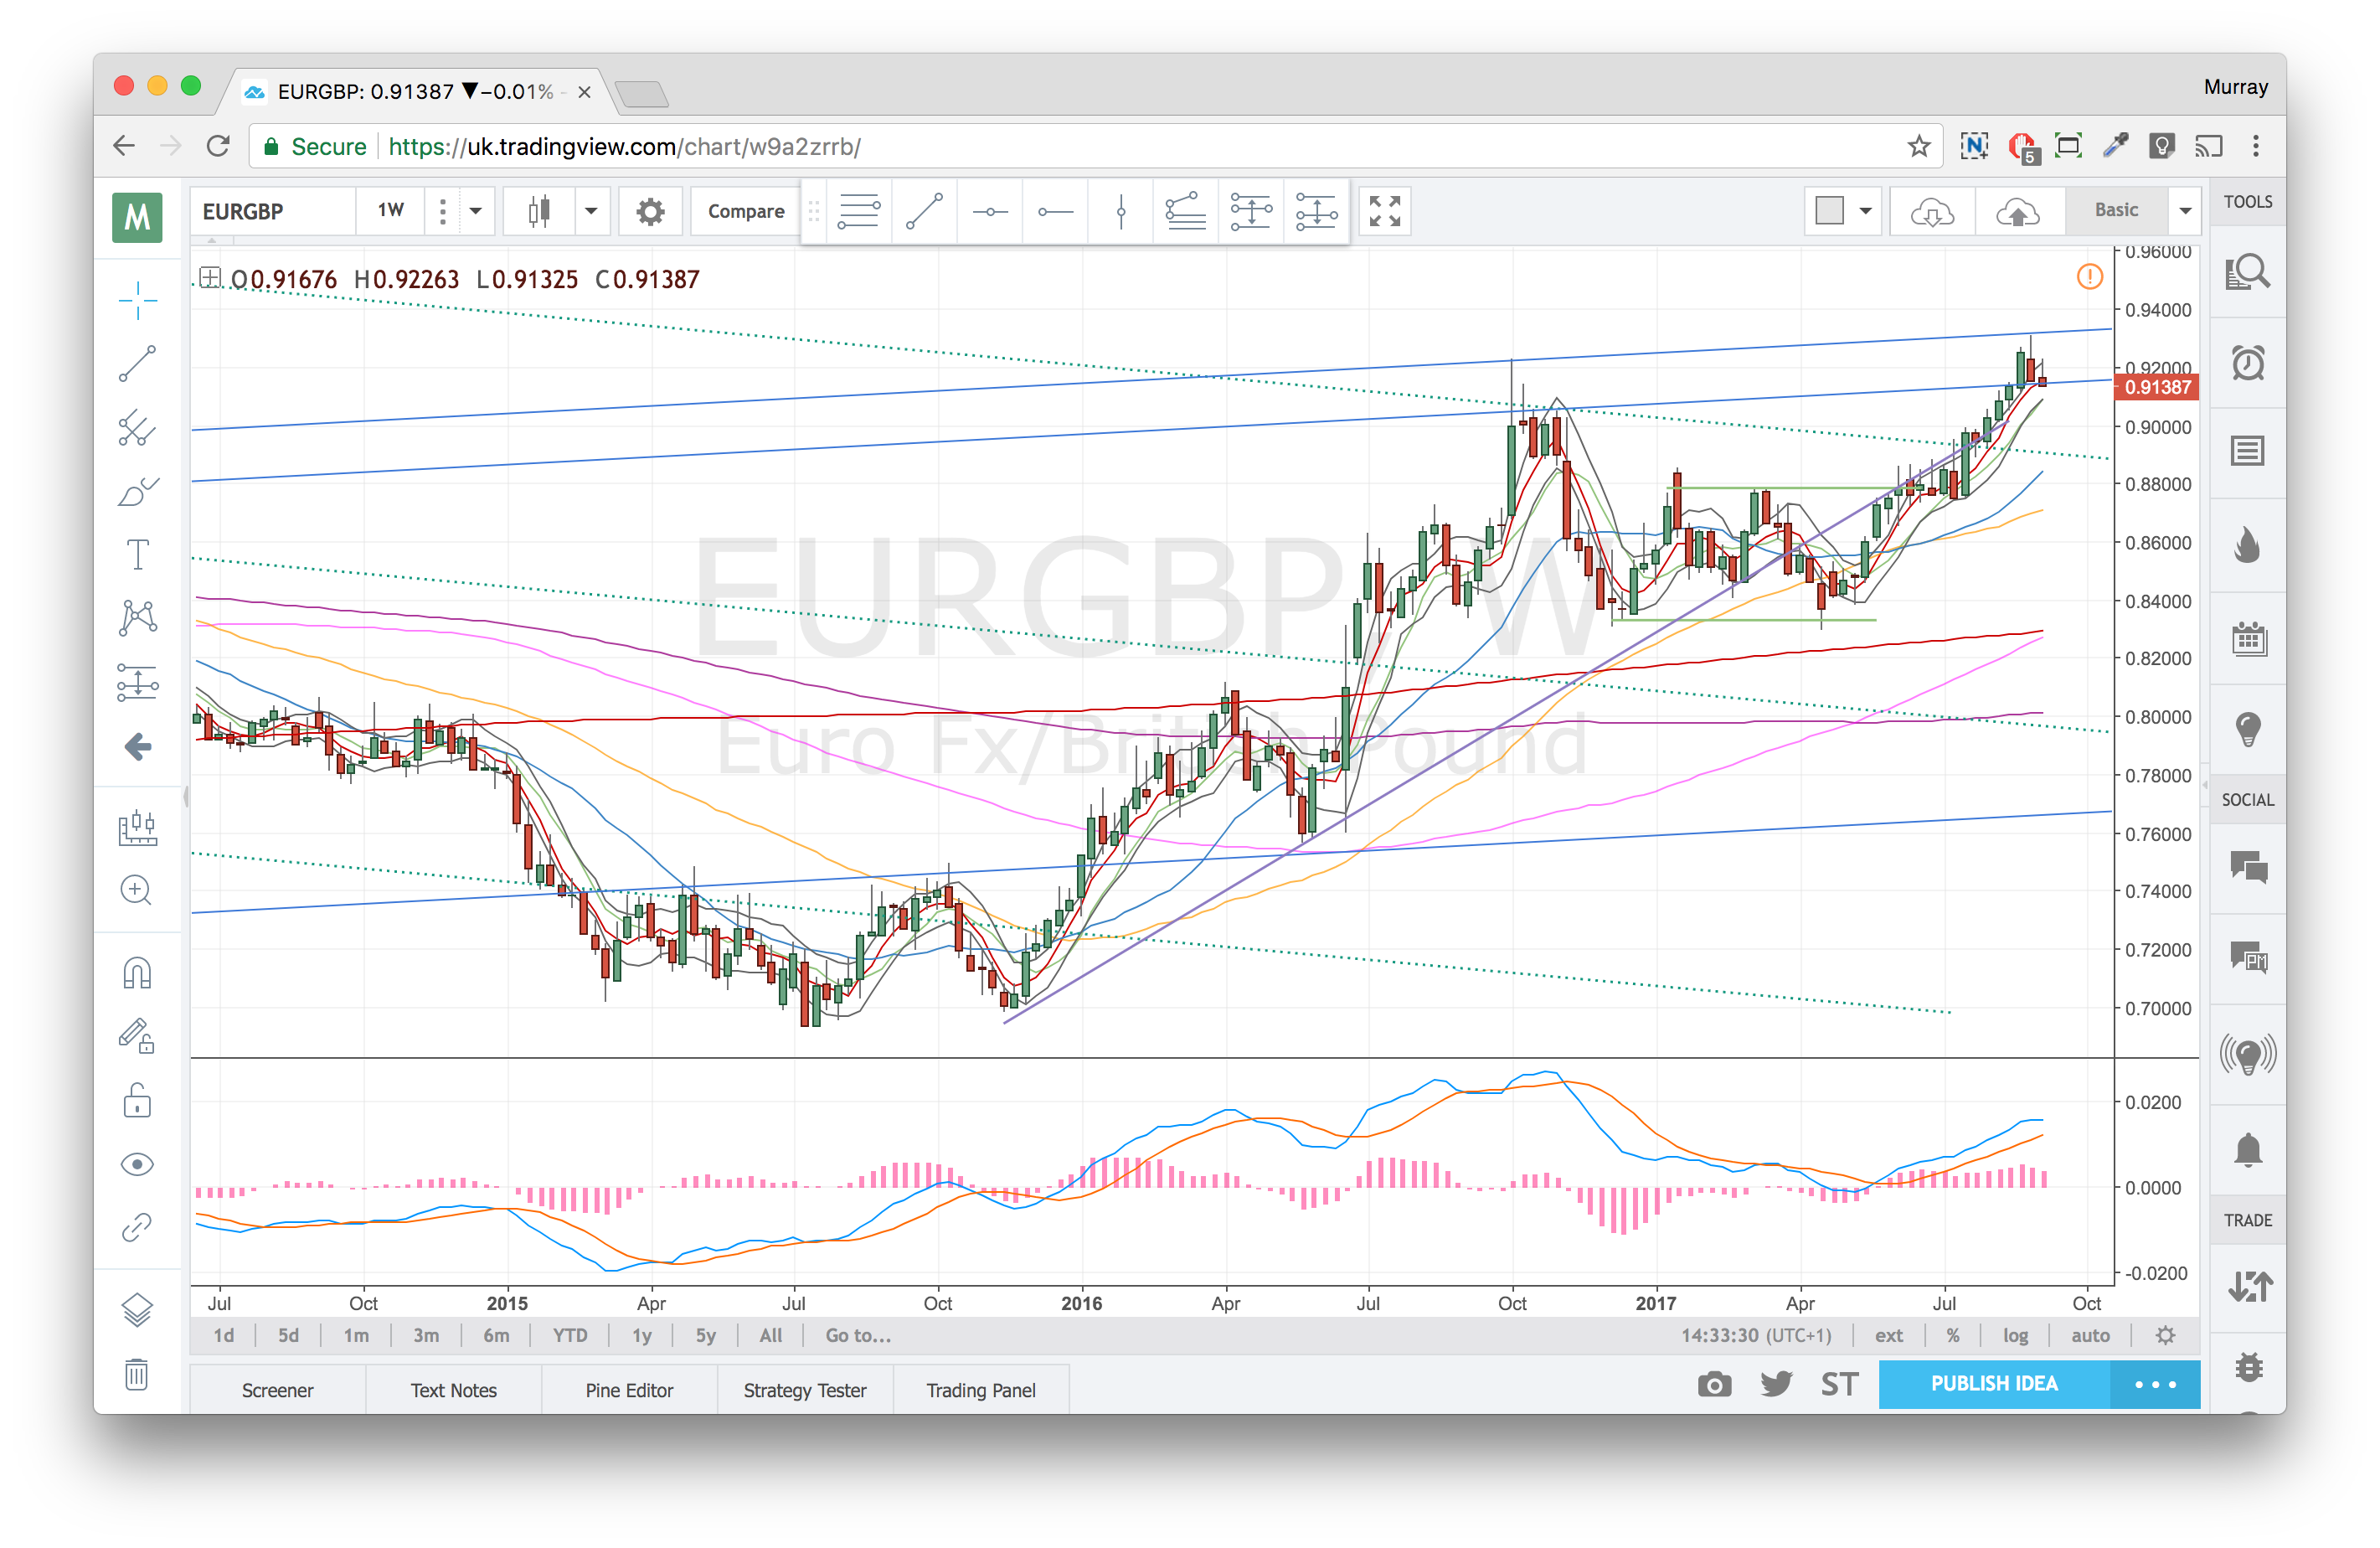
Weekly Chart
Crossed the w50 and previously air-kissed the w100. Can see a pullback to retest my green trendline.
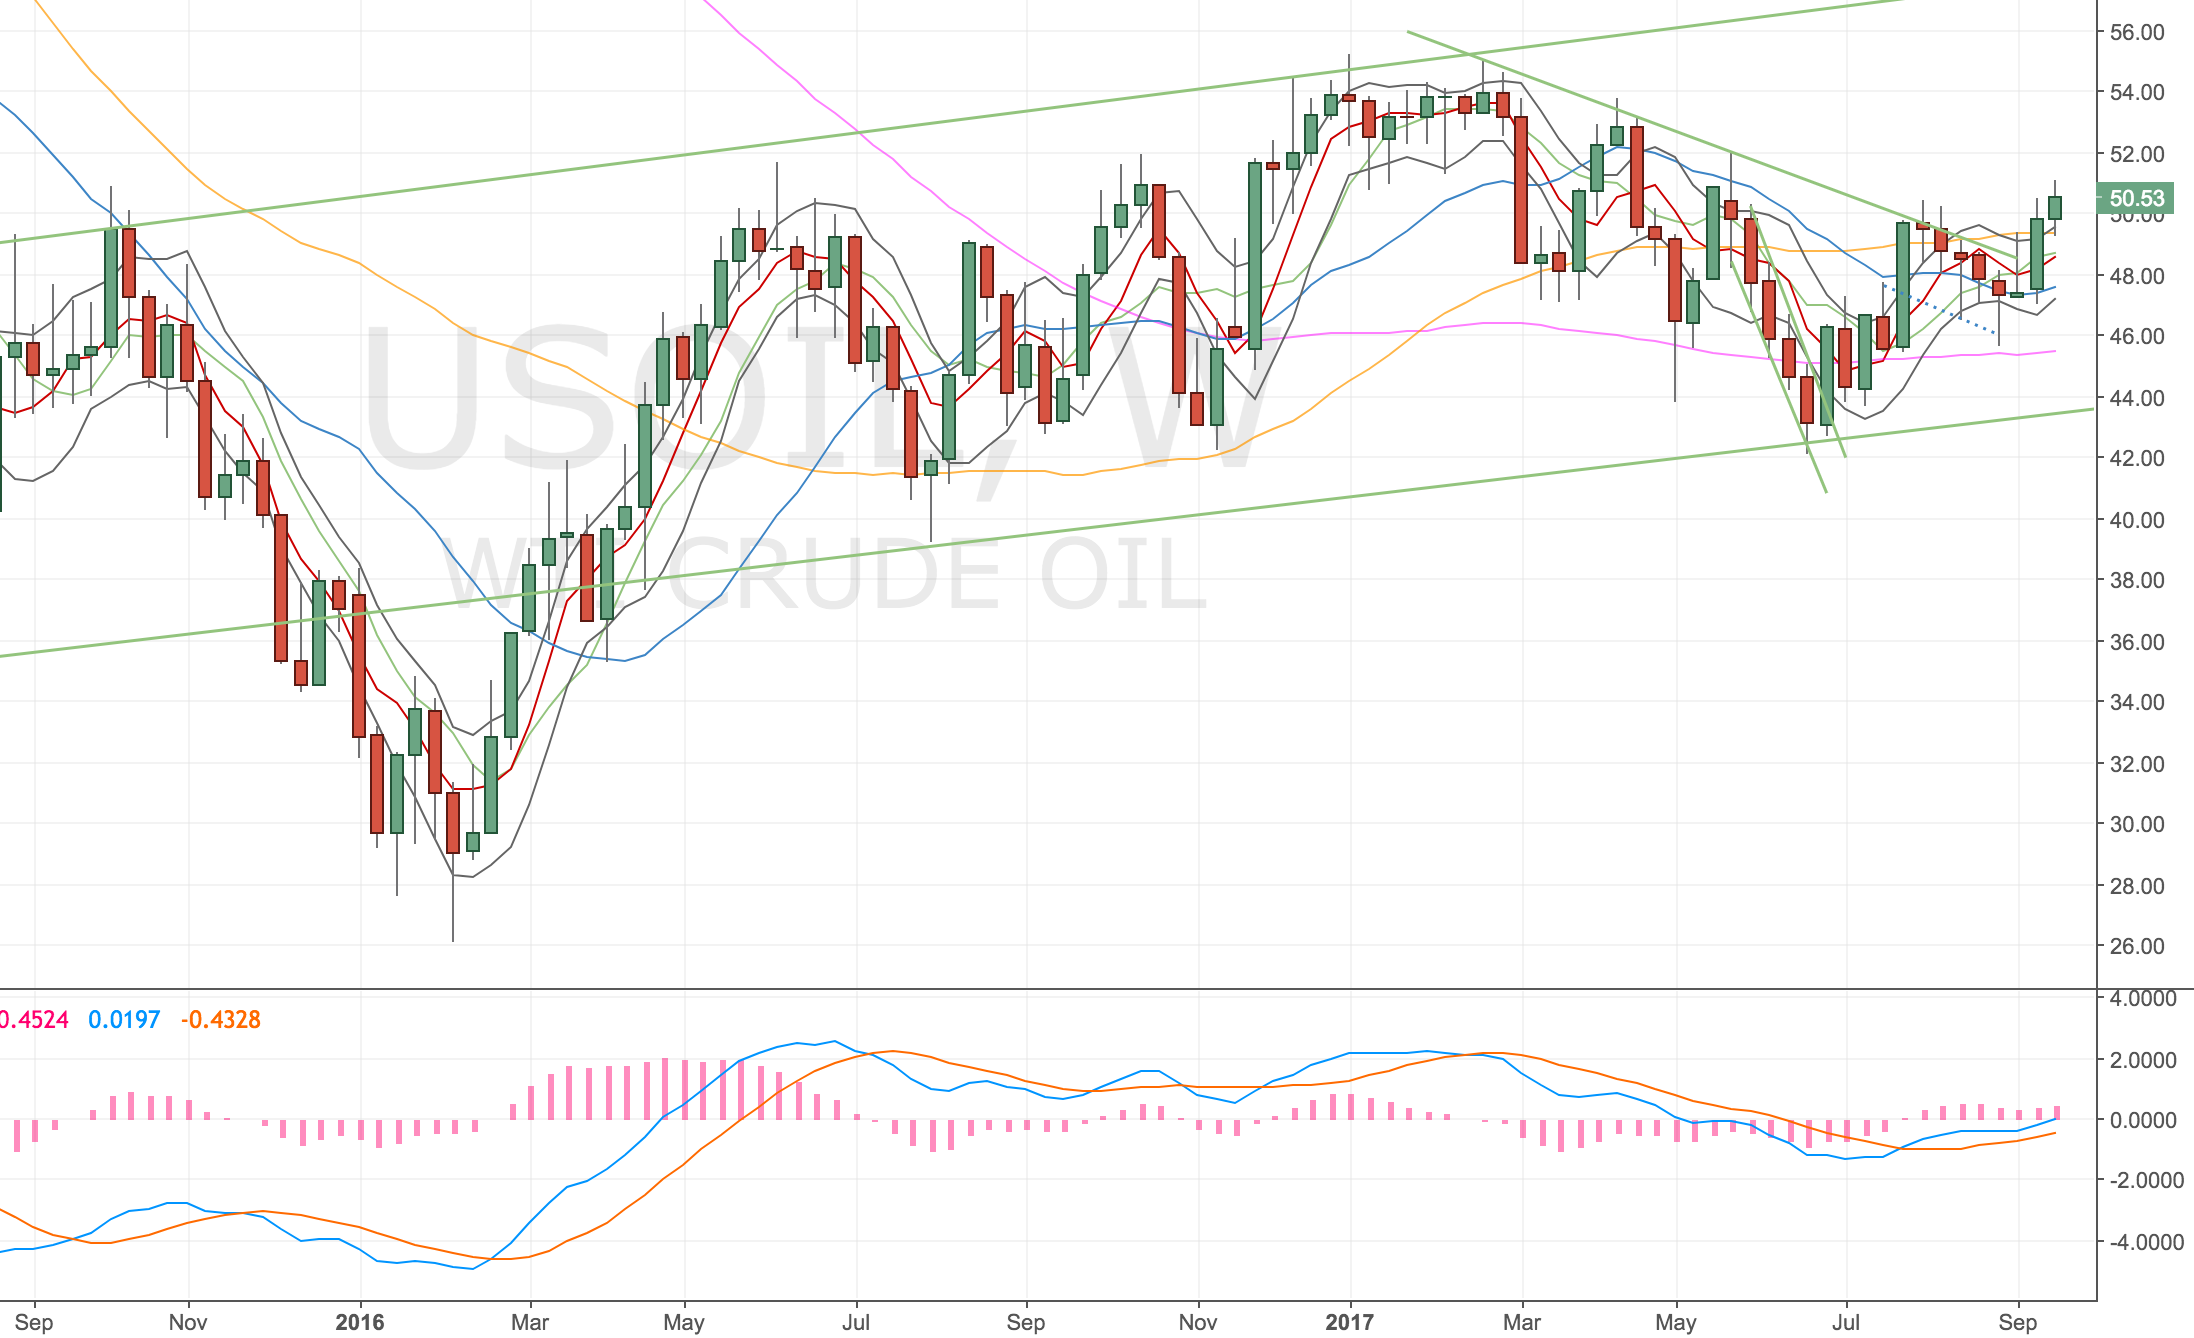
Oil Weekly Chart – 21 Sep 17
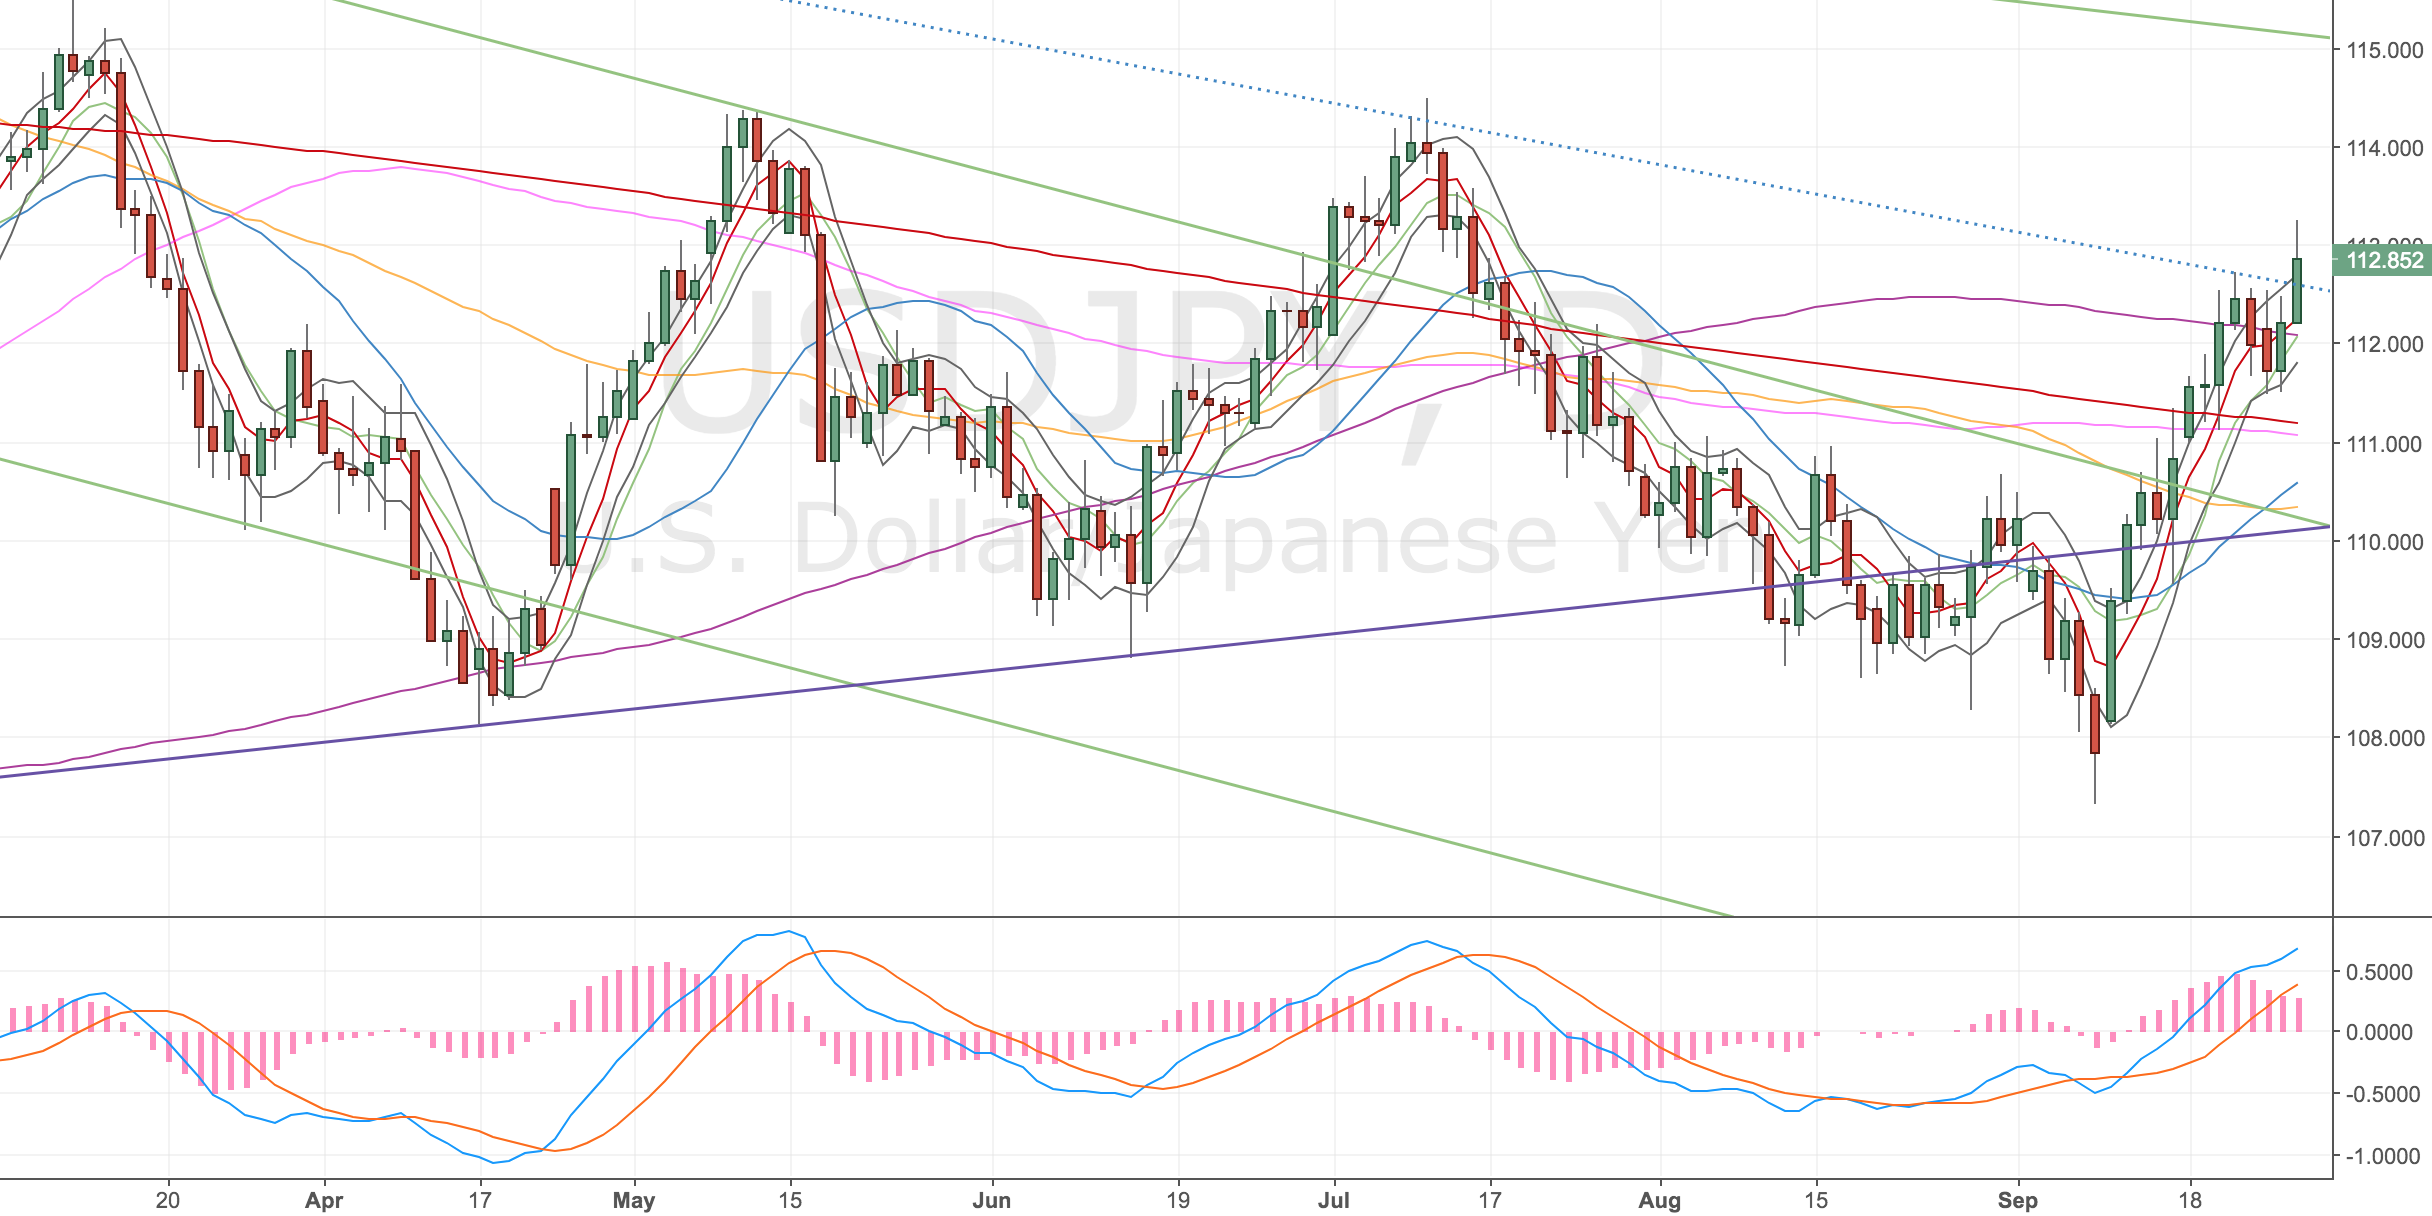
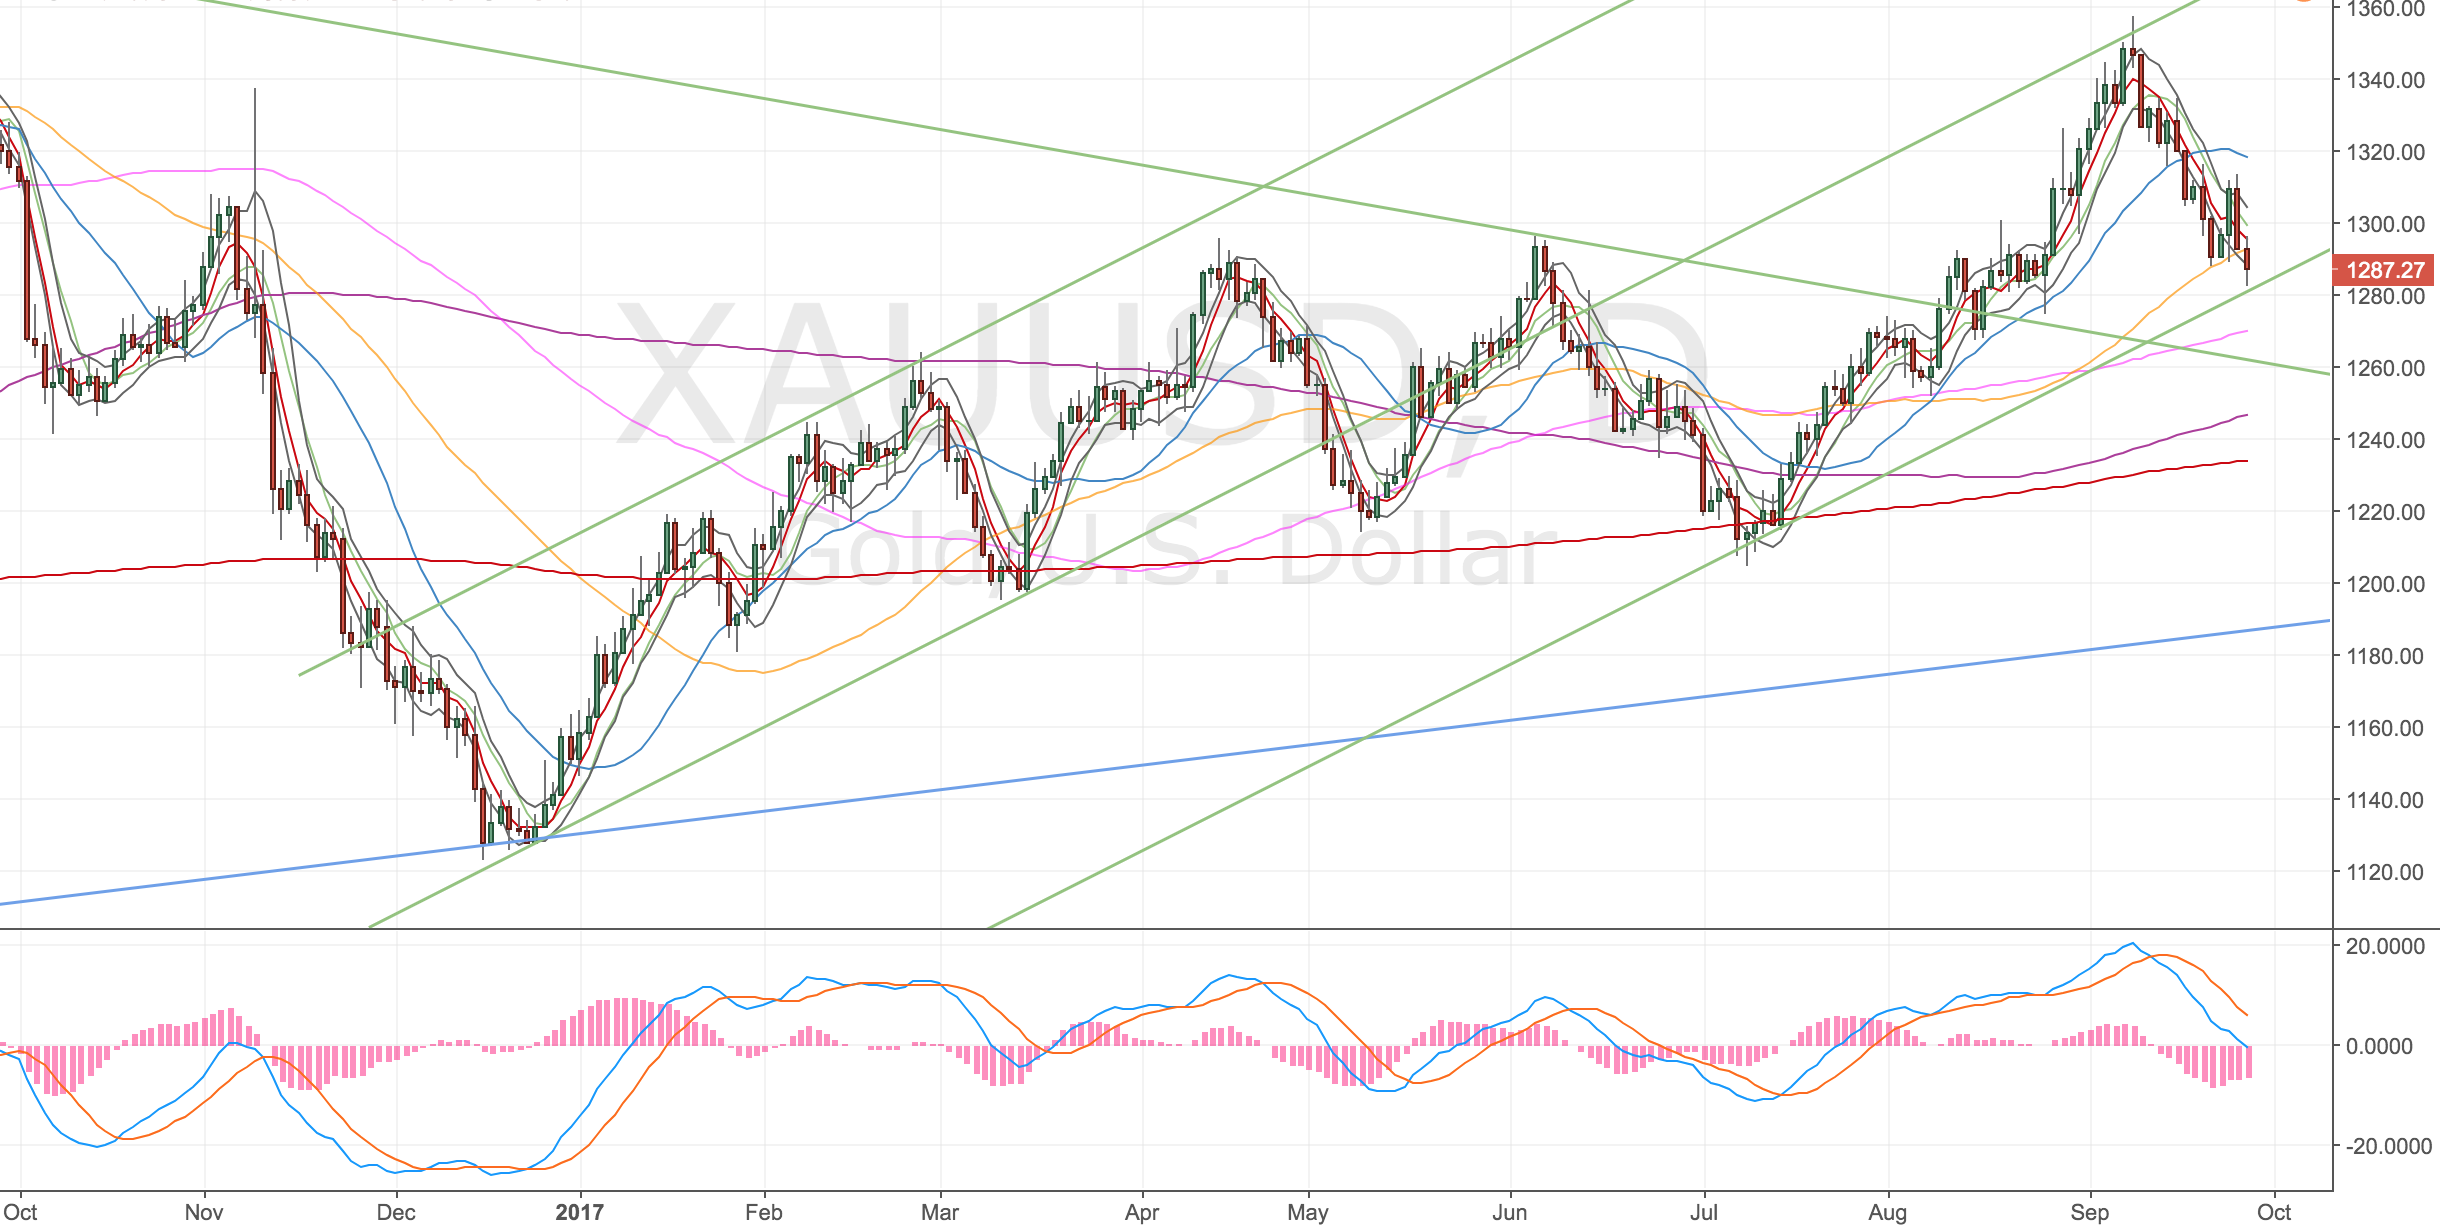
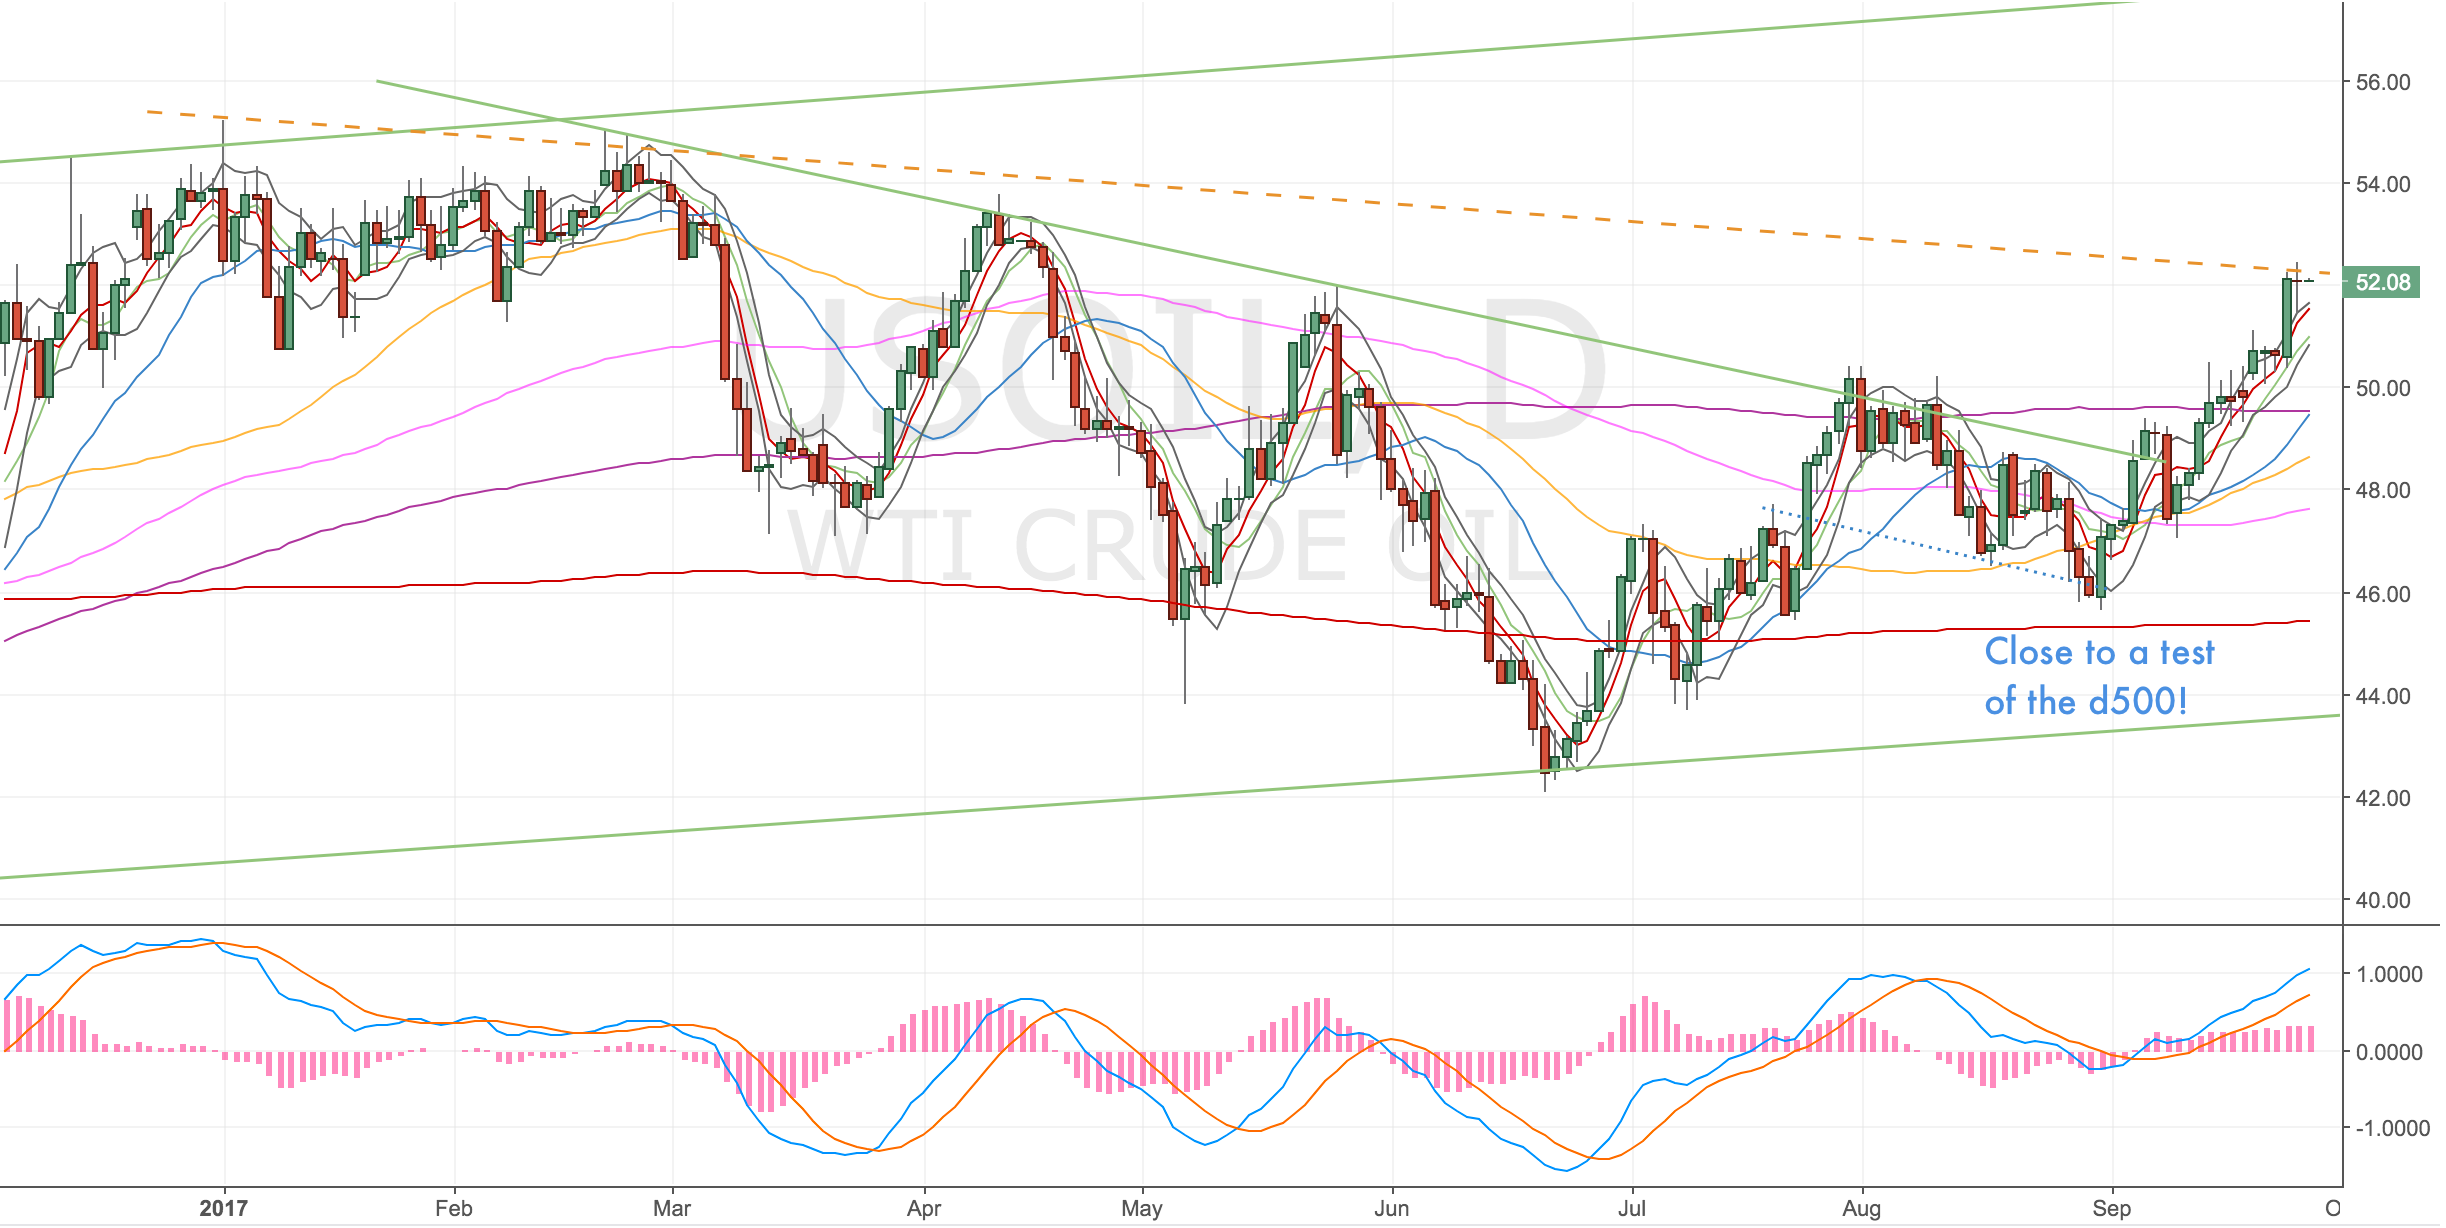
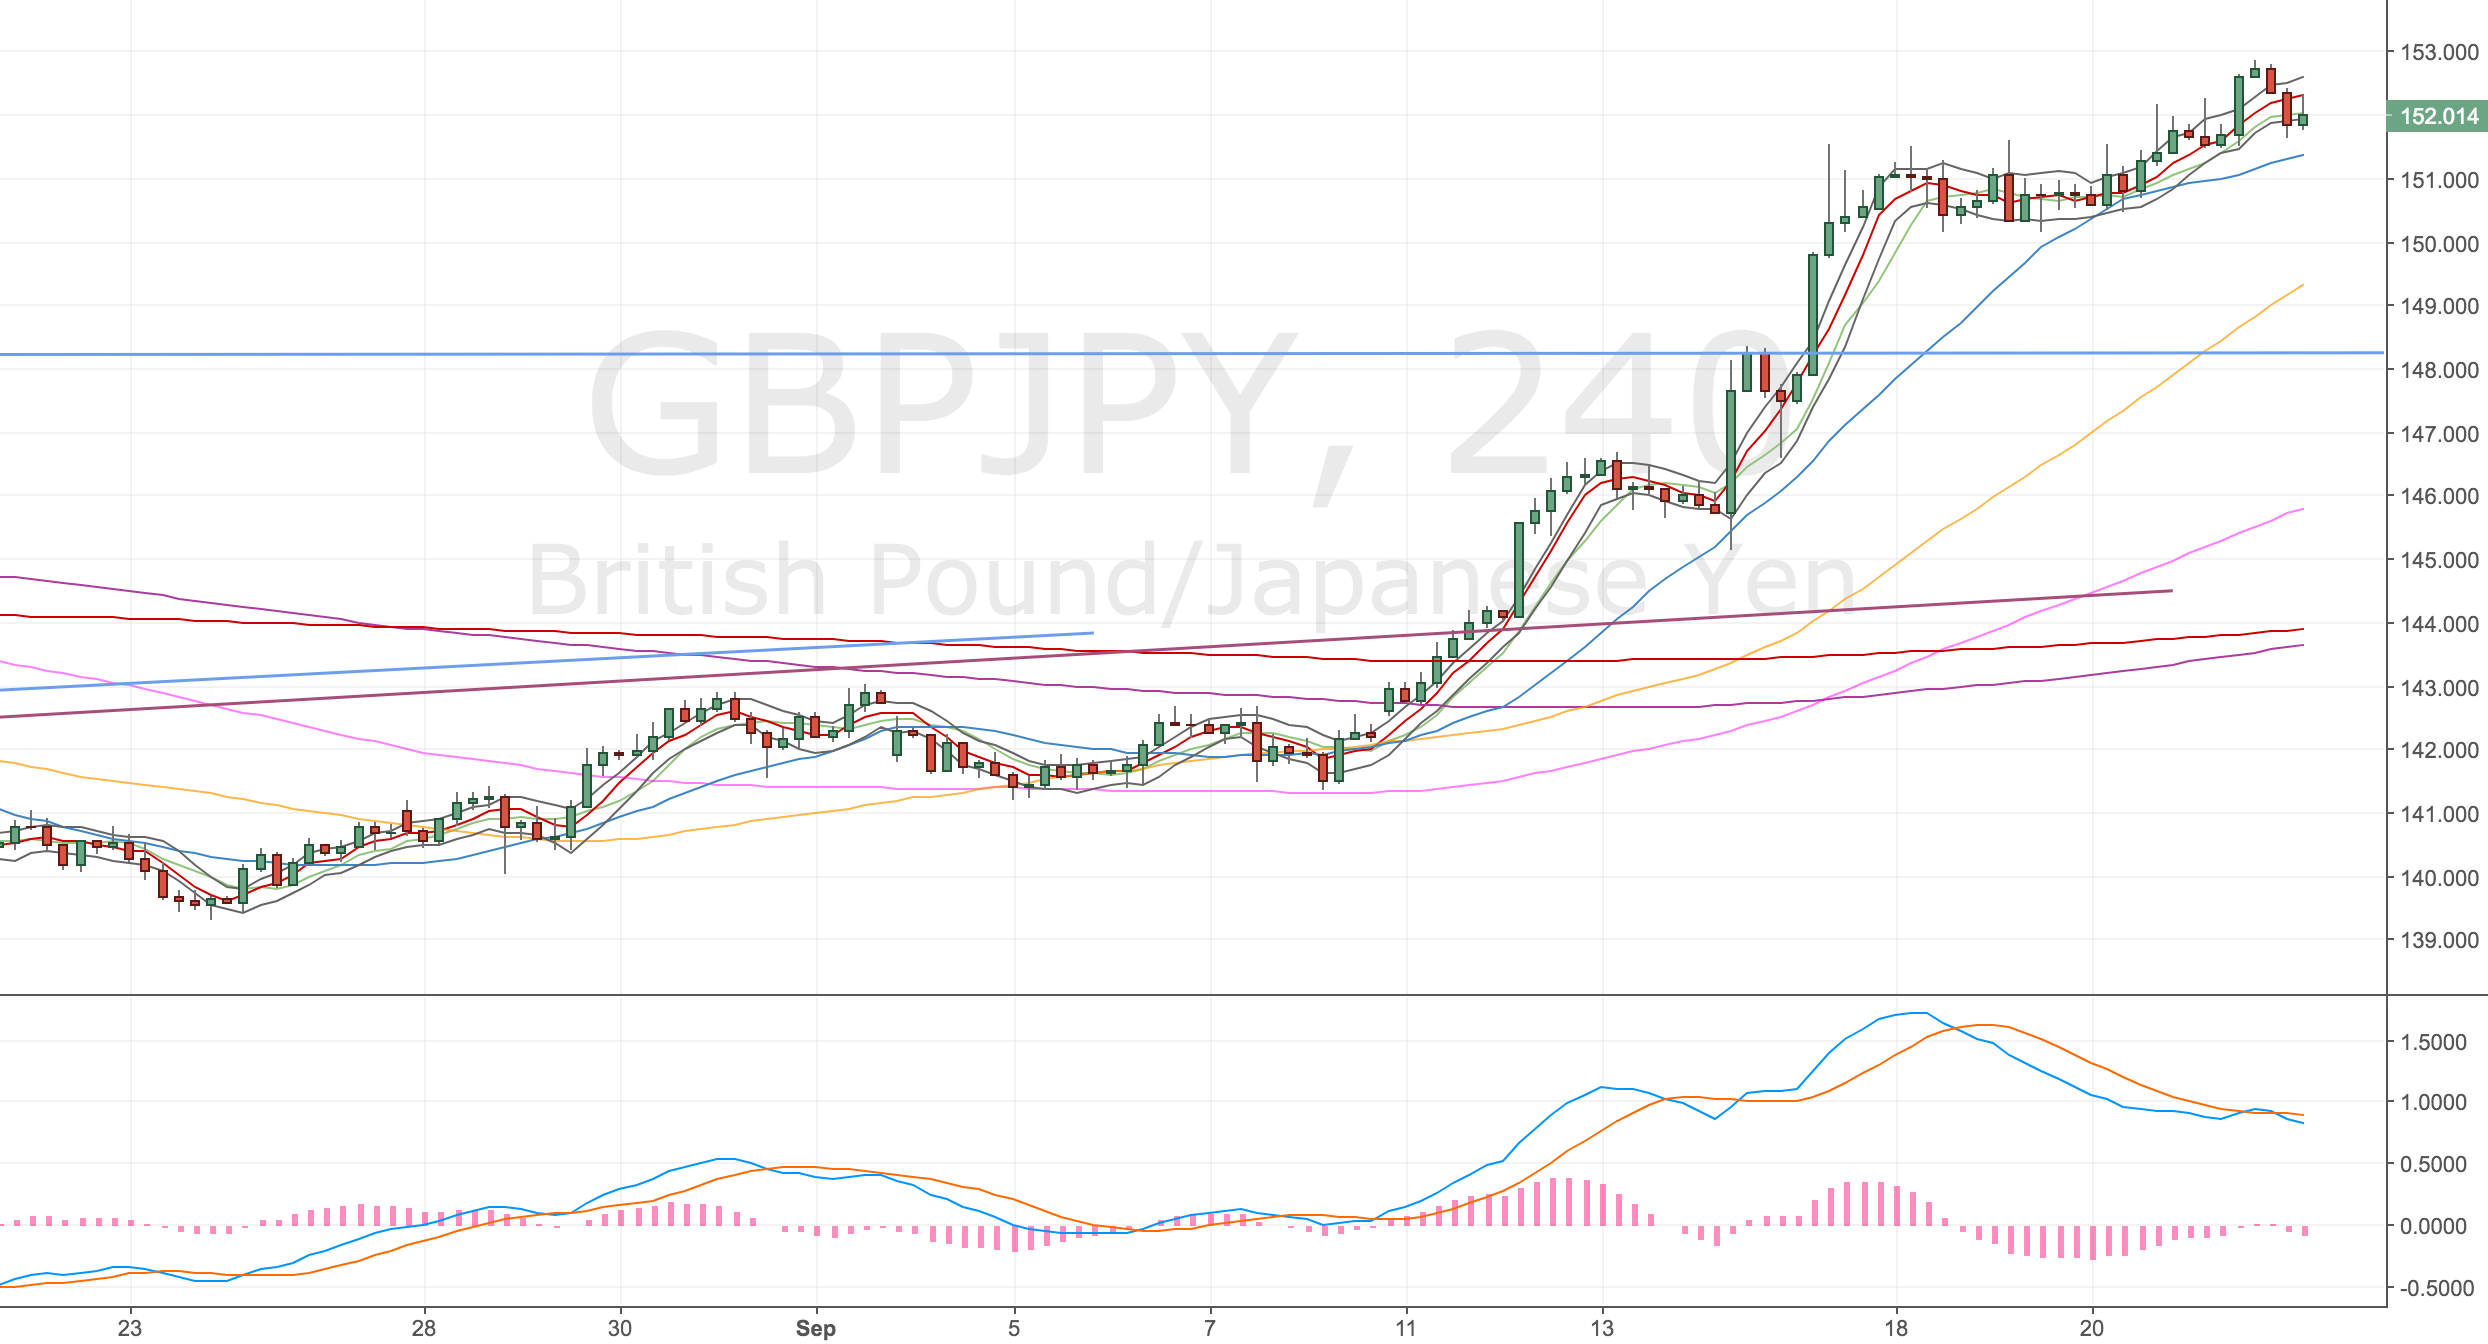
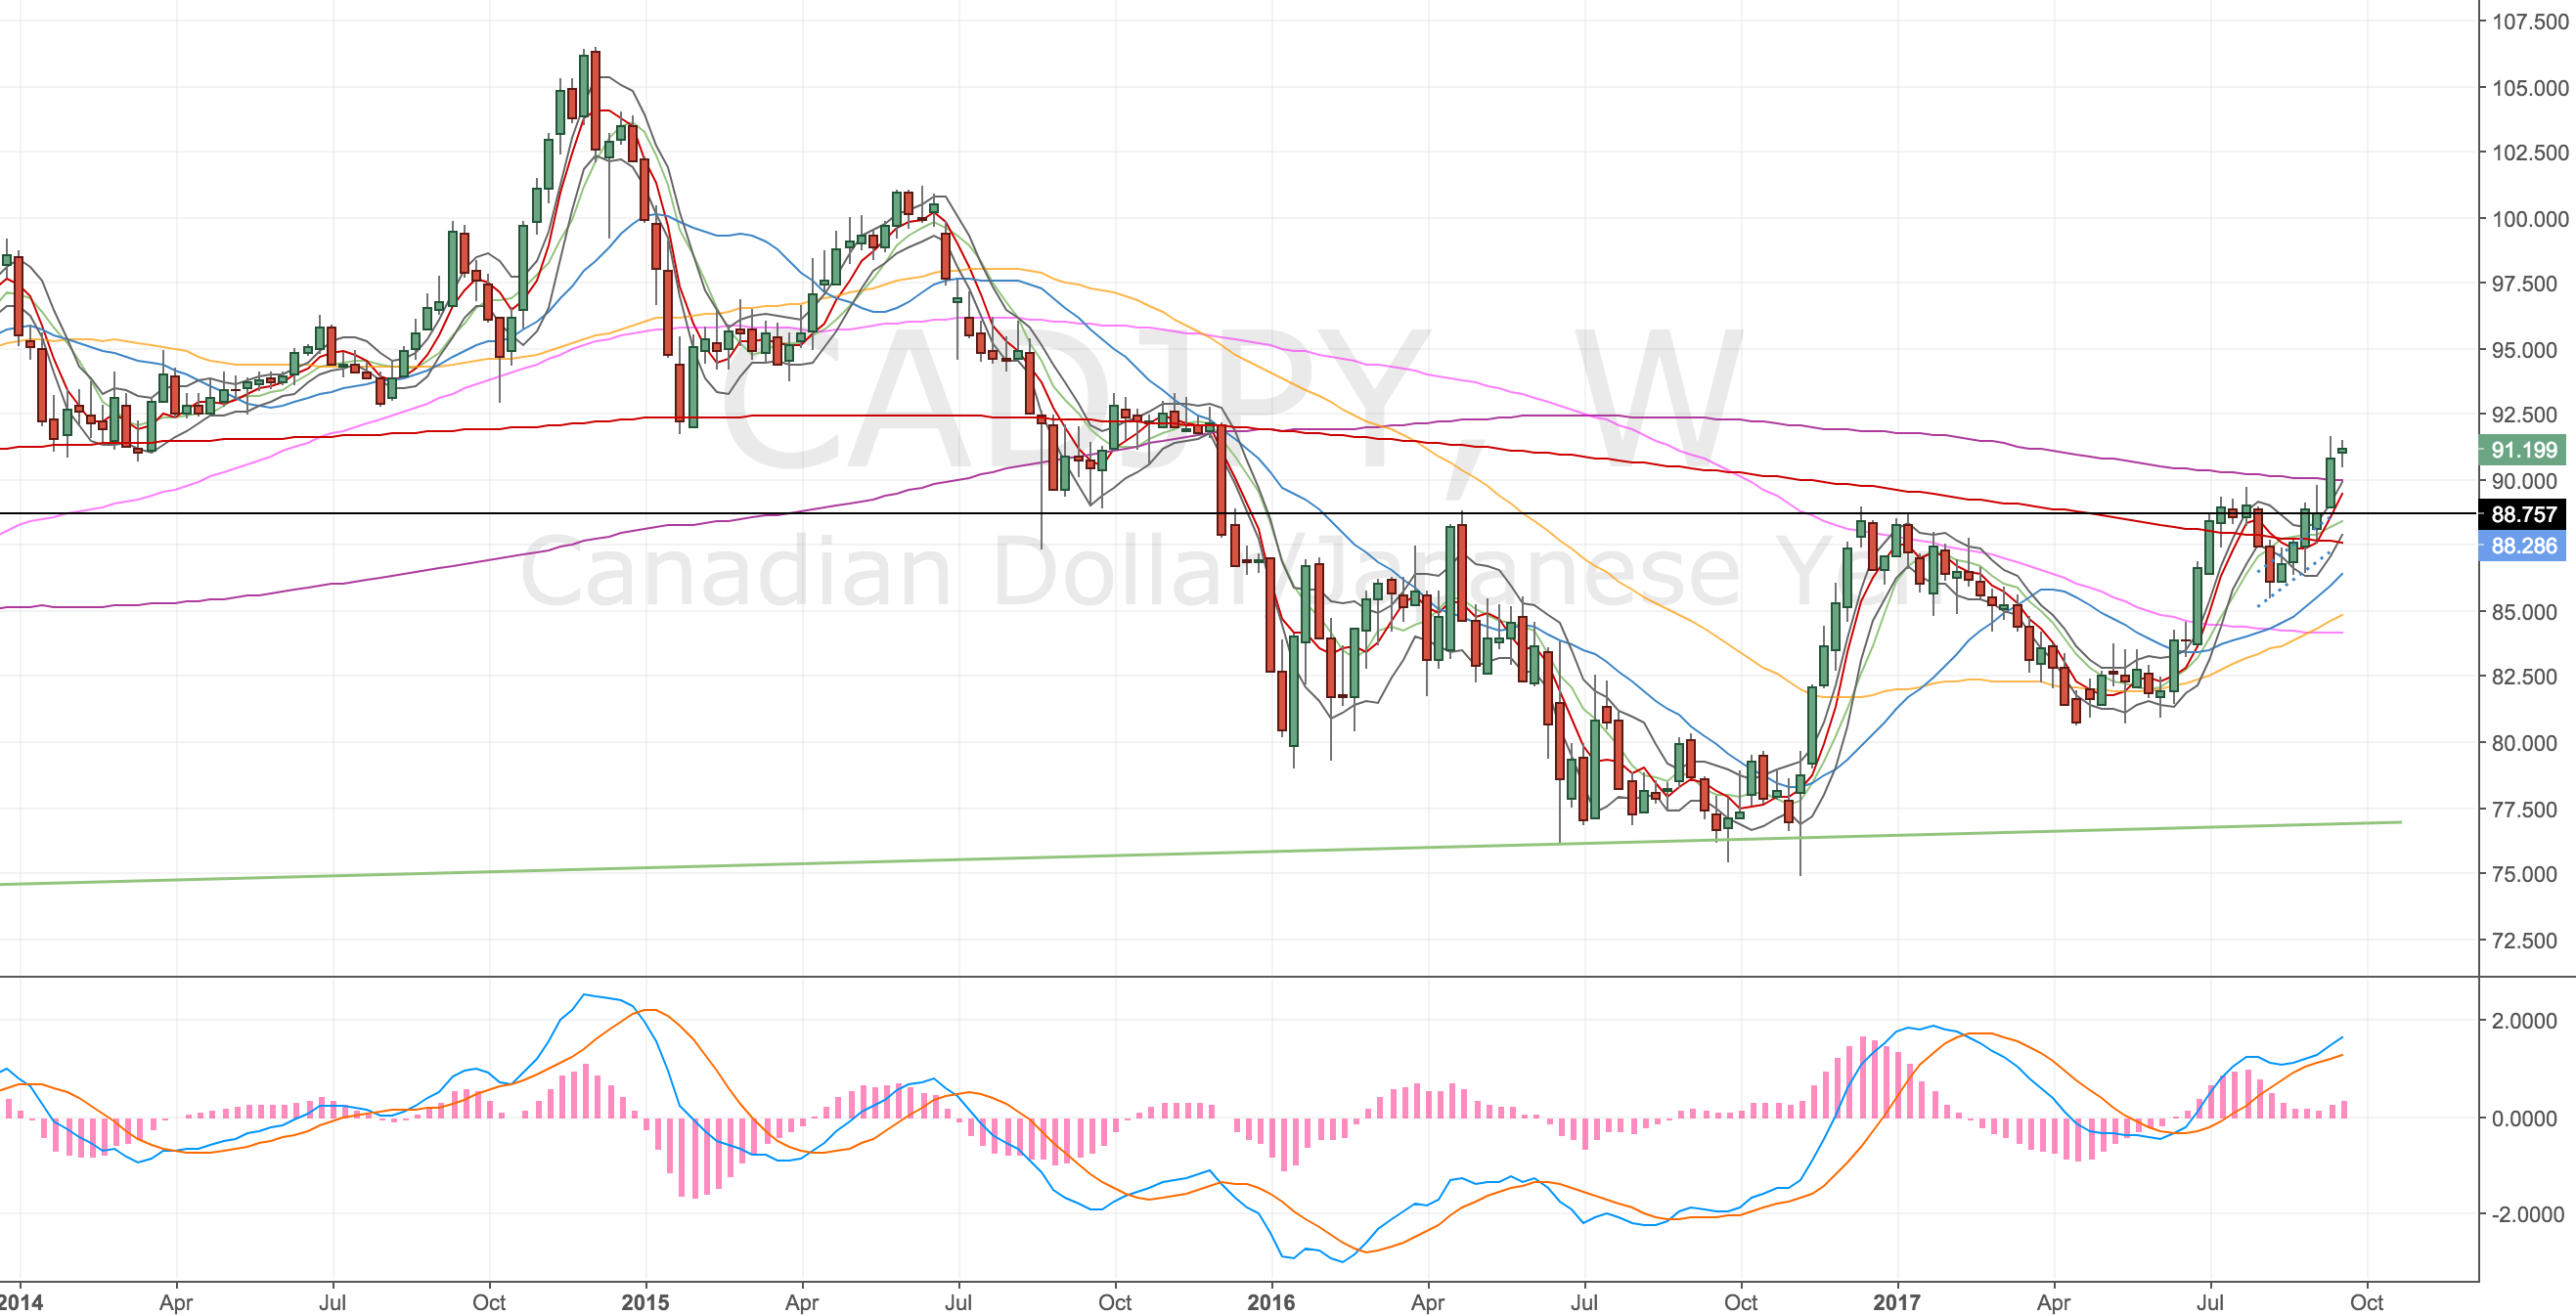
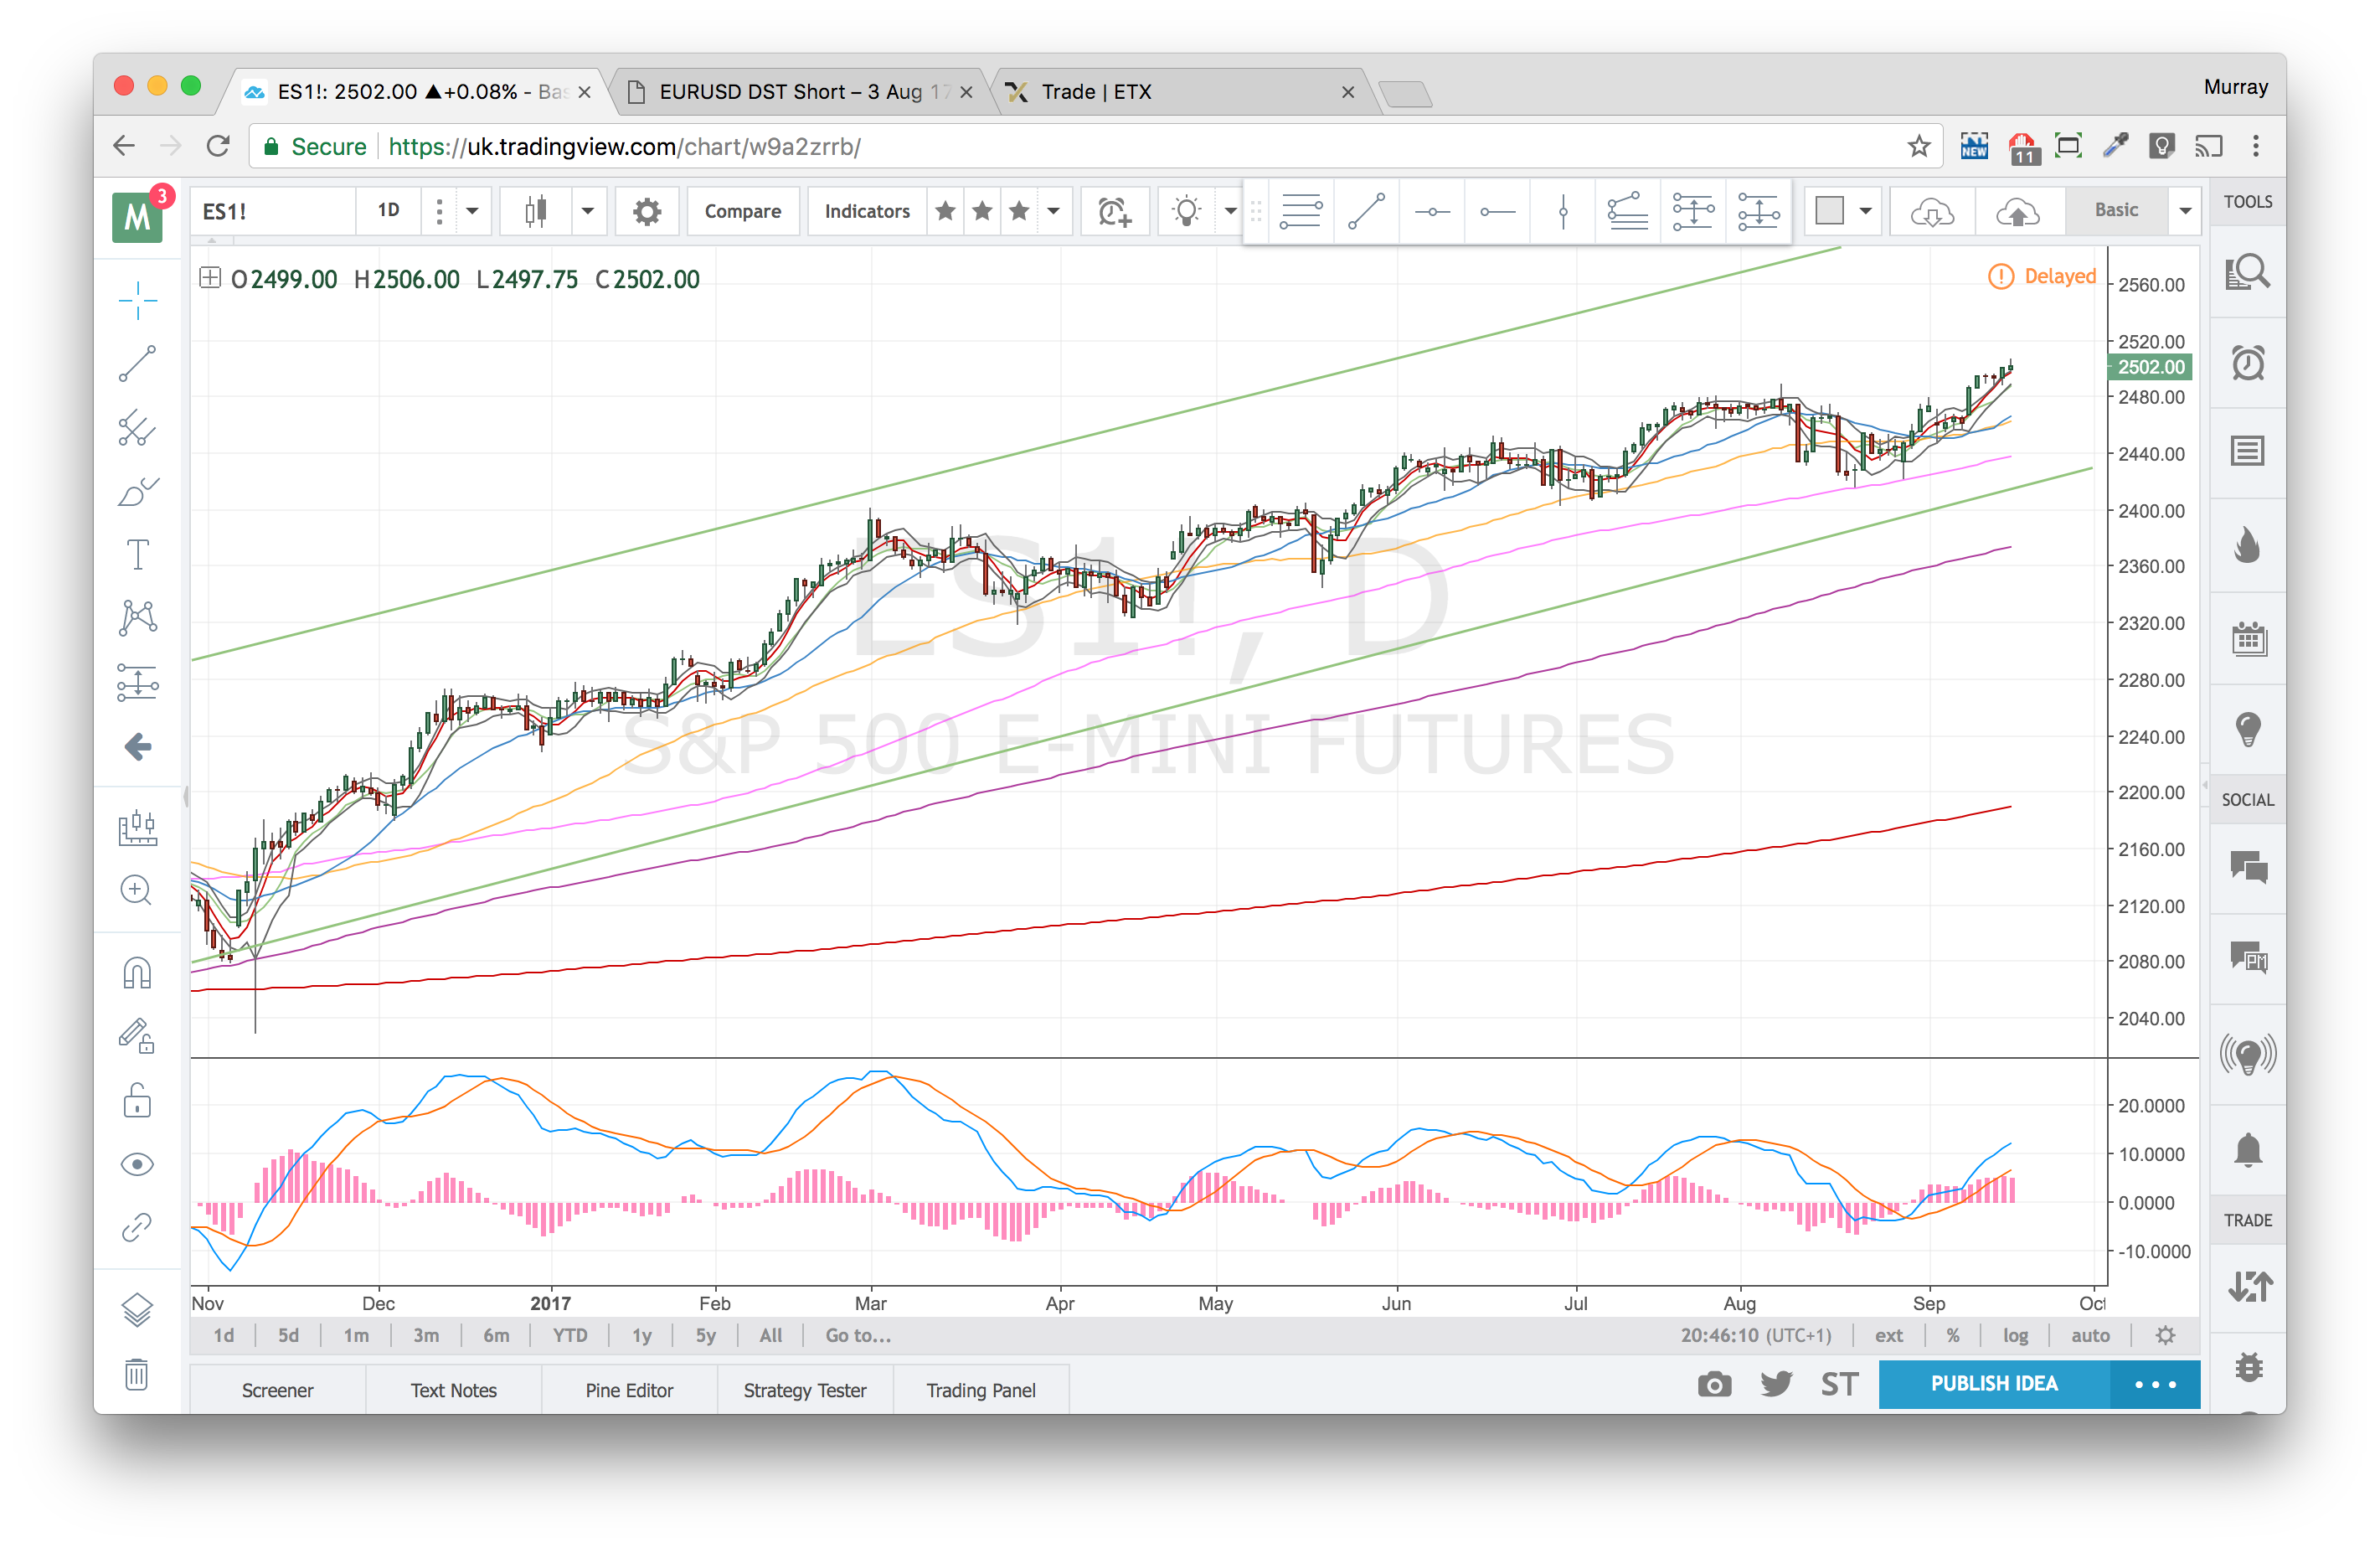
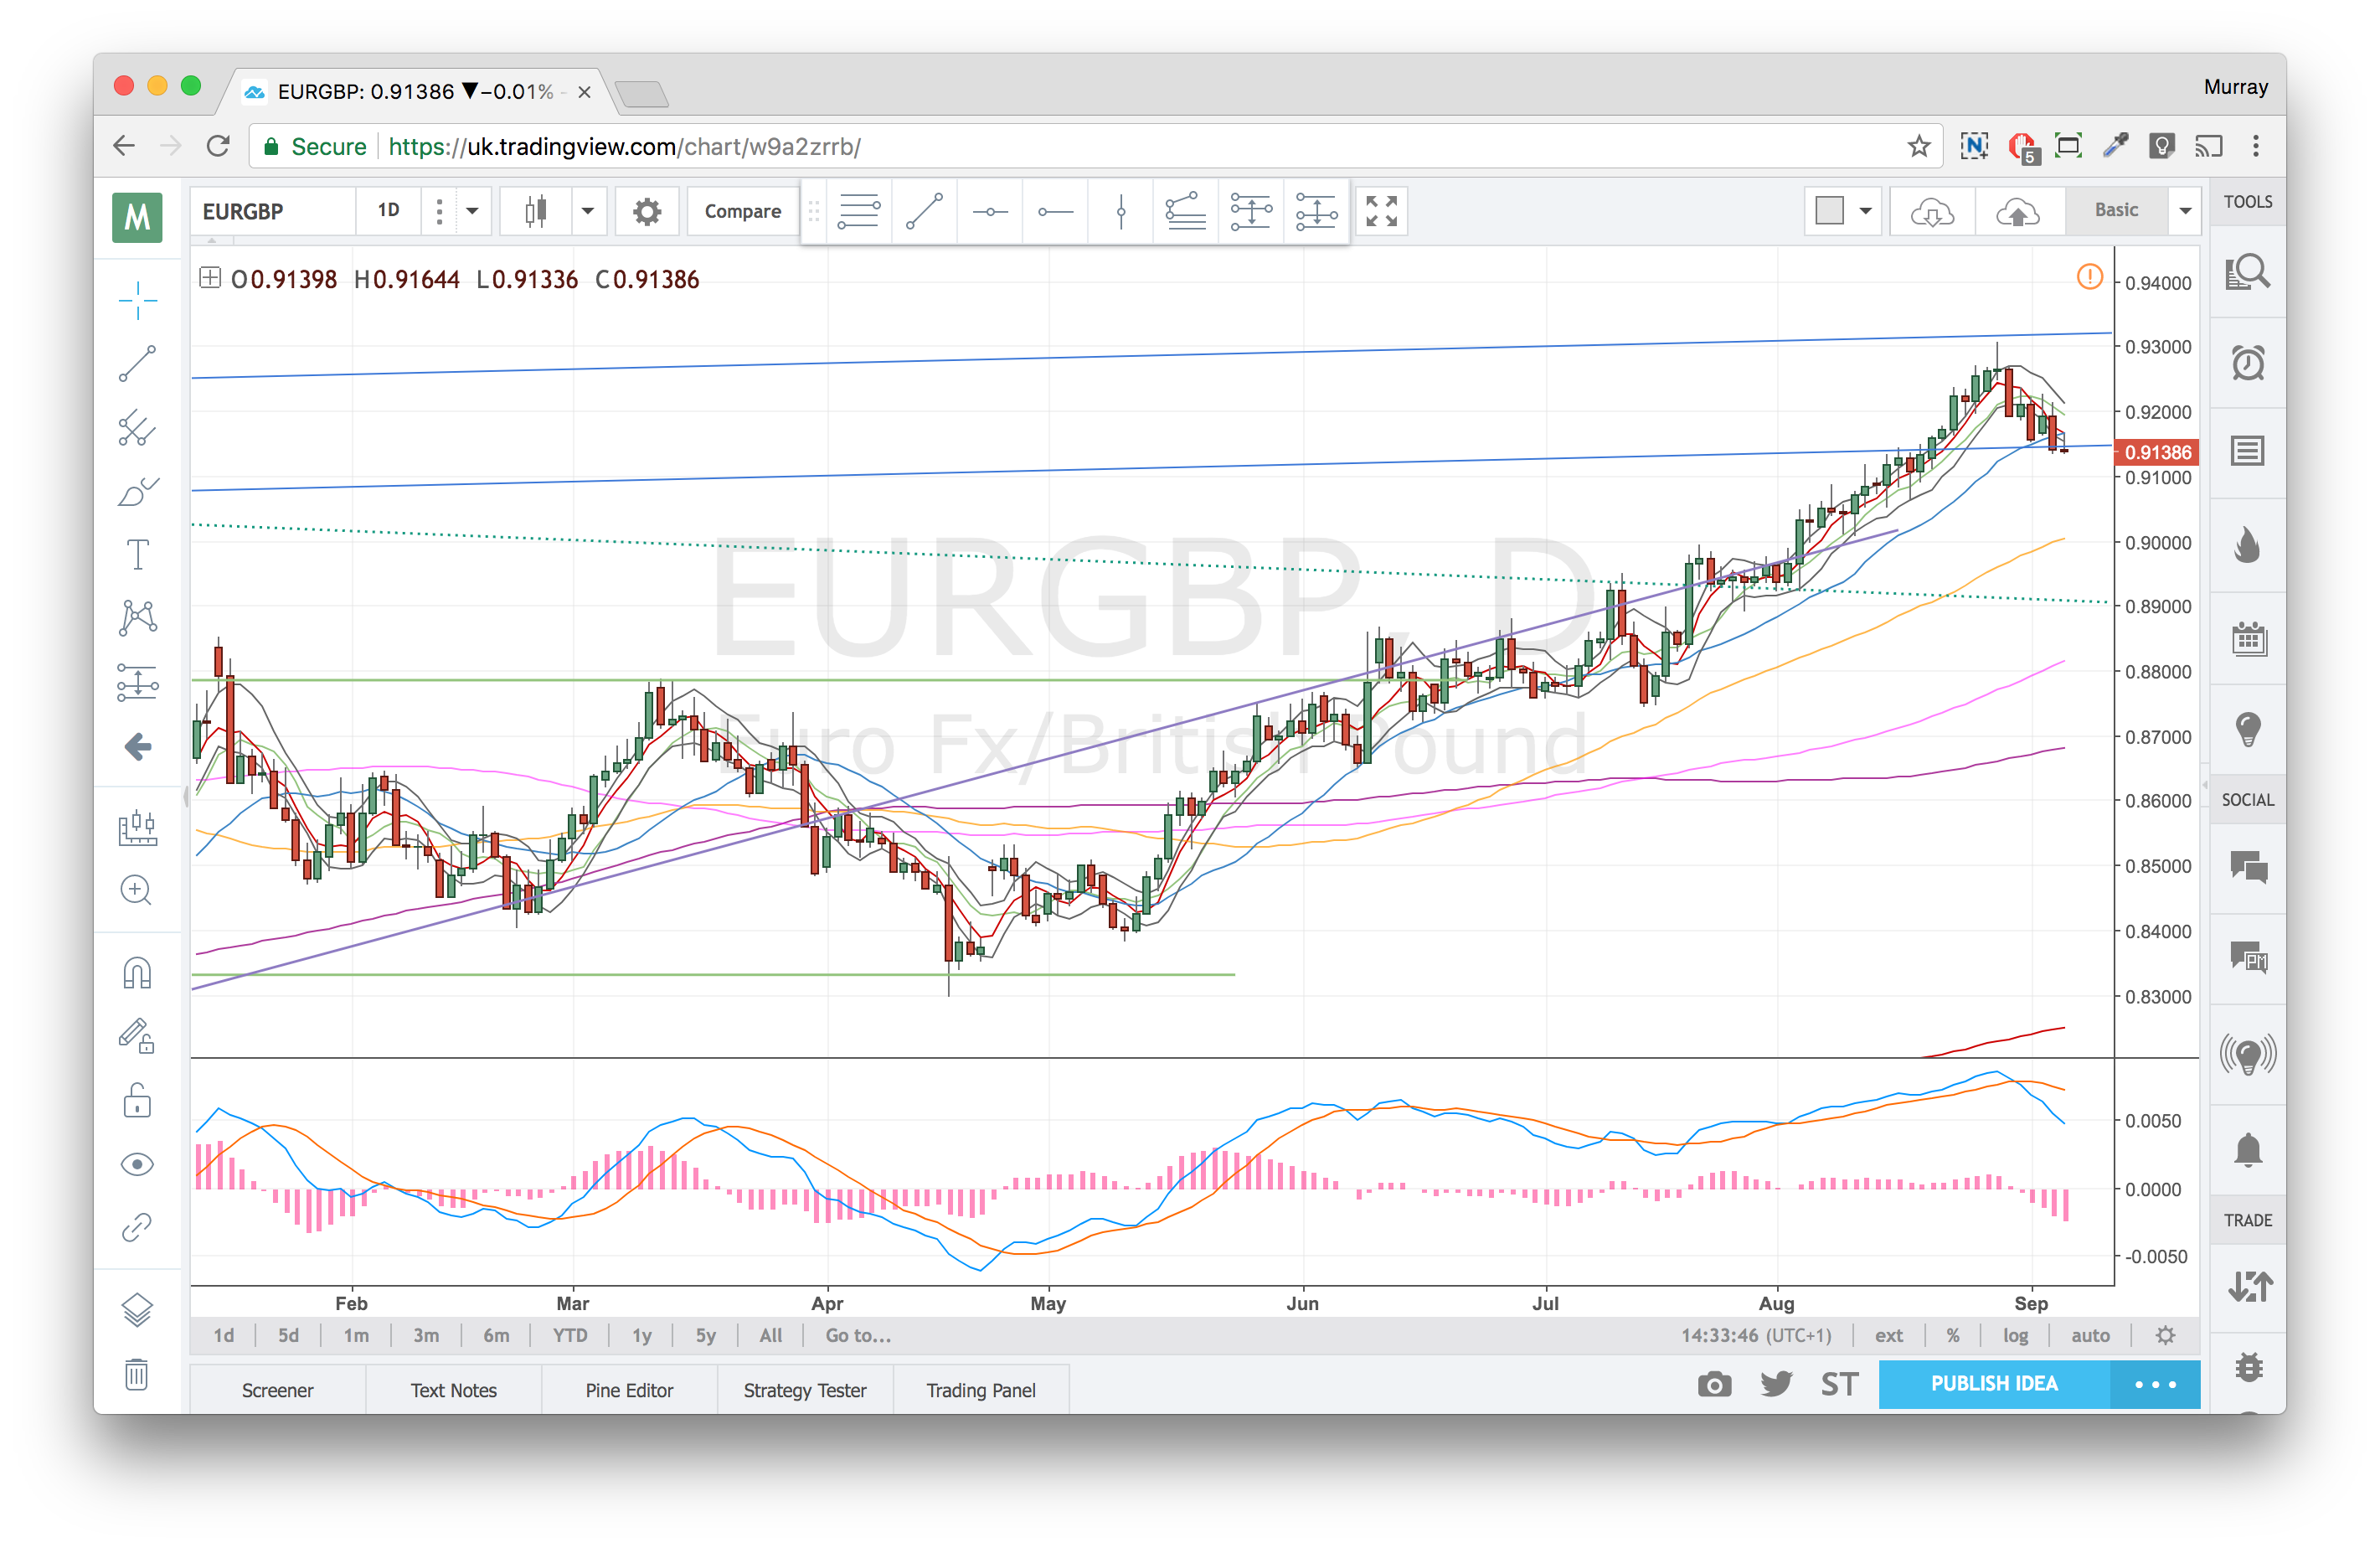
Daily Chart
Divergence off the Aug high.
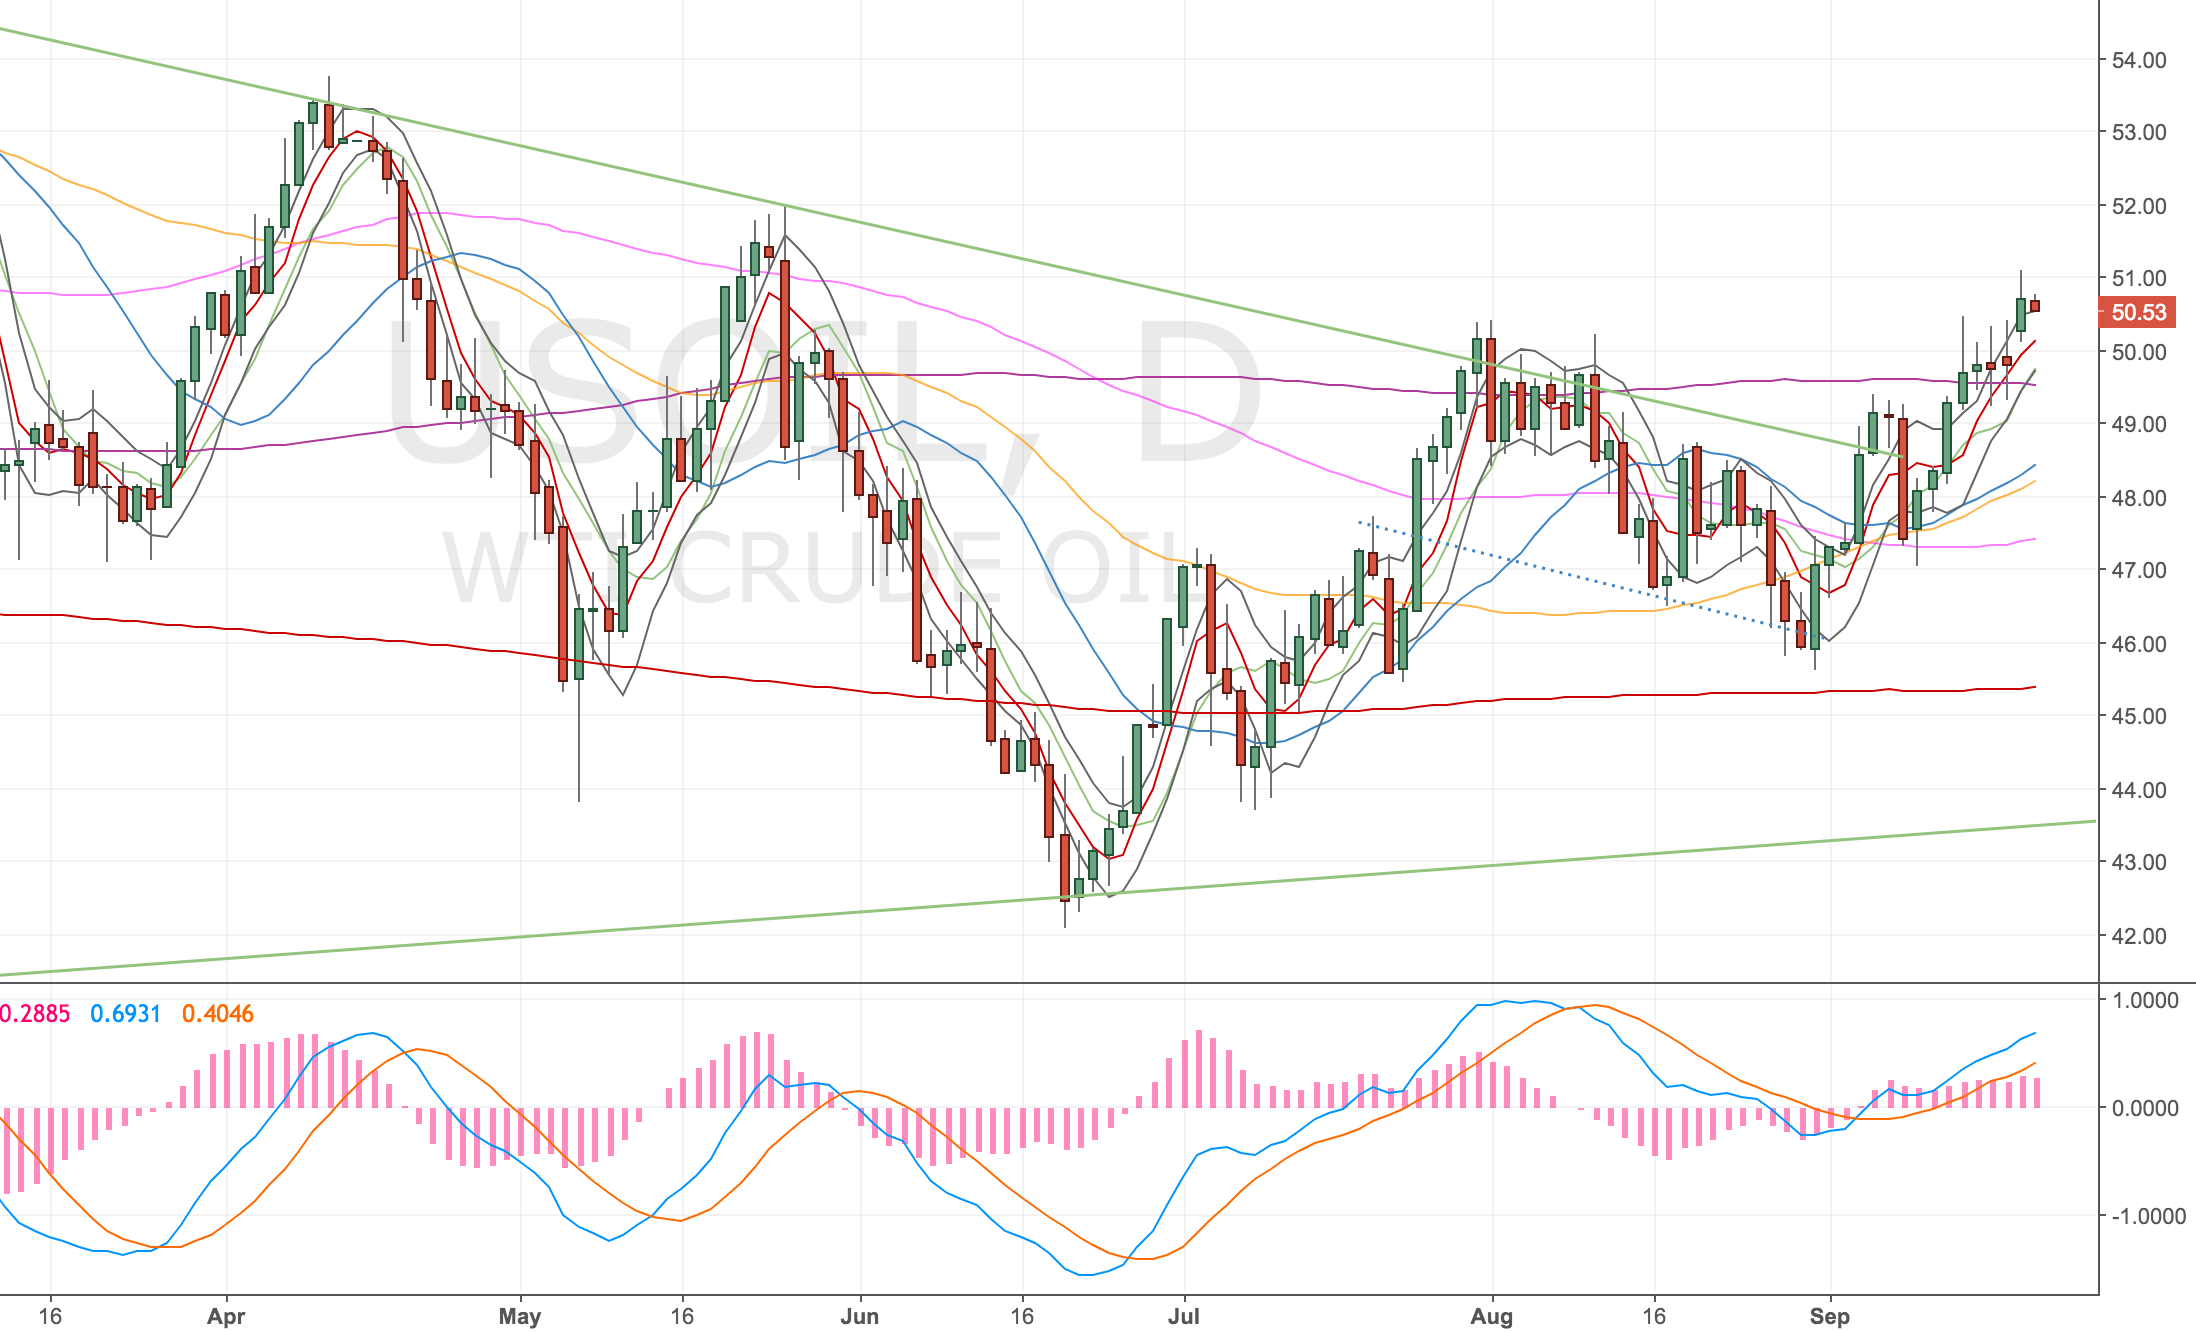
Oil Daily Chart – 21 Sep 17
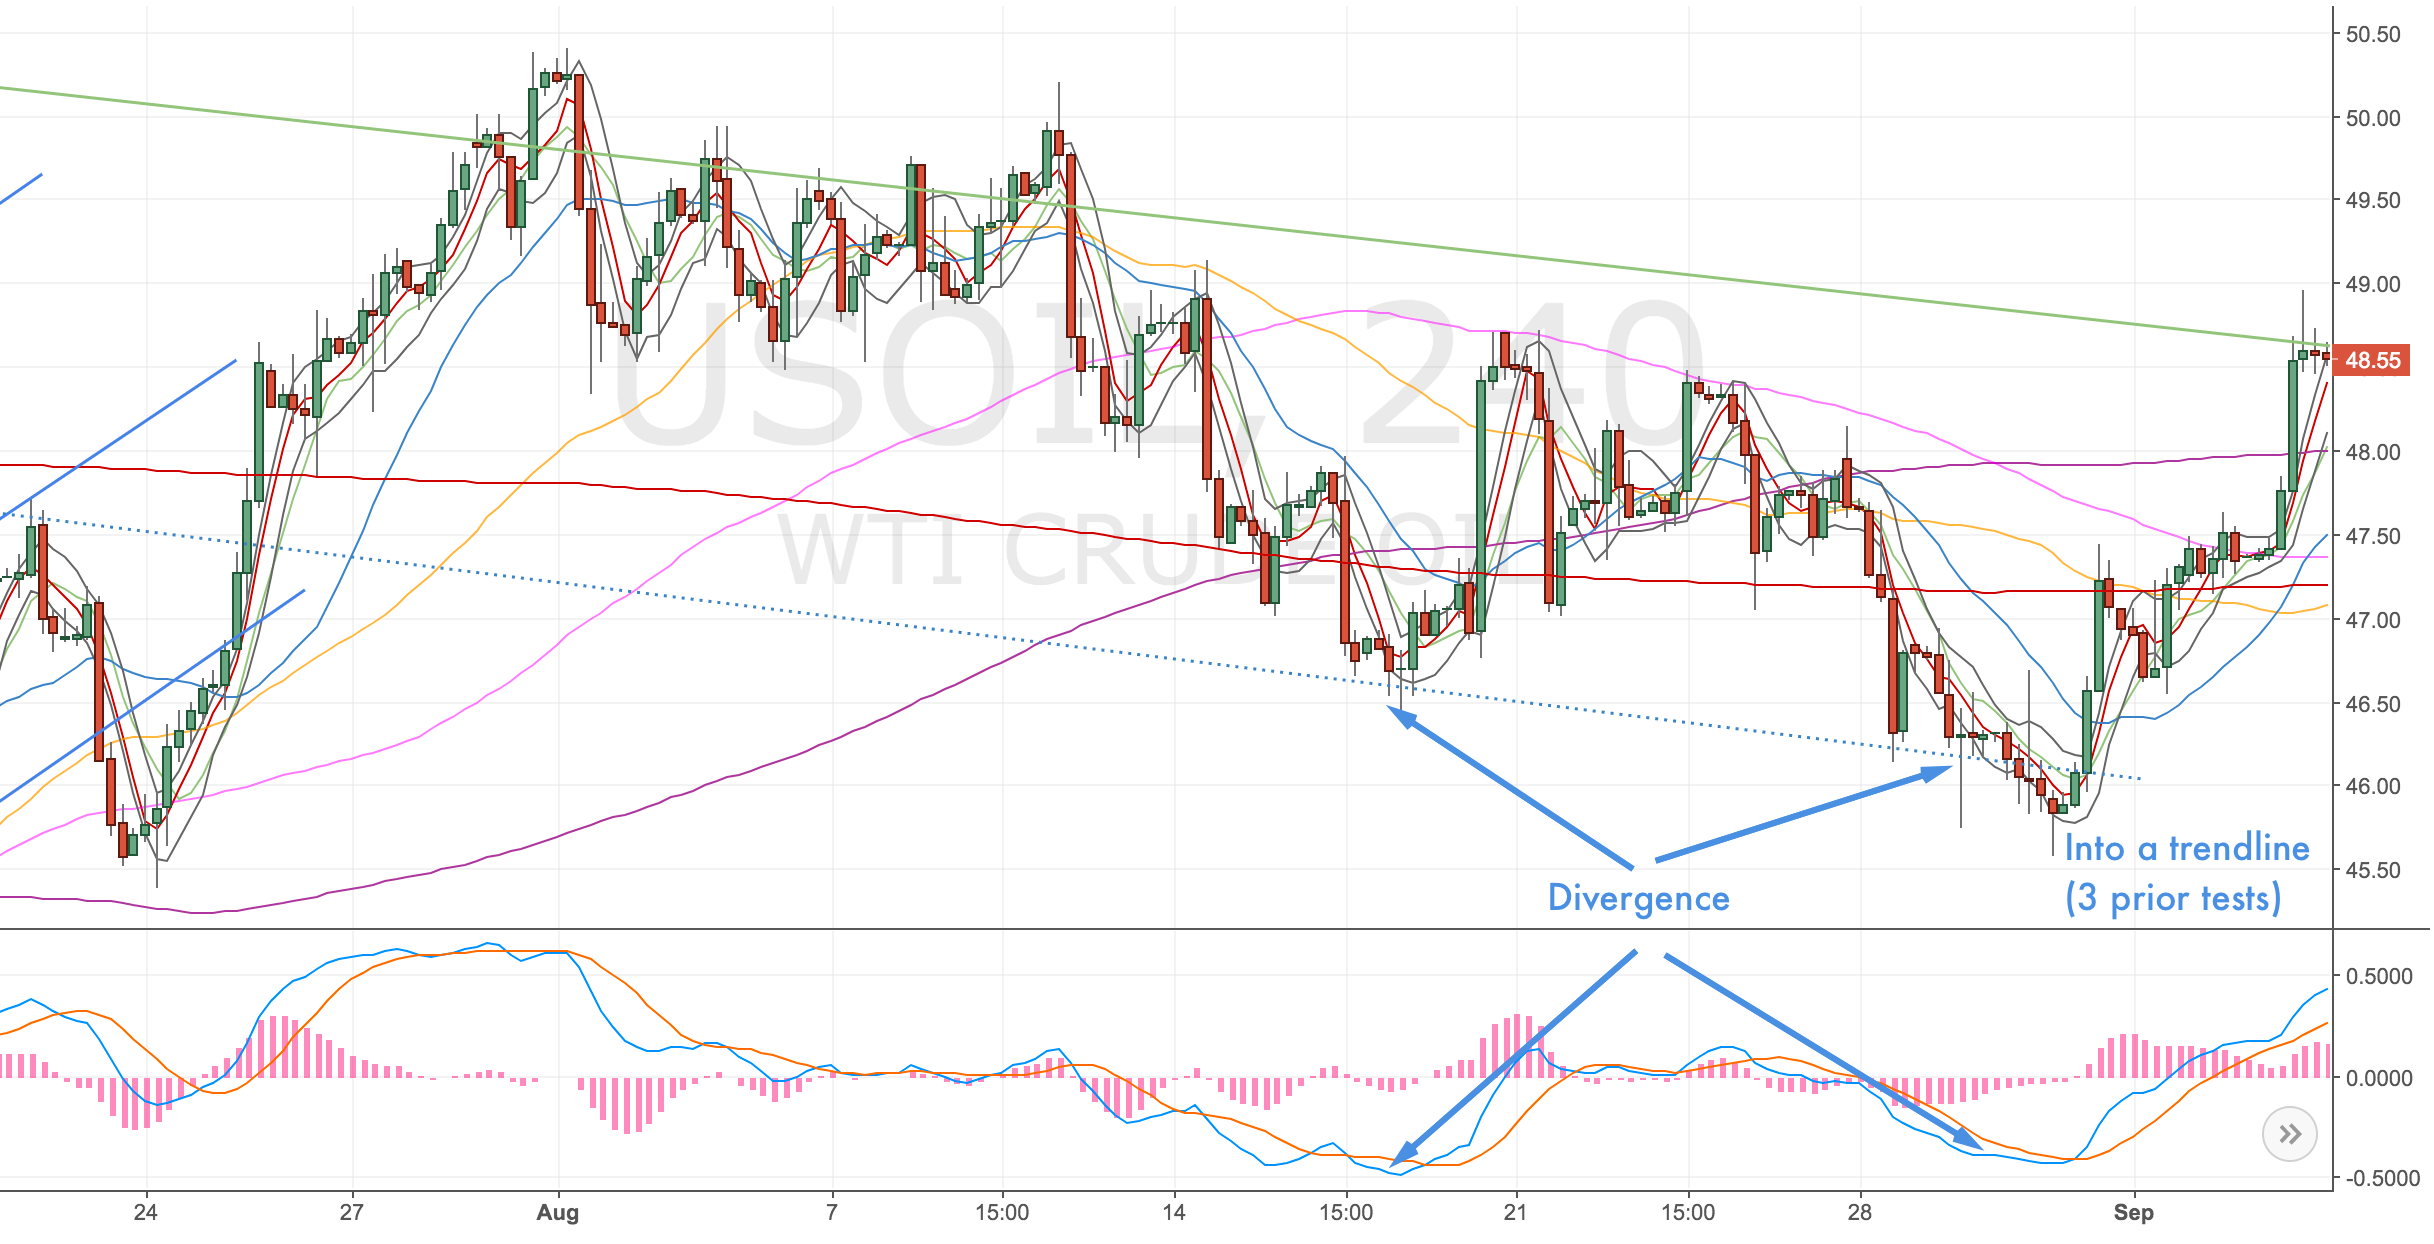
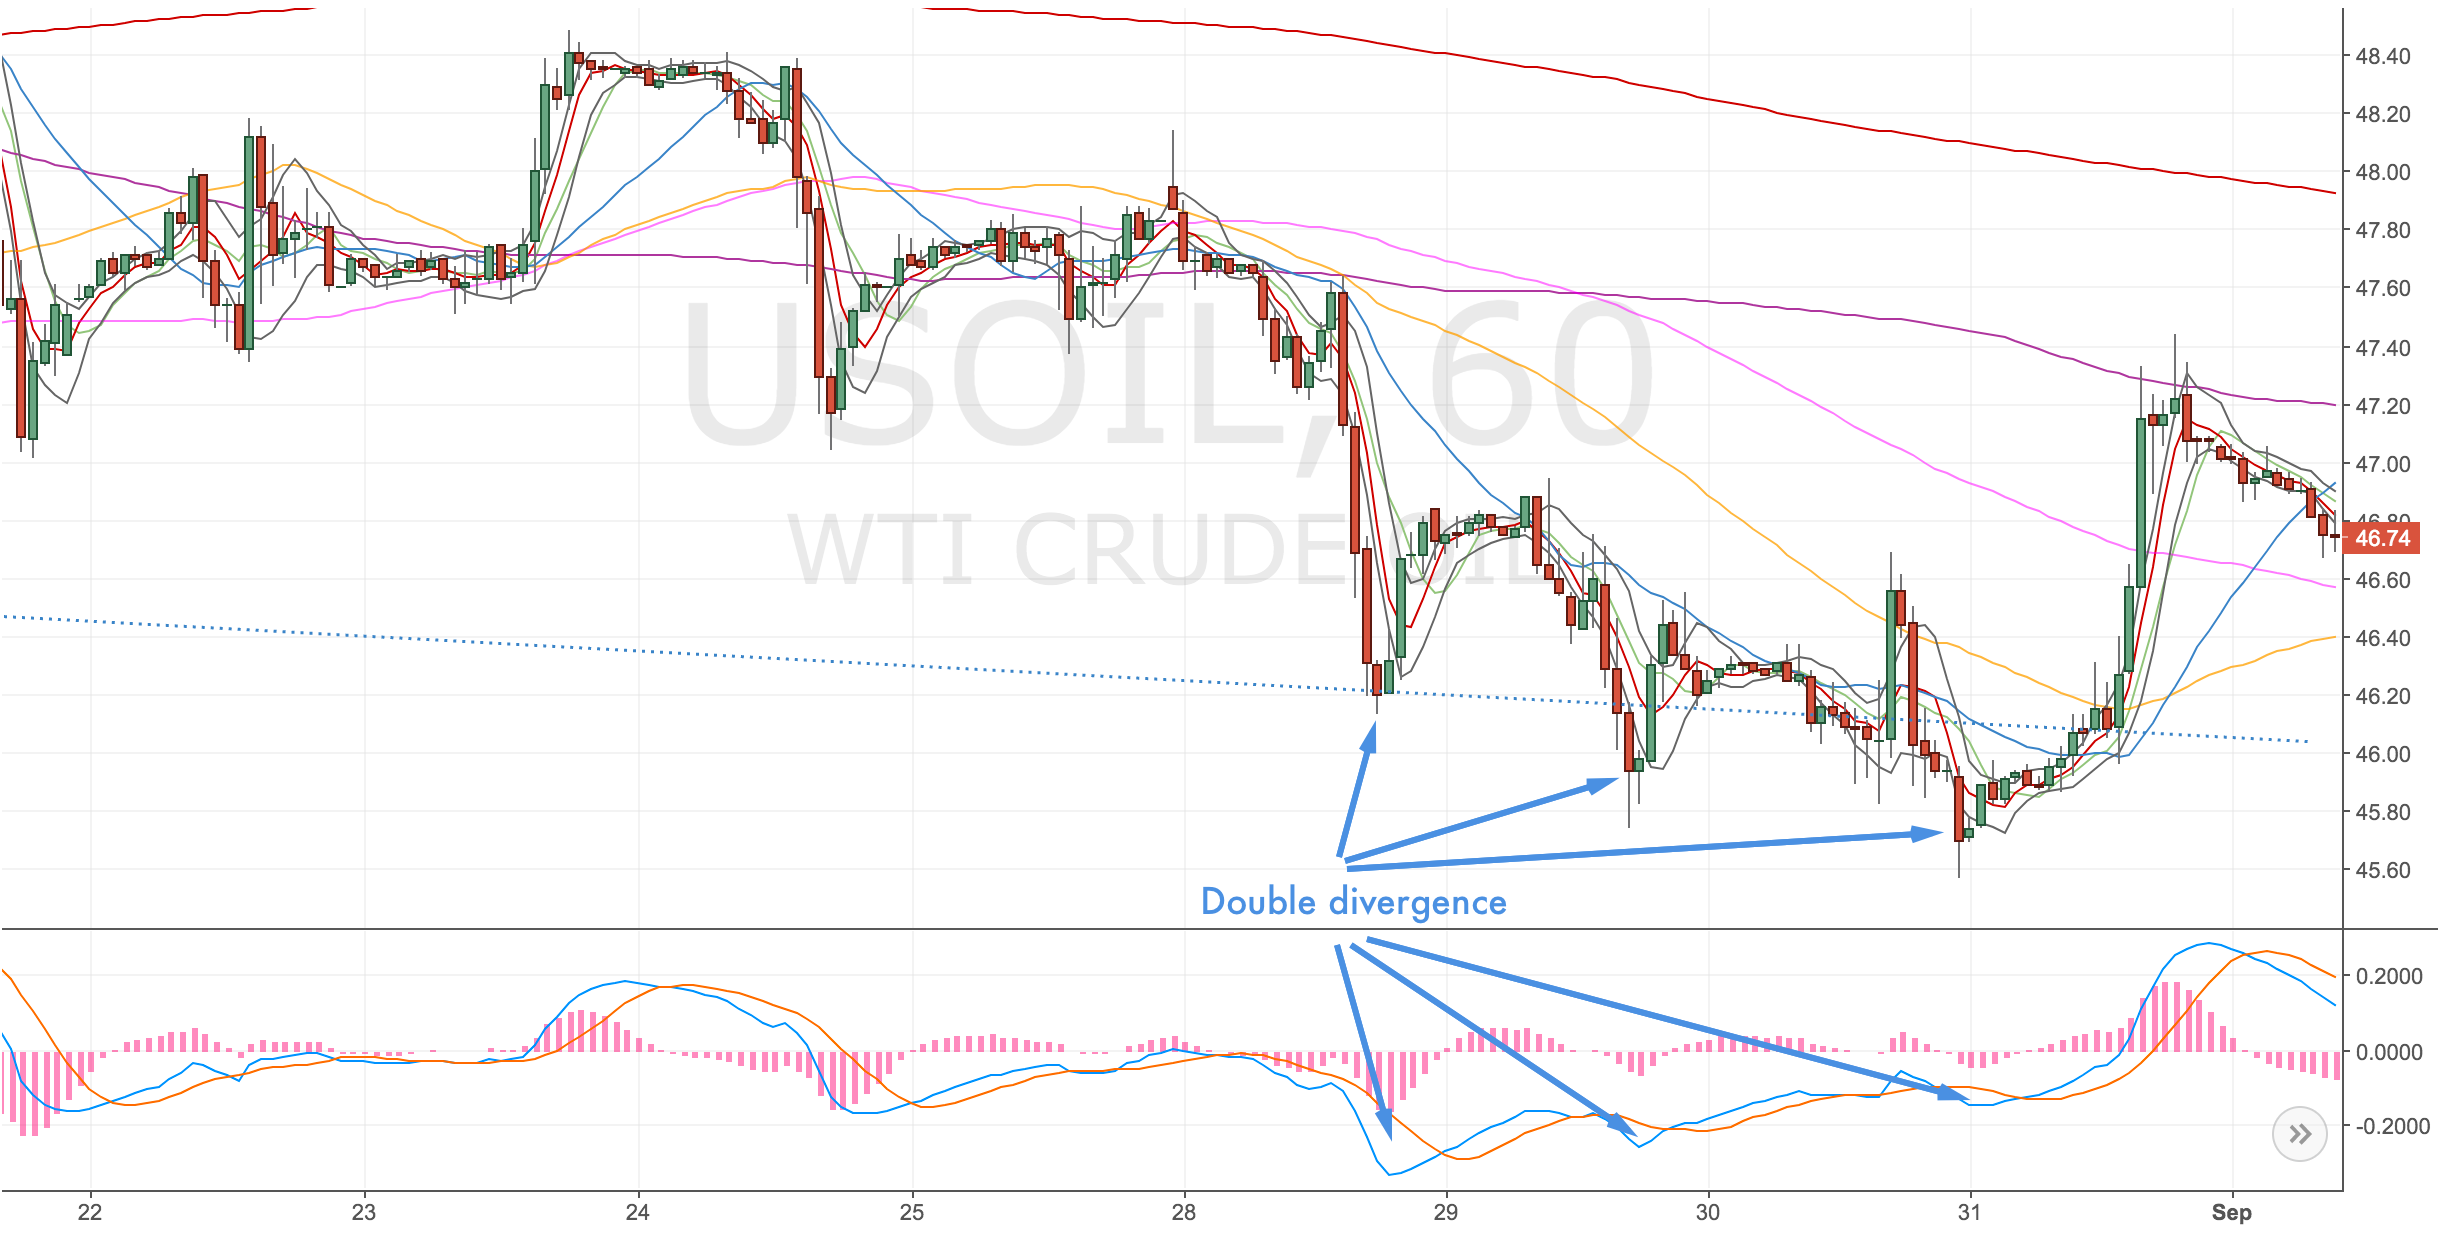
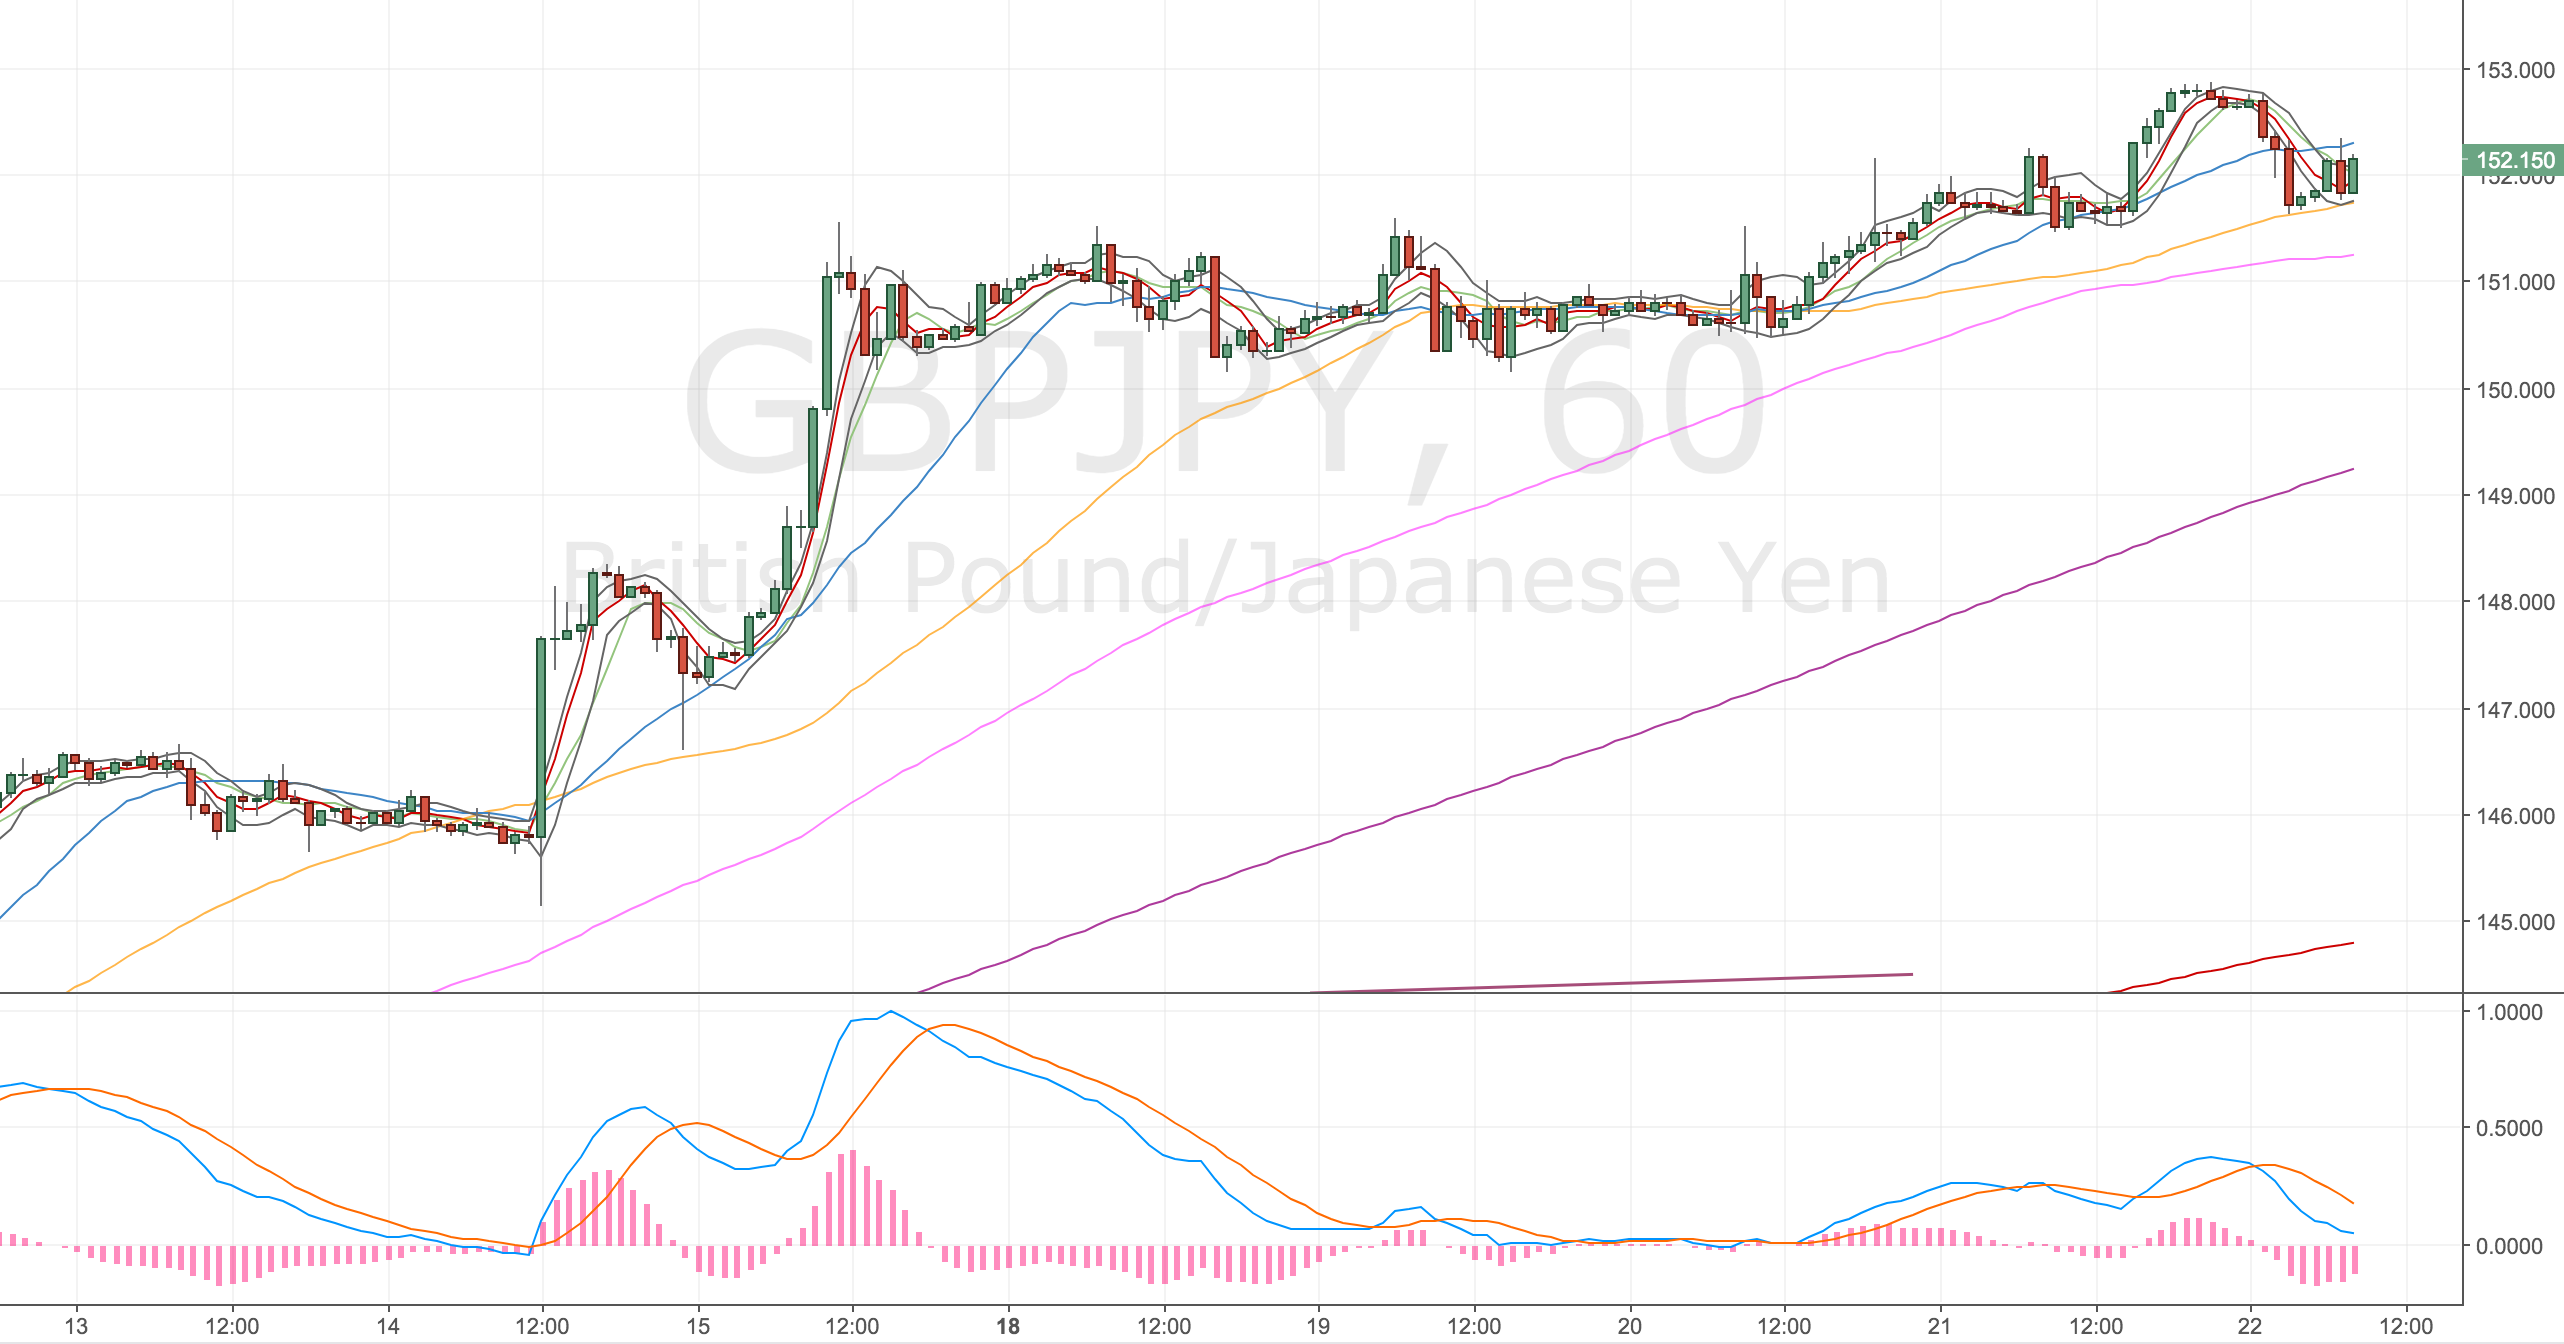
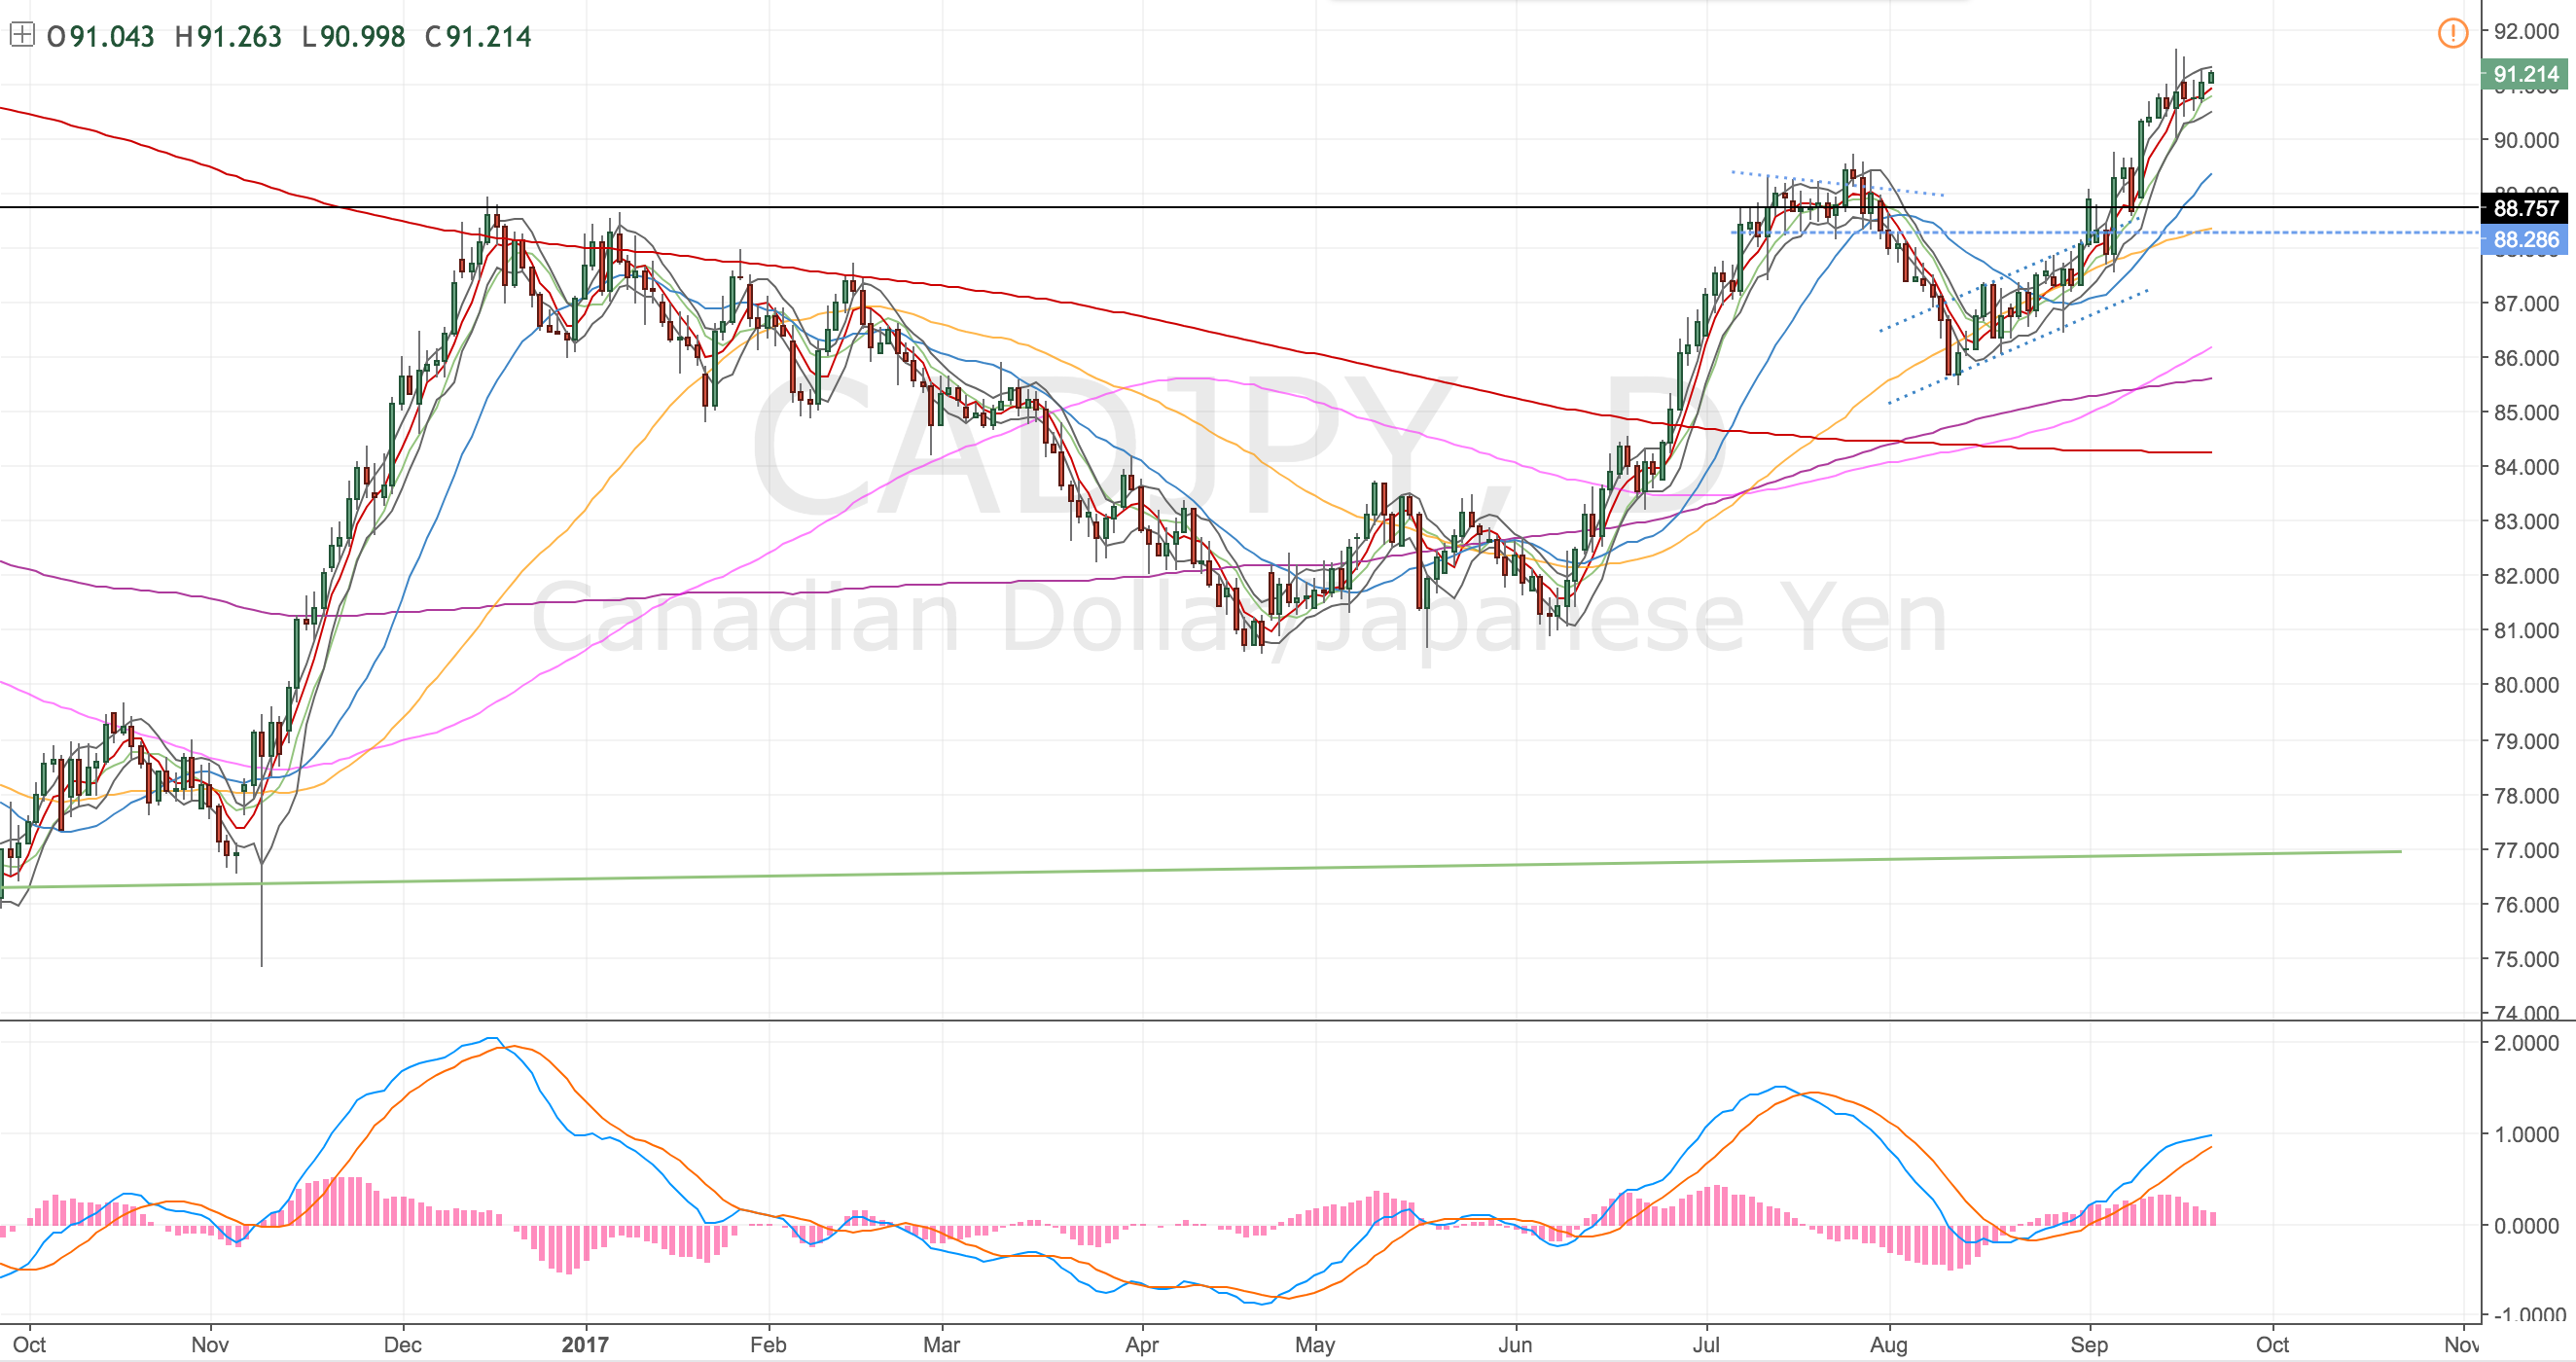
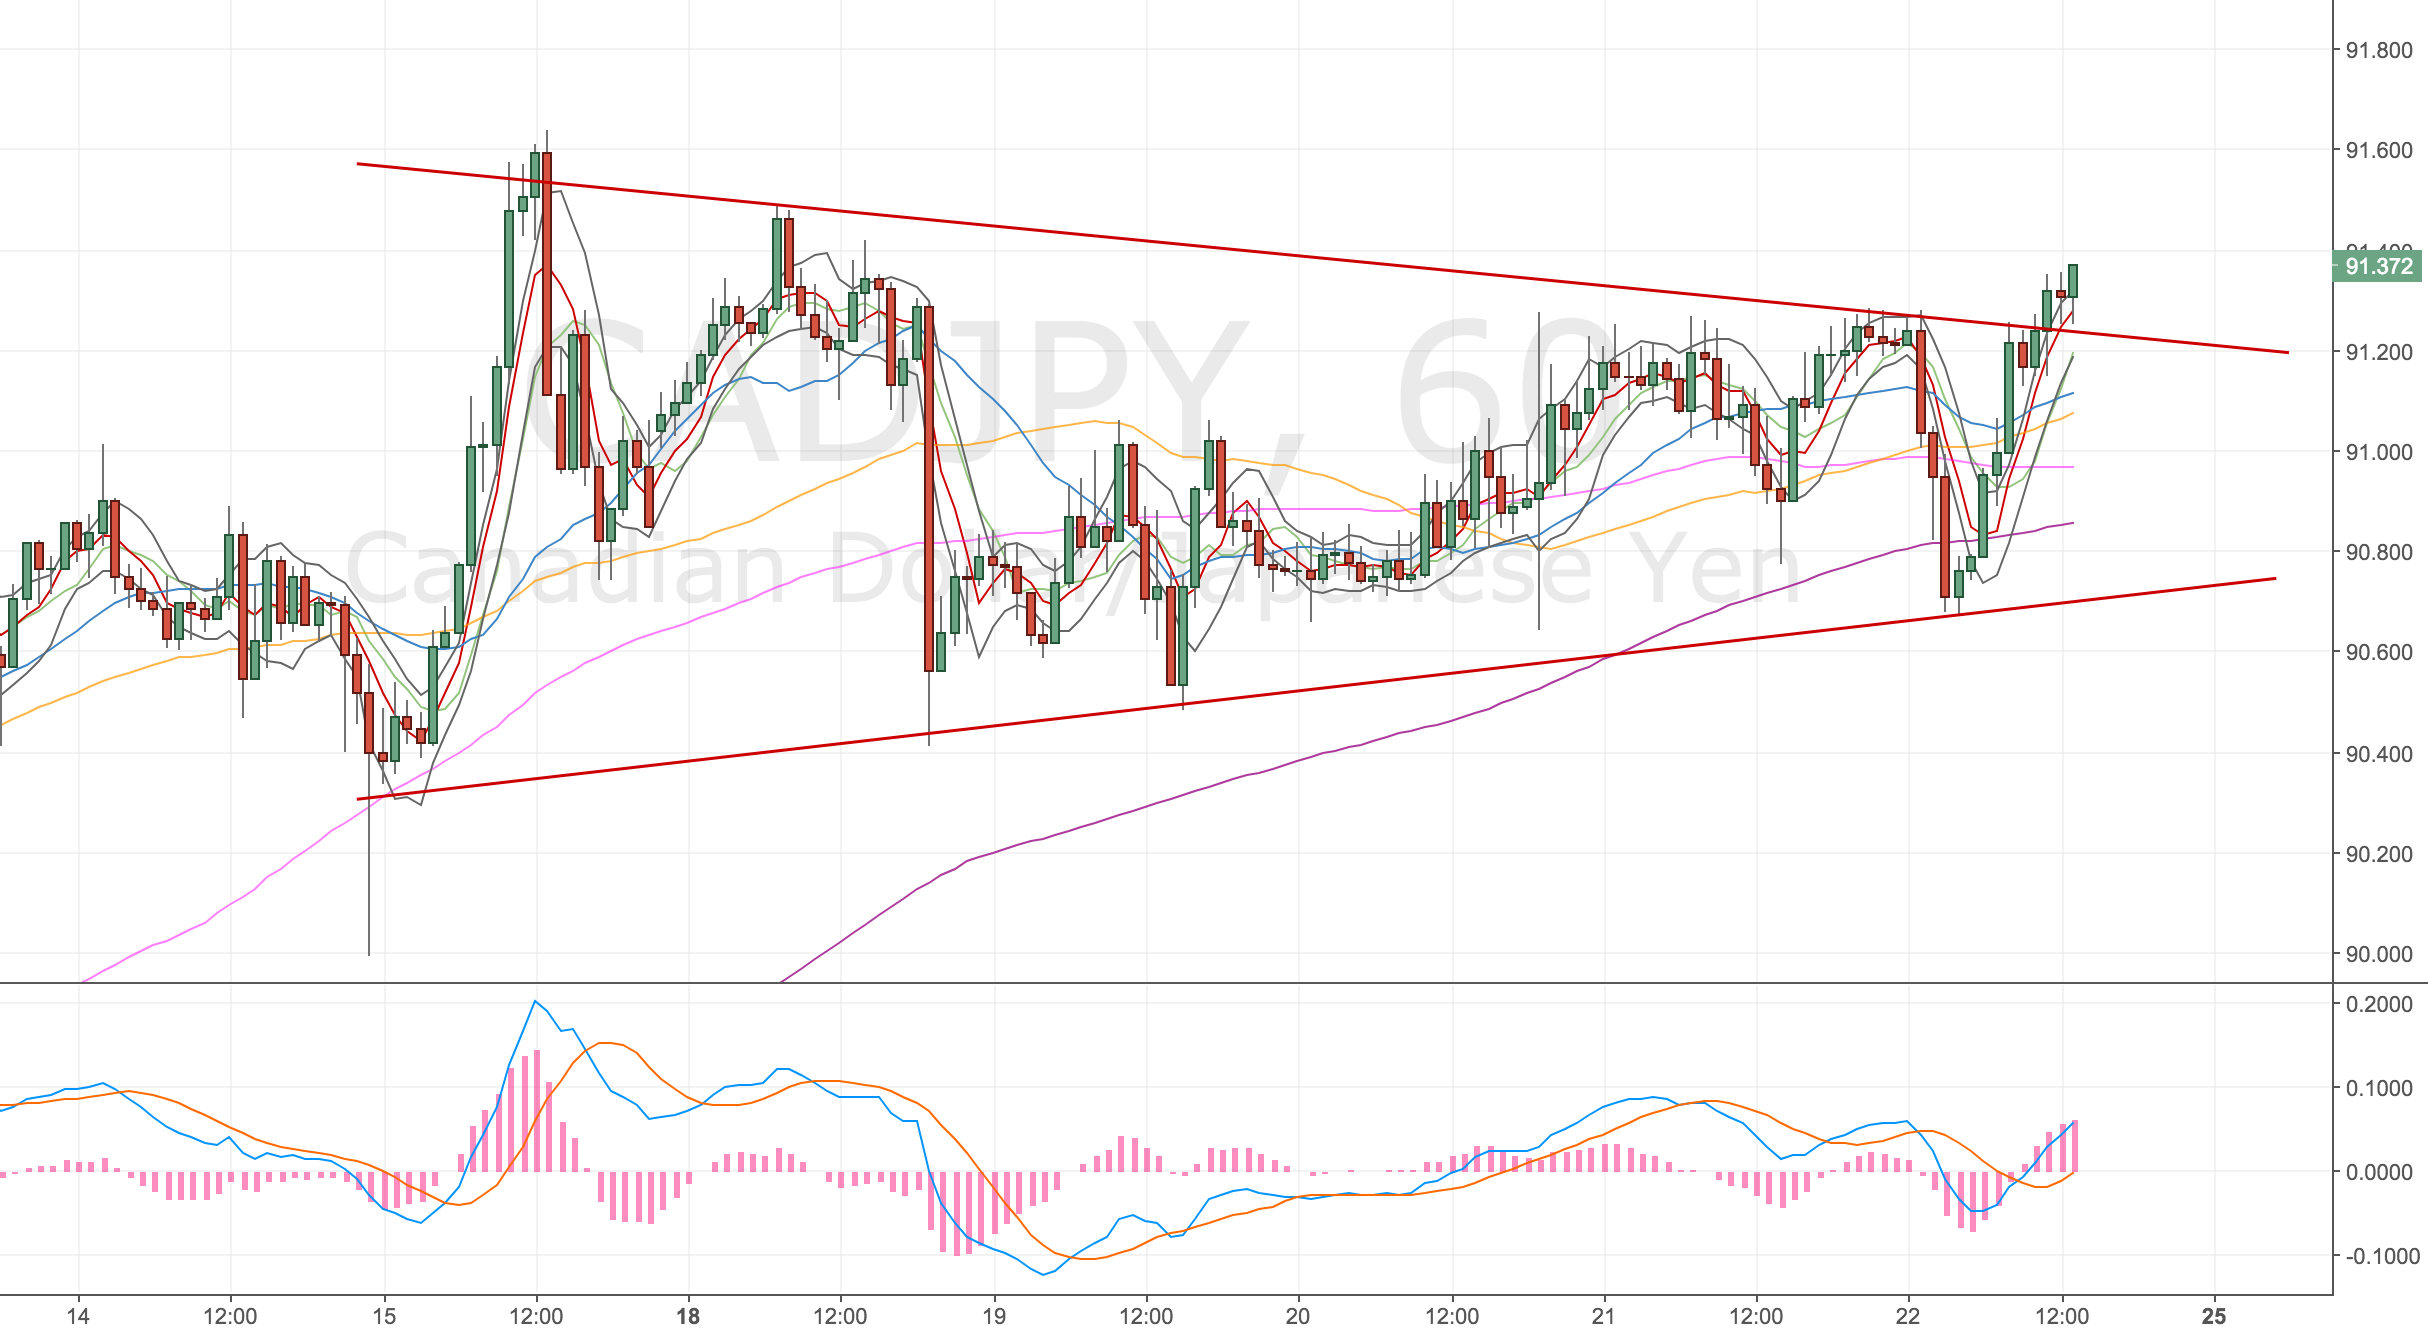
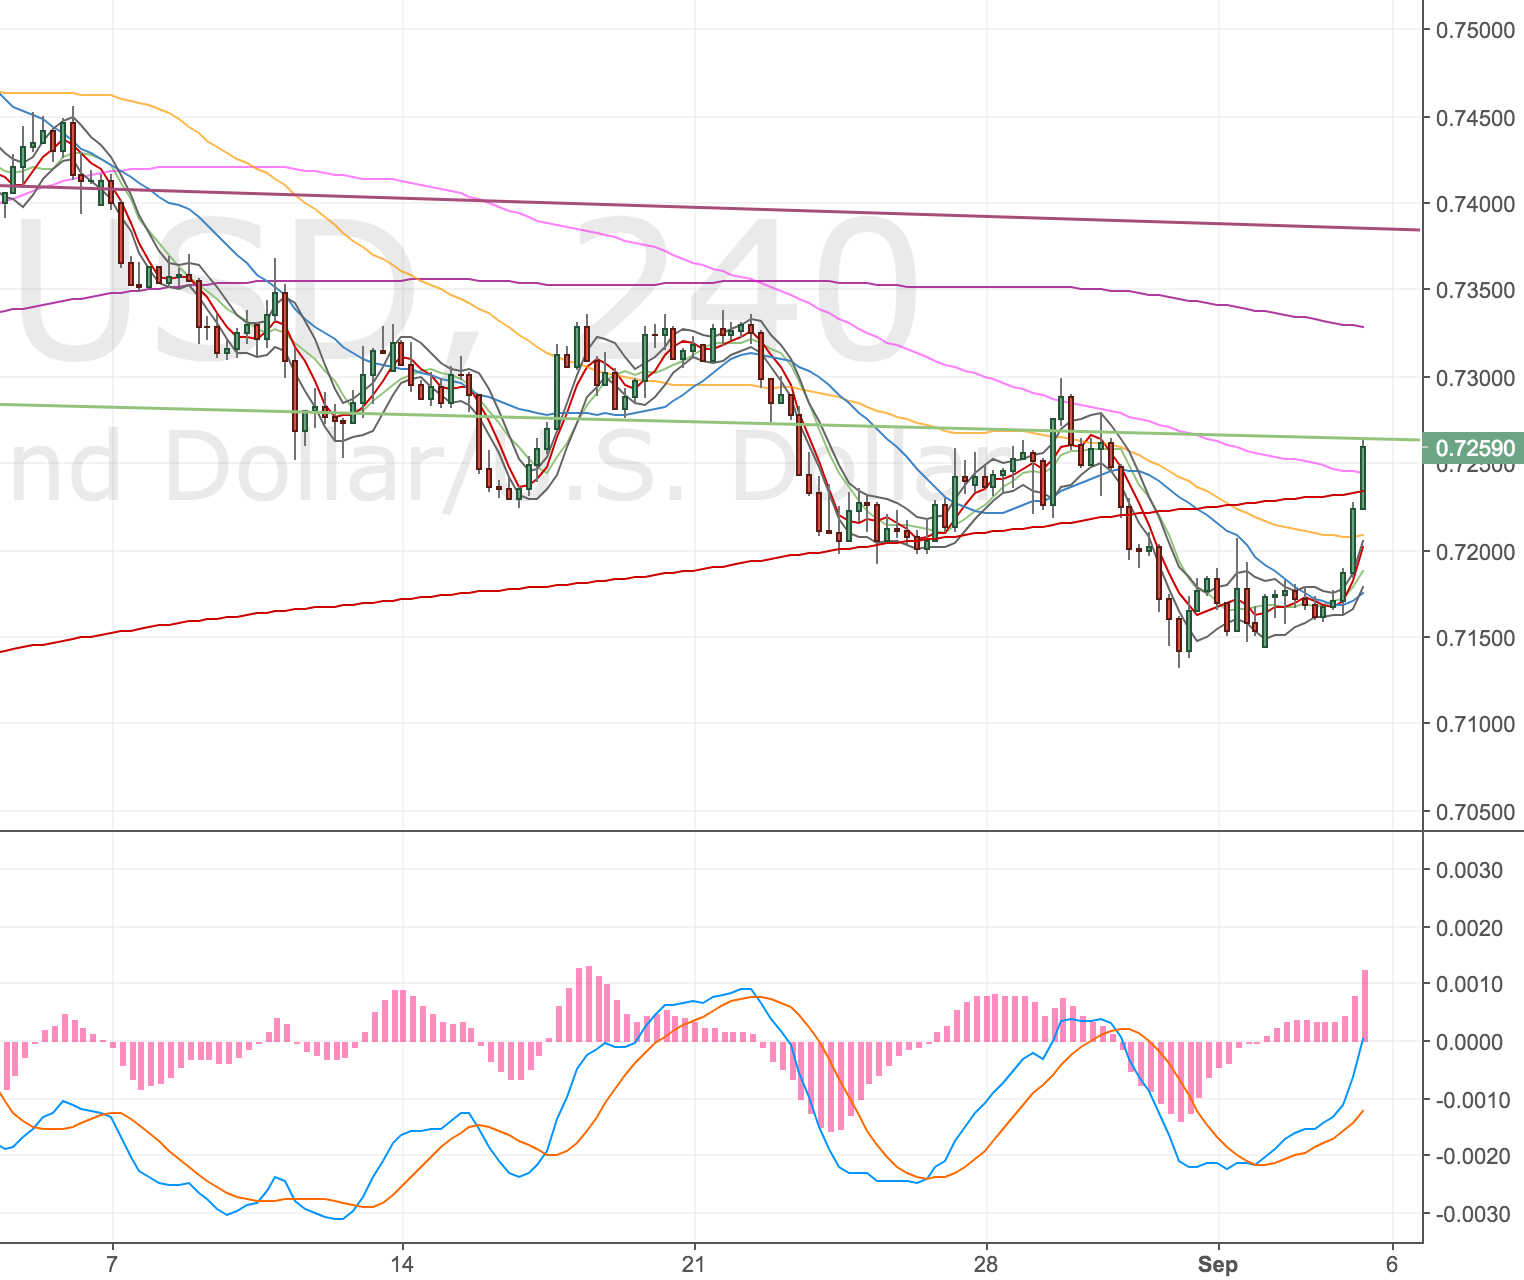
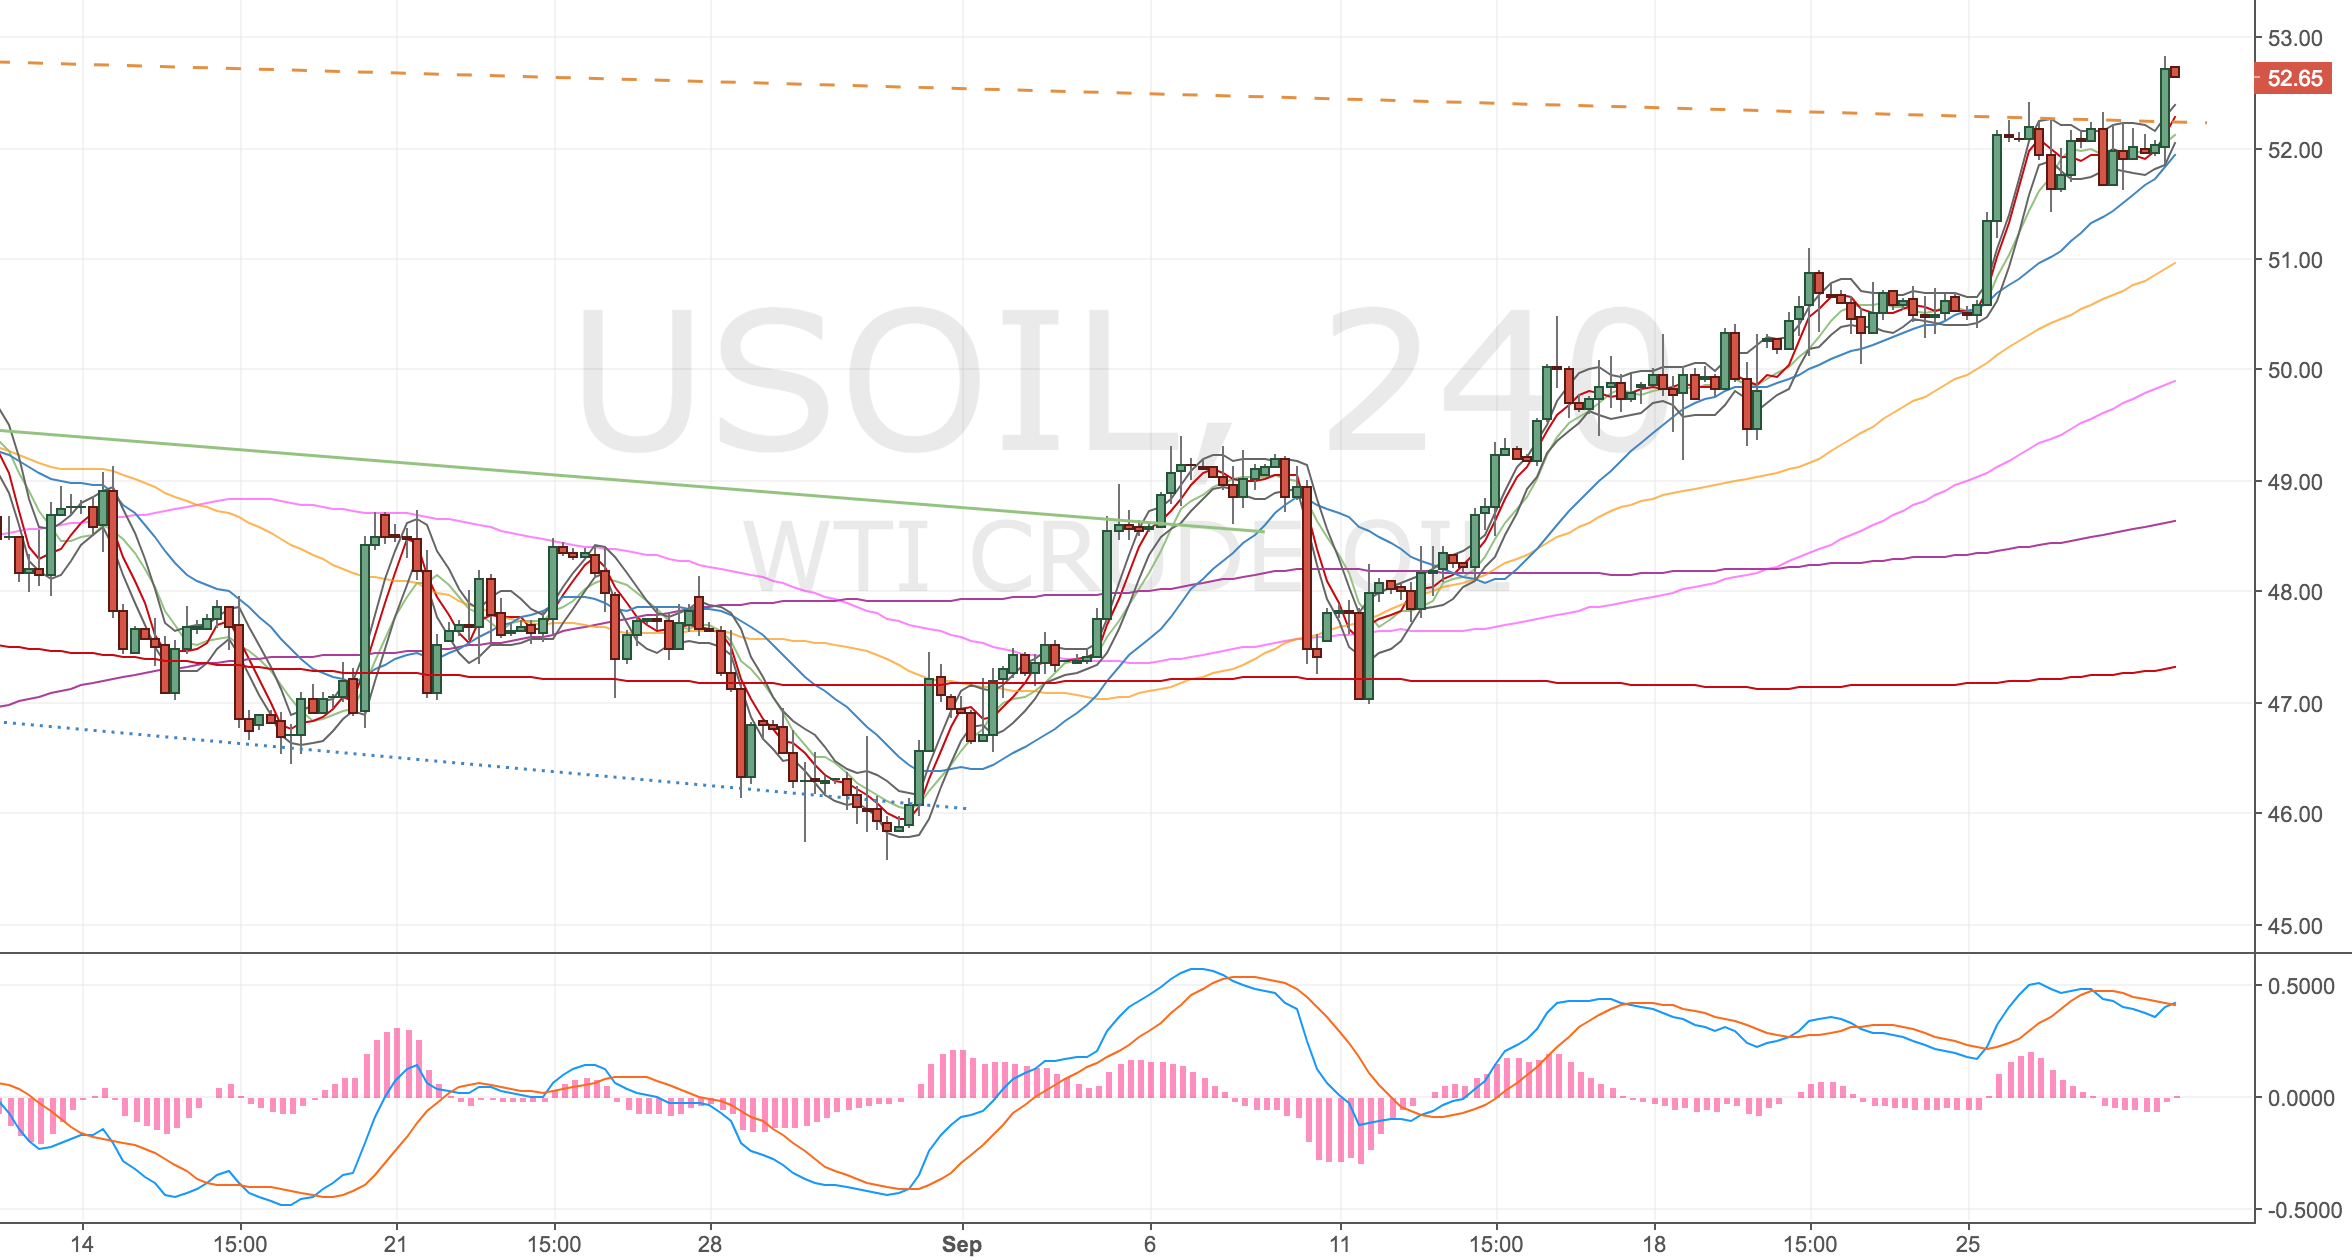
4H Chart – set up
Double divergence.
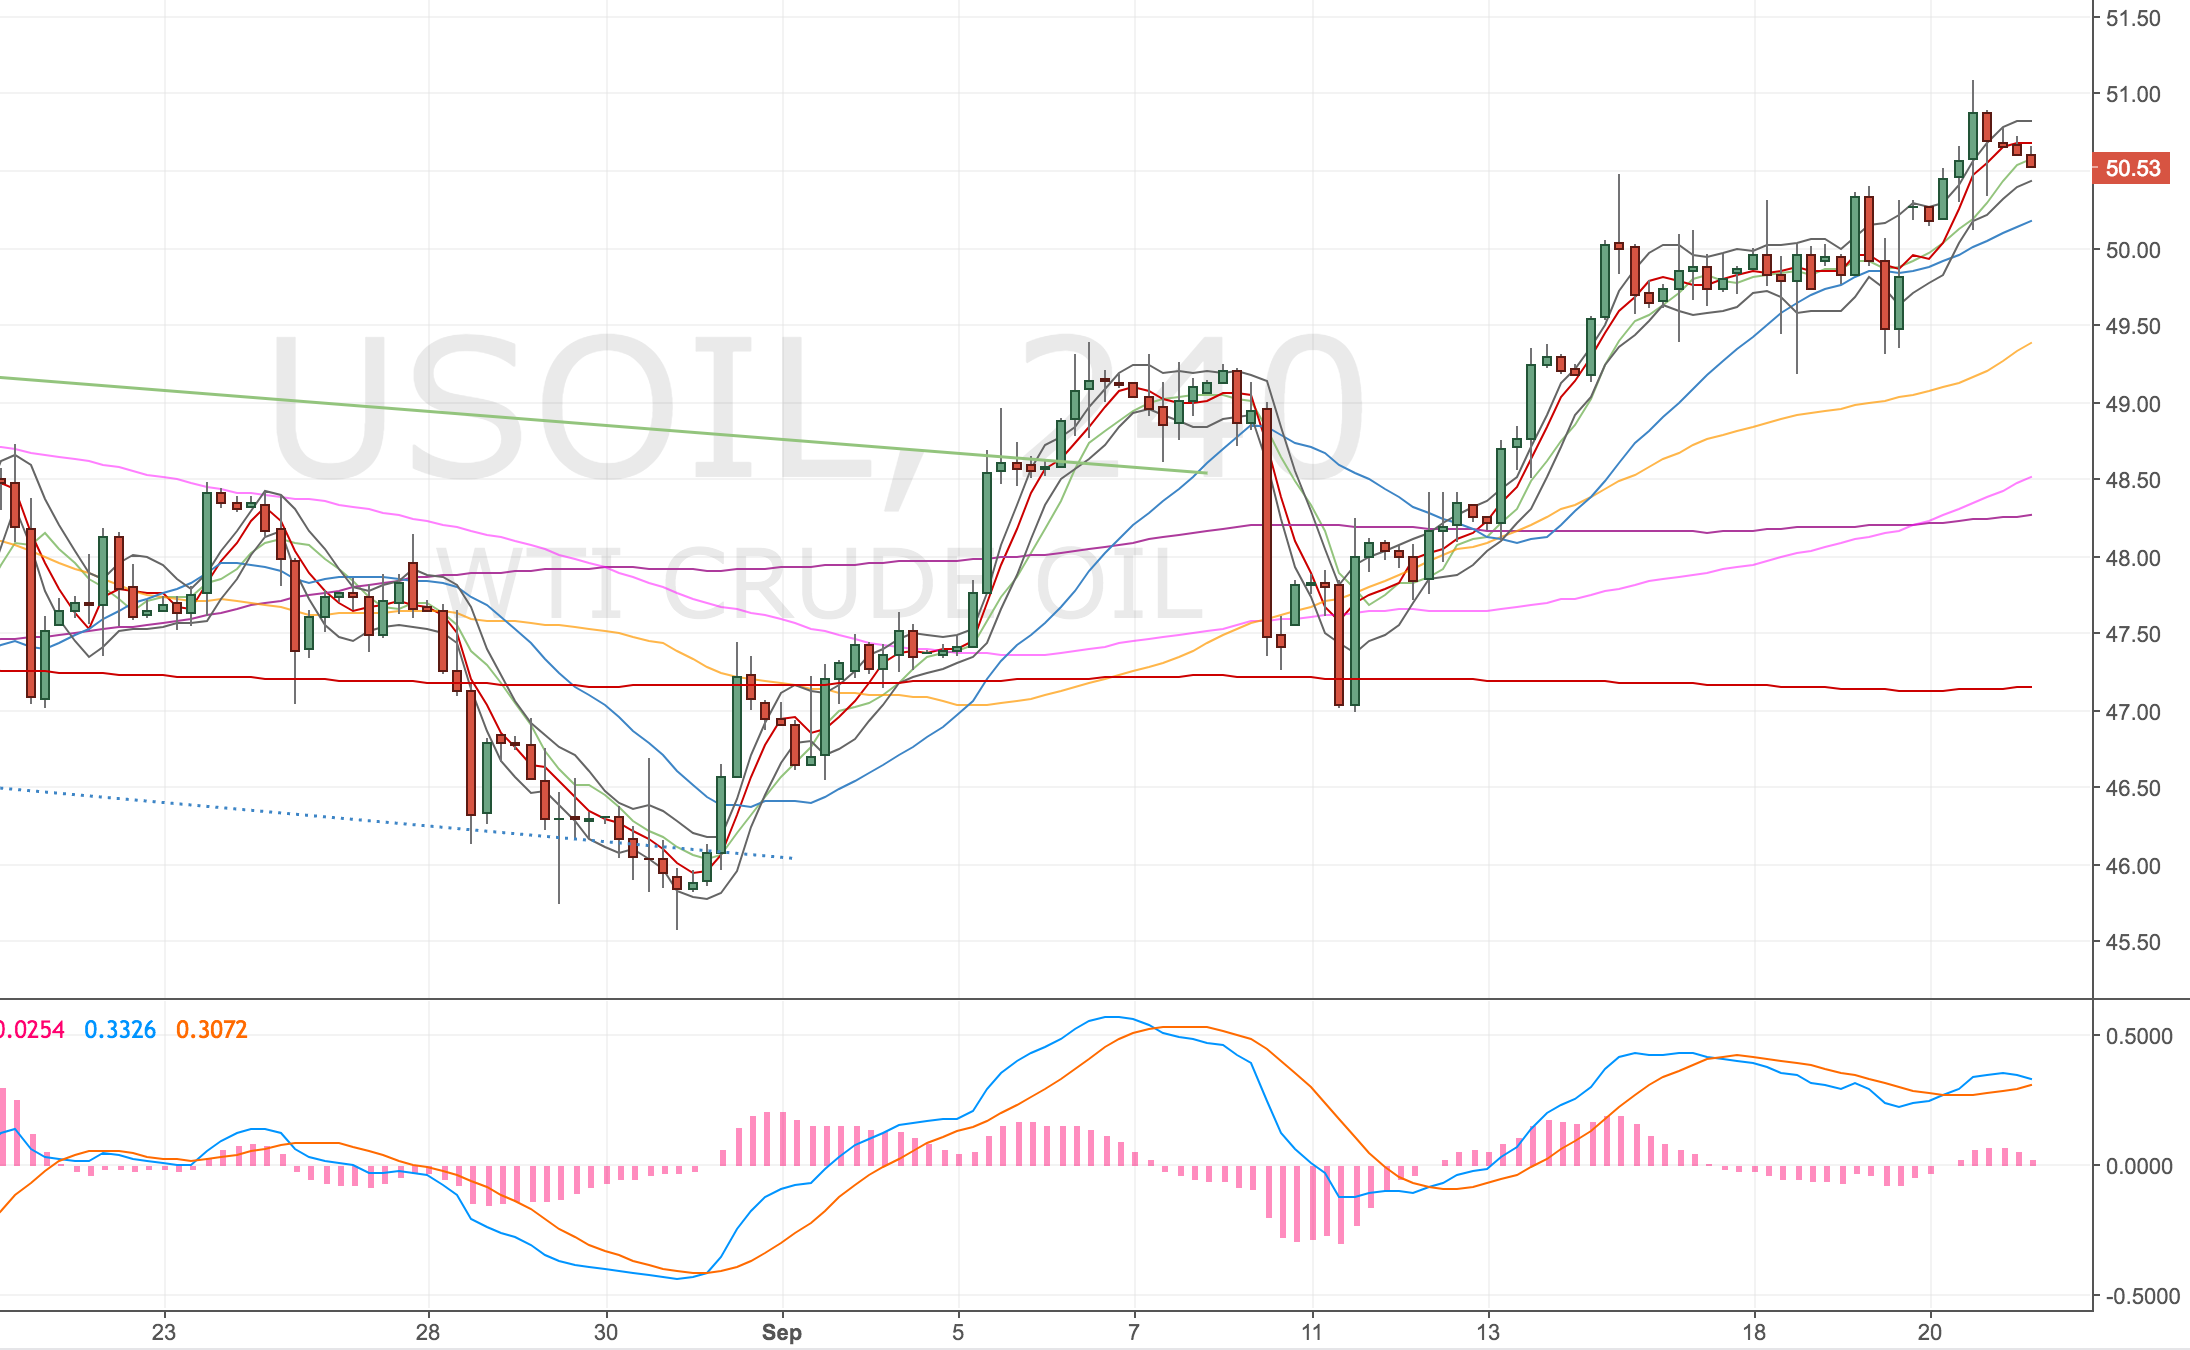
Oil 4H Chart – 21 Sep 17
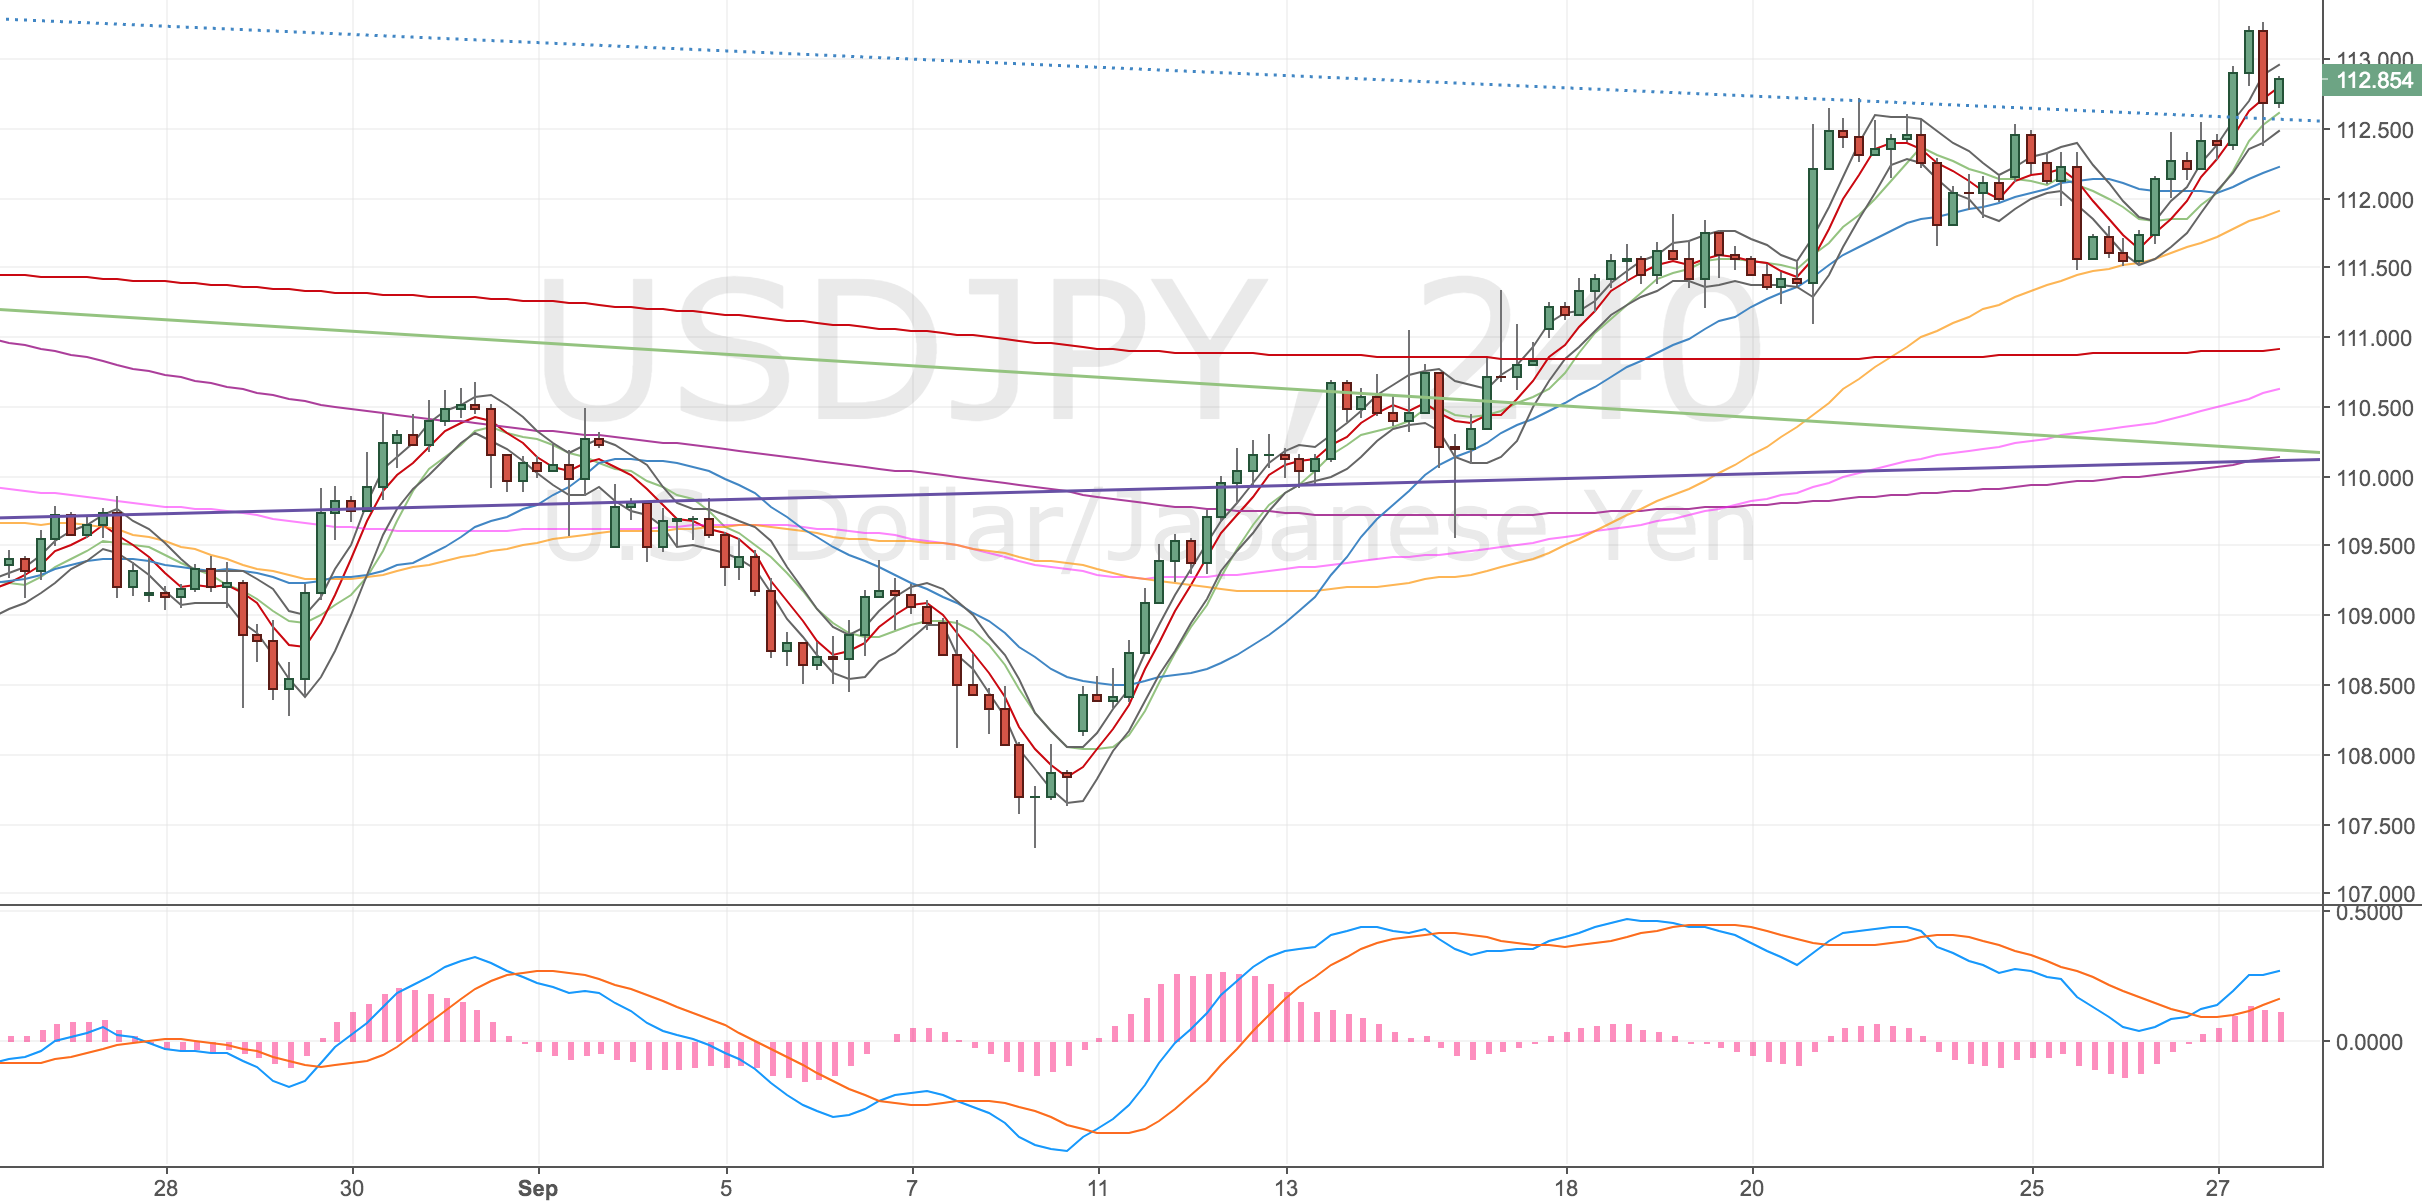
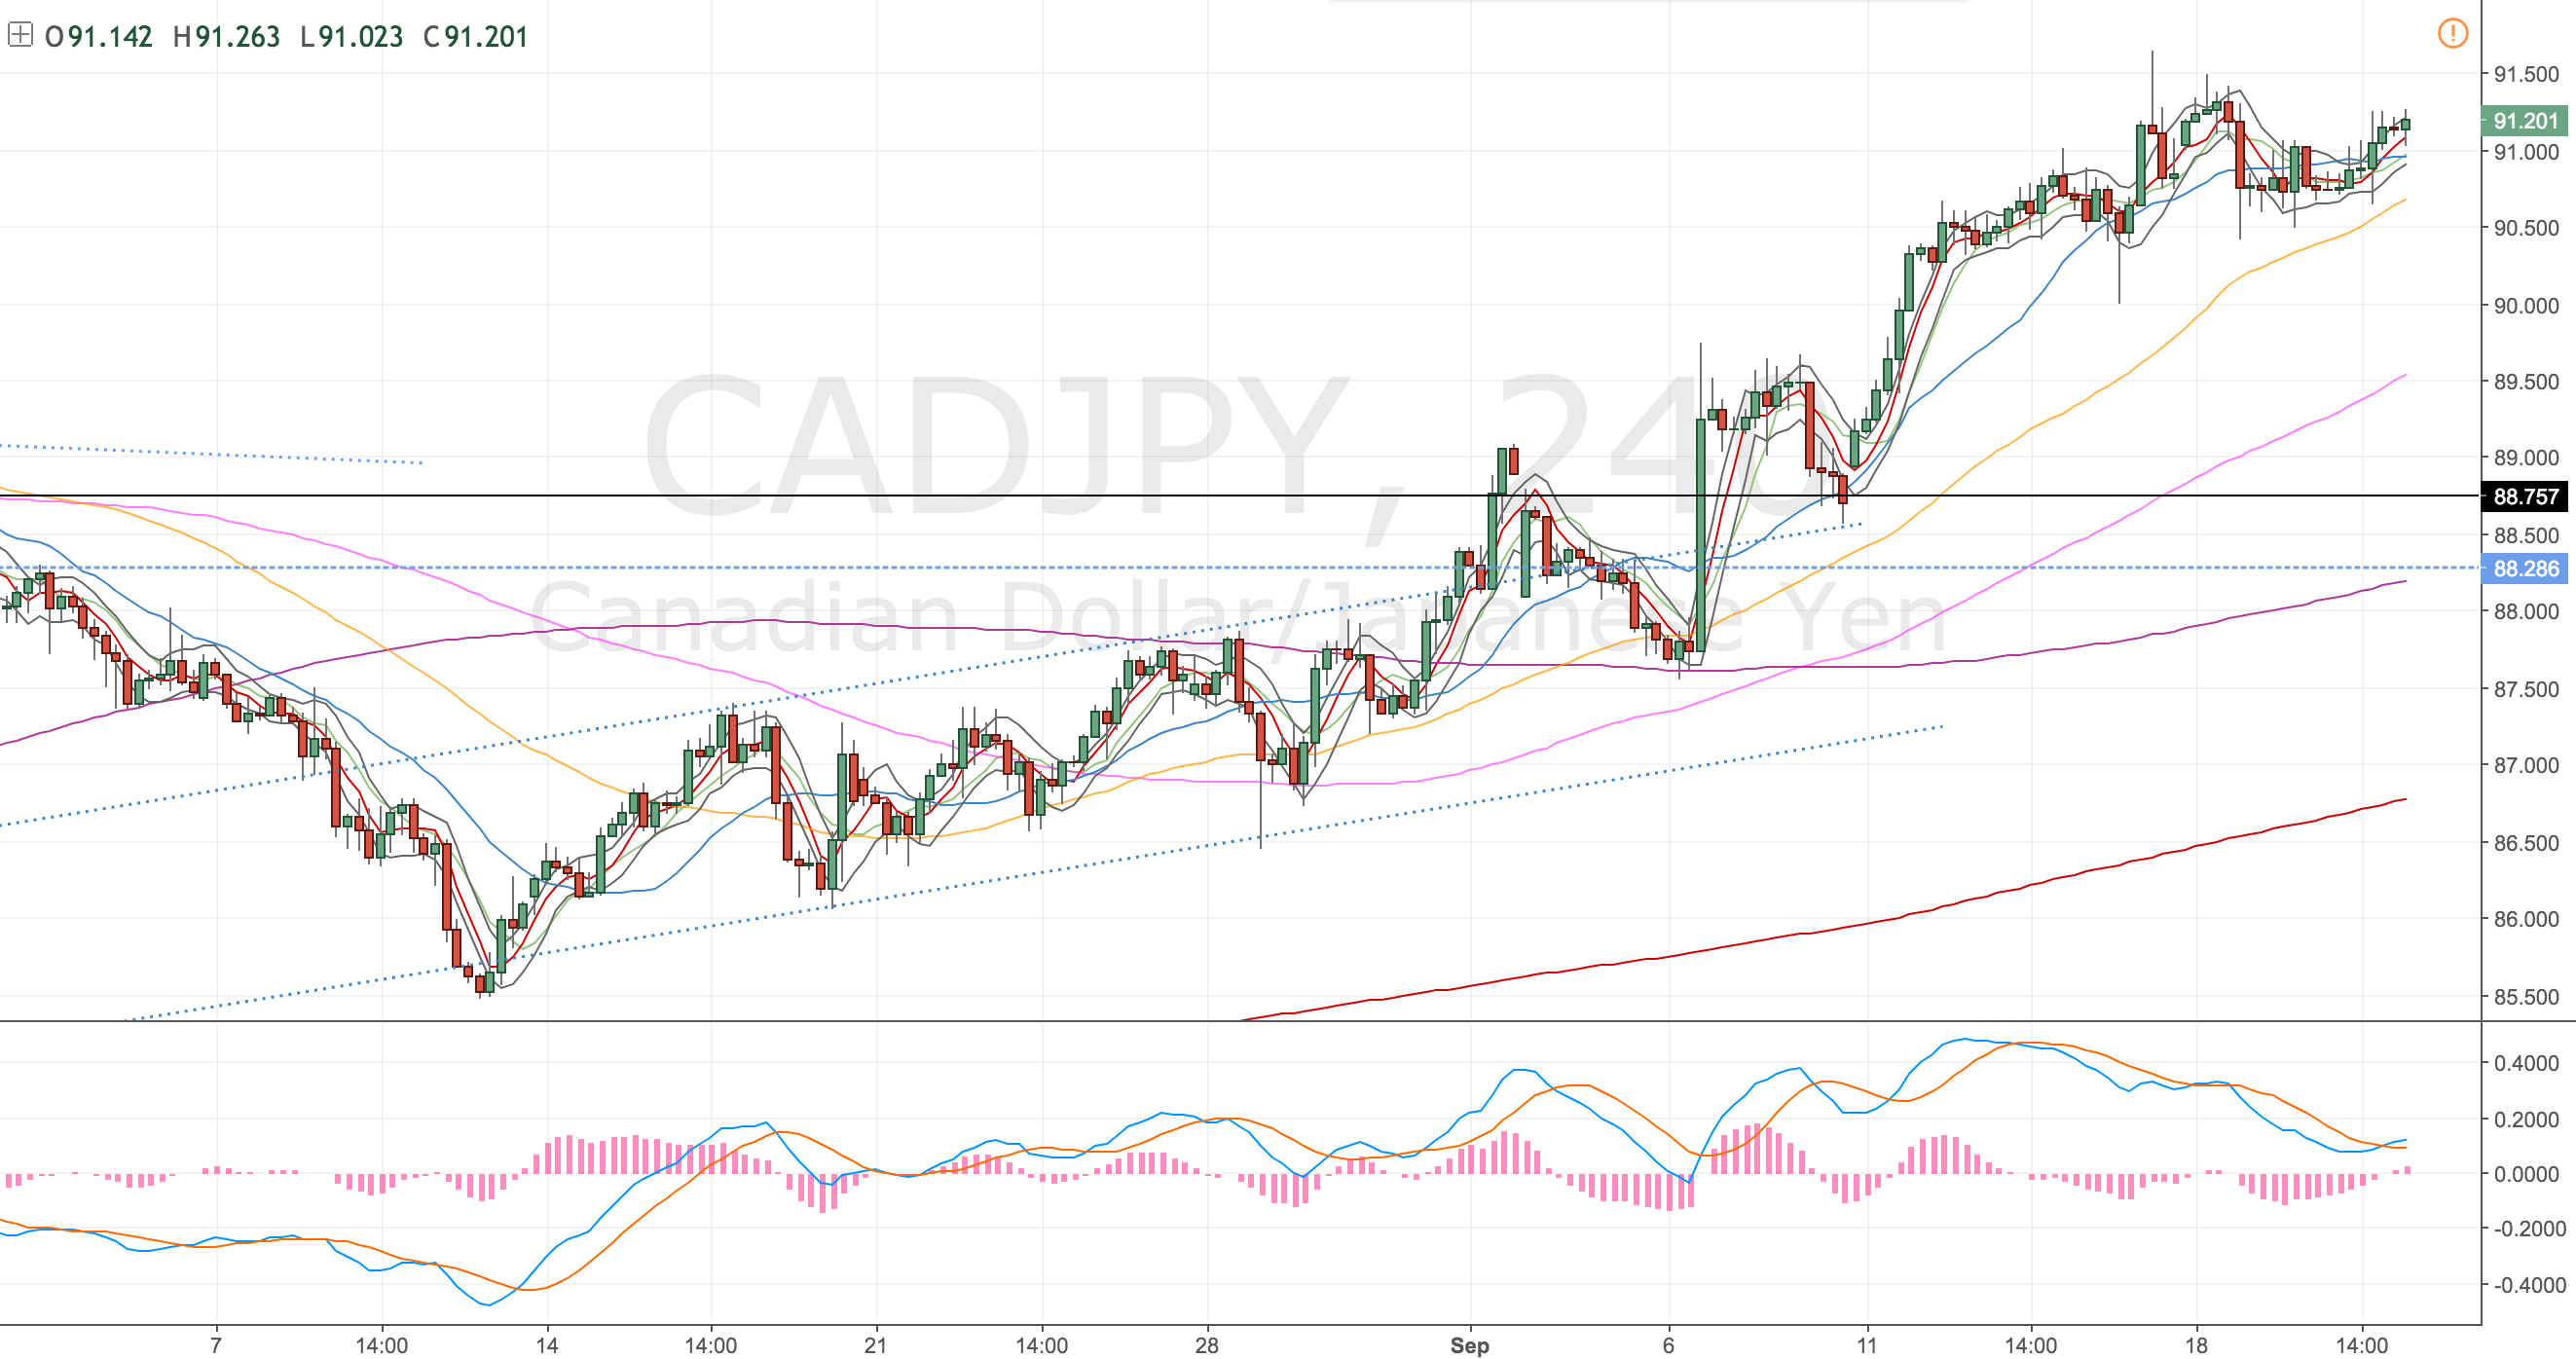
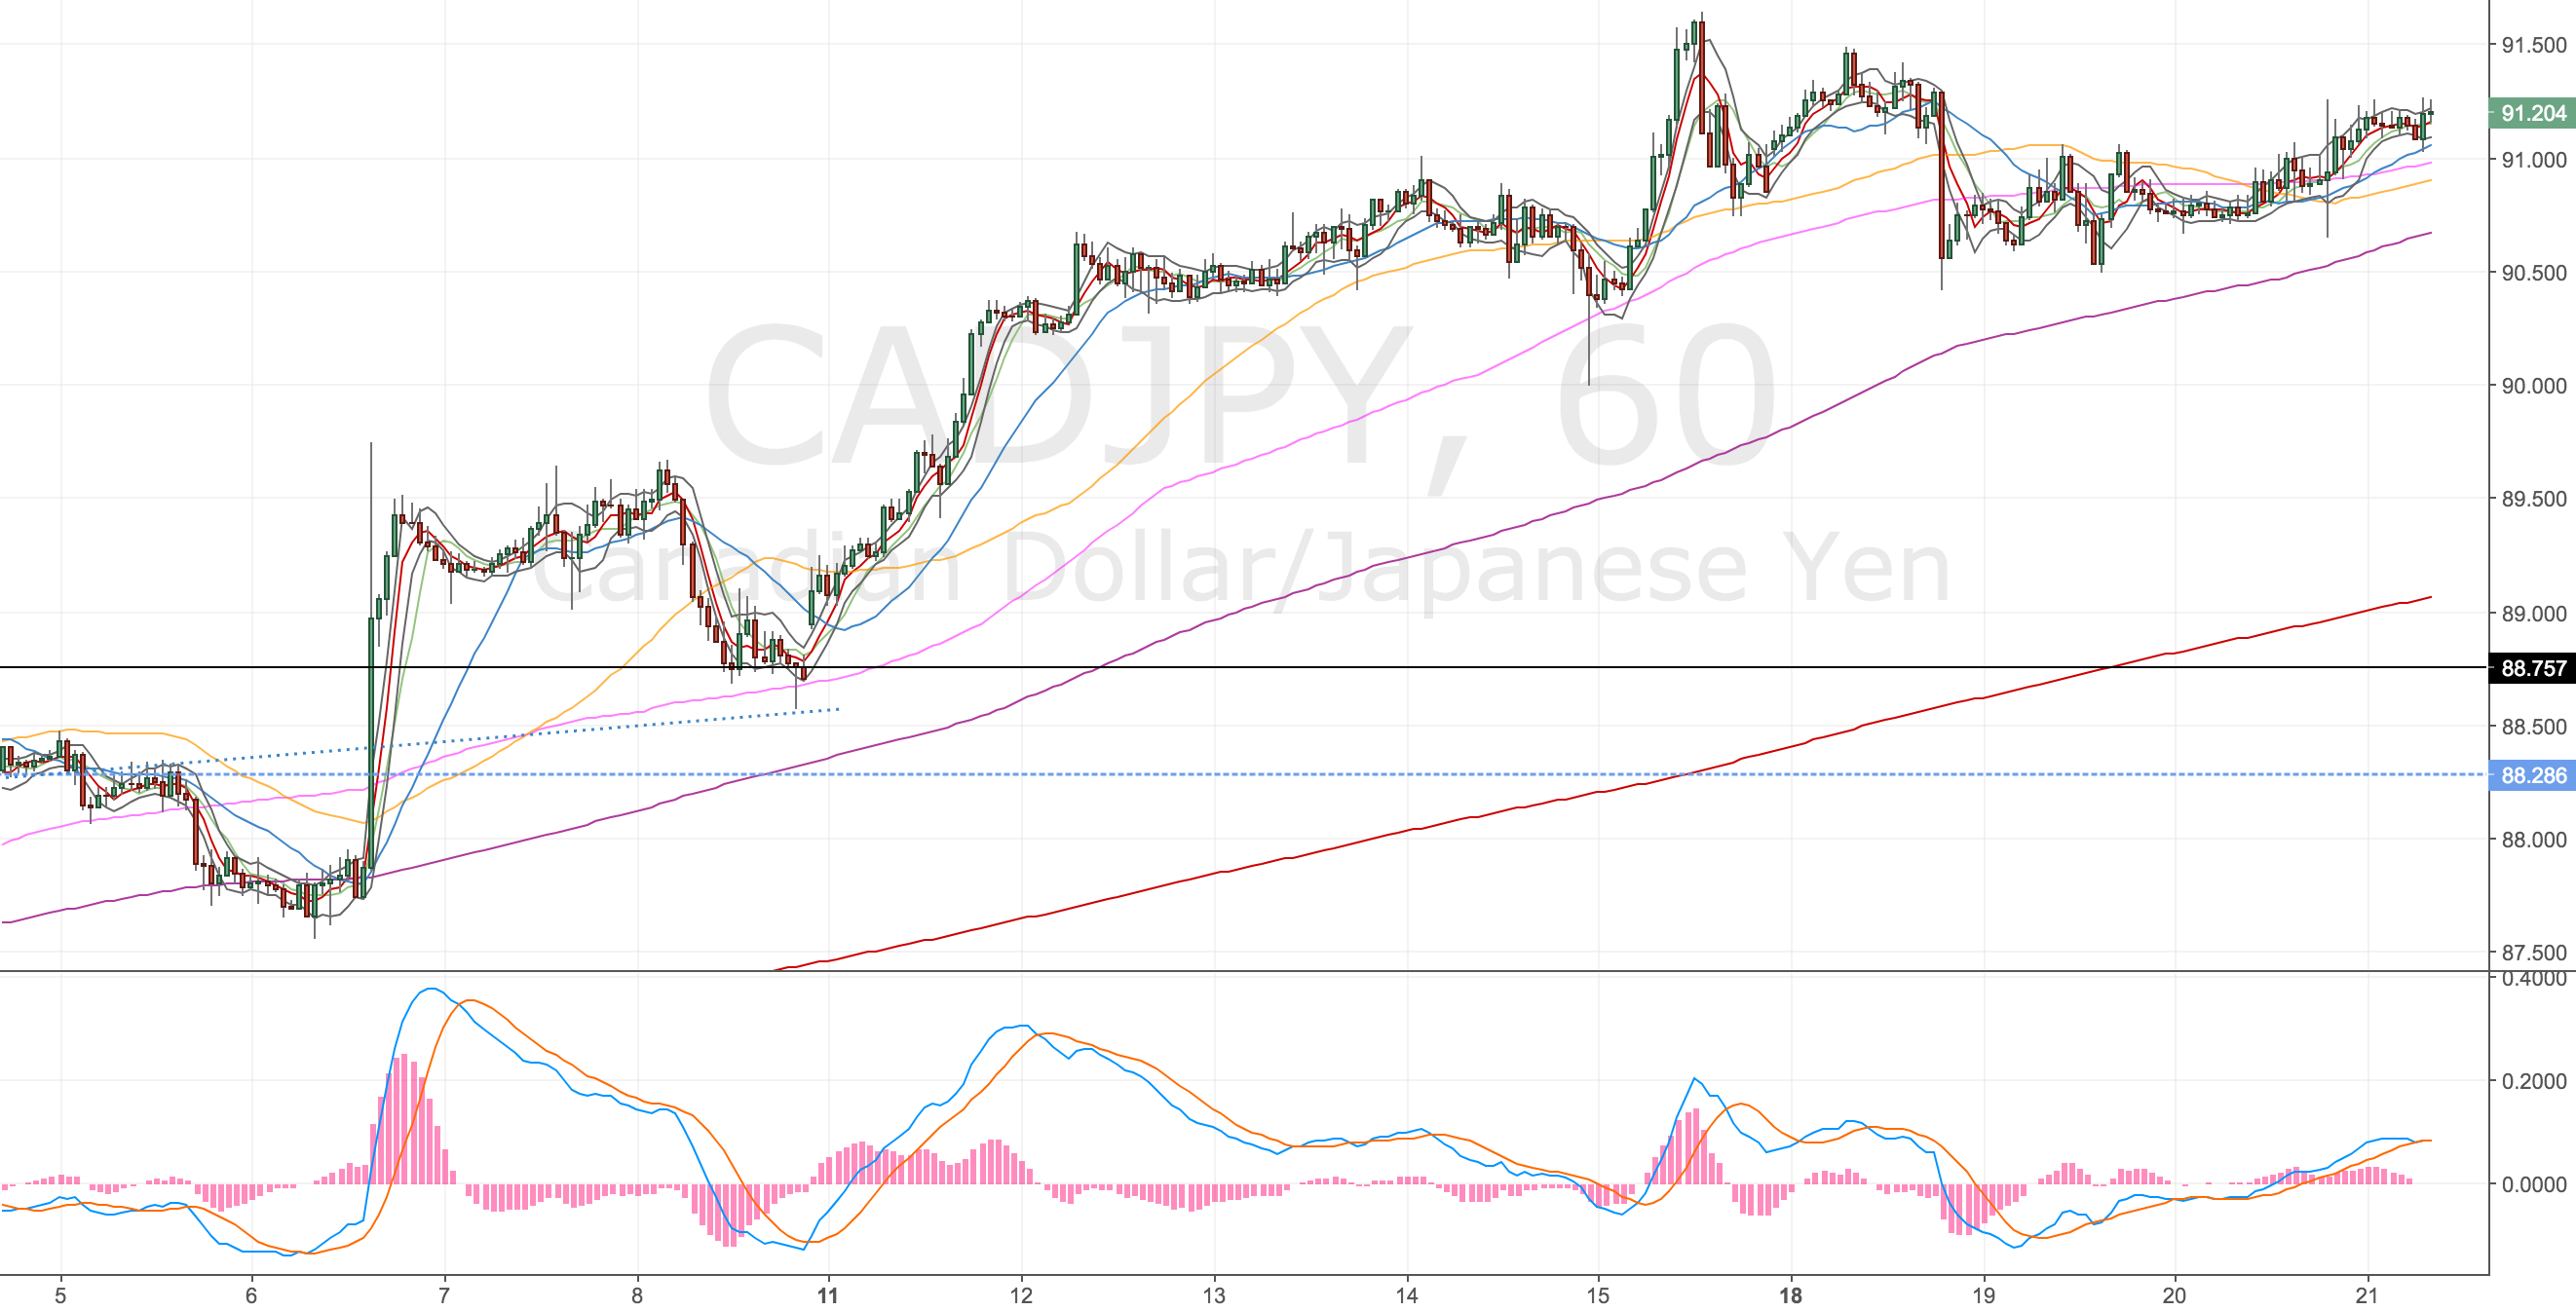
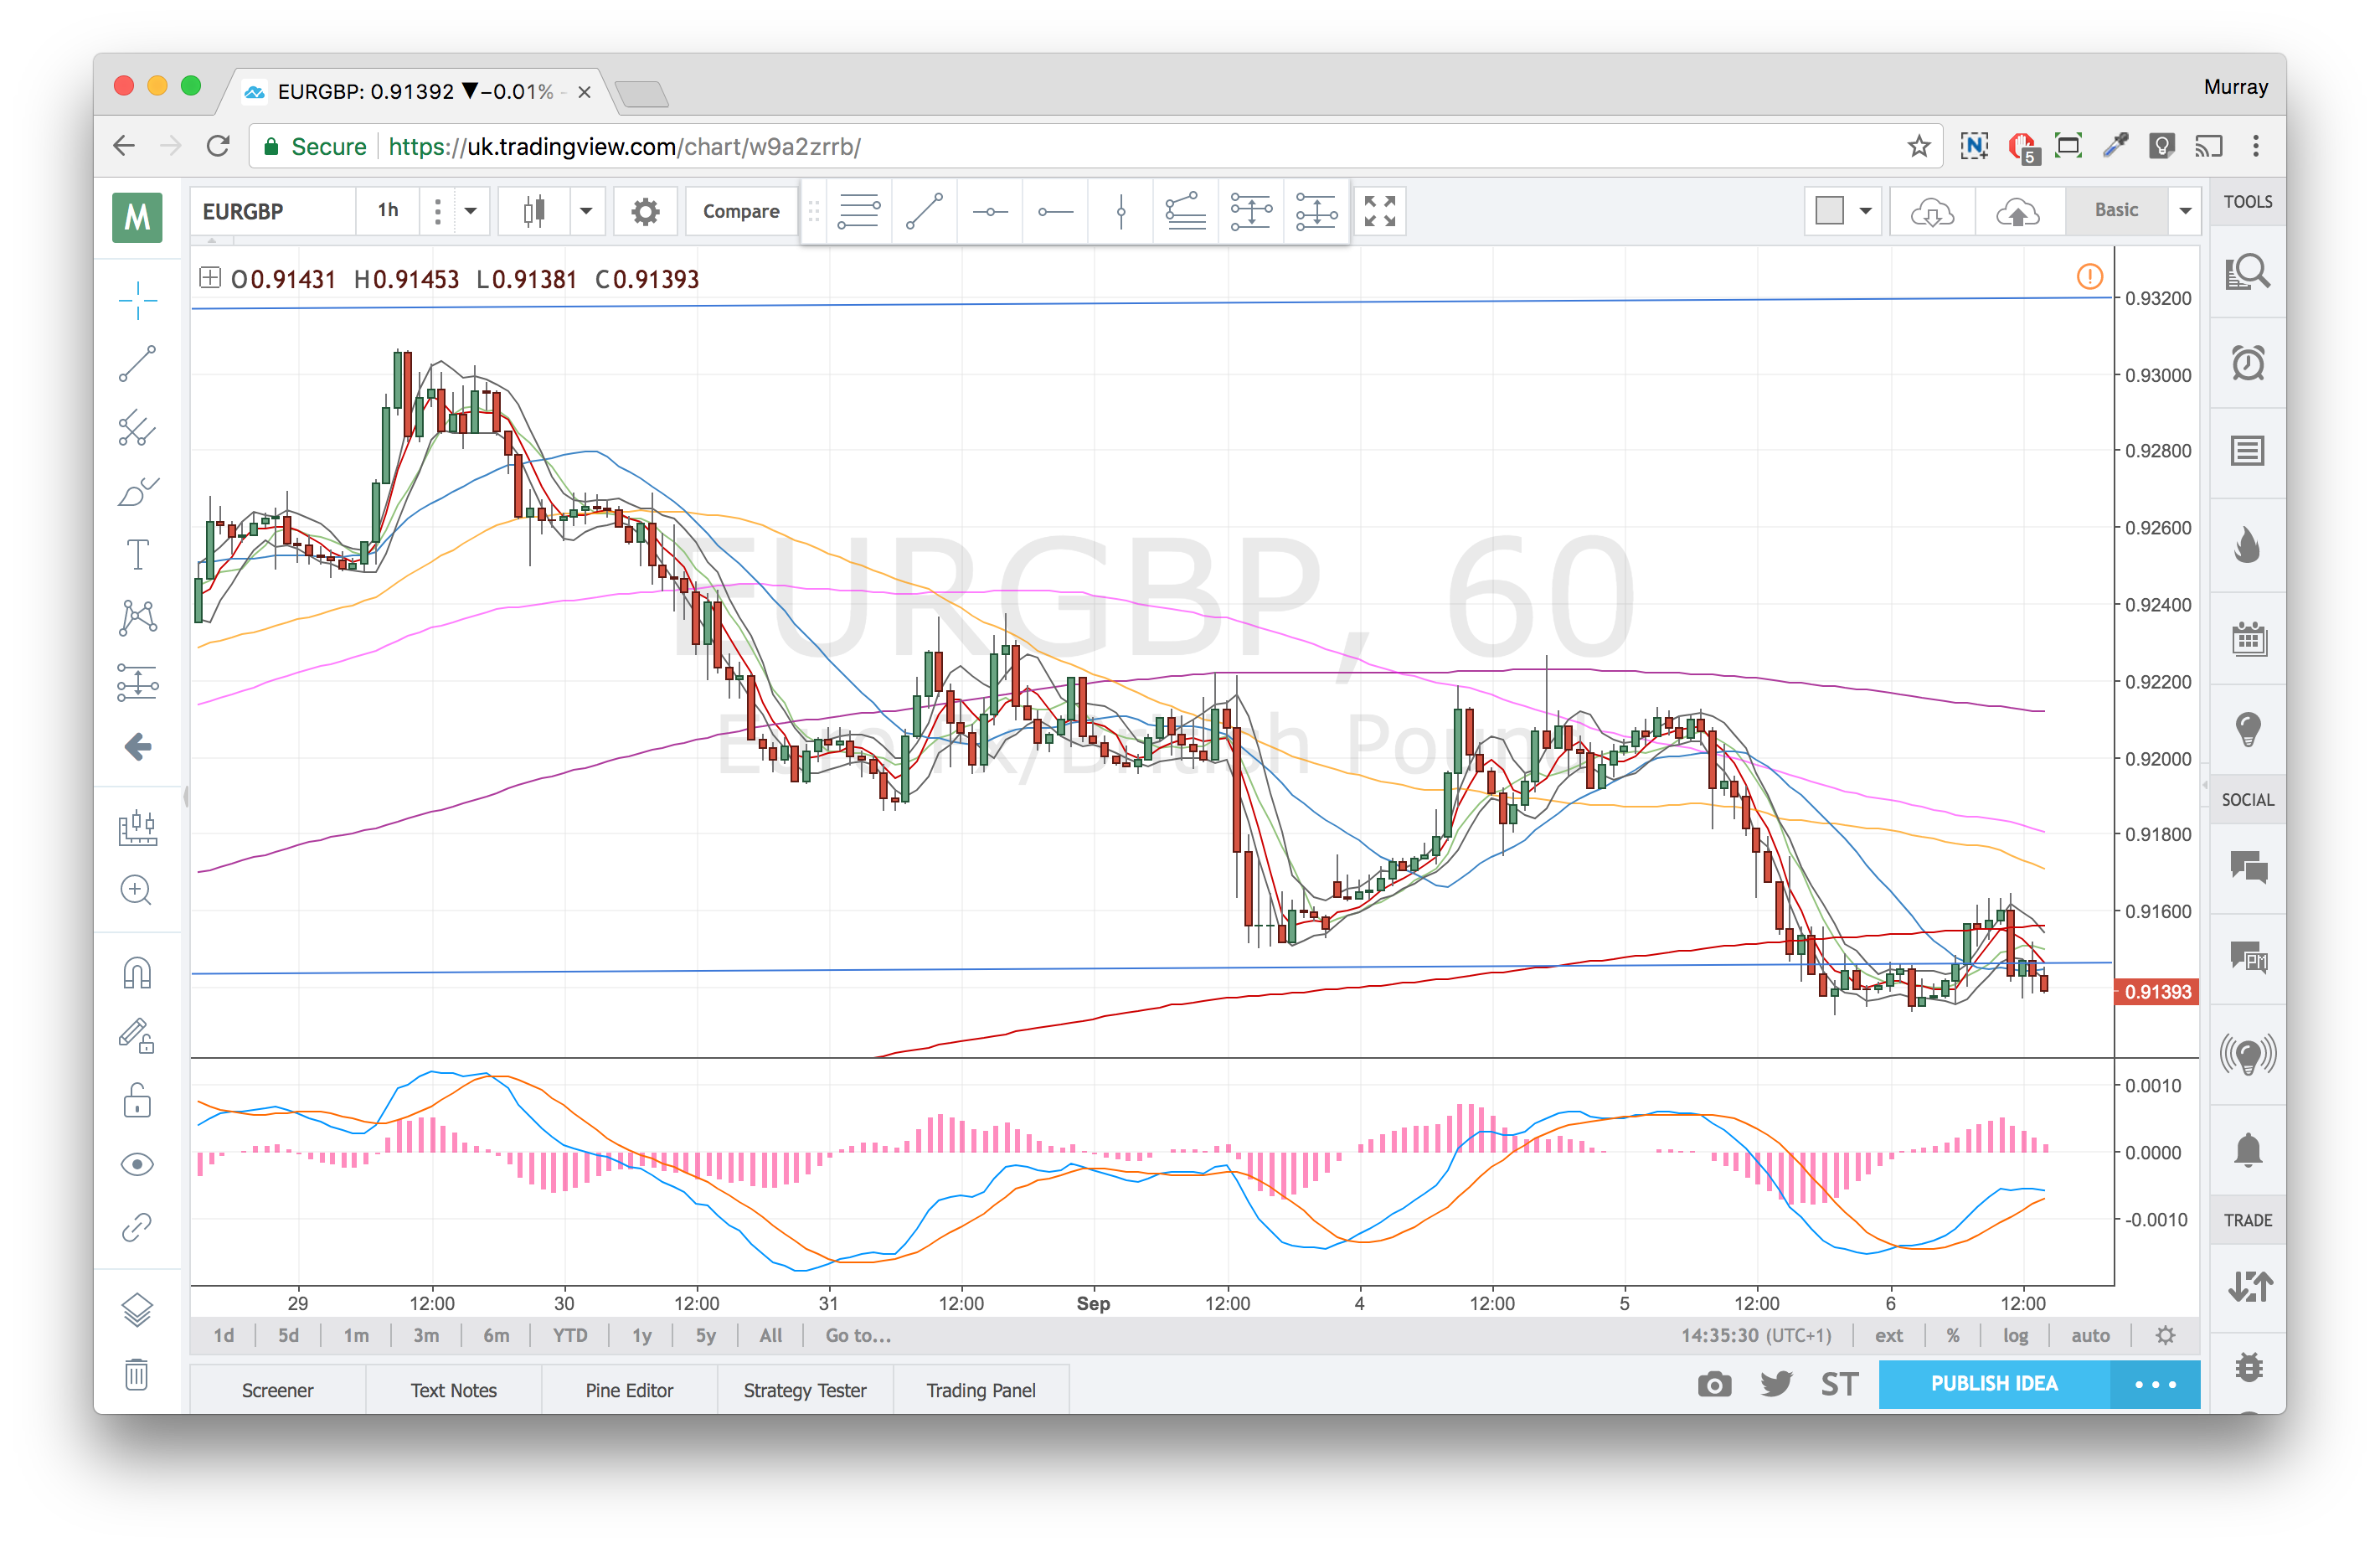
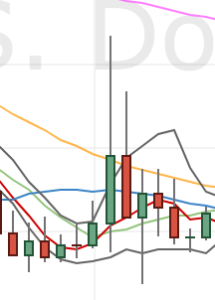
1H Chart – confirmation
Hourly divergence confirming the trade.
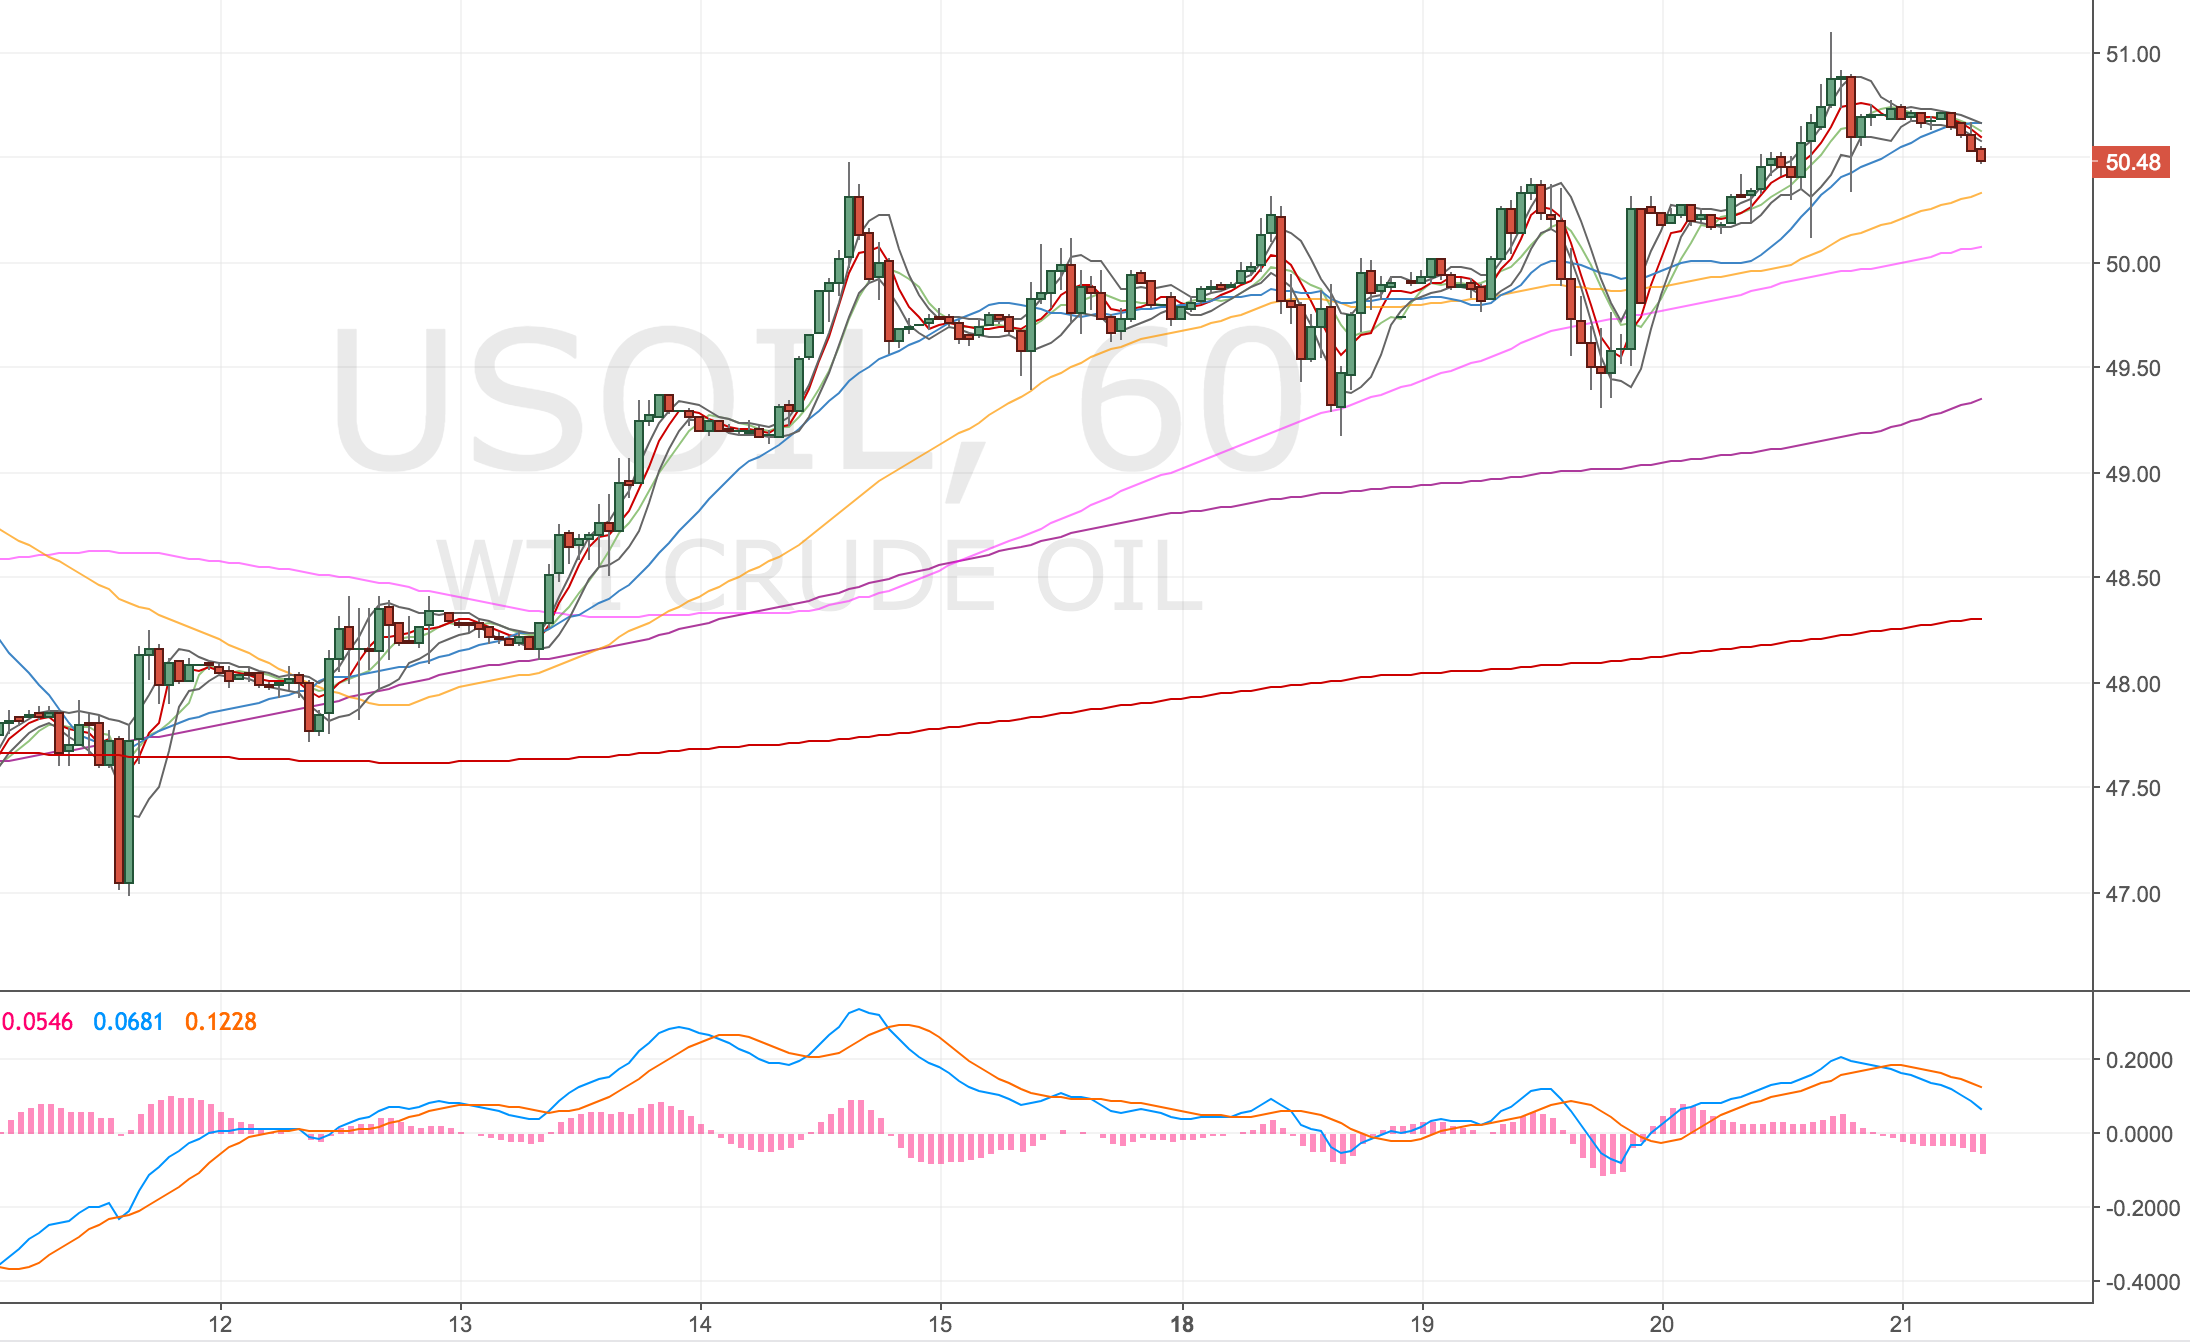
Oil Hourly Chart – 21 Sep 17
Chose the wrong instrument to trade! Trade closed scratch – 21 Sep
I chose the Nymex Daily Futures which settles each day at 7.30pm! Doh, meant to trade the Nov 17 futures market. I’ve done this before – I blame the new ETX UI, confusing as hell. Rather the re-enter I’m going to wait for a new divergence to form. The price action seems range-bound and holding so I think we’ll get another divergence.
I should probably get back in as the analysis is the same.
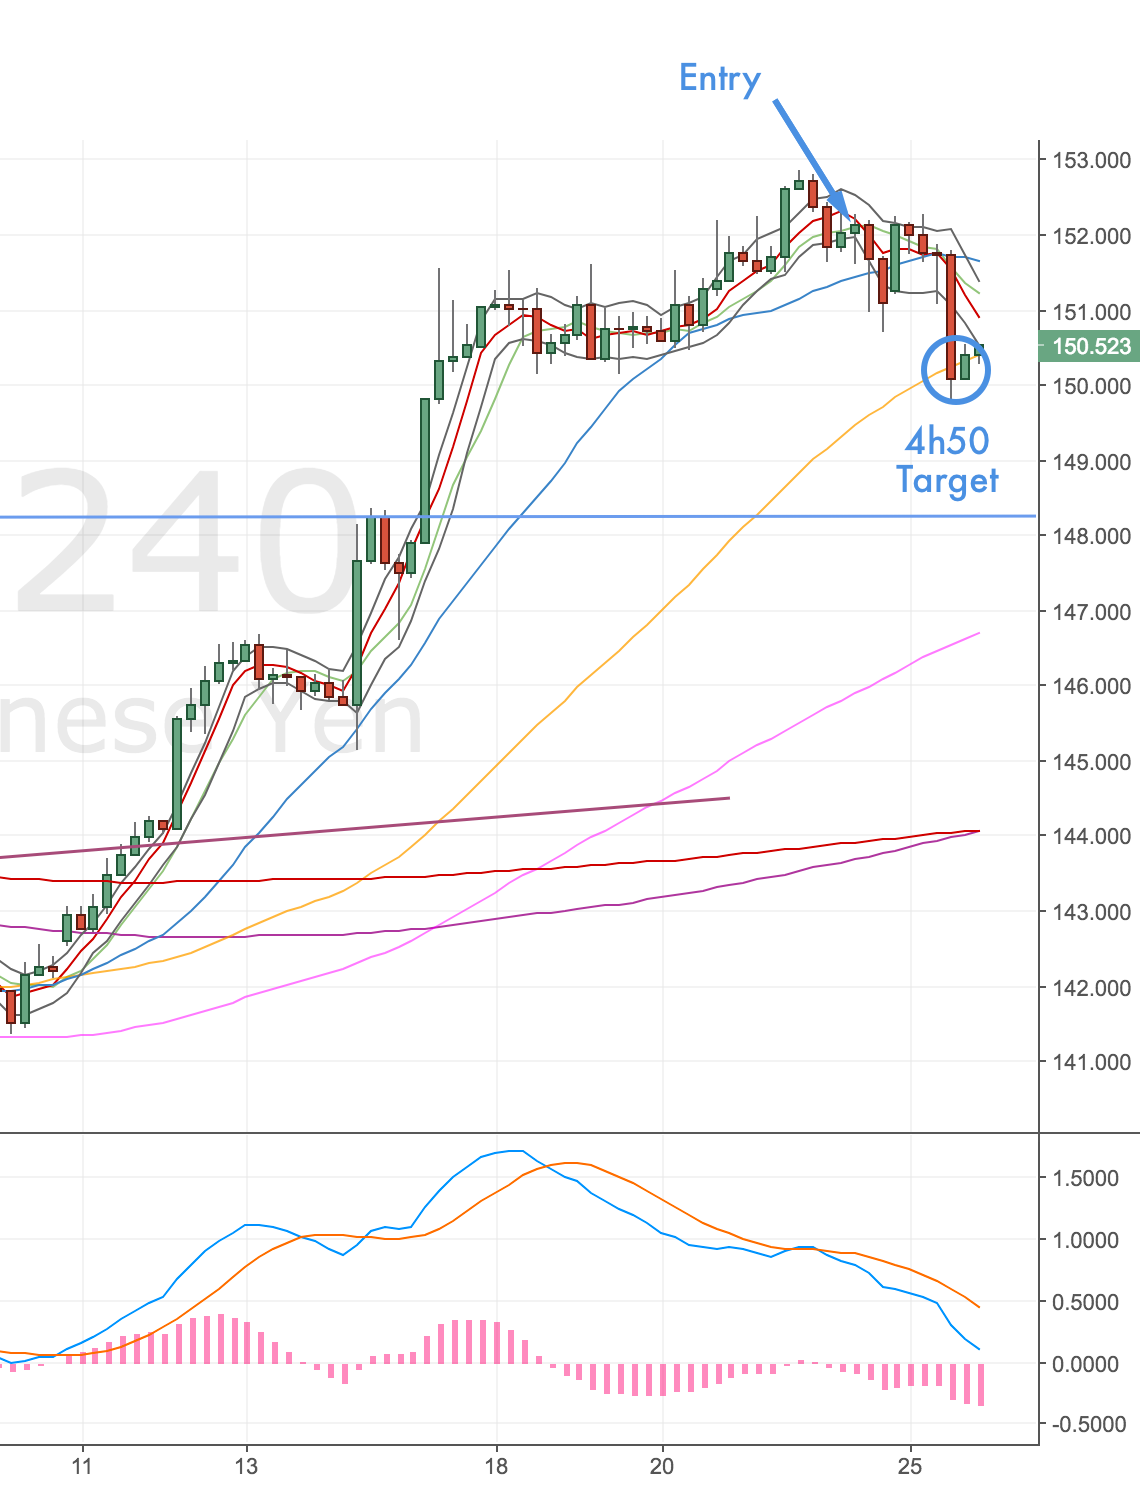
Found another entry – 26 Sep
Looks like I’ve been lucky enough to get another entry on this. Price did hold up as I thought and we’ve moved another leg higher. We know have a marginal daily divergence and a double 4h divergence. We don’t have the 1h confirming but I’m taking the daily and 4H this time. A break of the rules so probably a mistake!
Acc risk: 0.6%
Short: 52.10 (via an order)
Stop: 52.51 (41 pips)
Target: 49.50 (4h200, 310 pips, 7.5x RR)
Mindset: Uneasy about the rule break but think the trade will be worthwhile.
4H Chart
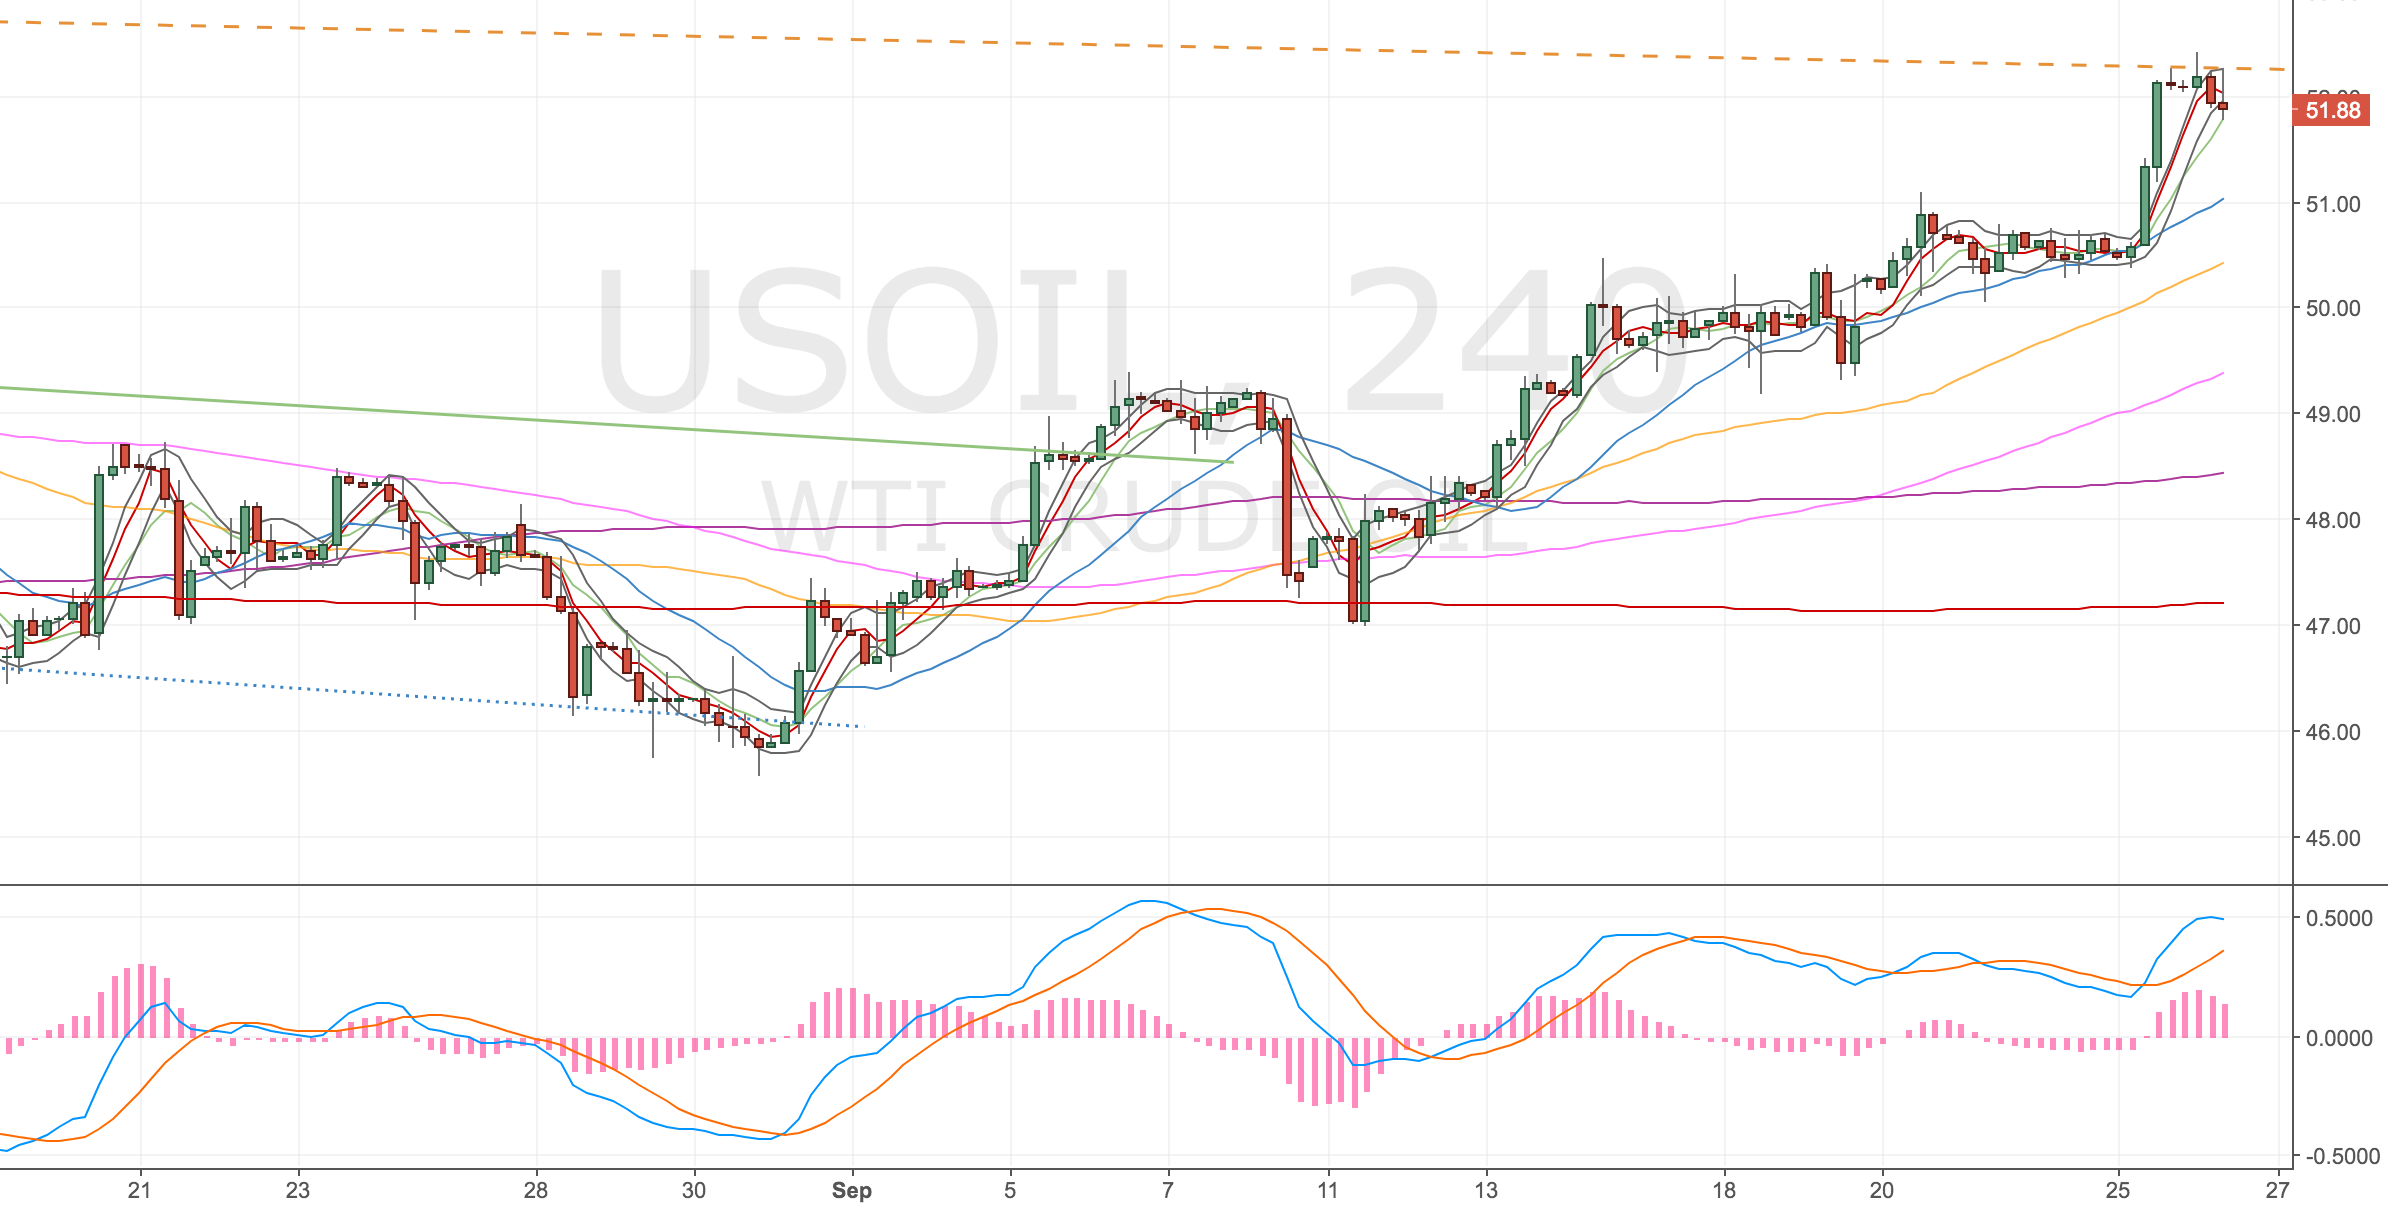
4H Oil Chart – 26 Sep 17
Daily Chart
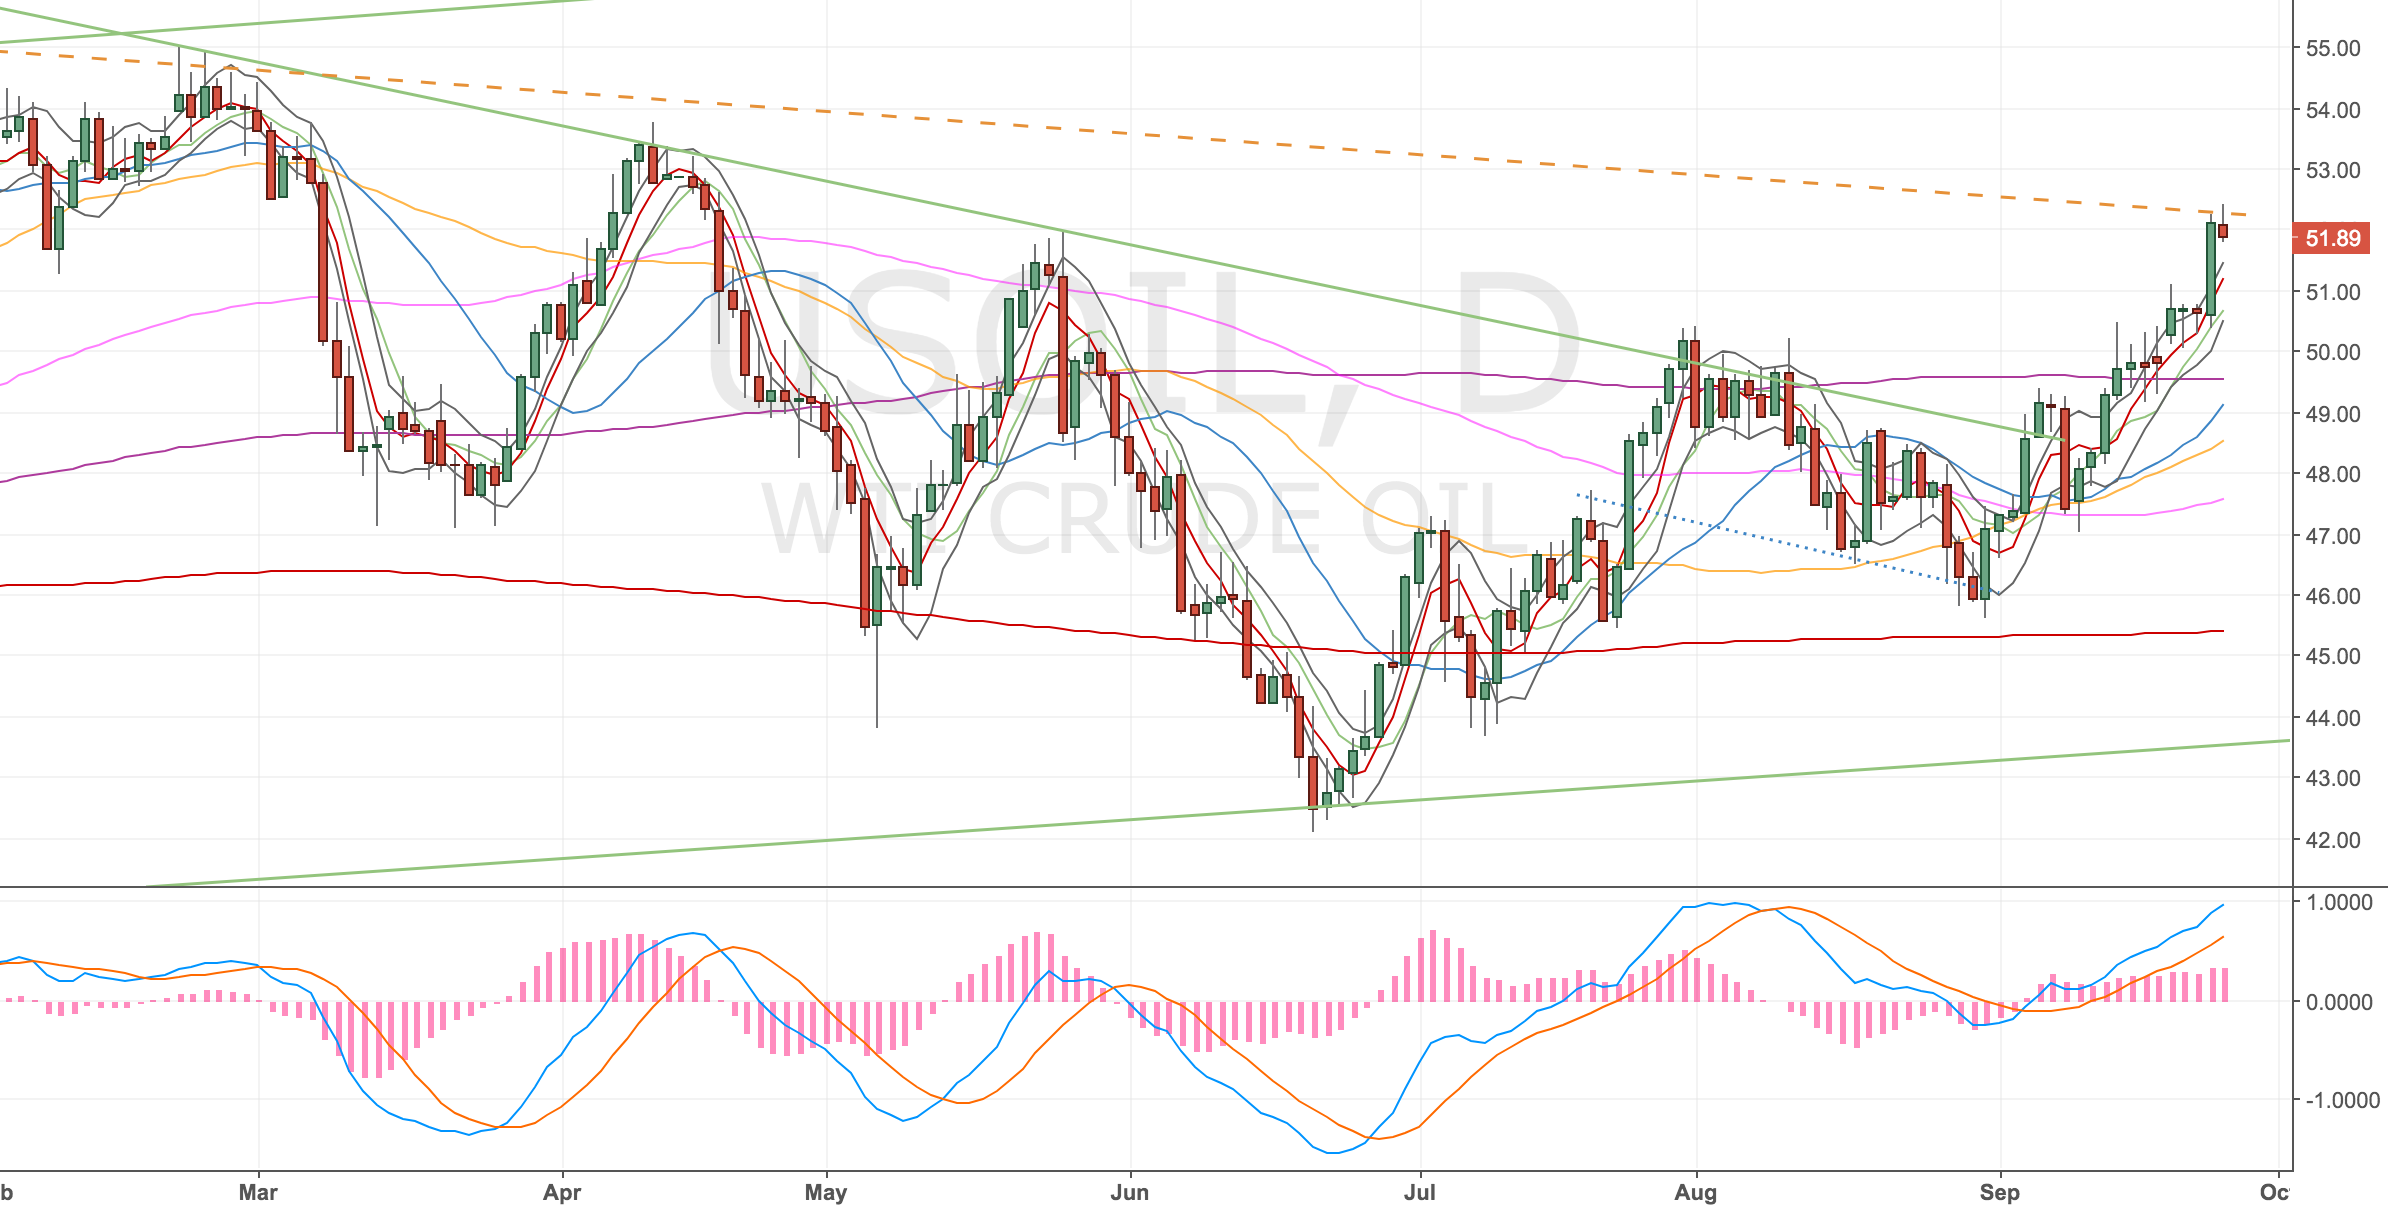
Daily Oil Chart – 26 Sep 17
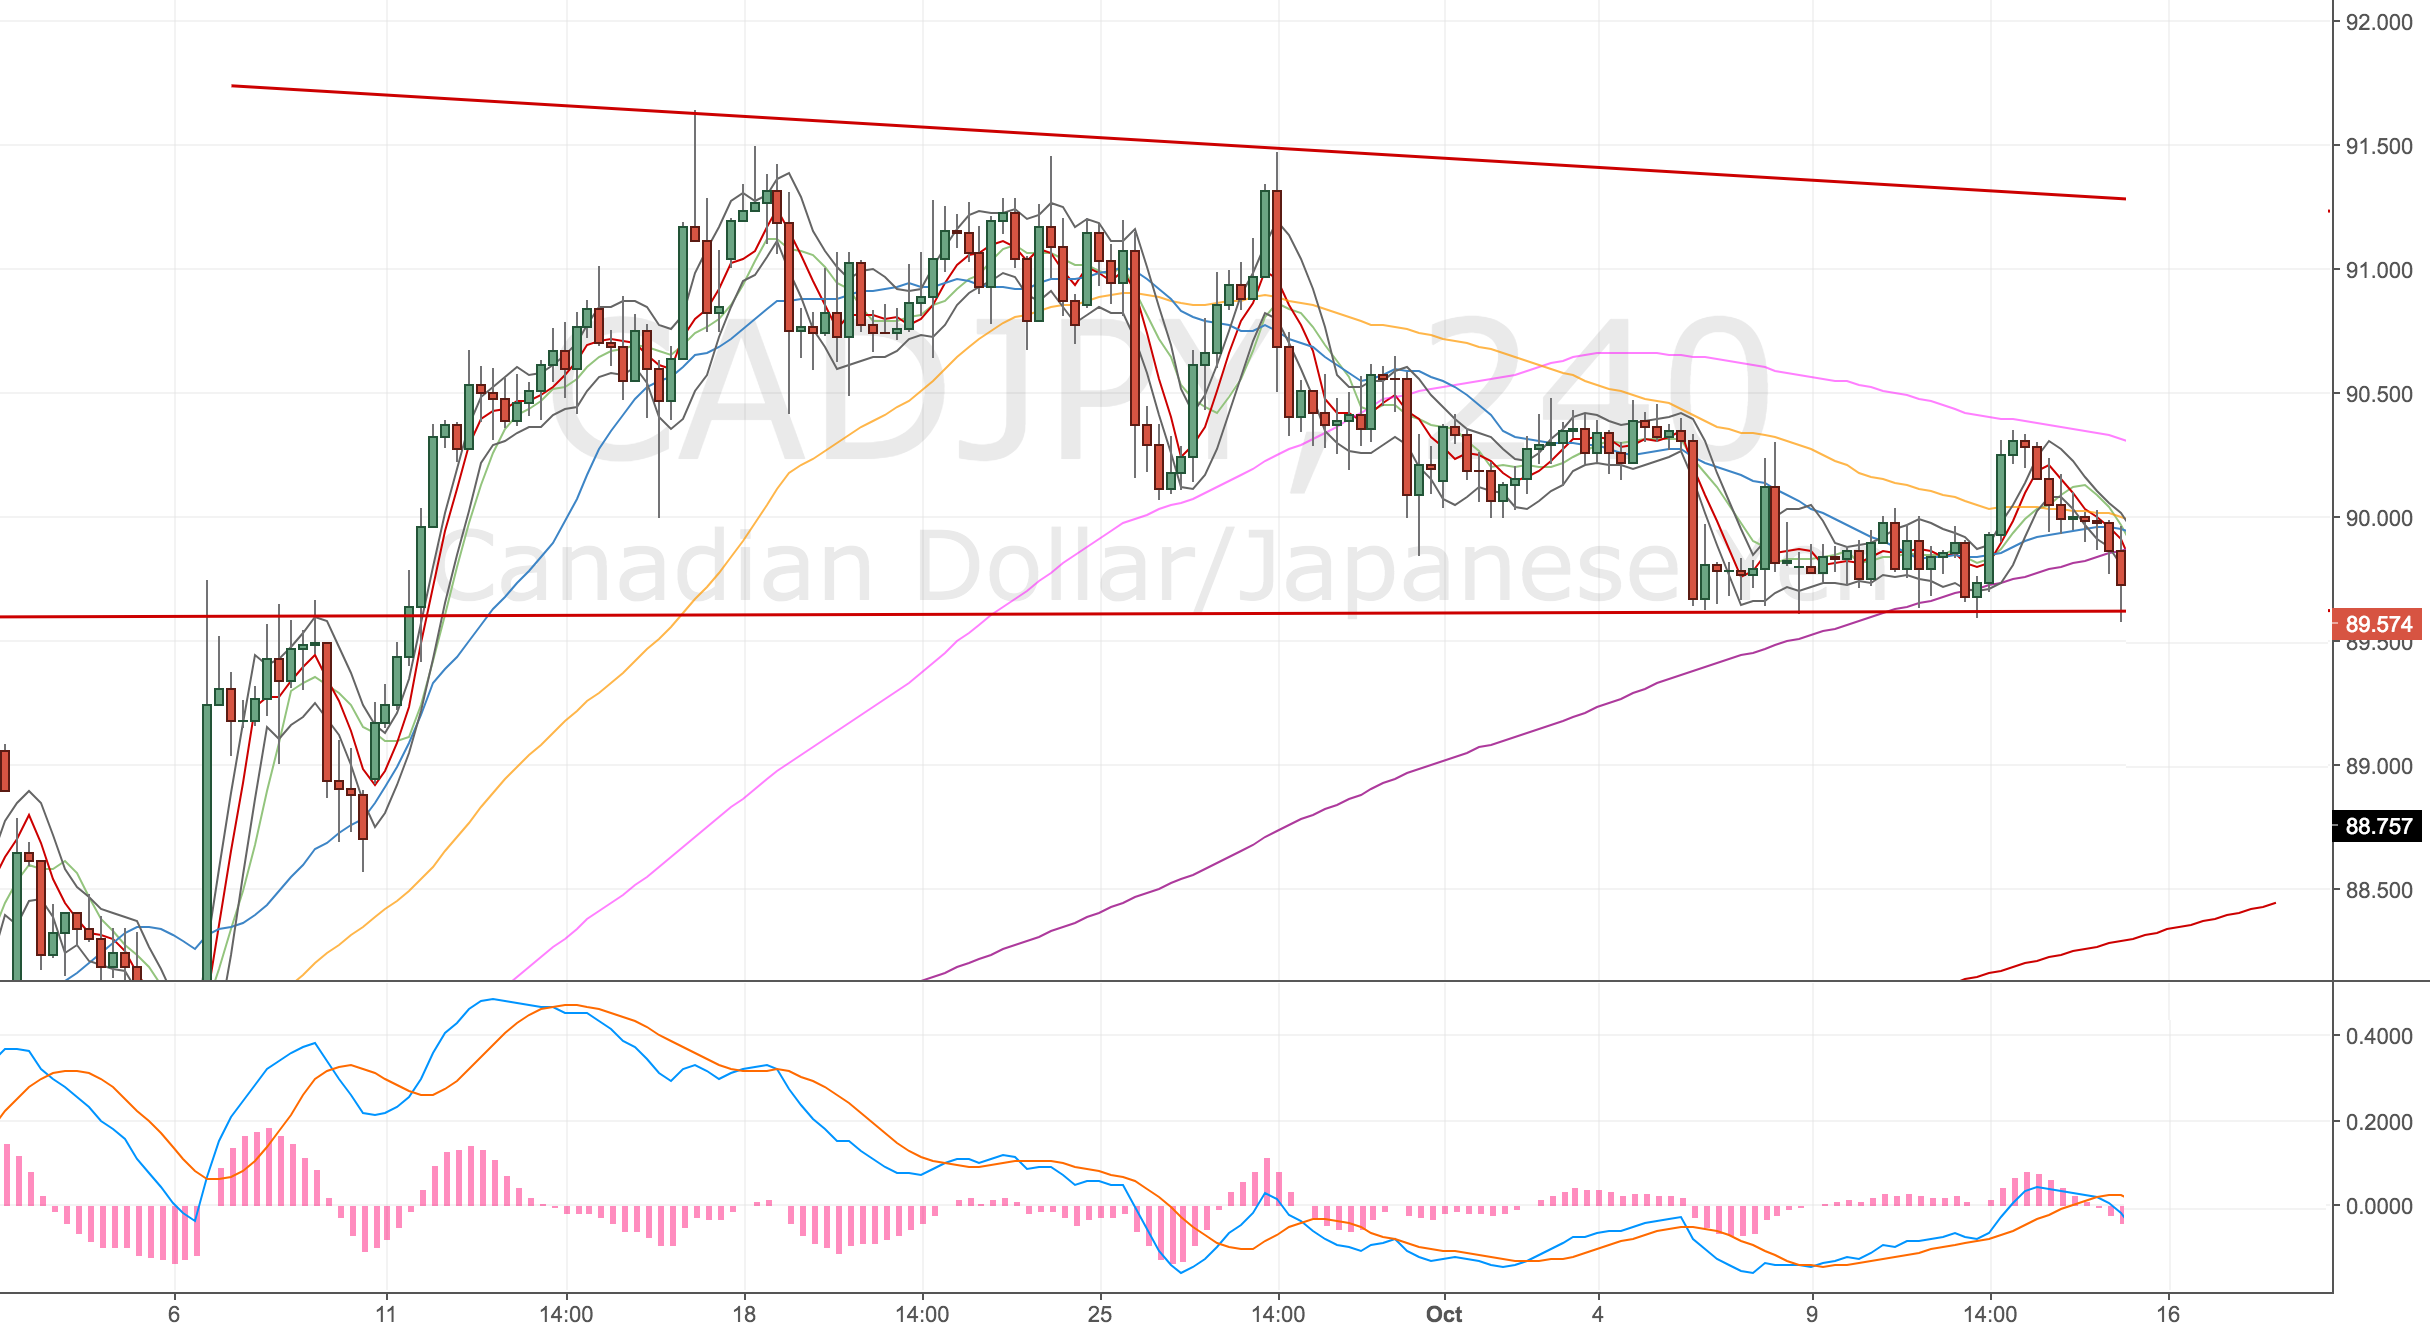
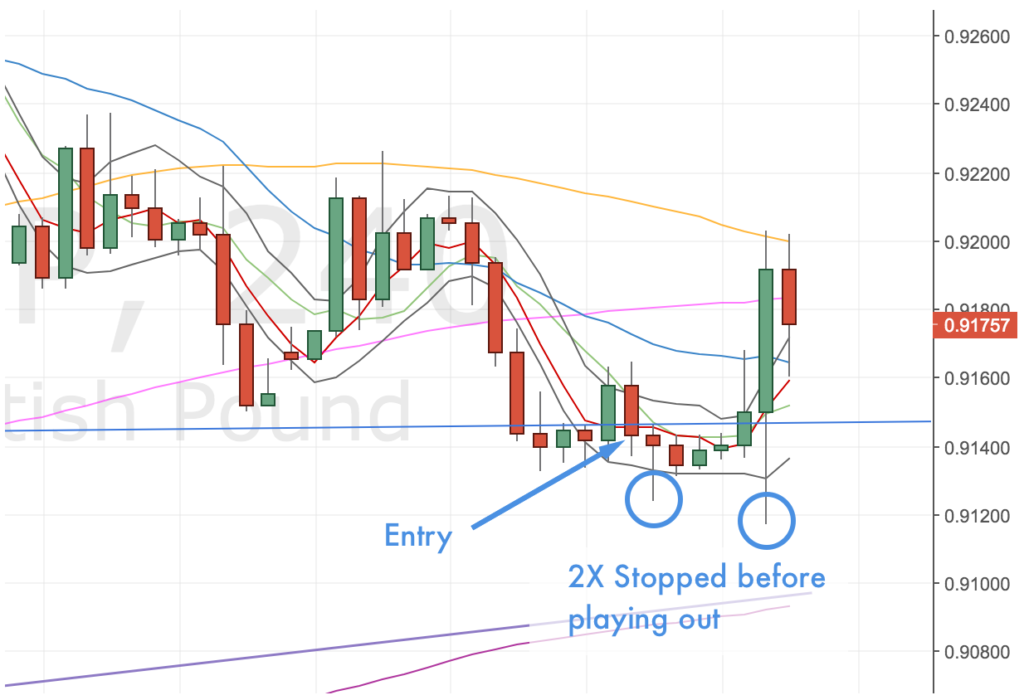
Stopped out – 28 Sep
Just got stopped out on this trade, looks like I shouldn’t have broken my rules after all. The important thing now is to monitor the set up and see if we get another divergence to trade short. Looking back at my set up charts the daily divergence didn’t materialise so there was no confirmation of the 4H chart.
I should’ve waited for the hourly. There’s also not so much going on, on other timeframes, so in retrospect I should’ve waited for more reasons to get involved.
USOIL 4H Chart – 28 Sep 17
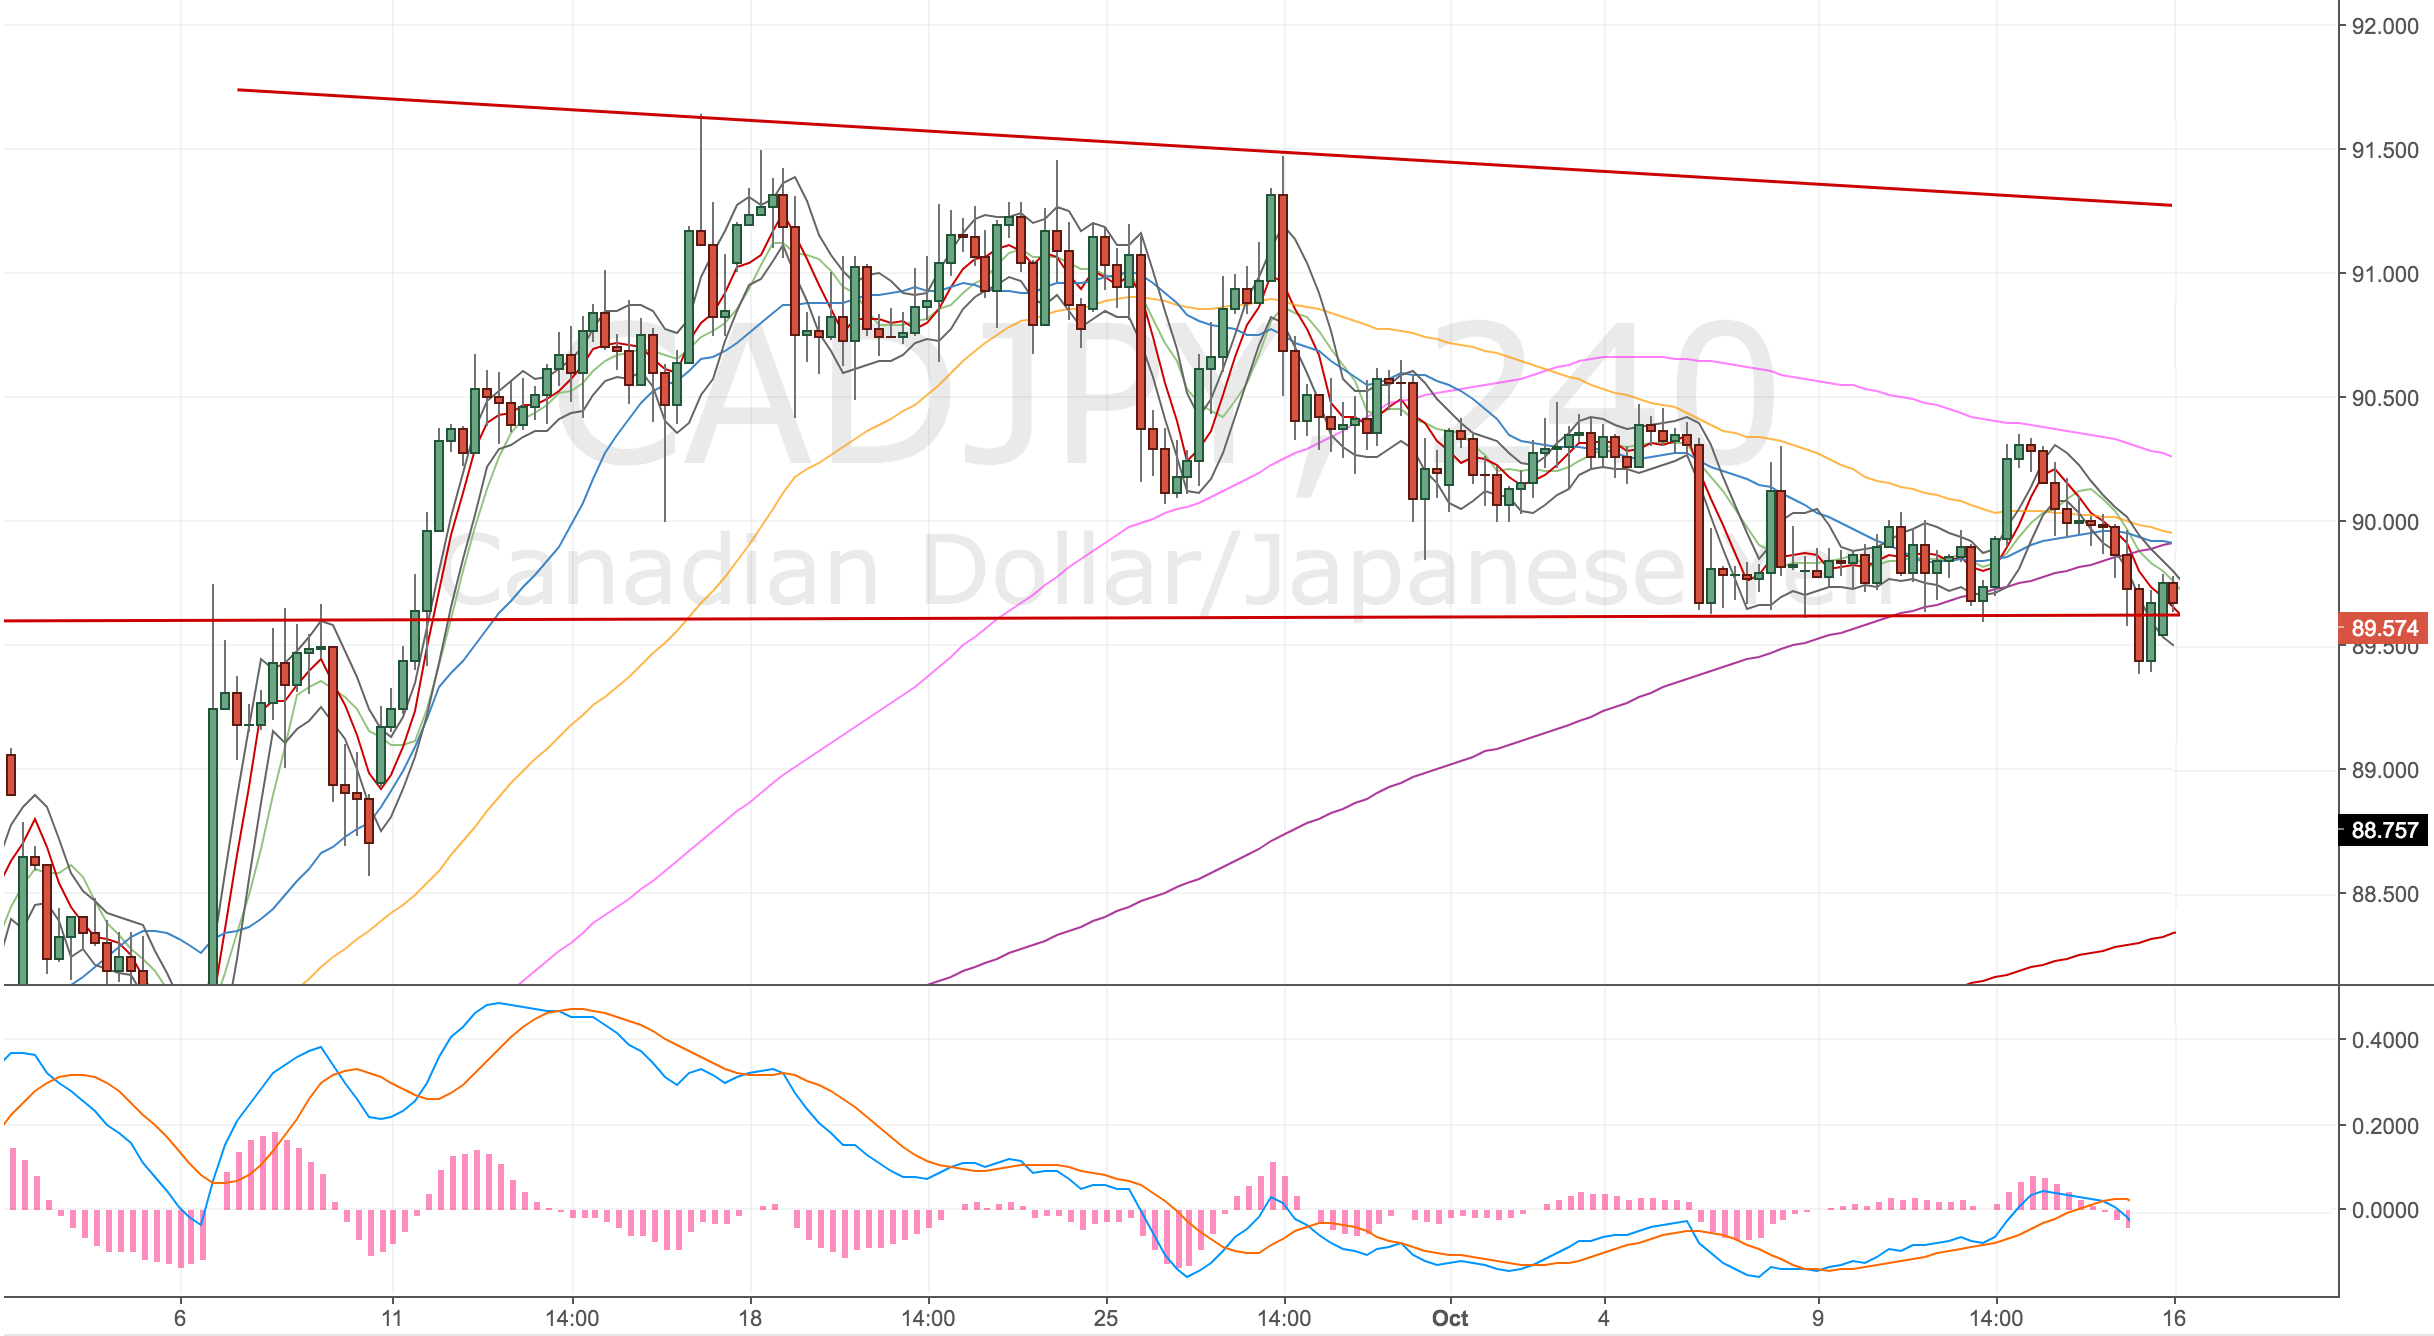
Some time later – 06 Oct
This is annoying, price reversed quickly and just ran off. I put an alert in for any retrace, but it didn’t happen. 🙁
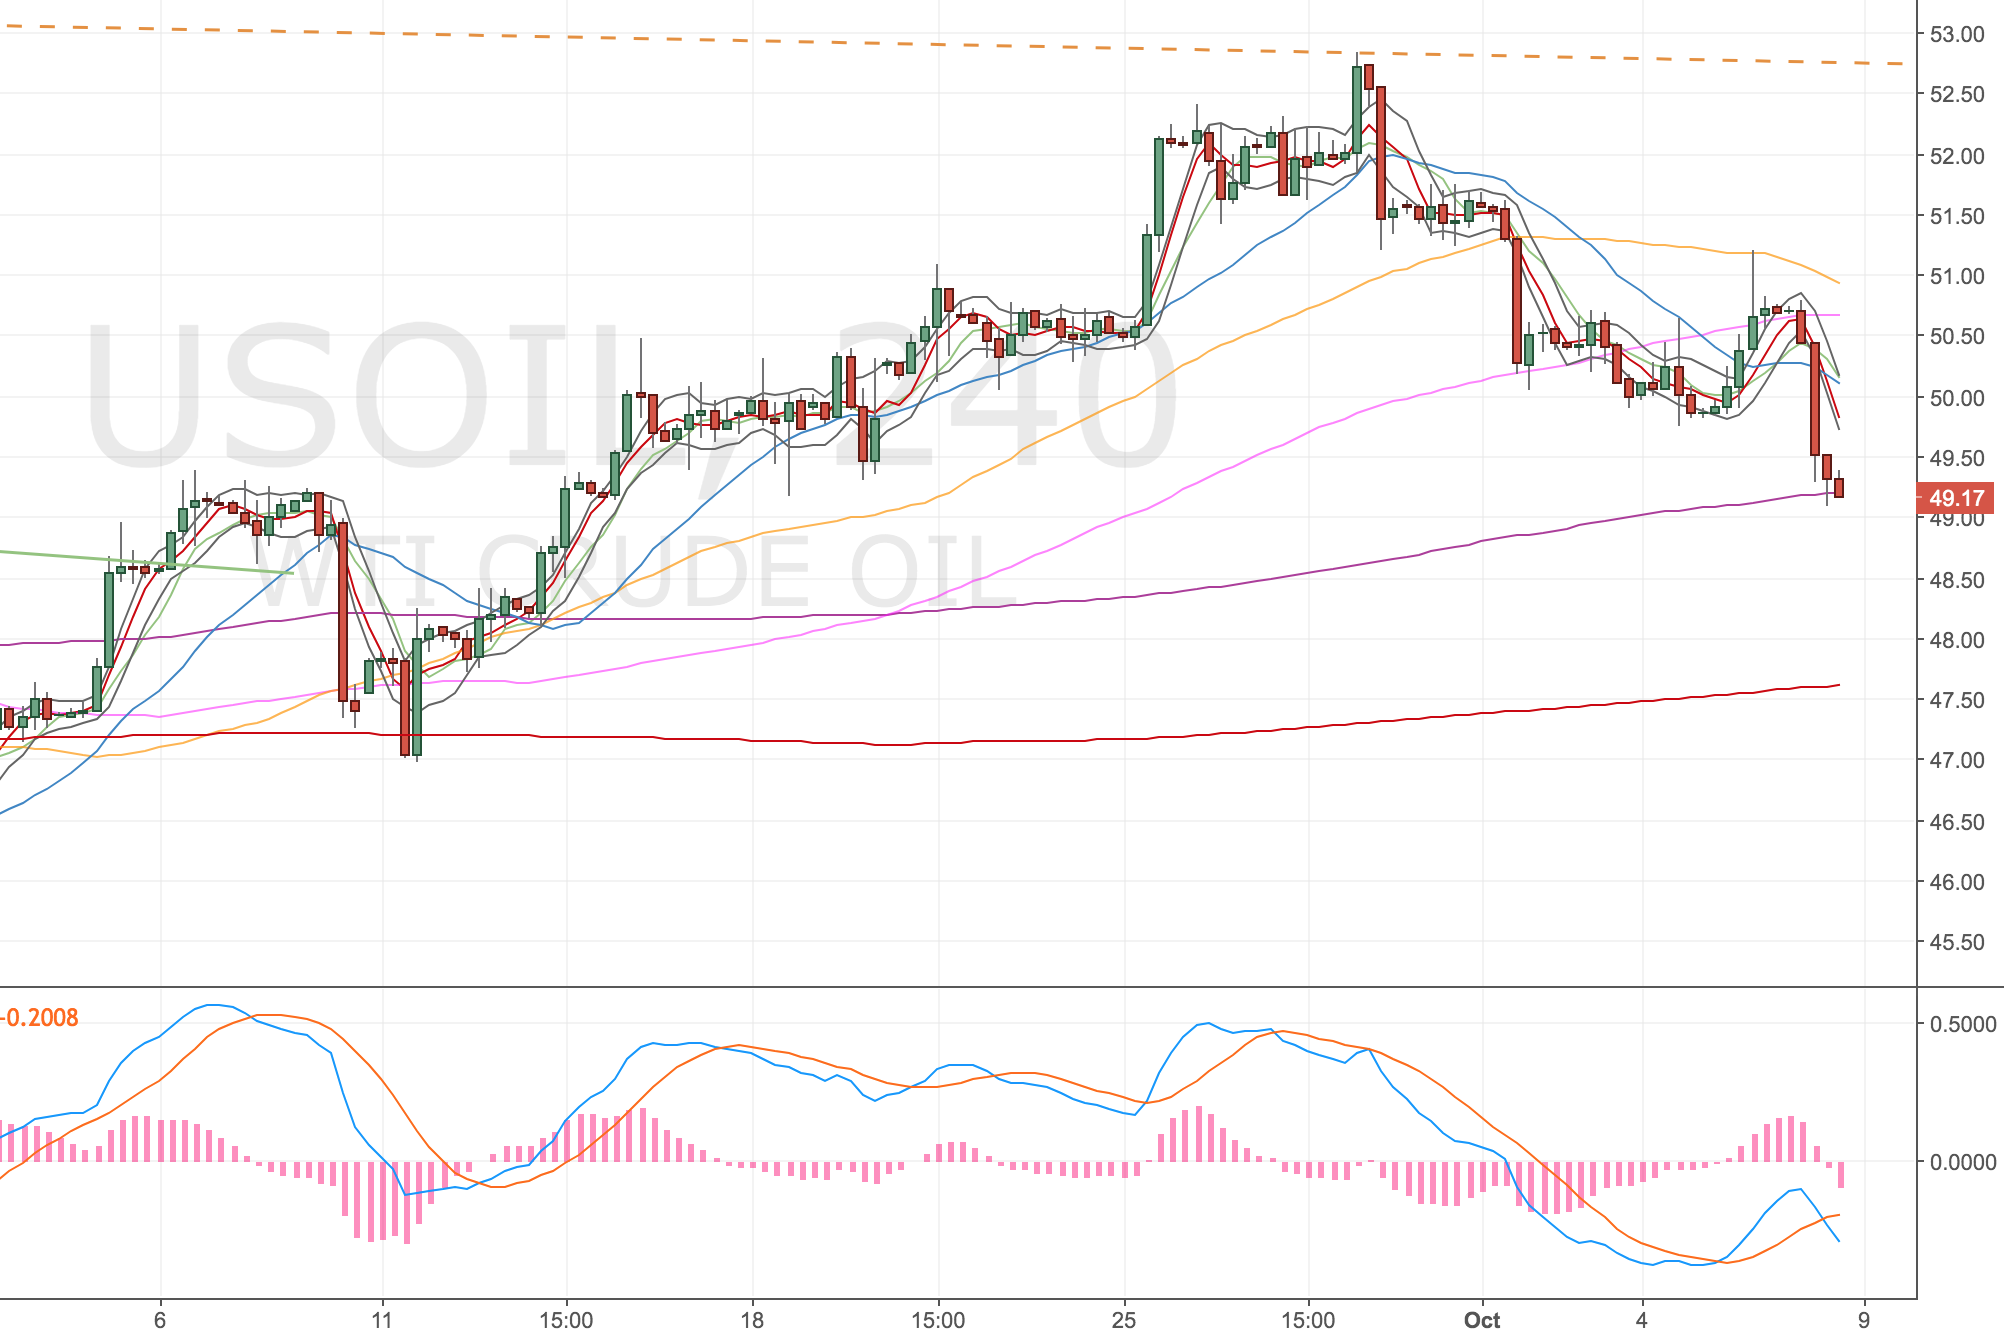
Oil 4H Chart – 06 Oct 17