NZDUSD DST Long – 24 Aug 17


Acc risk: 0.75%
Long: 0.7218
Stop: 0.7185 (33 pips)
Target: 0.7279 (4h50, 61 pips, 2x RR)
Mindset: Liked the set up, but can see things wrong with it now.

Updates

Changed my target – 25 Aug
4h100 target hit – 29 Aug

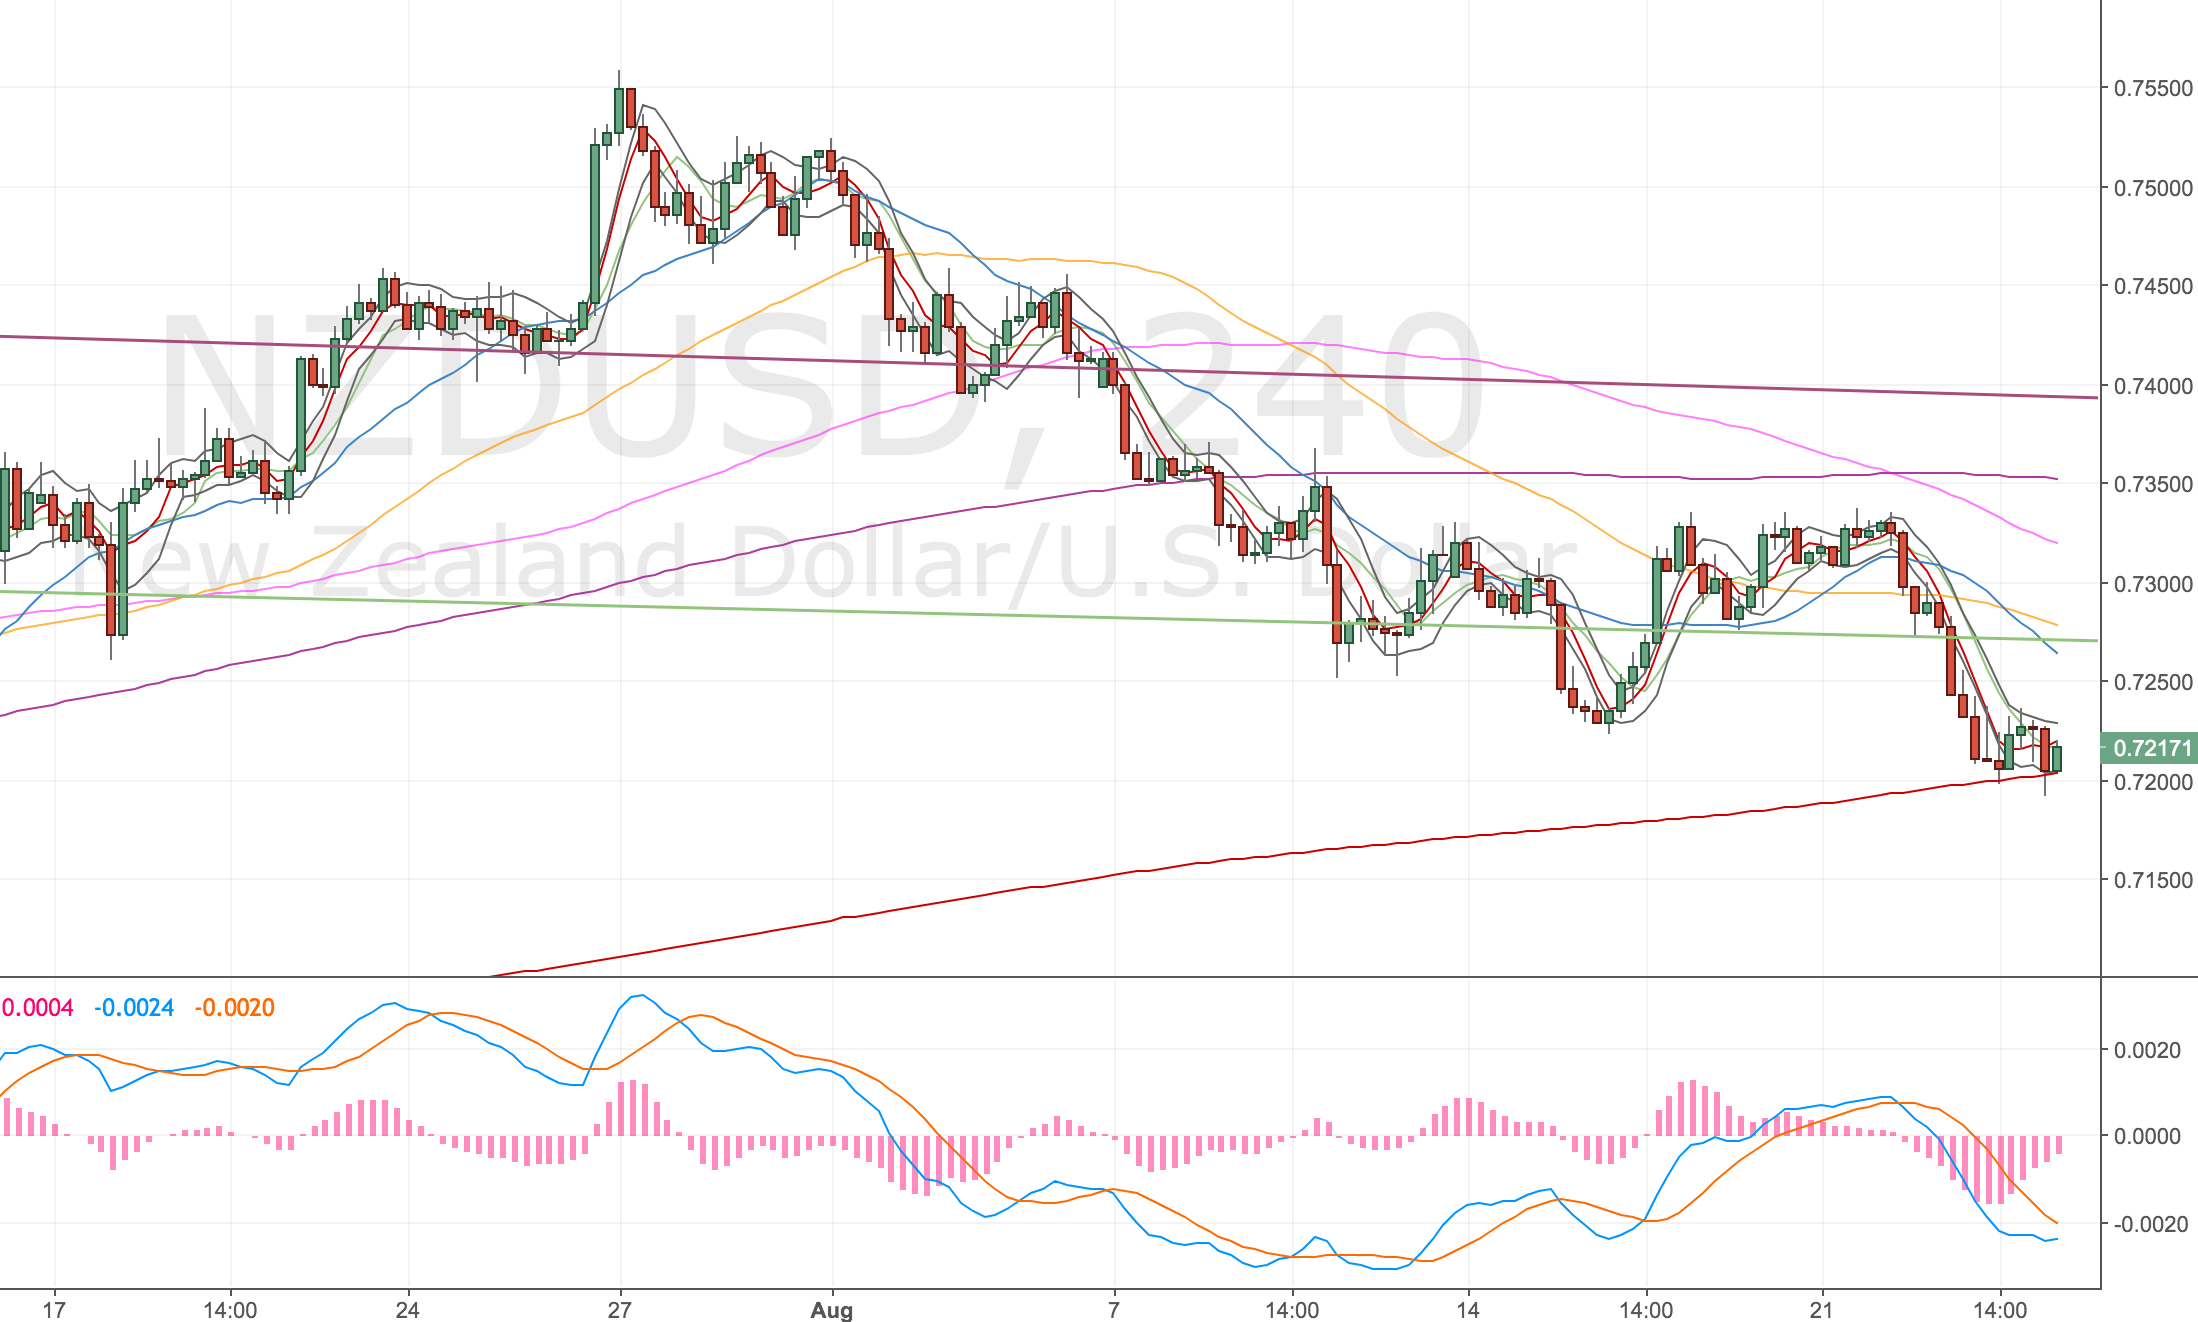
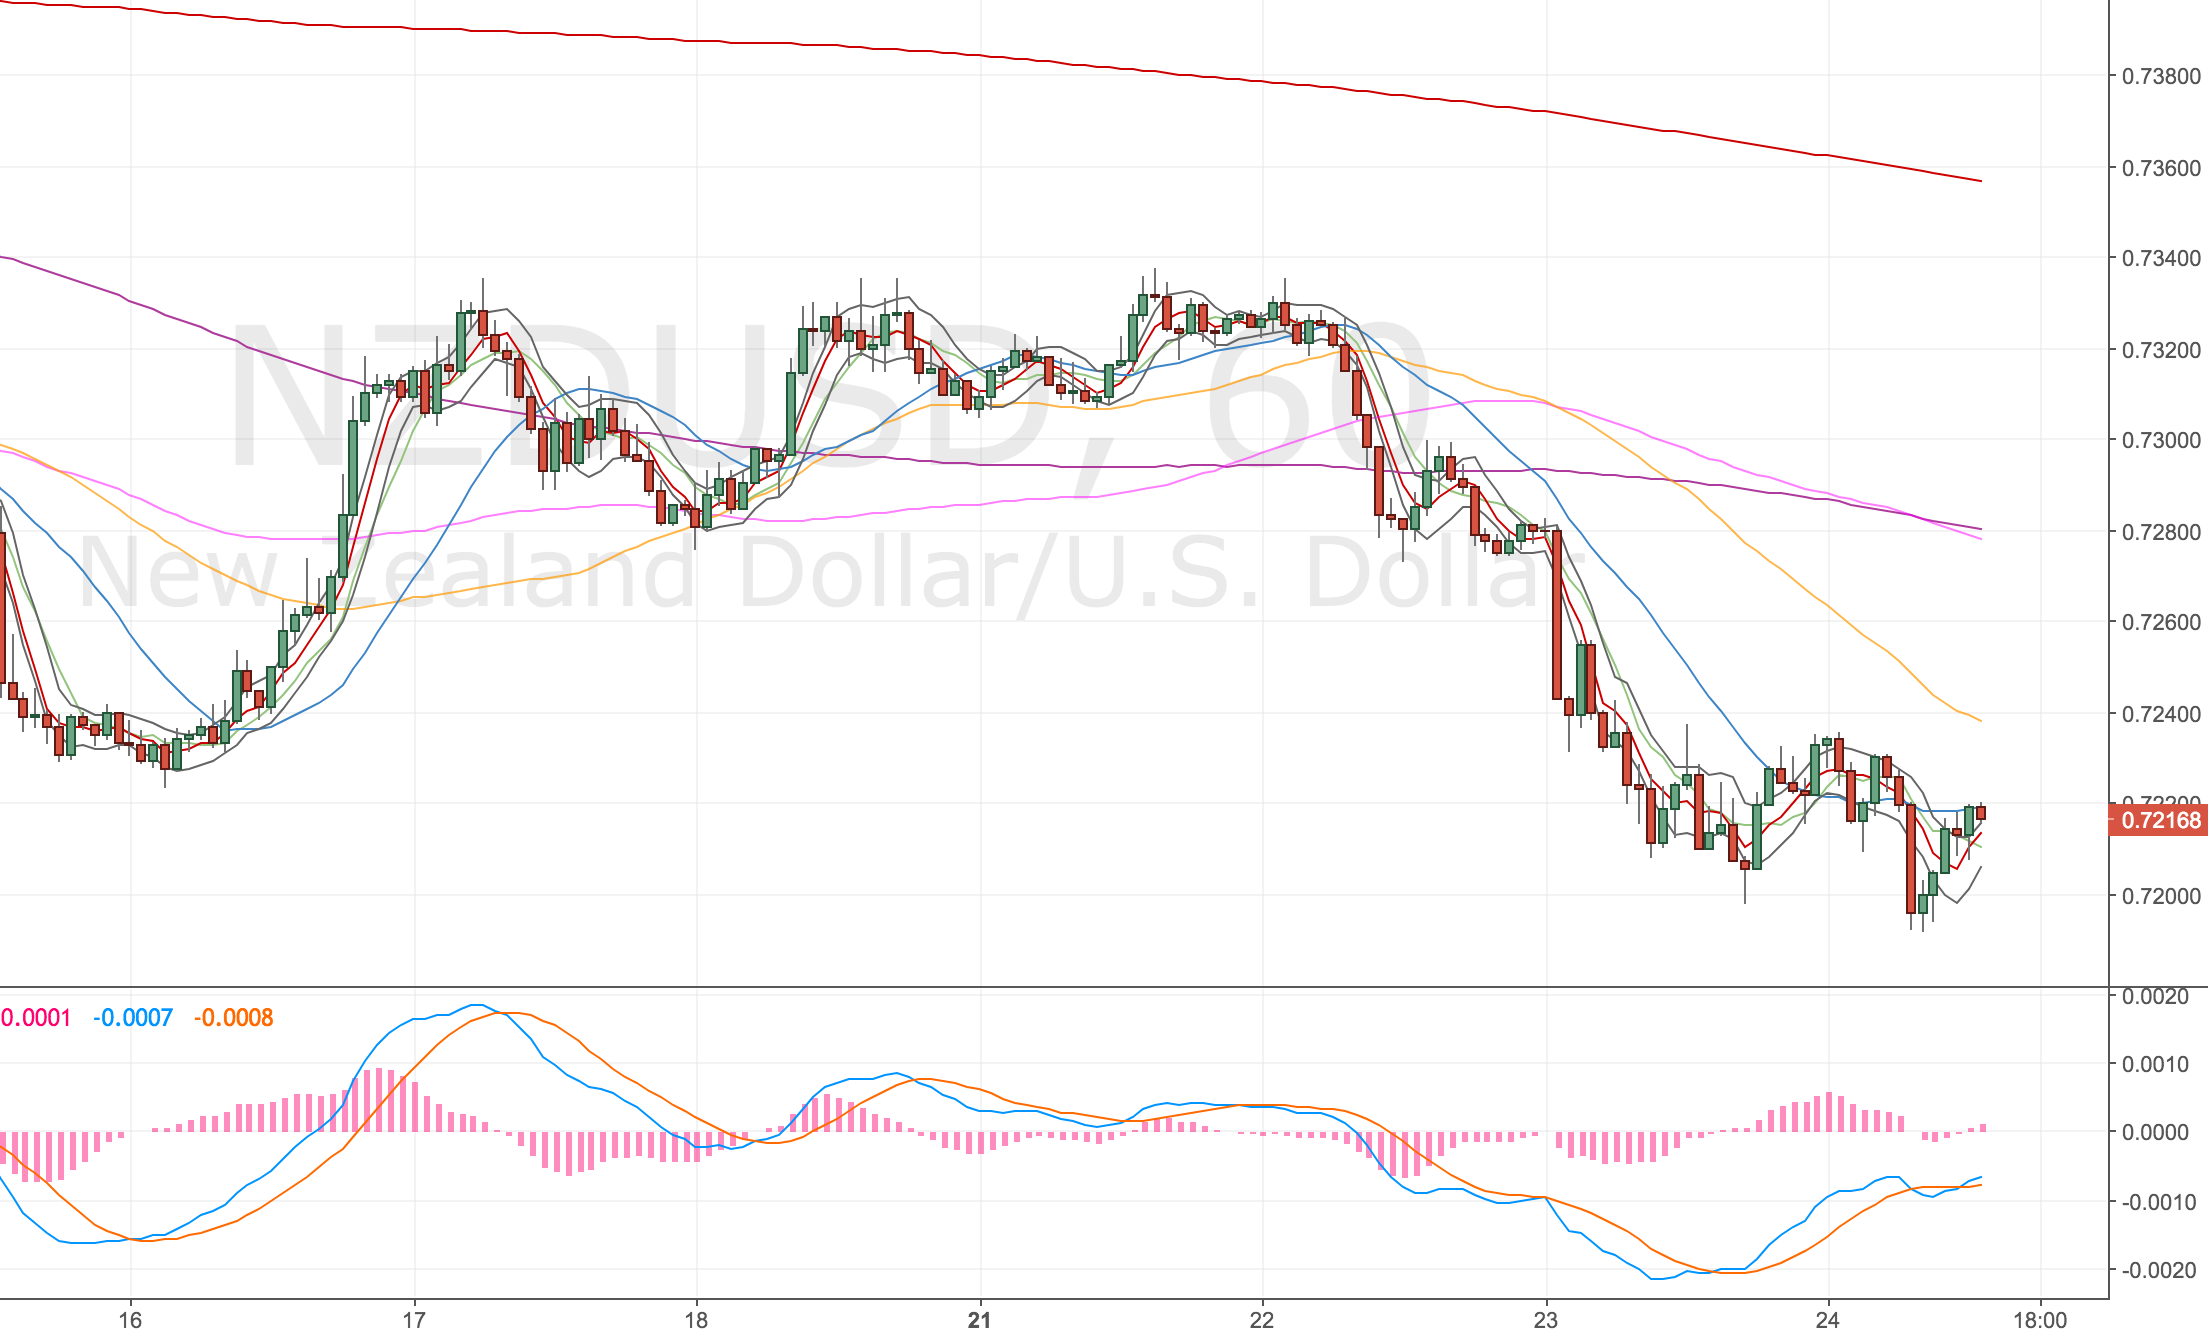
Nice double divergence on the 4h chart and a confirmation on the 1h divergence. I think this might still go a little lower, d100 and w50 nearby. Might have made a mistake here. The higher timeframes look bullish but price could head lower first. The divergence on the 4h timeframe coincides with a 4h500.

I can’t make up my mind on this – I think I’m in too early. We’ll see.

4H Chart – set up

NZDUSD 4H Chart – 24 Aug 17

1H Chart – confirmation

NZDUSD H Chart – 24 Aug 17

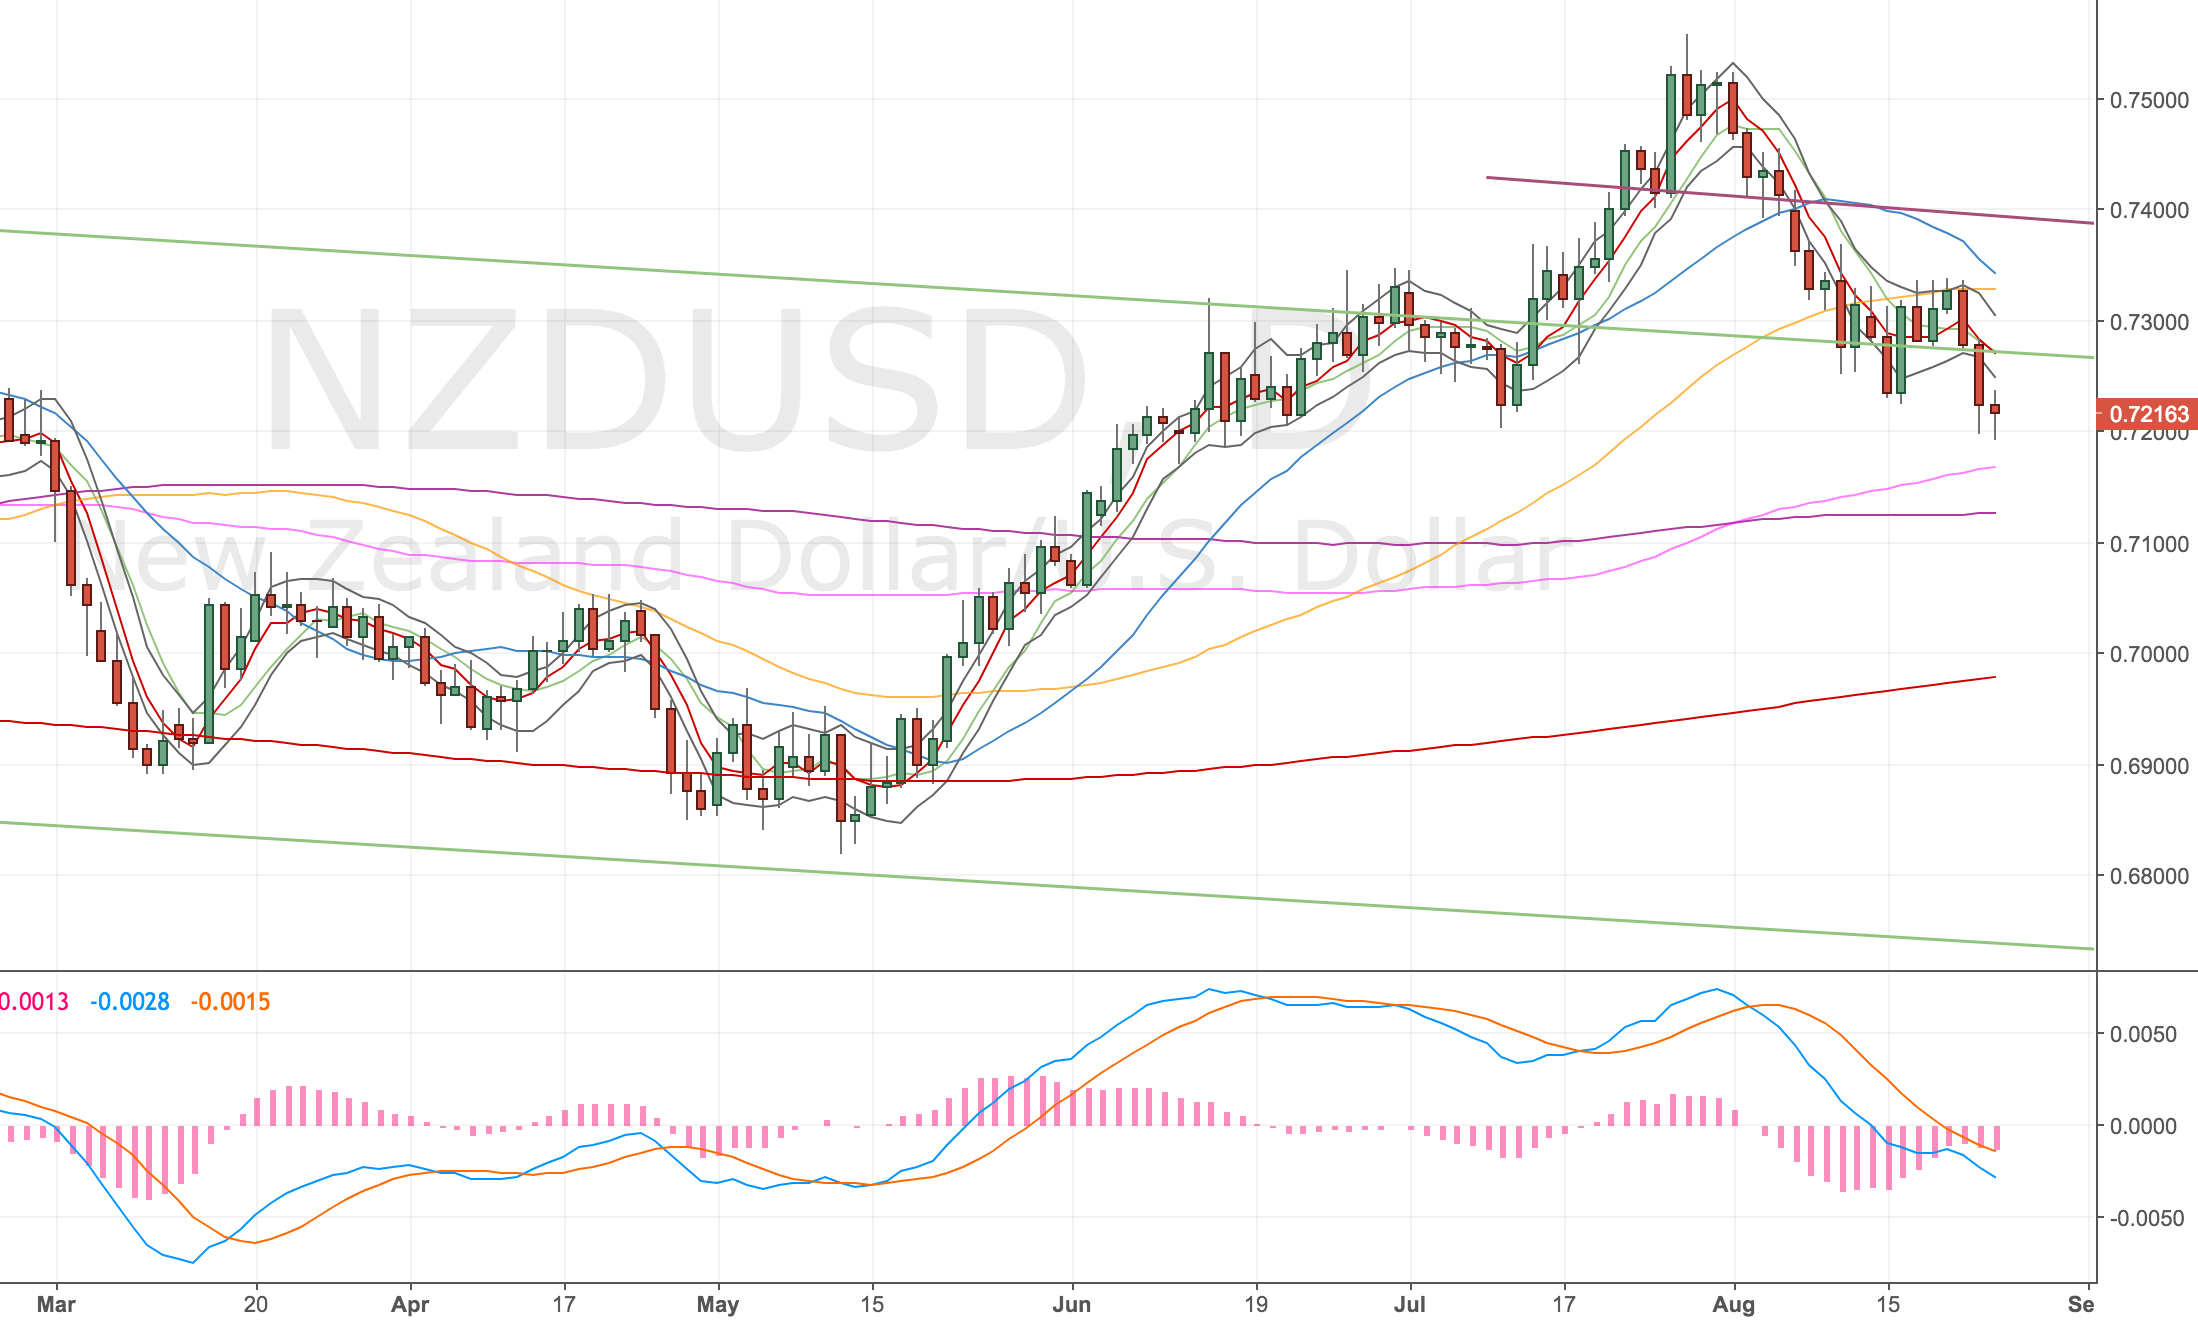
Daily chart

The Daily chart looks troubling to me – this is definitely not a perfect set up. Price is close to the d100.

NZDUSD Daily Chart – 24 Aug 17

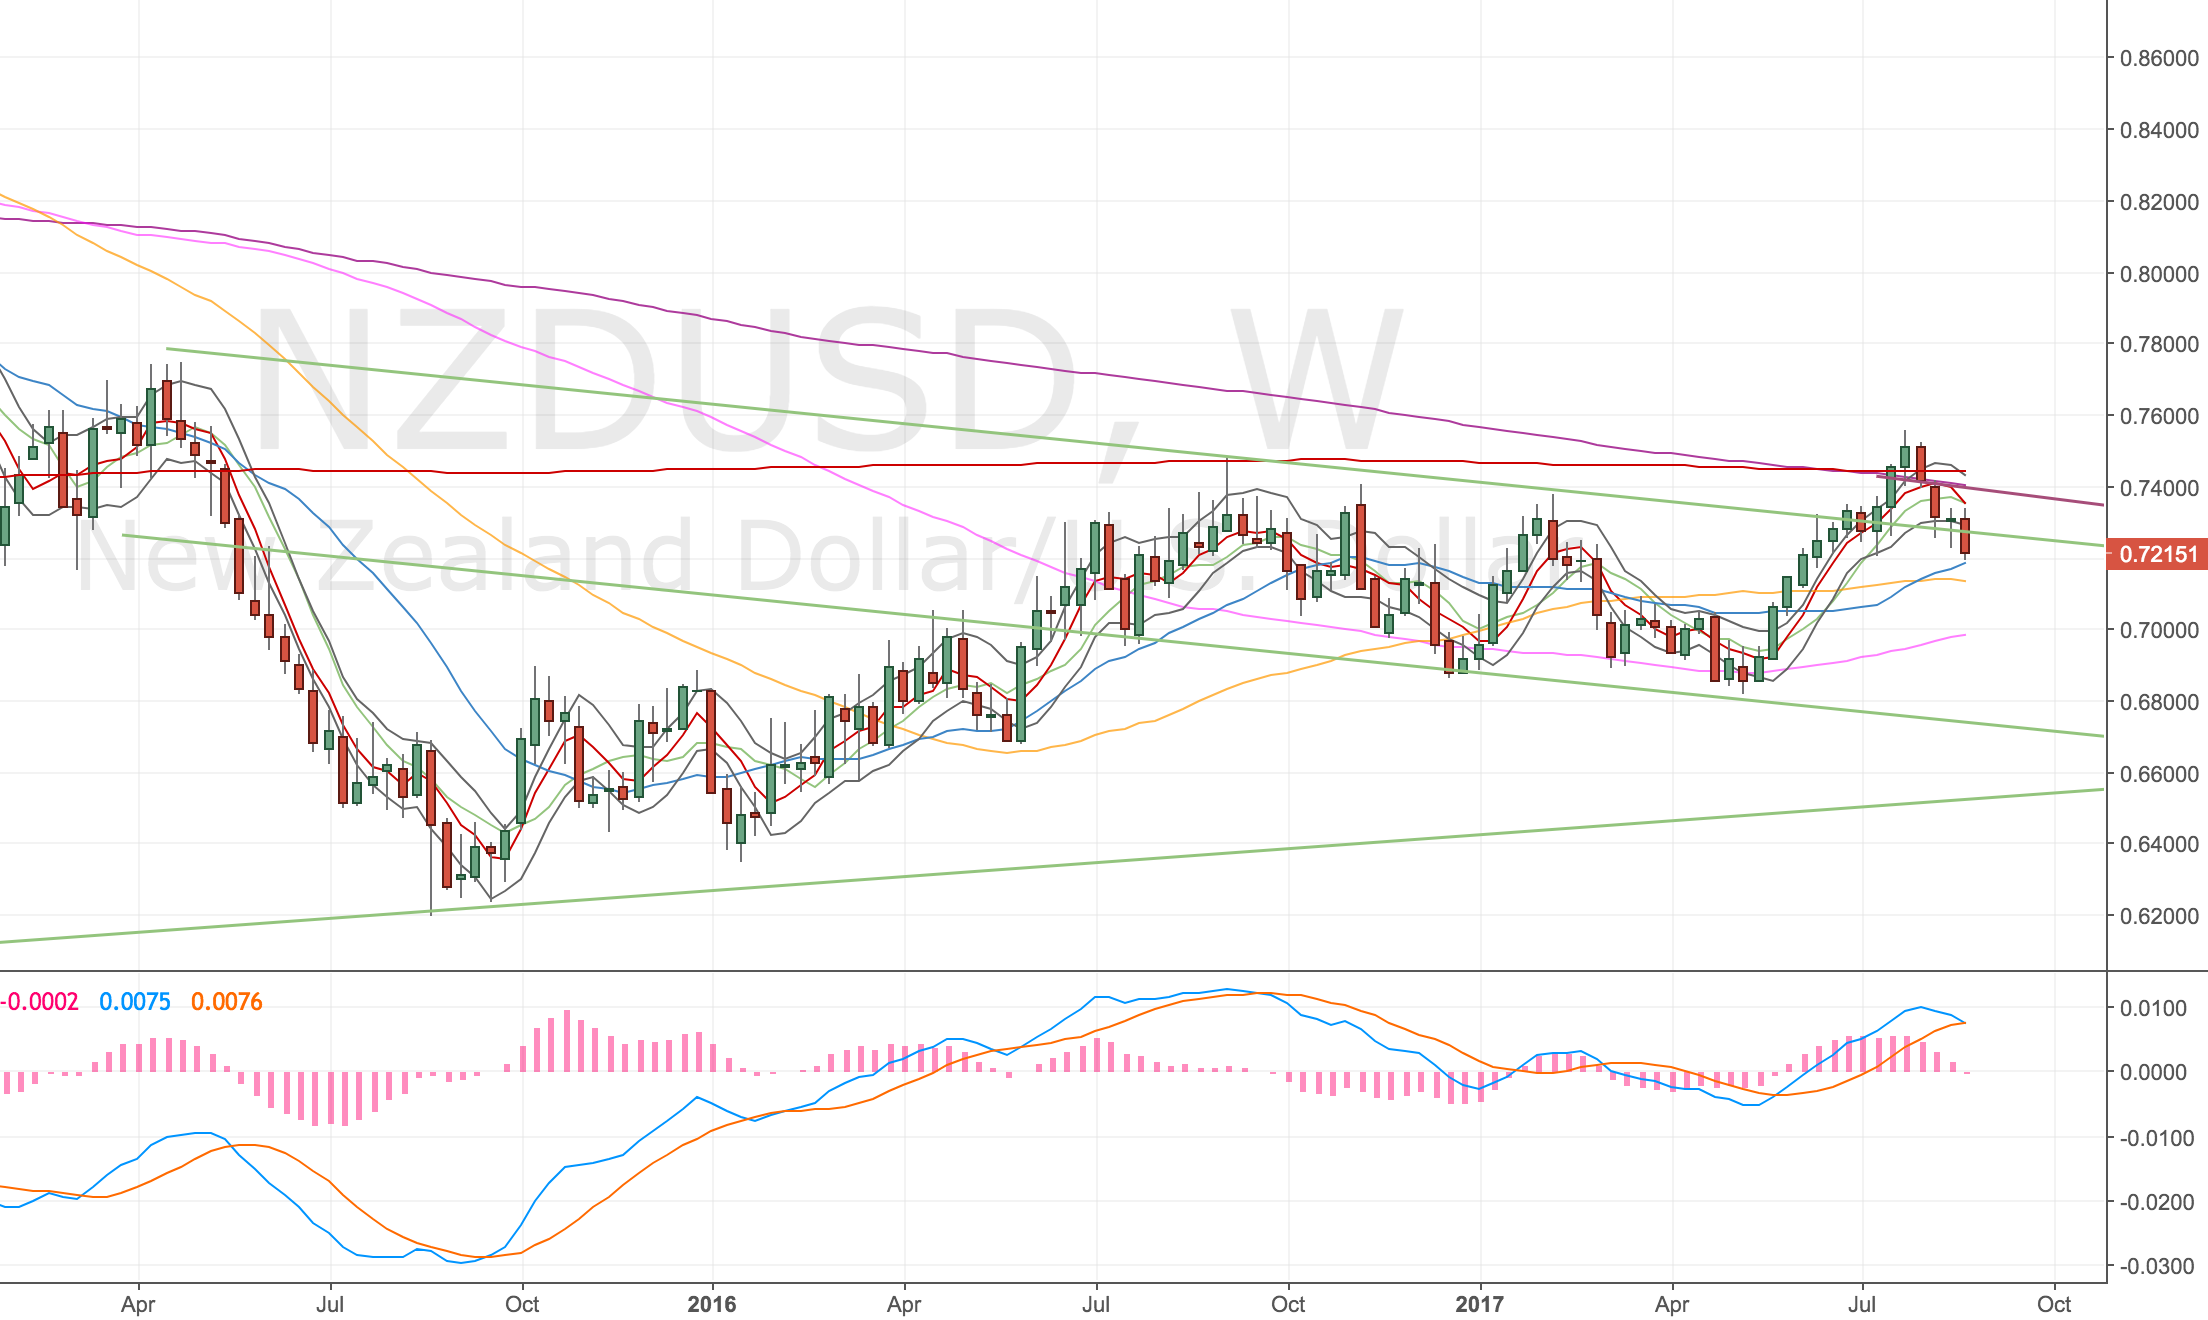
Weekly chart

Price has just touched the w20 but can easily go to the w50. Really not sure this is a great set up.

NZDUSD Weekly Chart – 24 Aug 17

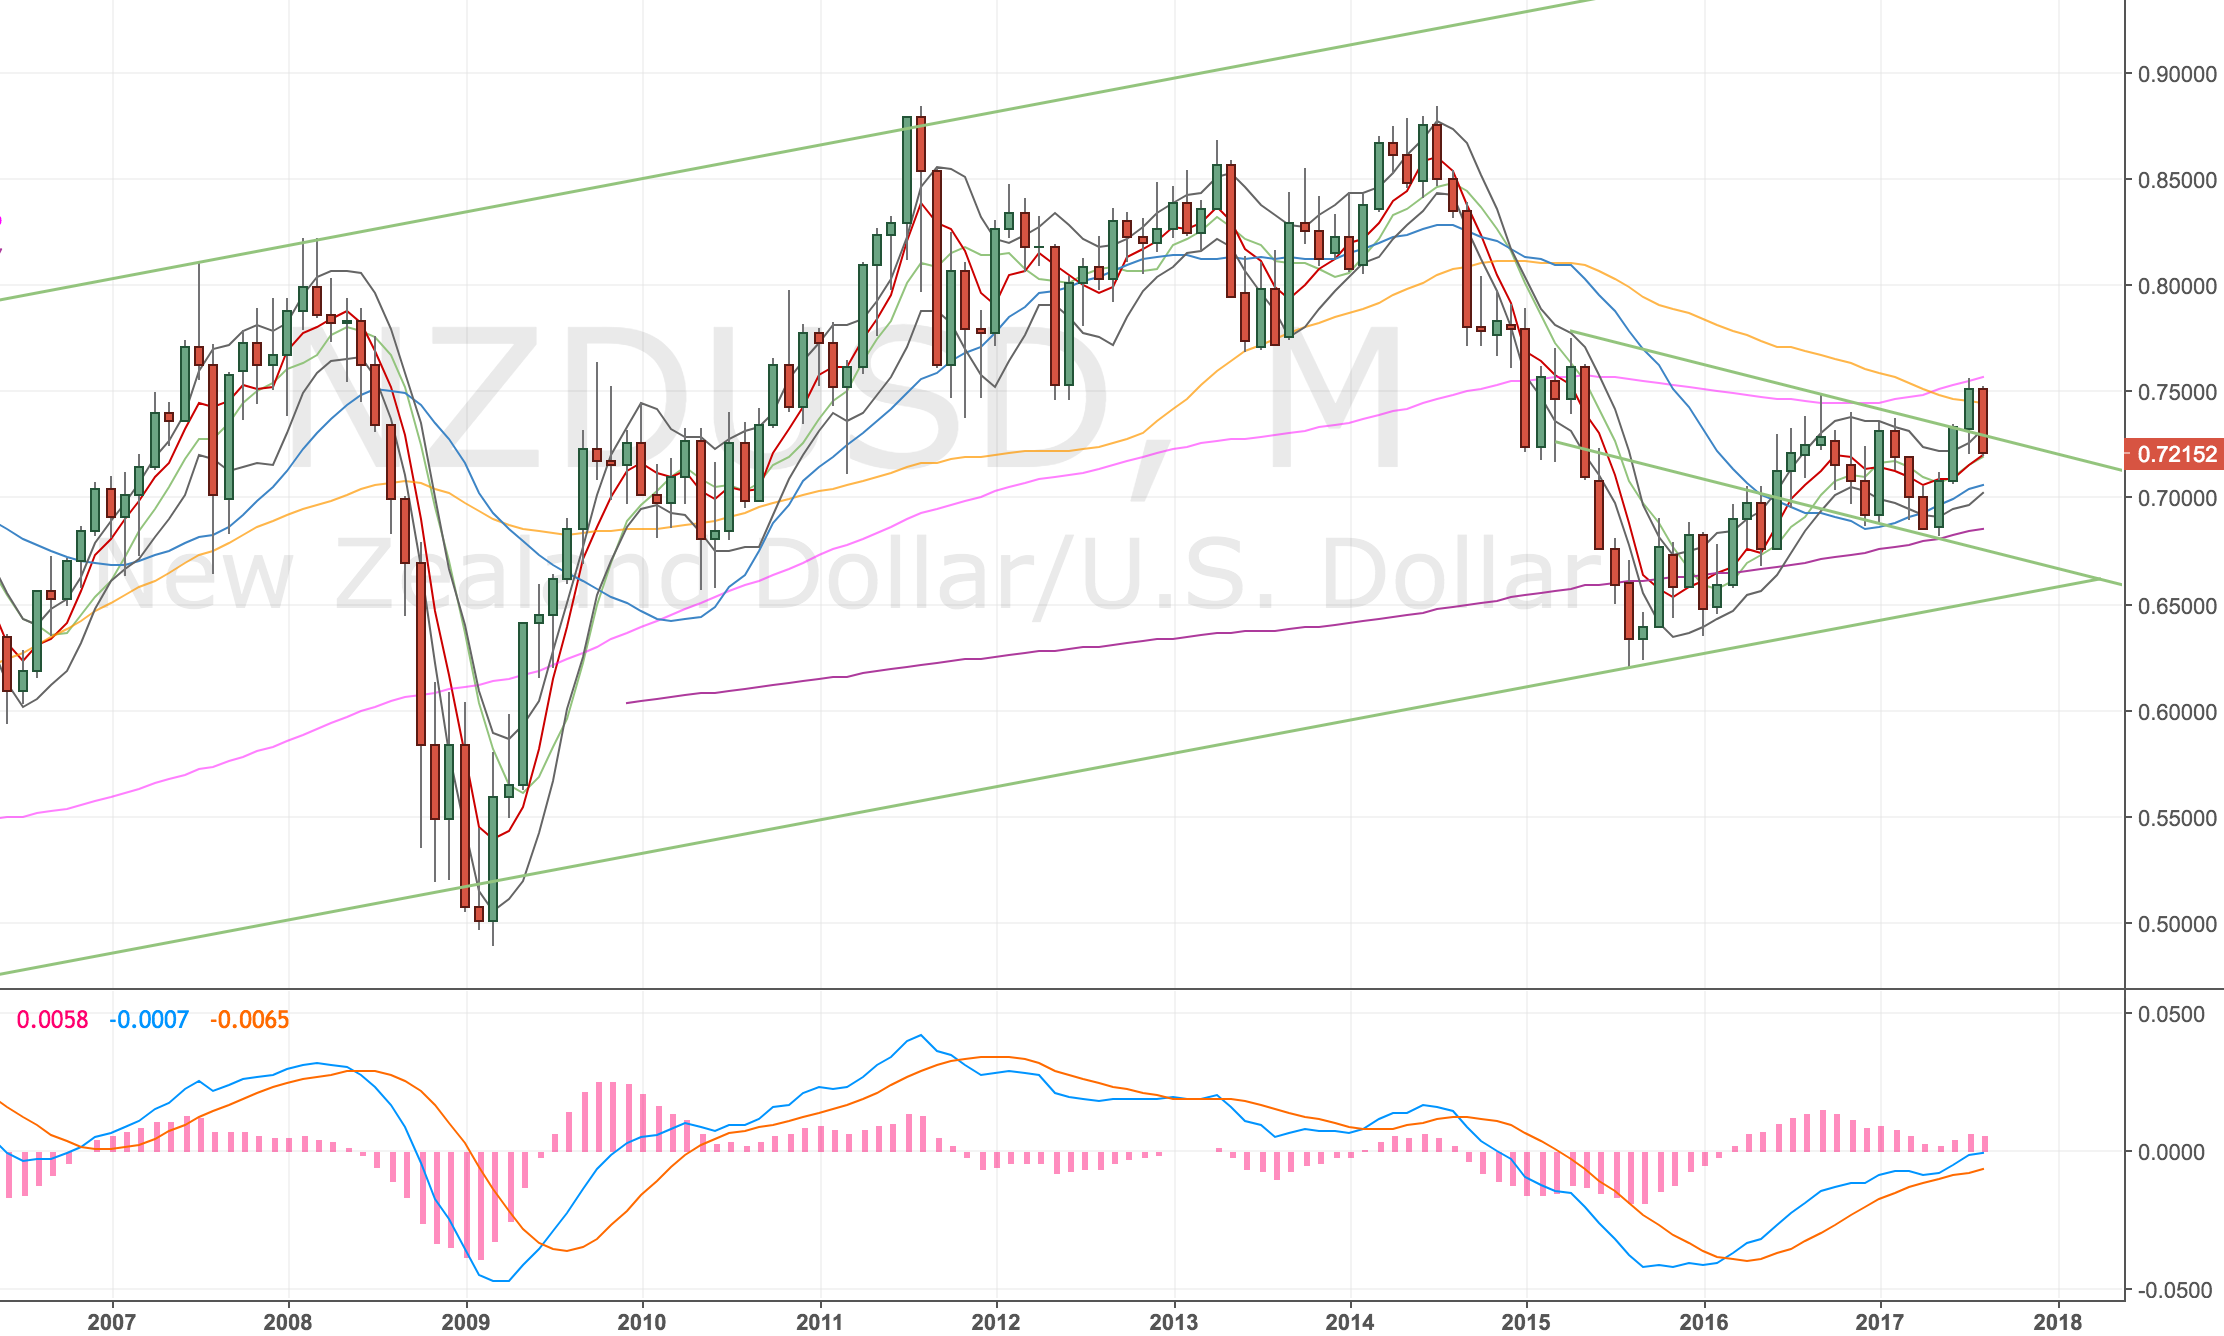
Monthly chart

Price is touching the m5, another positive sign, but ultimately I think the daily chart is a little troubling. I guess there’s enough going on to warrant the trade.

NZDUSD Monthly Chart – 24 Aug 17

Changed my target – 25 Aug

Just a quick update – I reconsidered my target and given the recent test, decided to go for the 4h100 instead. Stop is still the same. New set up is …


Acc risk: 0.75%
Long: 0.7218
Stop: 0.7185 (33 pips)
Target: 0.7300 (4h100, 115 pips, 3.48x RR)

Hit my target – 29 Aug

Well I thought this would never happen – so many doji bars – I thought I was finished. But we hit target at 0.7288. Pretty fortunate given the less than perfect set up. I can see this working out again later though, when we head a little lower.

New NZDUSD entry

Sometime later – I got another set up on the NZDUSD.

EURUSD DST Short – 3 Aug 17


Acc Risk: 0.5%
Short: 1.1868
Stop: 1.1918
Target: 1.1640 (4h100, 228 pips, 4.56x RR)
Mindset: Positive, like the set up, but feel the trade has further to run.

Update

Took my first profit manually! – 9 Aug
CPI figures came out bearish – 11 Aug
Still in the trade waiting – 19 Aug
Still here, trend channel looks to be breaking – 24 Aug
Stopped out – 25 Aug

Spotted this set up doing my morning scans, noticed price had diverged into resistance on the 4h and 1h. The resistance was on upper trendline on the daily chart and into MA resistance on the weekly (w200) and monthly (m50).

So a lot of nice factors in my favour.

Didn’t manage to get any screenshots! Was in a bit of a rush.

Took my first profit manually! – 9 Aug


Acc Risk: -0.25% 🙂
Short: 1.1868
Stop: 1.1918
Target: 1.1600 area (268 pips, 5.36x RR)
Mindset: Still like the set up

I’ve split my trade and took my first profit manually just ahead of the 4h100. I always get annoyed when I do this – I should just set and forget and let the market decide when I exit. Shortly after I closed the trade 20 pips off the 4h100 price went down and tested it. These things eat away at your performance and you often regret the decision immediately after you’ve made it.

I’m leaving the remainder to run after a chat with Charlie, I have a feeling we’ll be able to get lower, but this is based on nothing other than speculation.

The trade is paid for now, I’ve banked £45 and I’ve got £18 plus charges at risk. So either way I’ve made some money on the trade.

CPI figures came out bearish – 11 Aug

The CPI figures were a miss, not a big miss 0.1% instead of 0.2% predicted. The Euro has rallied I’m not convinced this will run though, the trend is still down. If we do come higher we get a new divergence short set up which would be great. That would give me more certainty in a run lower. So I’d be quite happy to get stopped out now and re-enter again later.

At the moment price is chopping around the 4h50 which actually feels like a good shorting zone, but no set up so not going to trade it.

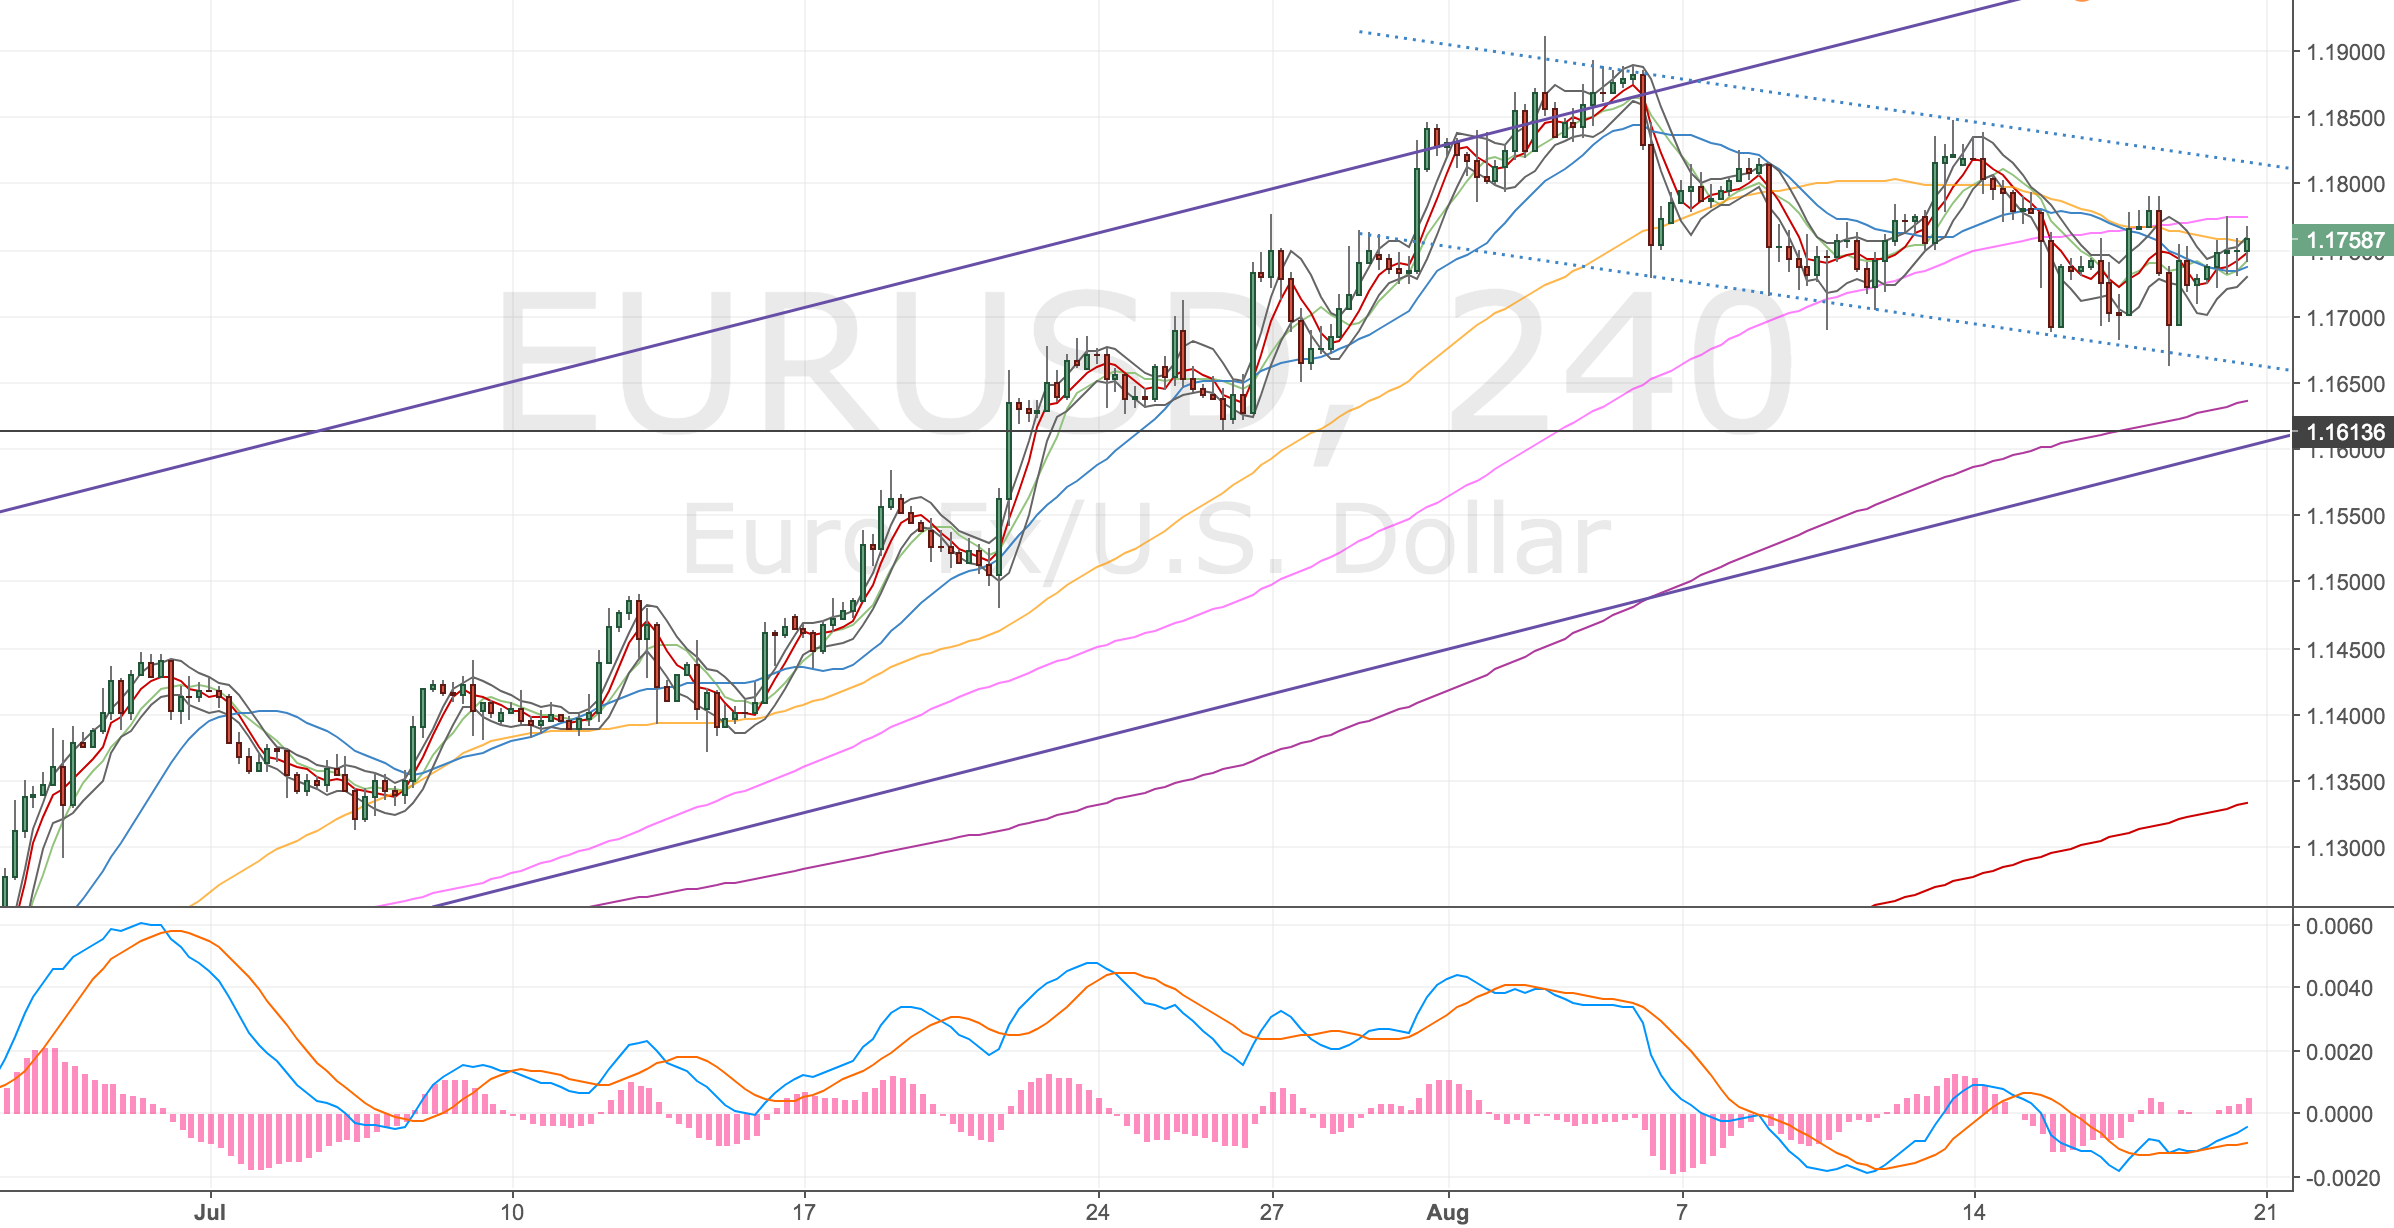
EURUSD 4H Chart – 11 Aug 17

Still in the trade waiting – 19 Aug

I’ve been sitting on this trade waiting for the 4h200 to be tested and I’m still waiting! I can see this getting touched around the recent lows at 1.1660ish. Often happens when you use moving averages as targets. I thought we might be forming a triangle but it looks like we’re in a mini down-trend which is holding for now.

More tests of the lower trendline than the upper, so I wouldn’t be surprised to get a test of the upper trendline again soon.

EURUSD 4H Chart - 19 Aug

EURUSD 4H Chart – 19 Aug

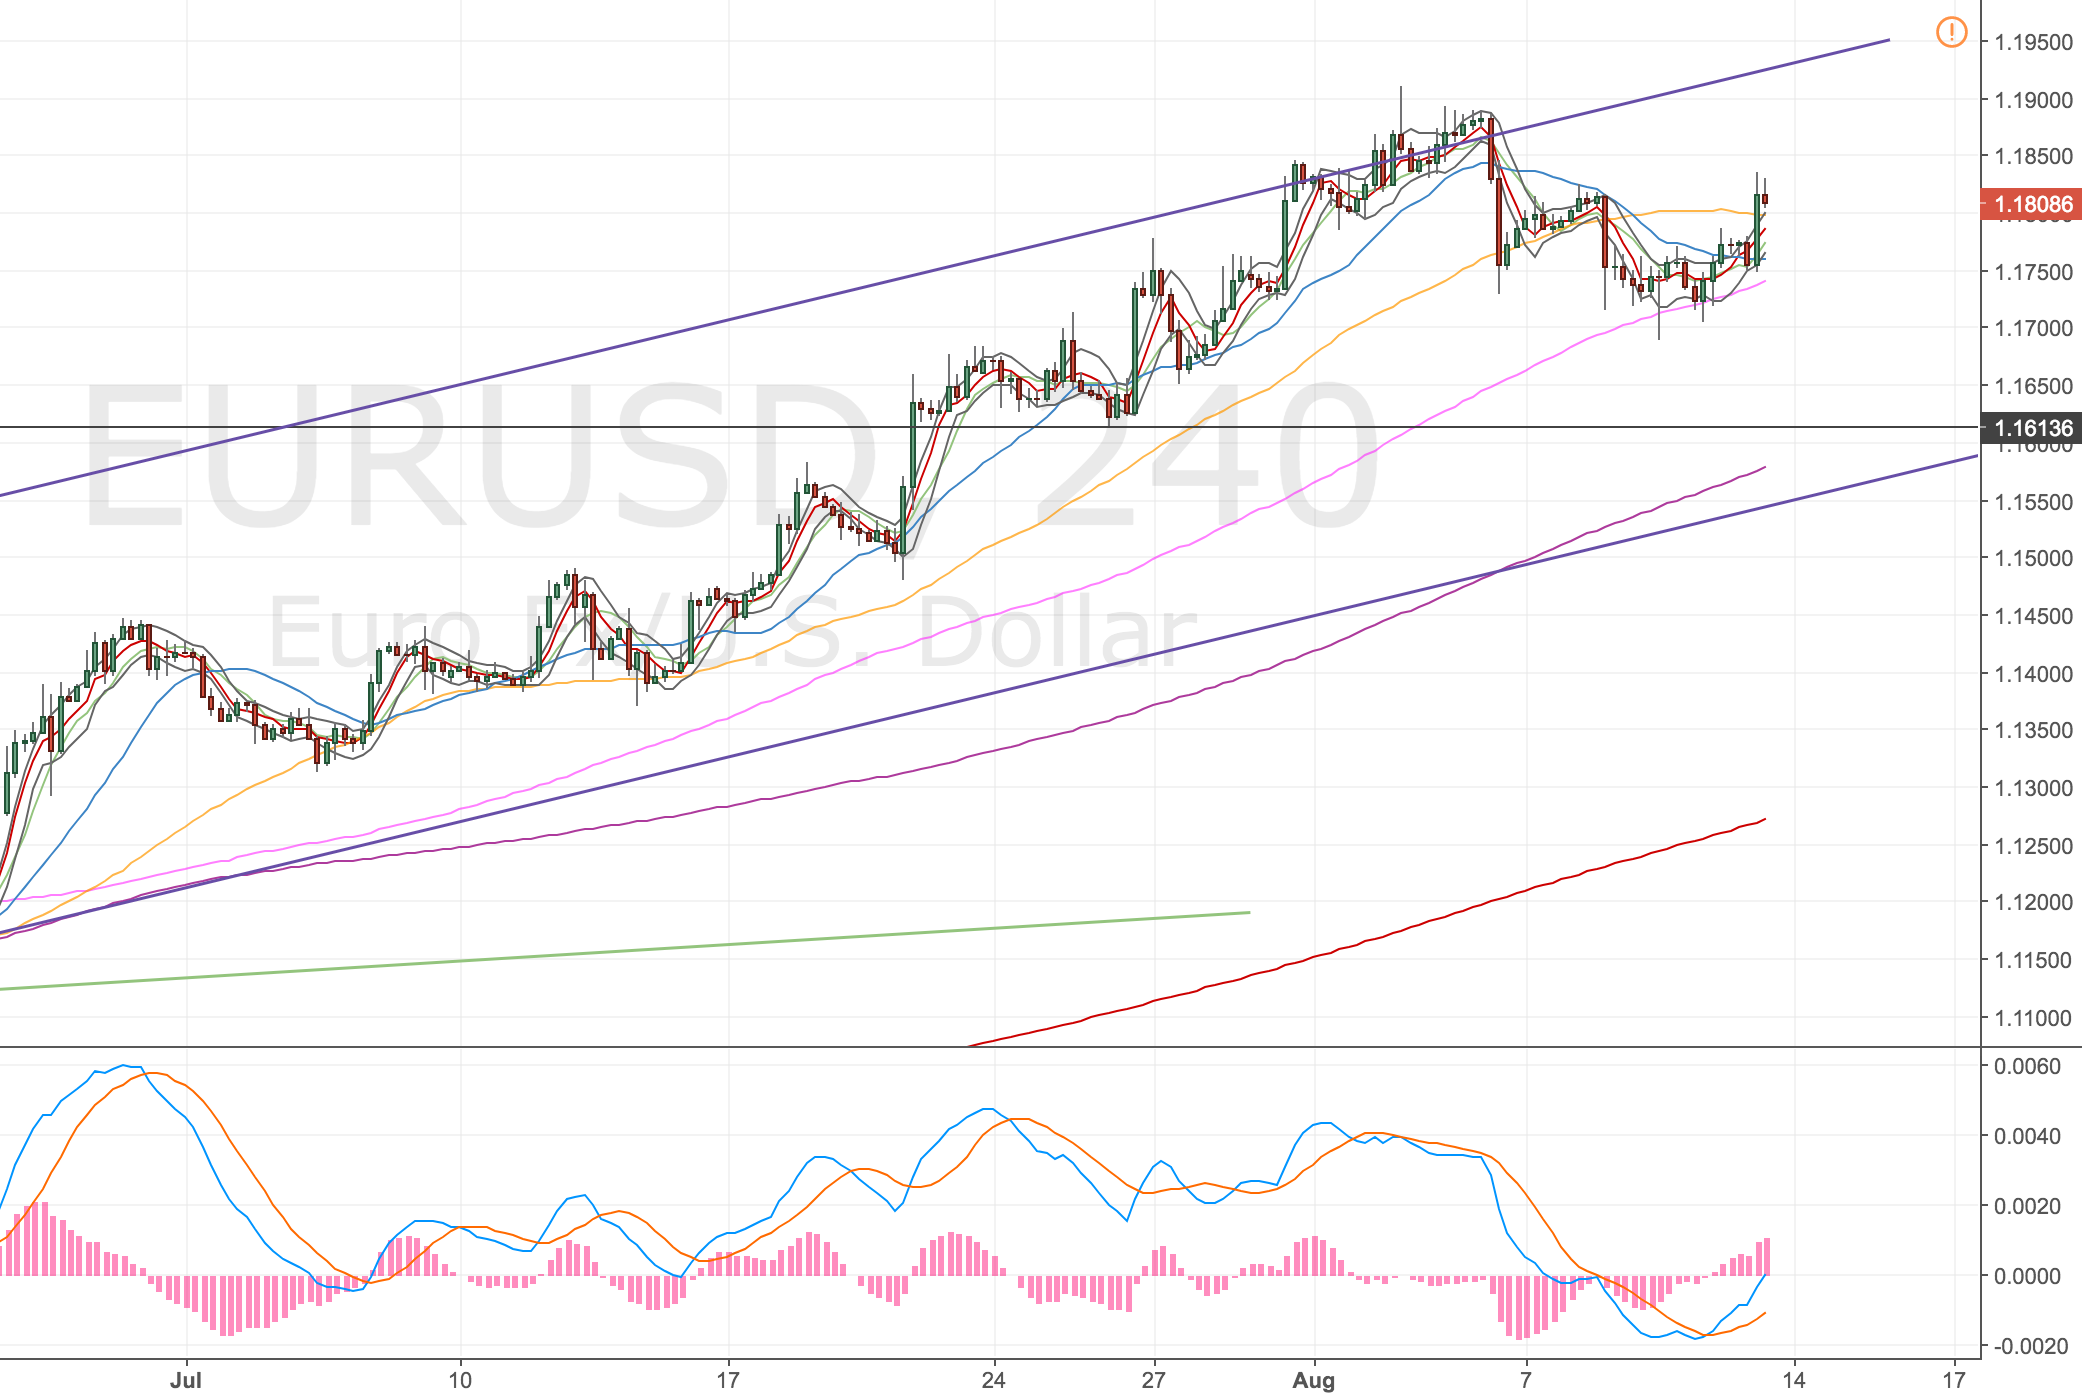
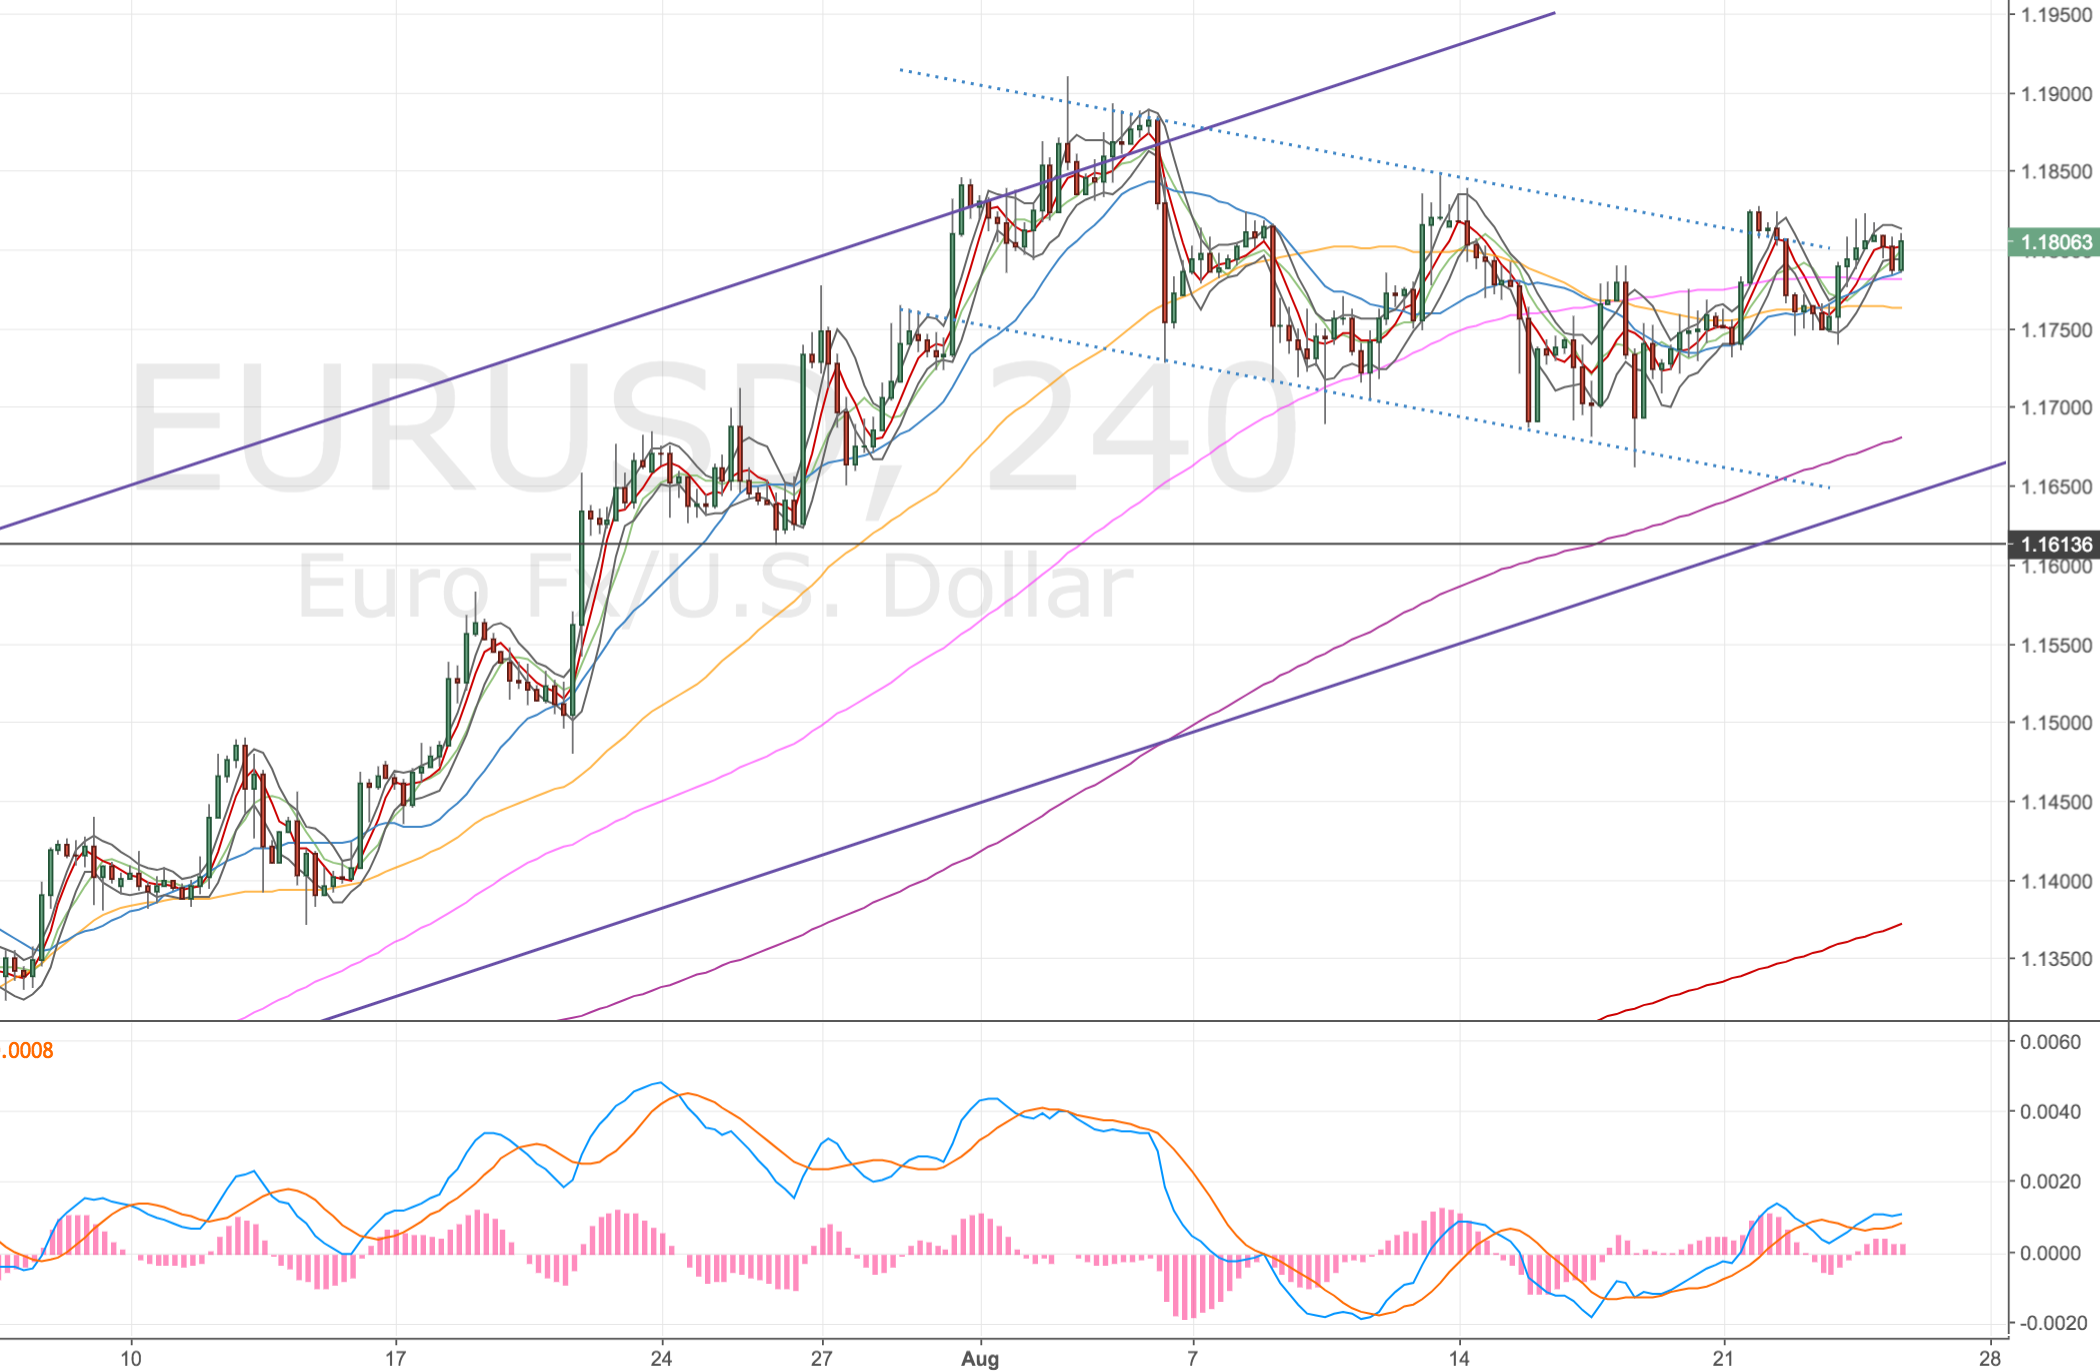
Still here, trend channel looks to be breaking – 24 Aug

Am I bored of this trade, this trend looks to be breaking now to the upside now. I definitely prefer those quicker moves that are over in a few days. This has dragged on for ages. Something I’ve seen happen a lot with trades is an initial flush down a pause and then a move back to the prior low, usually to coincide with a moving average target. E.g. I’m holding for a lower level target that ends up being the prior low I.e. I could’ve been out of the trade a couple of weeks back.

Not sure there’s anyway to trade that, but just an observation.

EURUSD 4H Chart – 24 Aug 17

Stopped out – 25 Aug

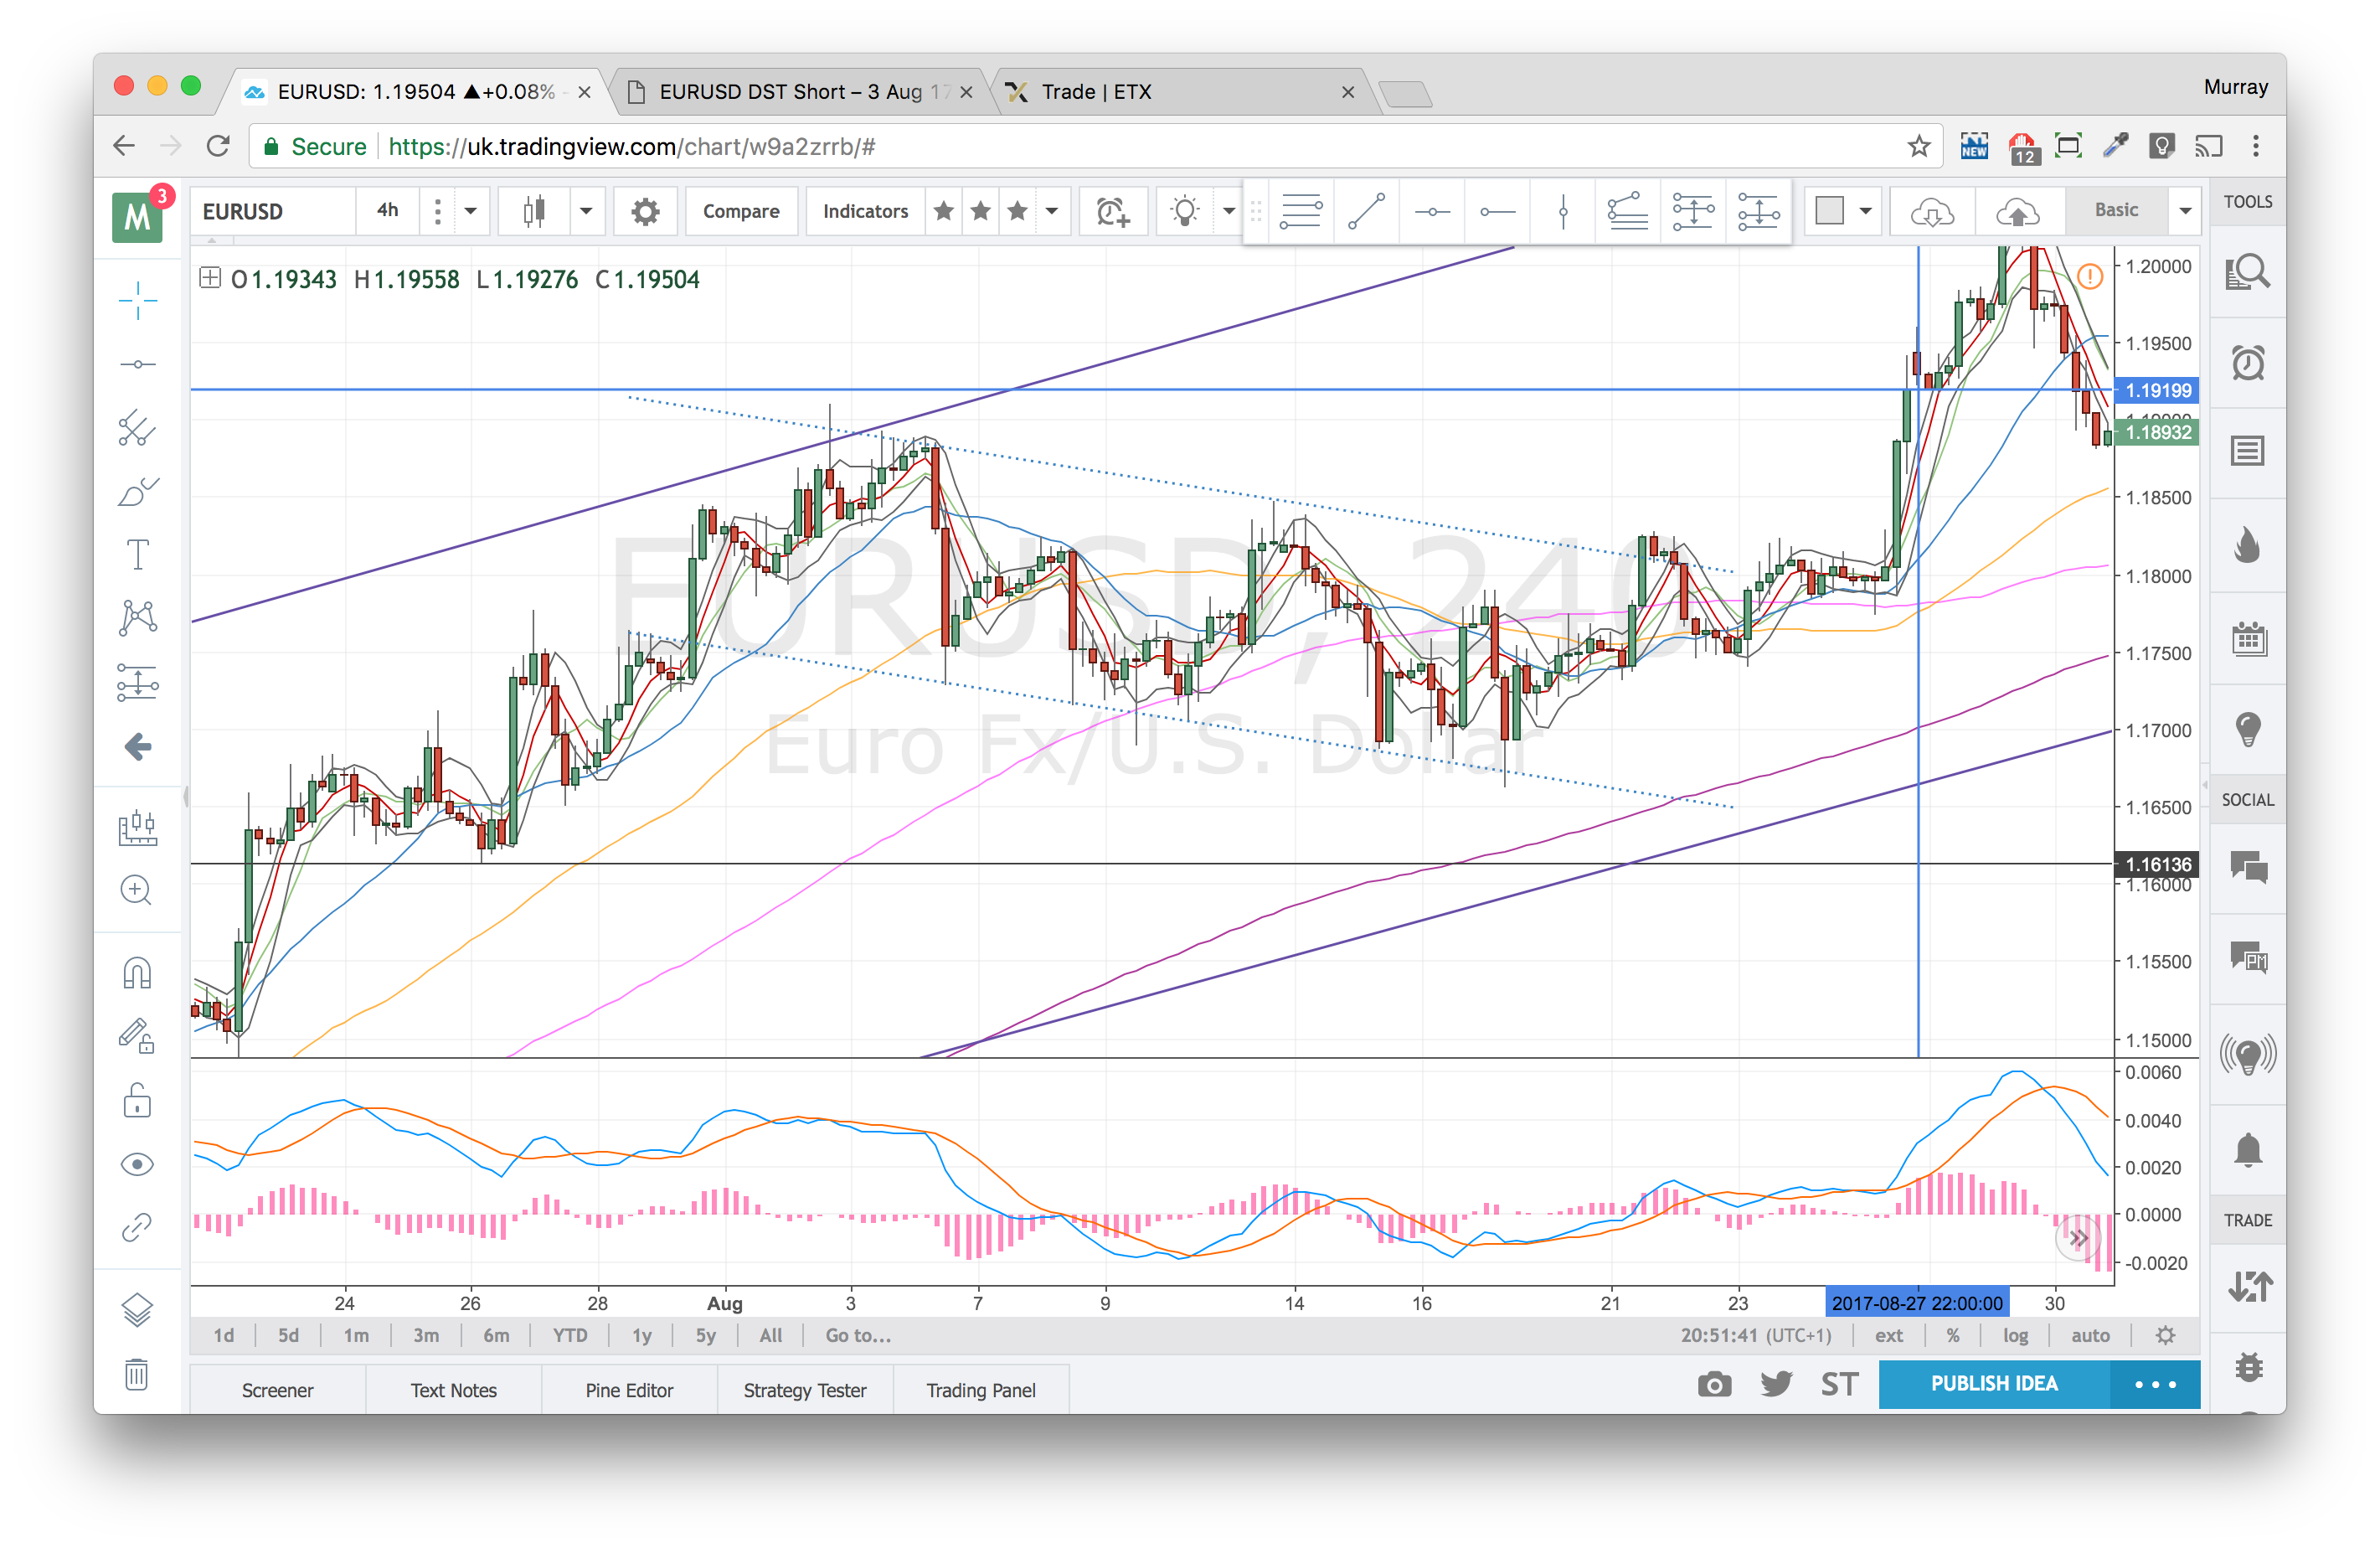
Finally got stopped out of this trade, as I suspected, price was heading higher. Would I have done anything differently? No. I took partial profits and tried to run the rest based on my analysis which I think was still sound. I can’t close a trade on a hunch alone.

So no problem there. Made a small profit on the trade.

Blue-cross hair shows the exit point of the trade.

EURUSD 4H Chart – 25 Aug

CADJPY DST Short – 13 Jul 17


Acc Risk: 0.5%
Short: 88.77
Stop: 89.39 (62 pips)
Target: 84.60 (418 pips, d500, 6.74x RR)
Mindset: Like the entry – other JPY pairs may have started to turn?

Updates

Still here waiting – 20 Jul
Stopped out – 25 Jul
Got another set up – 28 Jul
Trade worked out but still tinkered with it – 3 Aug
Checking in with the trade afterwards – 11 Aug

Been watching the JPY pairs for a while now, looking for short set ups. I’ve not been tied to which JPY pair I’d short but so far I missed the EURJPY set up – that went over night – and I didn’t spot the USDJPY set up as it was during my work hours.

Not too worried though – I can still see more upside in the AUDJPY, GBPJPY and until now the CADJPY.

For this position I’ve slightly incremented my risk to the full 0.5%! I’ve decided I need to start increasing my risk, as currently, it’s much hard to hit my monthly targets.

4H Chart – set up

Double divergence.
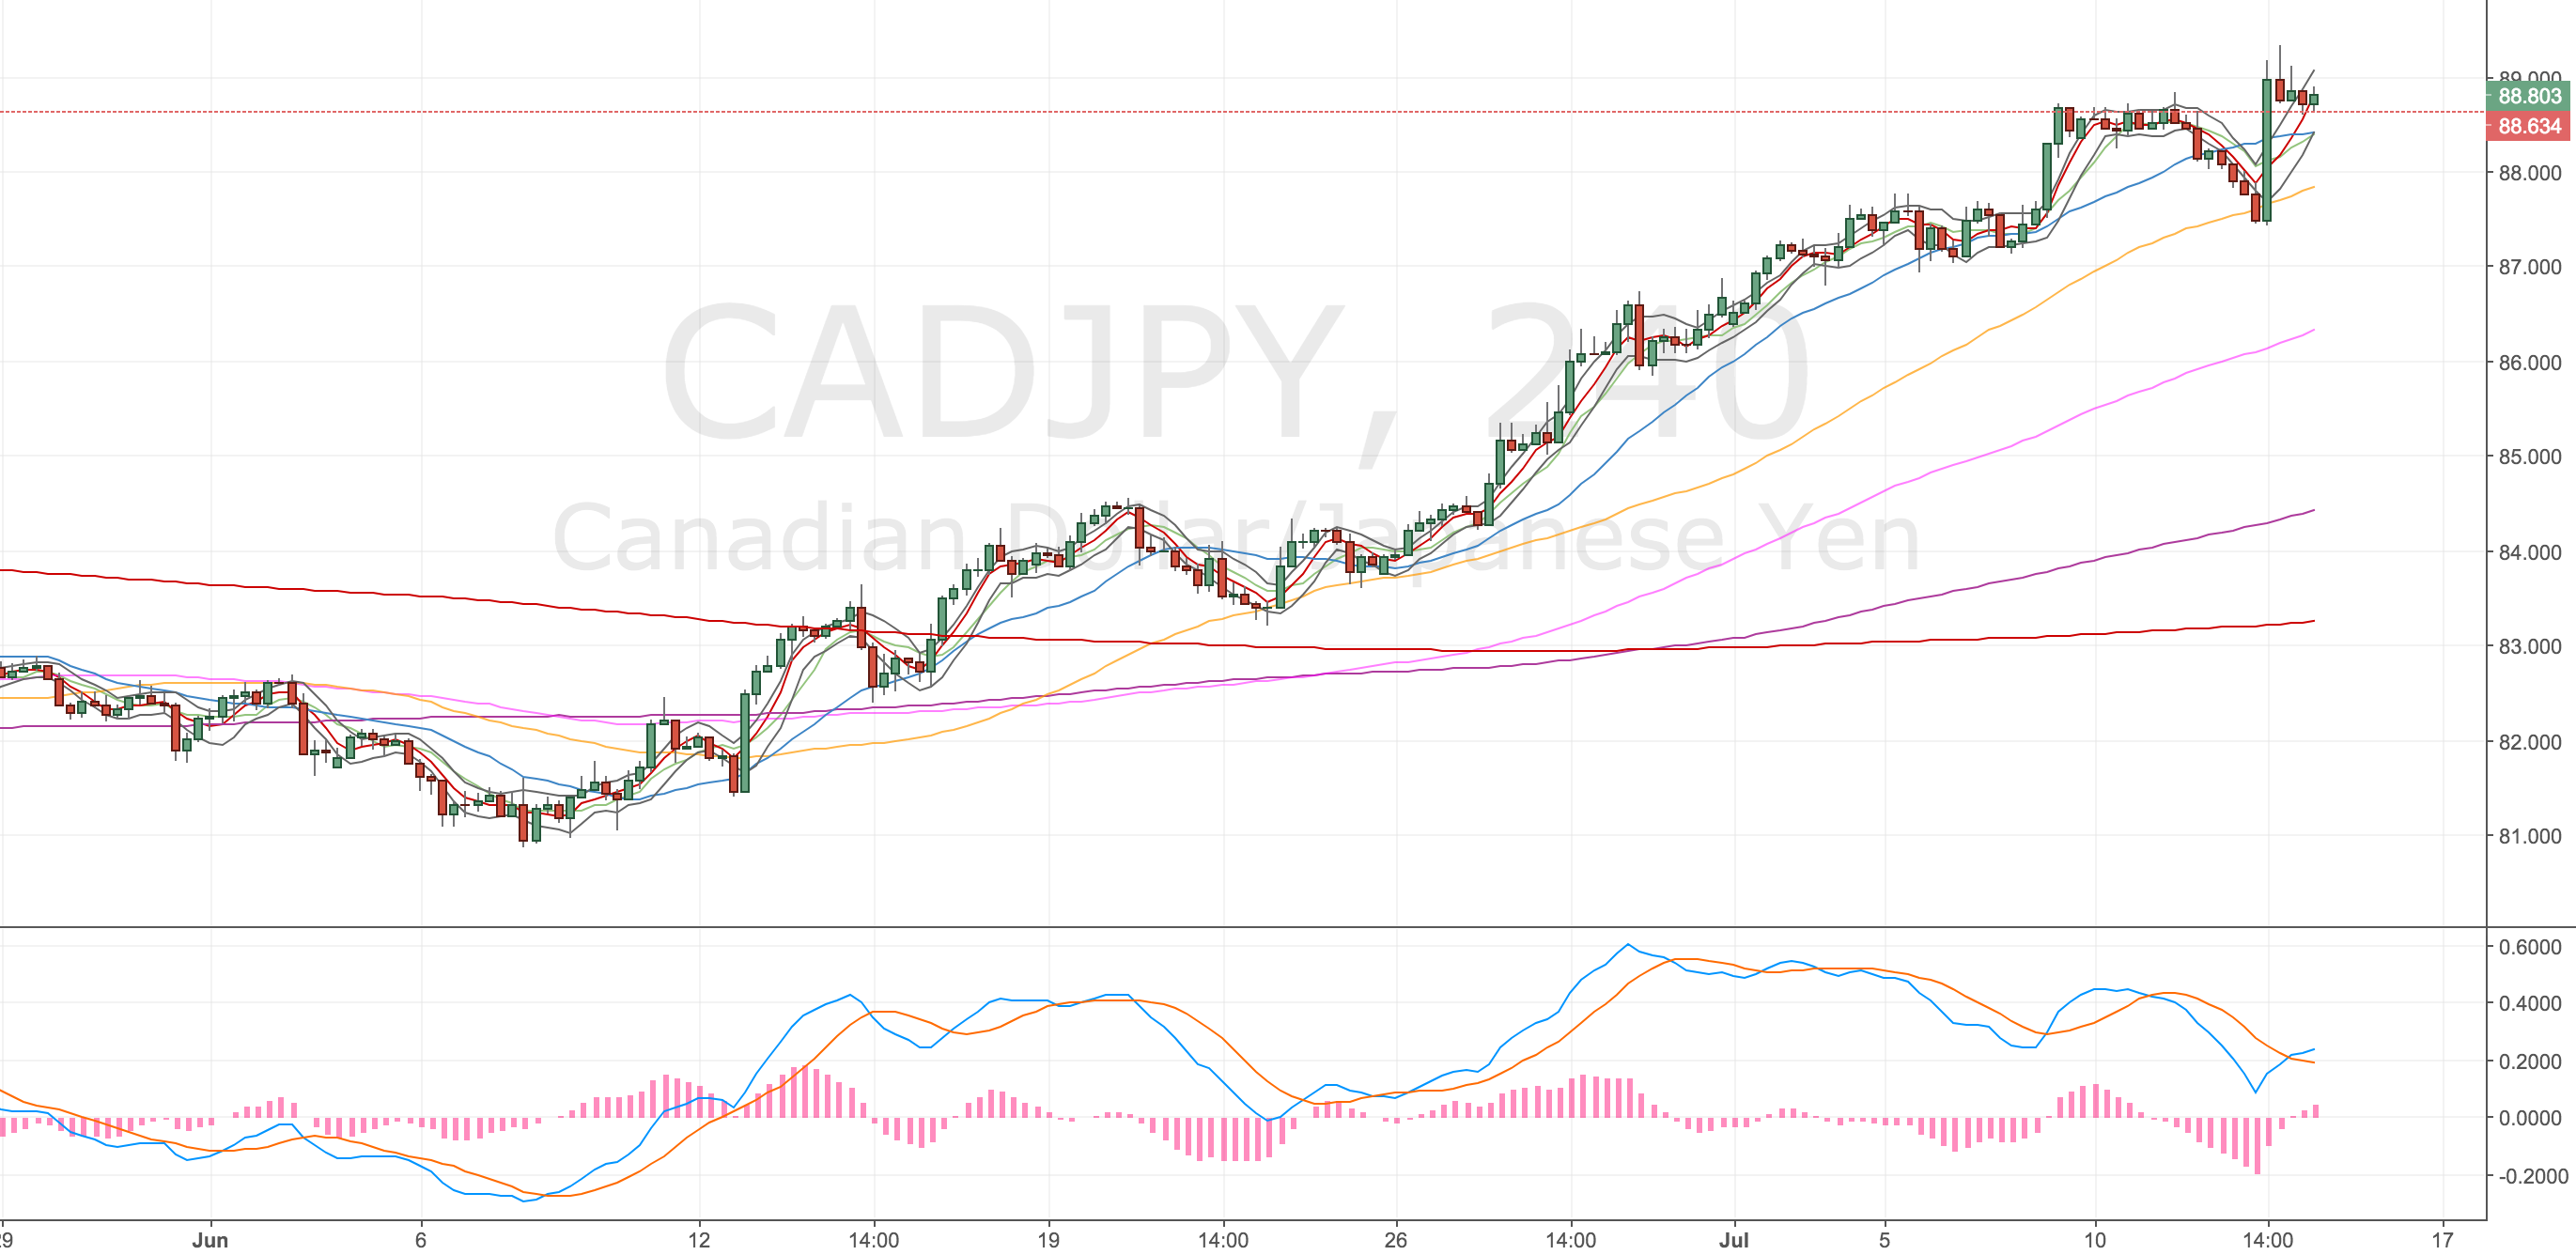
CADJPY 4H Chart – 13 Jul

1H Chart – confirmation
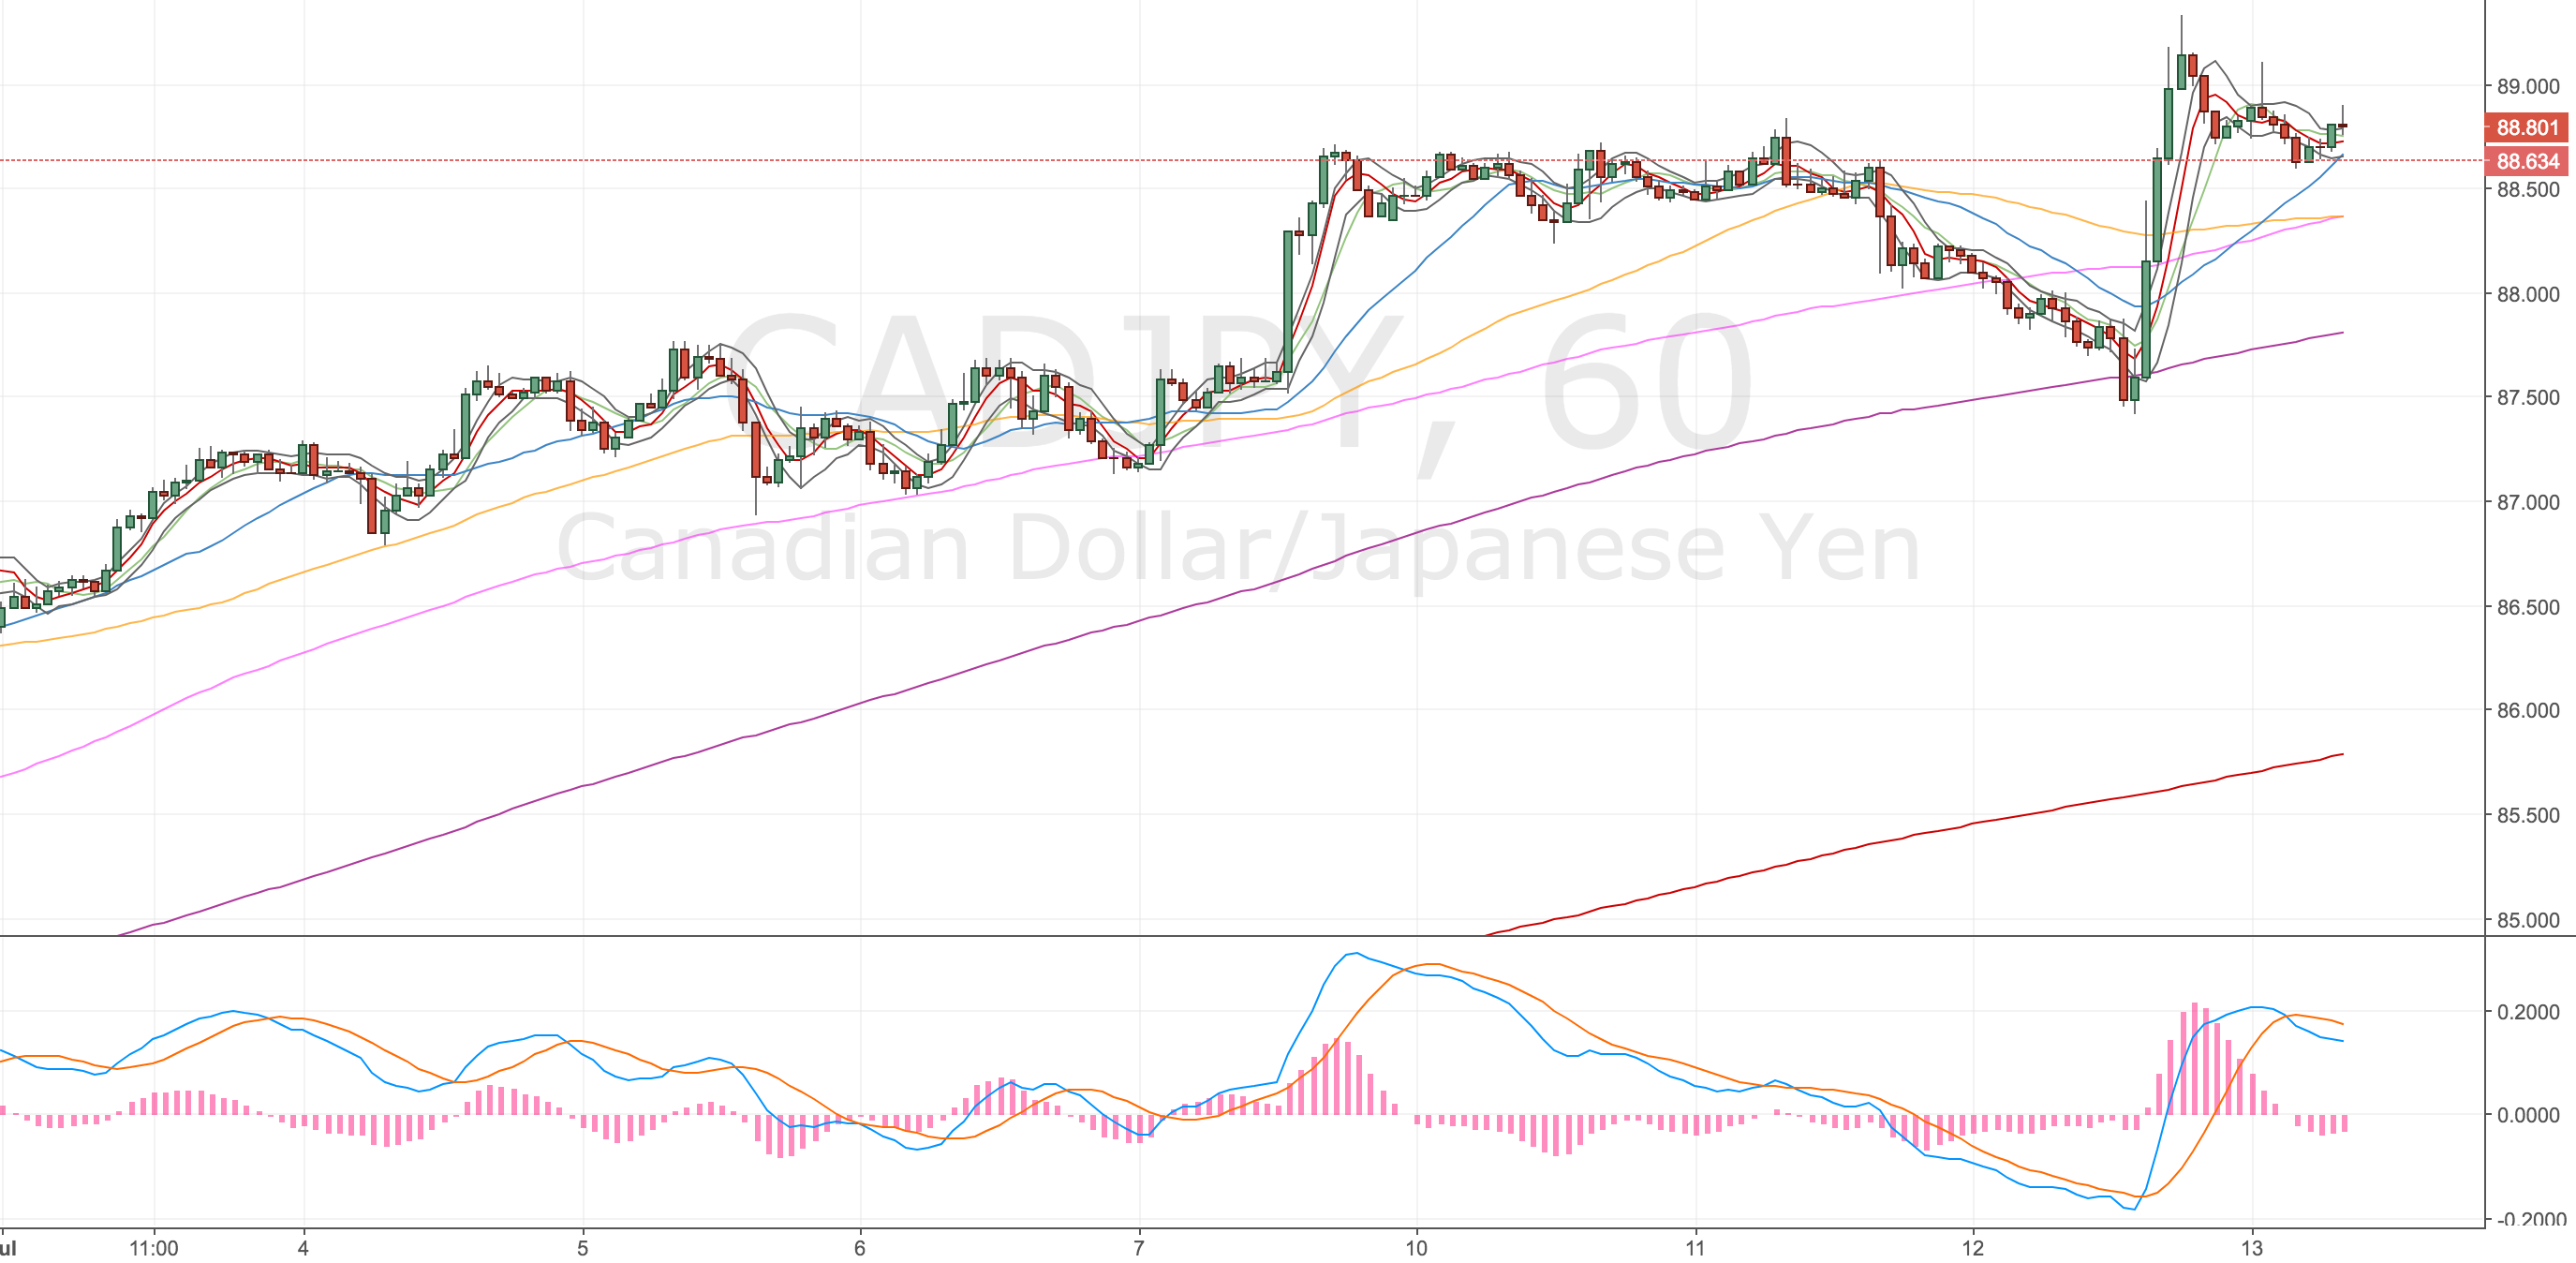
CADJPY 1H Chart – 13 Jul

Daily Chart

Aiming for the d500 or d50 – which ever is nearer at the time.
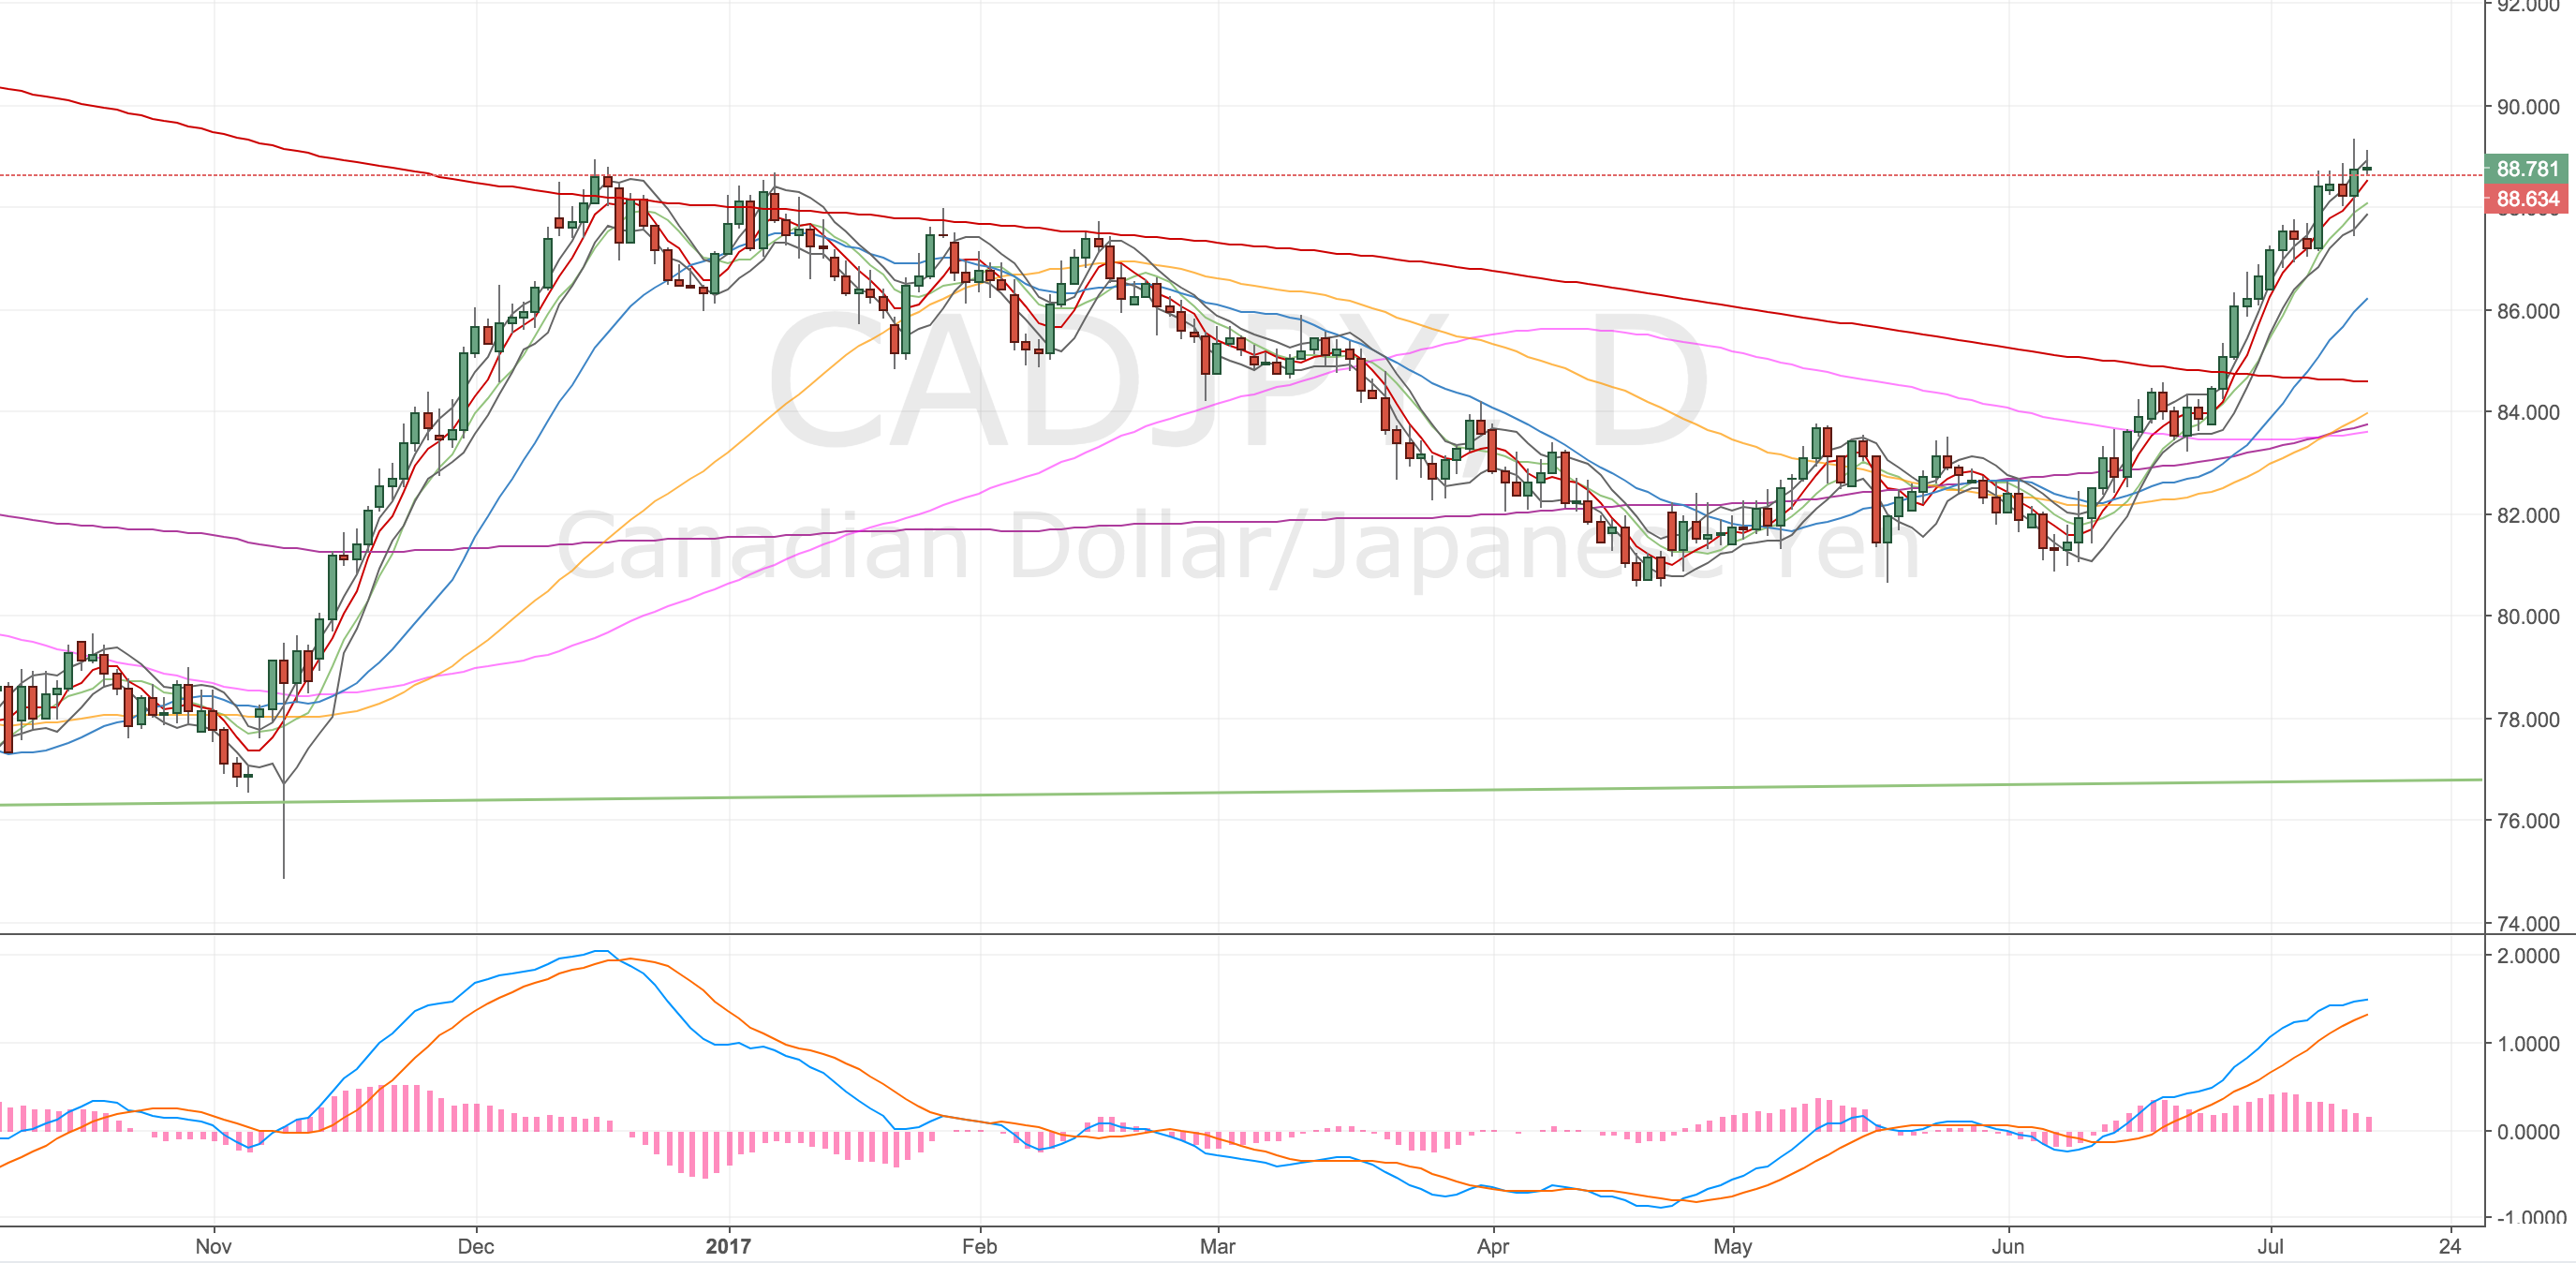
CADJPY Daily Chart – 13 Jul

Weekly Chart

Price action has run into the 500, might head to the 200, but I’m prepared to start shorting now.
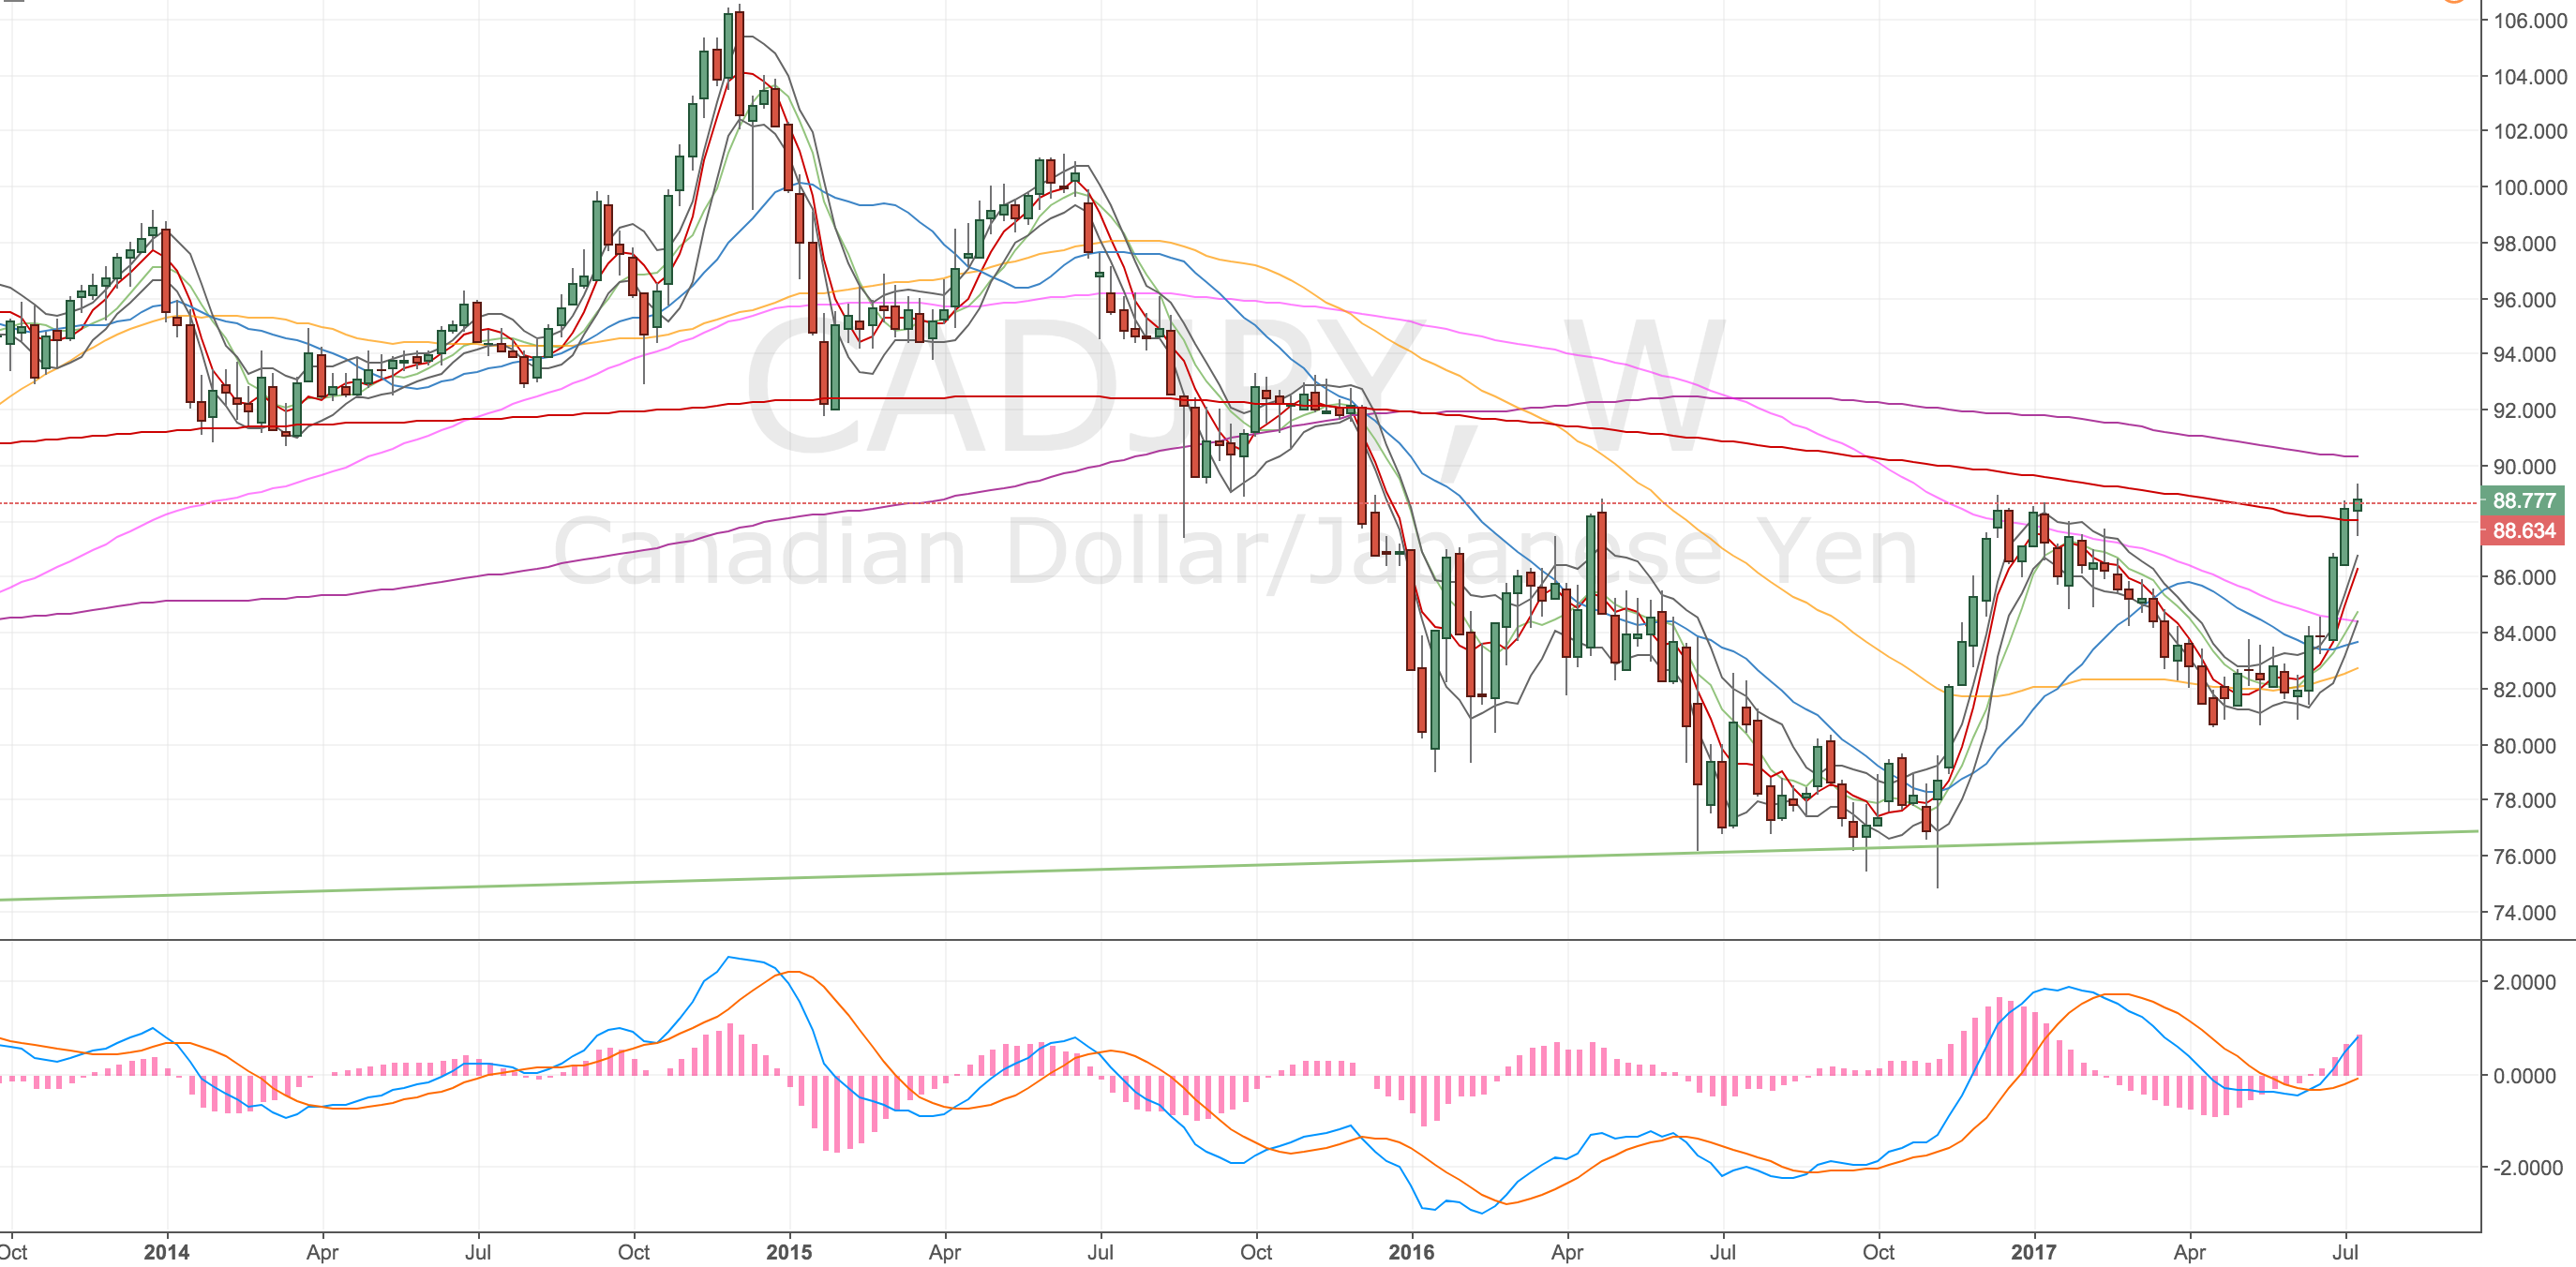
CADJPY Weekly Chart – 13 Jul

Still here waiting – 20 Jul

Just a mini update, I was quite excited about this trade but it’s gone sideways since I opened it. We’ve formed what looks like a triangle/wedge pattern to me. It looks quite bullish to me I and I can certainly see another swing high divergence forming. You’ll see all the other timeframe MAs I’ve marked on the chart, there’s a good cluster of MAs that would make a decent target if we do break down, but I’m mindful that we’ve not tested the d20 so, if we do break, I’ll need to scale out on the way down.

For the time being – I predict a stop out and another set up coming, probably next week or into August.
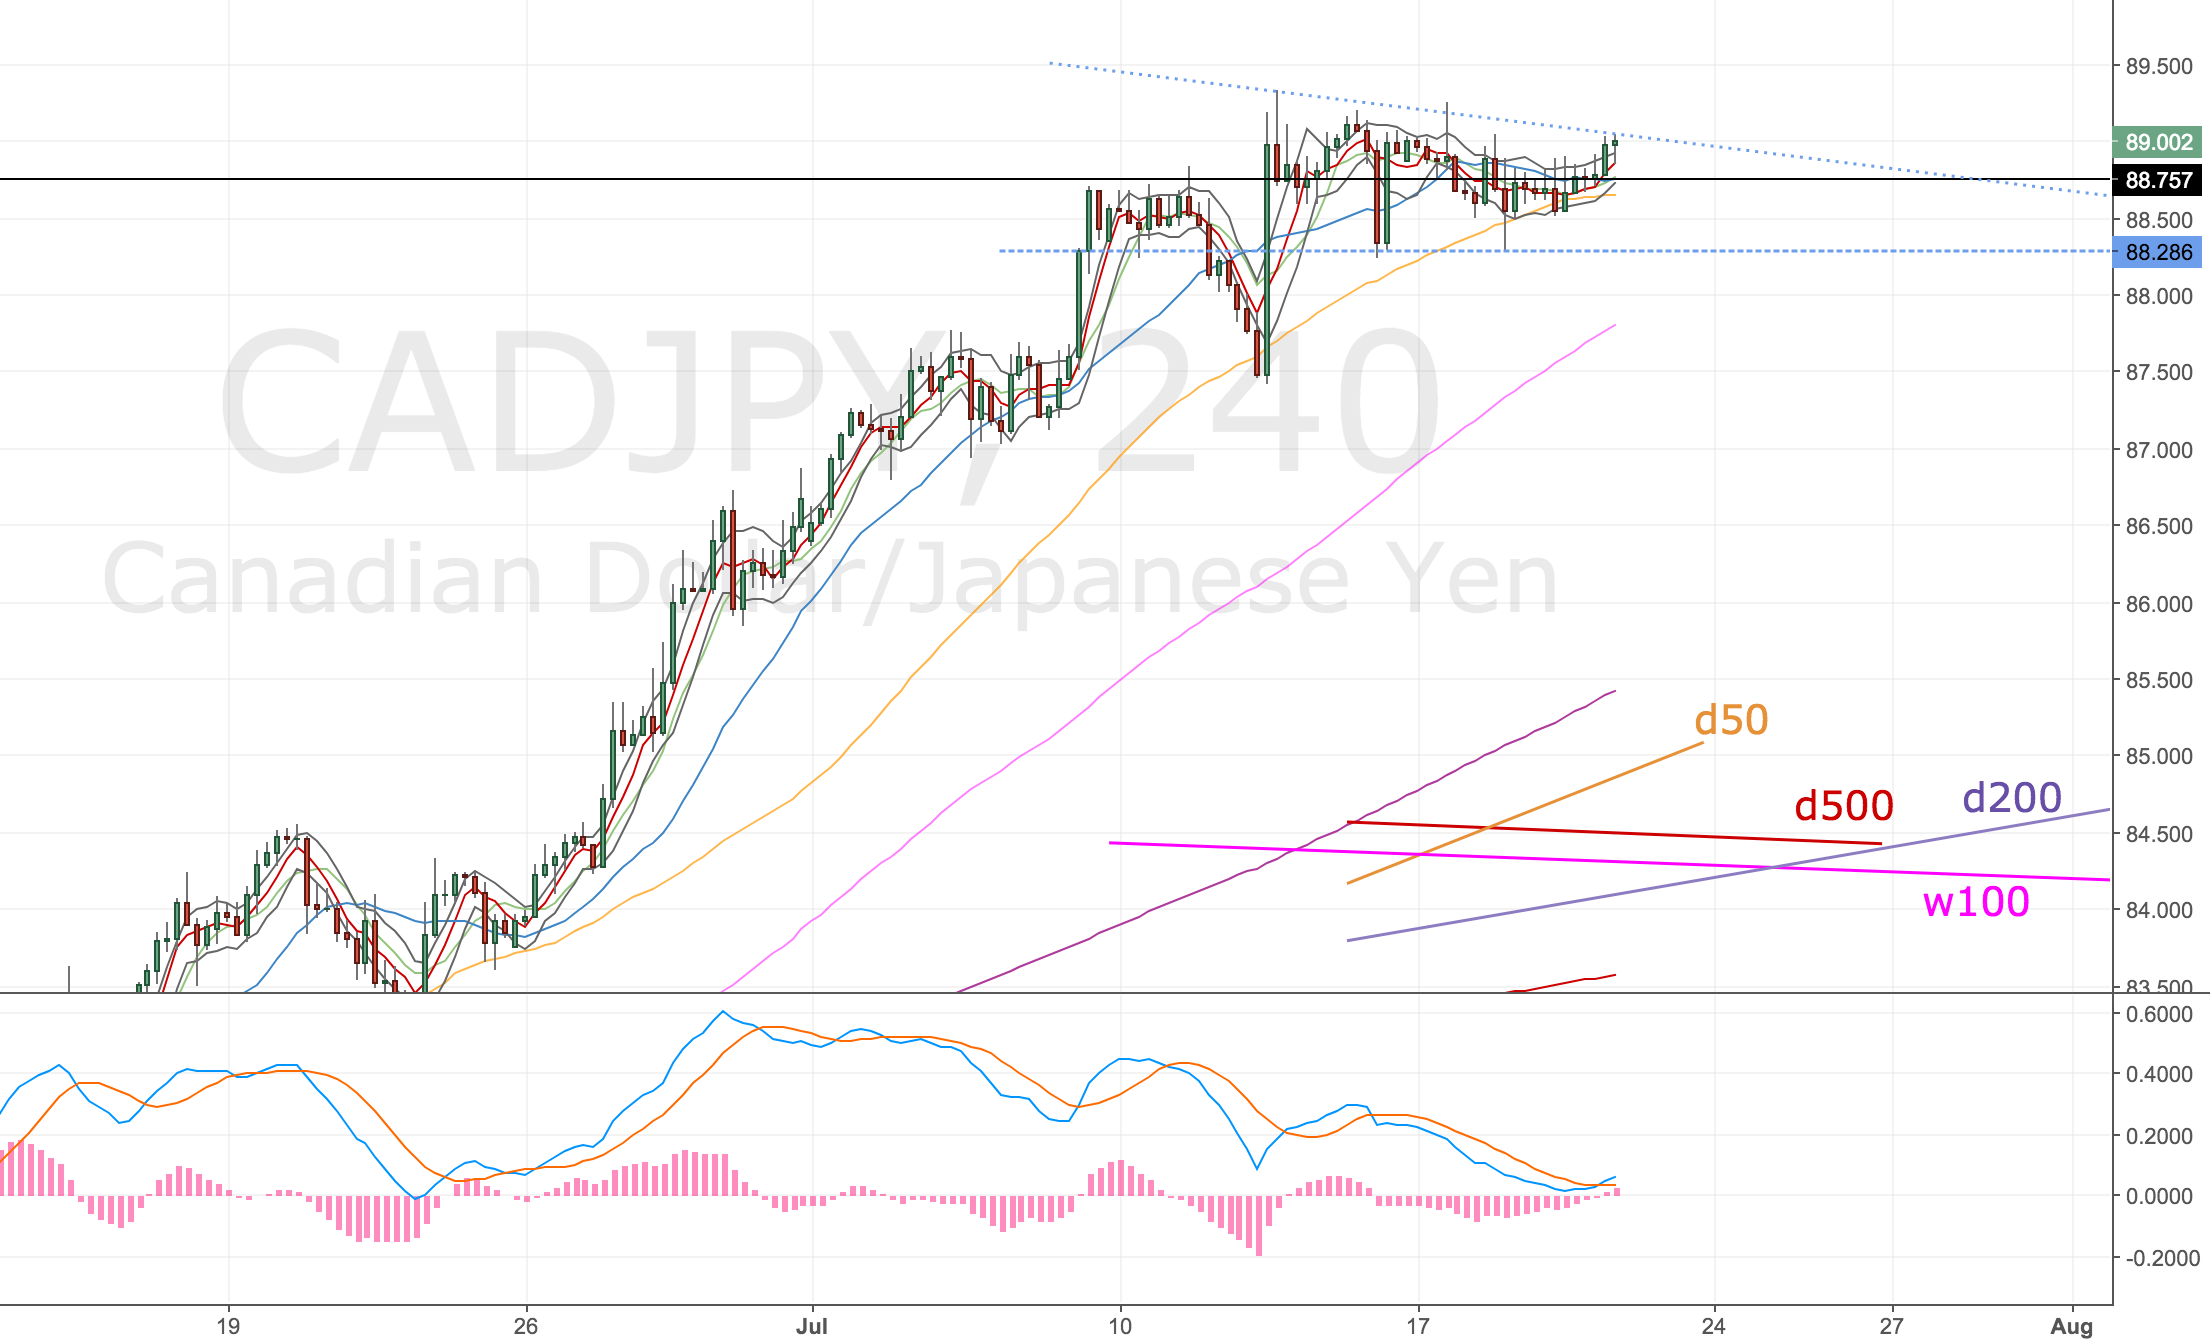
CADJPY 4H Chart – 20 Jul

I slept quite badly last night – not due to this – but I kept checking my phone to see how the asian session went with the Japanese quarterly report – I thought I’d finally get an outcome on this trade one way or another – but I didn’t 🙁 just more sideways price action.

Stopped out – 25 Jul

Price action just swung higher and stopped me out. Not sure where we’ll go from here – higher to the w200 – or rollover again. One of the hardest things I find is getting back into a trade, not that because I’ve lost I can’t re-enter, but that I’ll only re-enter on a valid set up so sometimes I have to let a trade idea go because it didn’t set up according to my rules.

I hate to see that.

Got another set up – 28 Jul

Well I missed a move down – as I thought I might, it happened on my birthday when I was out with family celebrating – no big deal, you’re gonna miss trades from time to time. I placed an order in the off chance I might get lucky and I did! Triggered in short at 88.95.


Acc Risk: 0.6%
Short: 88.95
Stop: 89.77 (82 pips)
Target: 86.76 (201 pips, 4h200, 2.5 RR)
Mindset: Risking more than I’d like but it’s a volatile currency and I’m on minimum position size. I can still see another stop out occuring

The w200 is still in the picture but the most recent swing high resulted in another divergence so taking the trade again. I didn’t take a screenshot because it was an order so scroll down for the result!

Trade worked out but still tinkered with it – 3 Aug

So the trade did start to break down and funnily enough, I can’t define it, but I just kind of new it was going to go my way. The price action down felt like it was going to stick this time. I guess it was consistently down, despite the retraces, each leg seemed to make a lower low.

I have a weekly divergence that I would love to trade, but it doesn’t feel part of my system, that would put the target at 84.40. I am happy to be out at the 4h200 though. I was very impatient towards the end and I thought my target level – being missed by 1 pip – was it, so I closed the trade a little higher. I was convinced the 4h200 was hit, although I didn’t check it at the time.

I’m annoyed that I messed with it, I should’ve left it to the order to take me out.

Today (7 Aug) we are trading at 87.30 which would’ve been an extra £10 to the pot. Not much but % wise it would’ve made a difference.
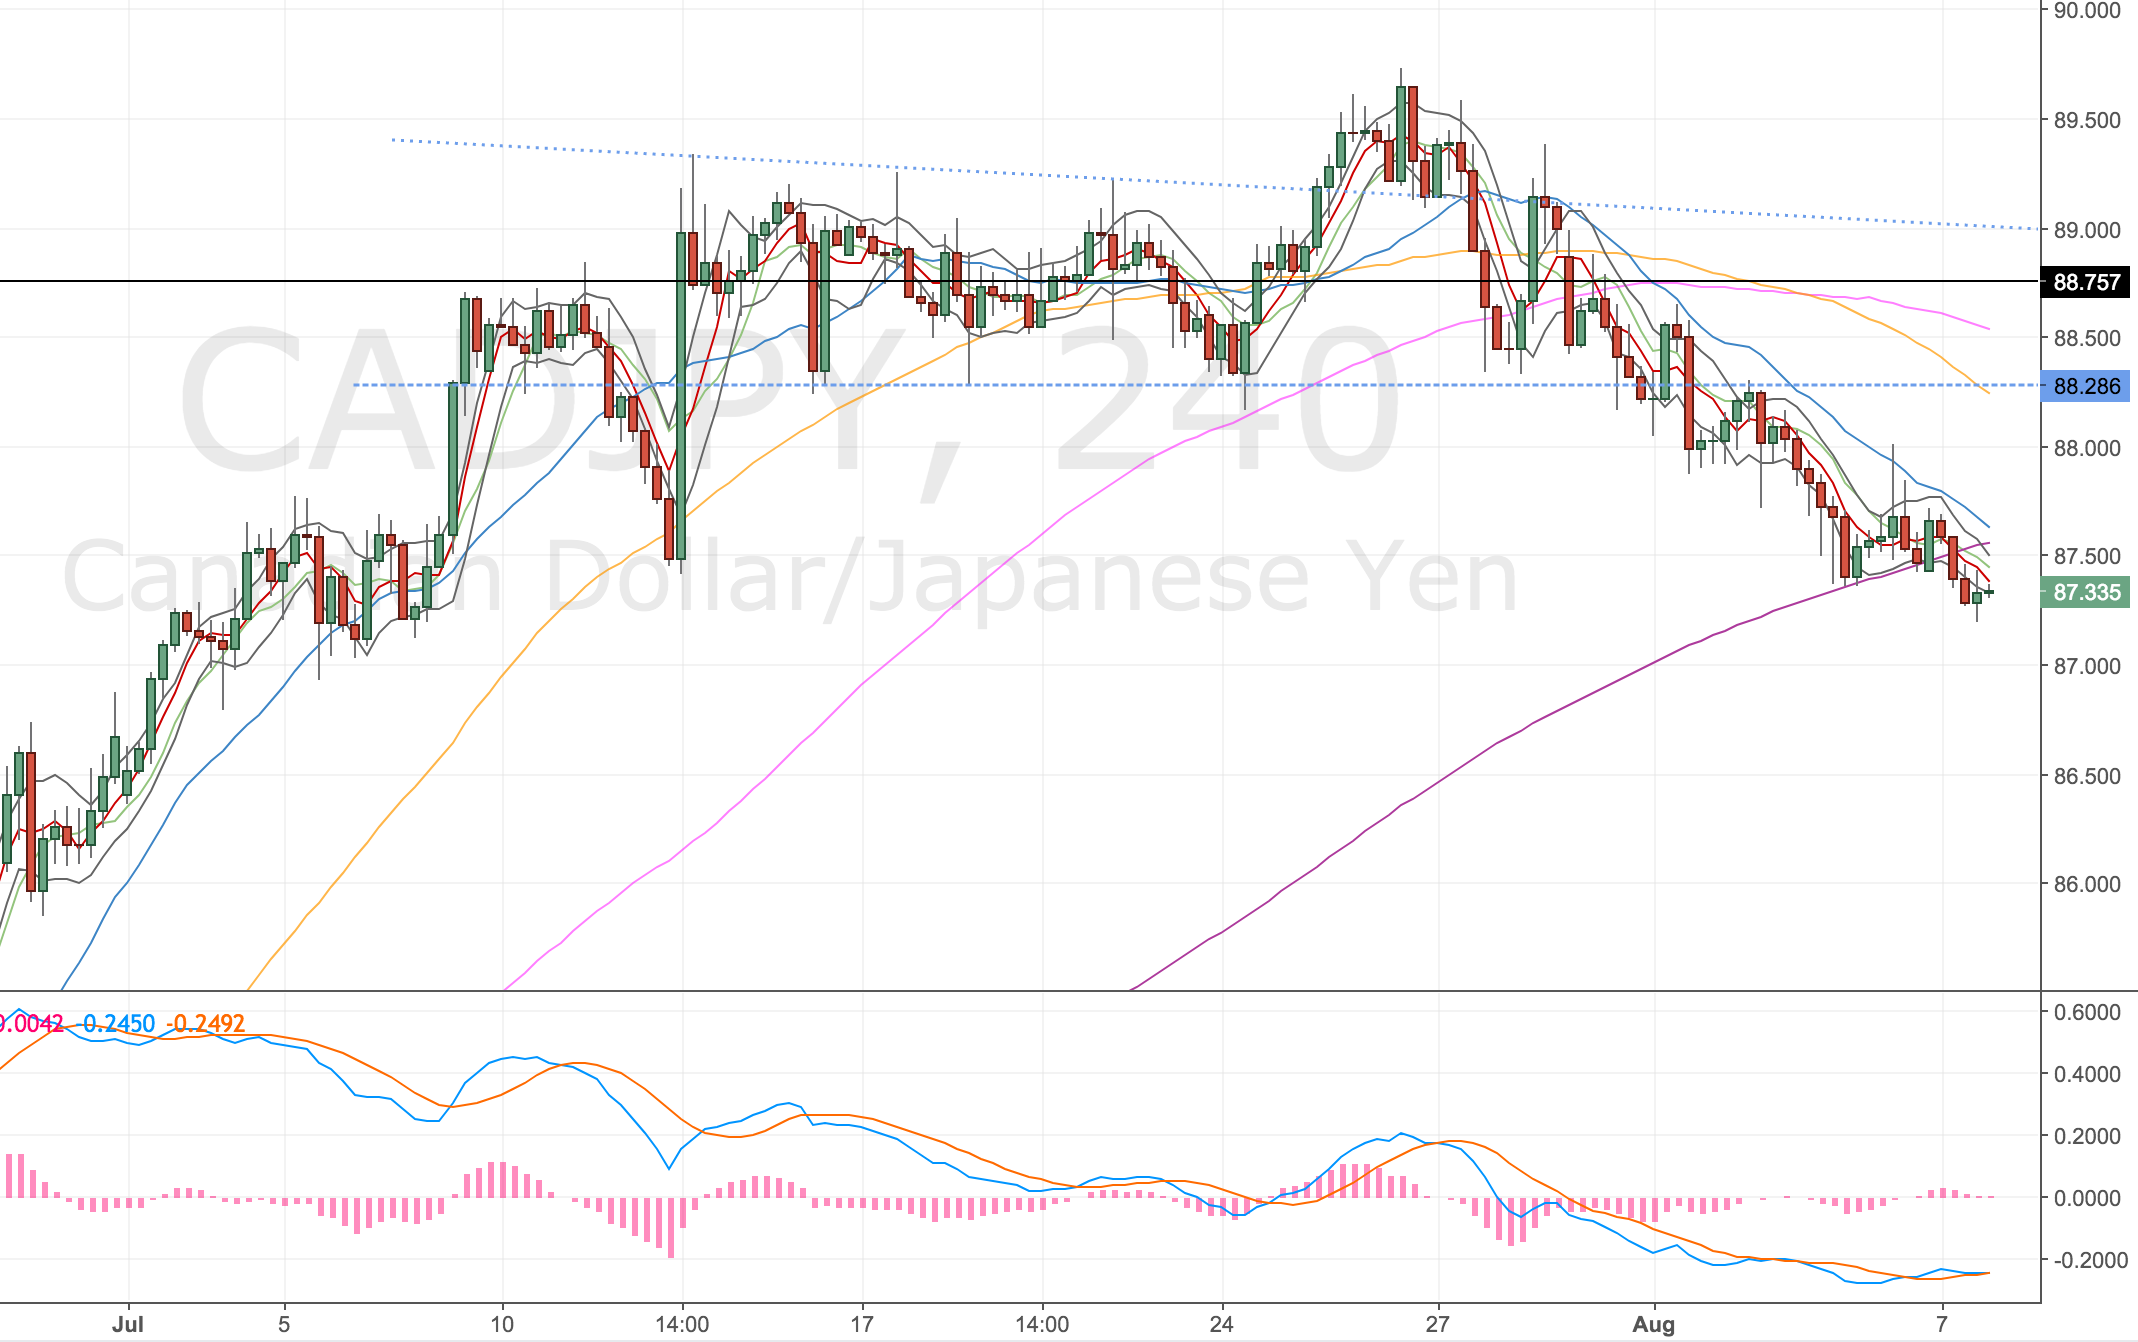
CADJPY 4h Chart – 7 Aug

You can see the price action outside the wedge that took me out and the subsequent run down to the 200. It looks like I was lucky to get my order hit on the 28 Jul for the short.

Checking in with the trade afterwards – 11 Aug

Just thought I’d update this as the trend has been strong and continued through the 200. I was hoping for a retrace to *consider* another entry. Would’ve been hard to get a set up but kept it in mind.

This chart goes to show that if you have a target in mind you should play to that target and not mess around with the exit level as you get close. Controlling your emotions really is 80% of trading.
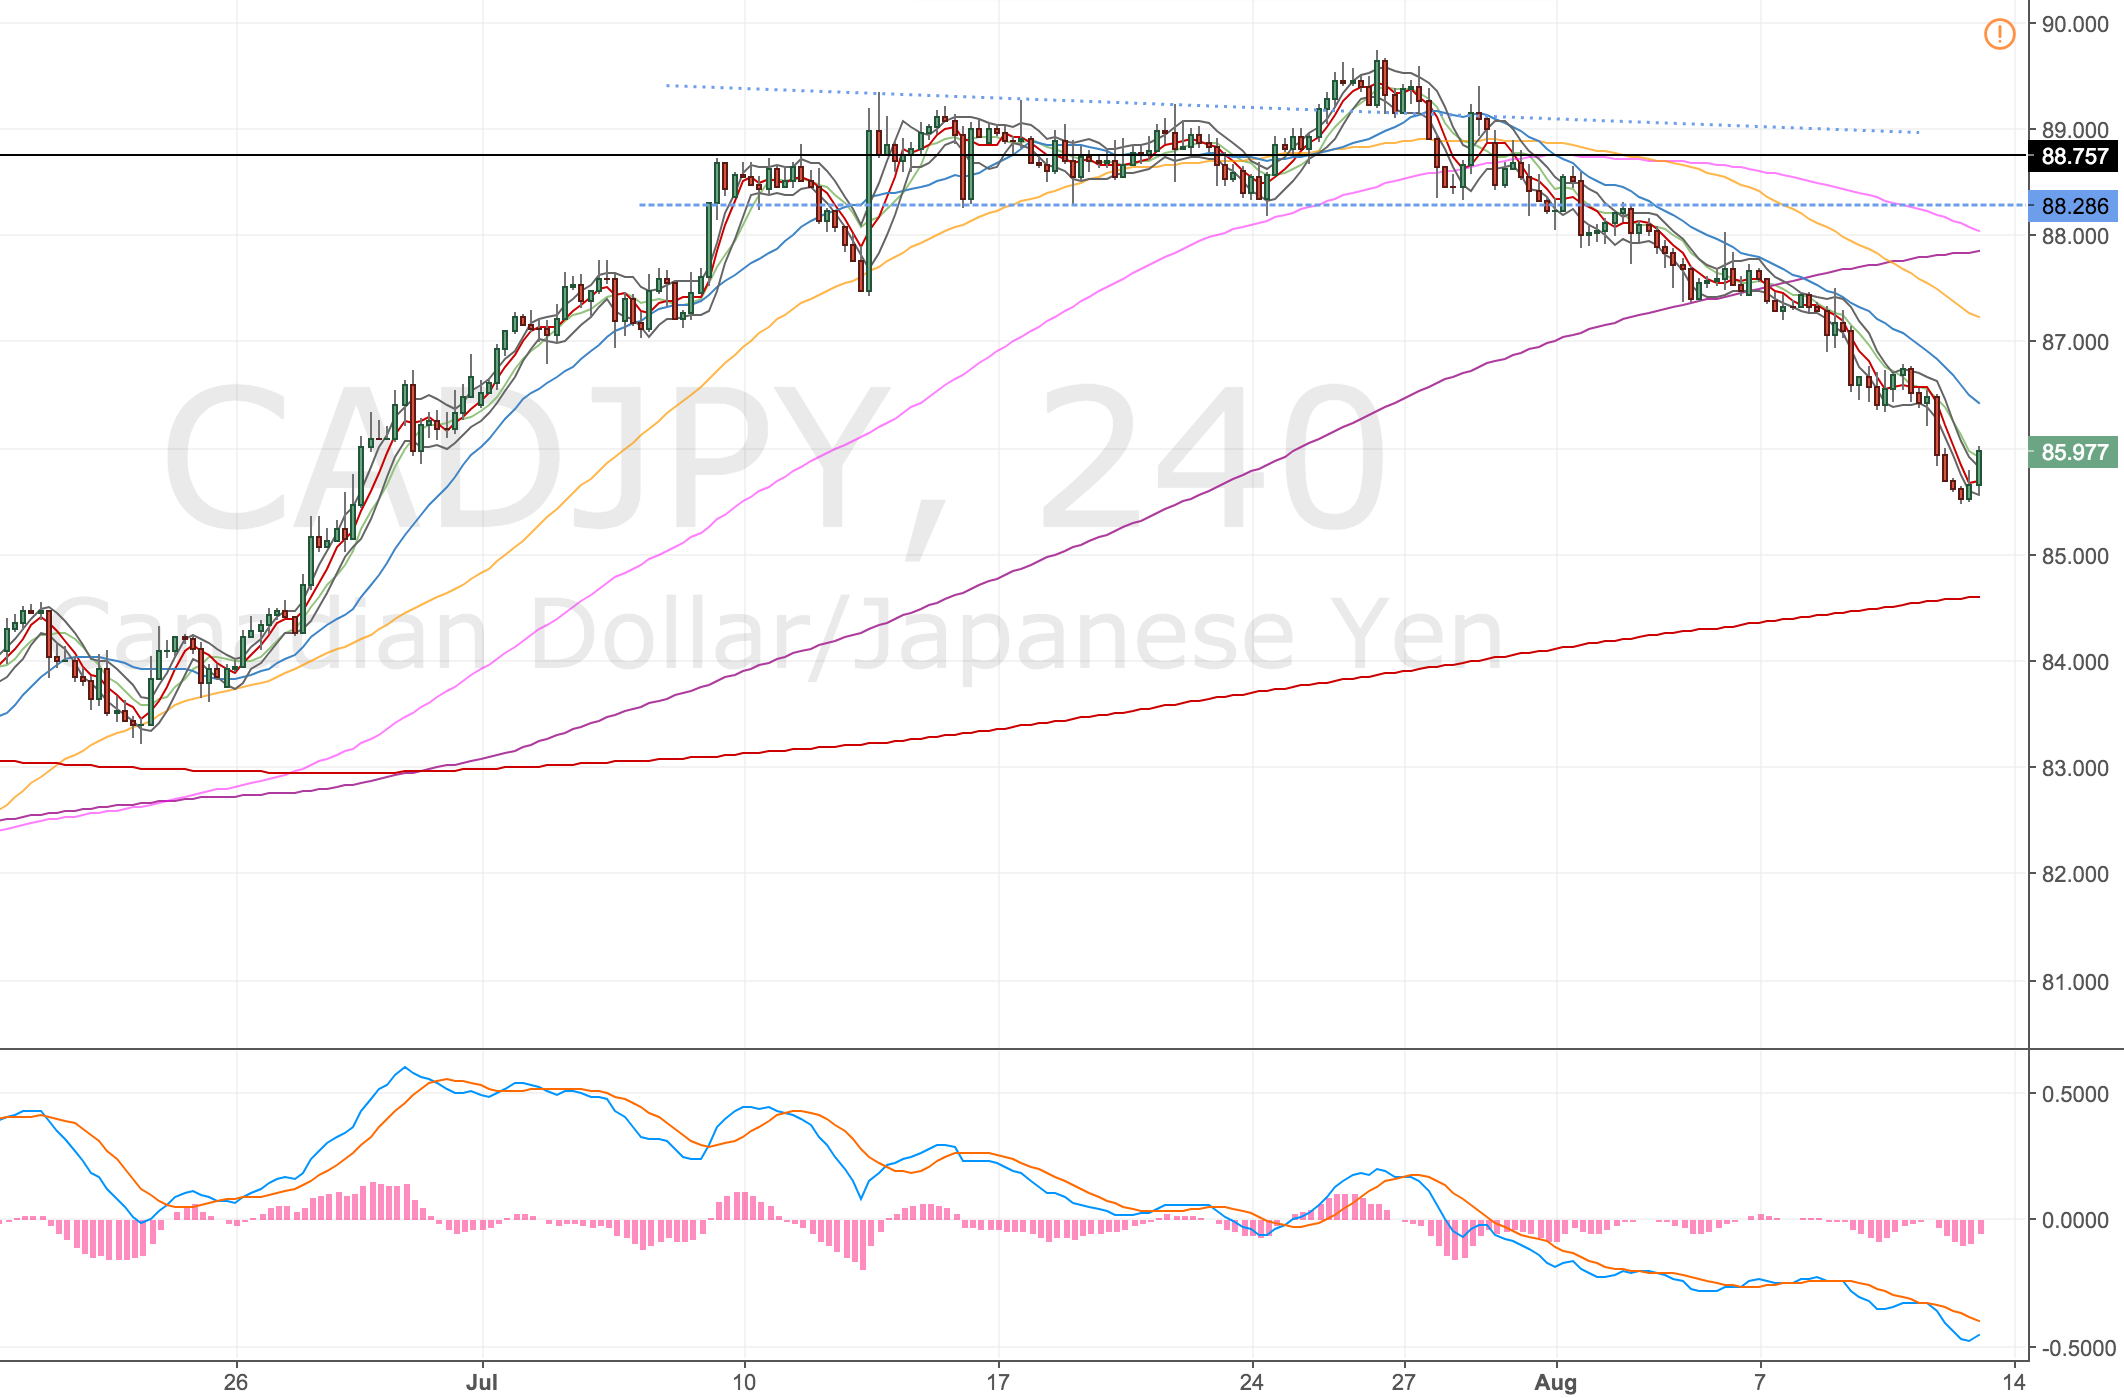
CADJPY 4H Chart – 11 Aug 17
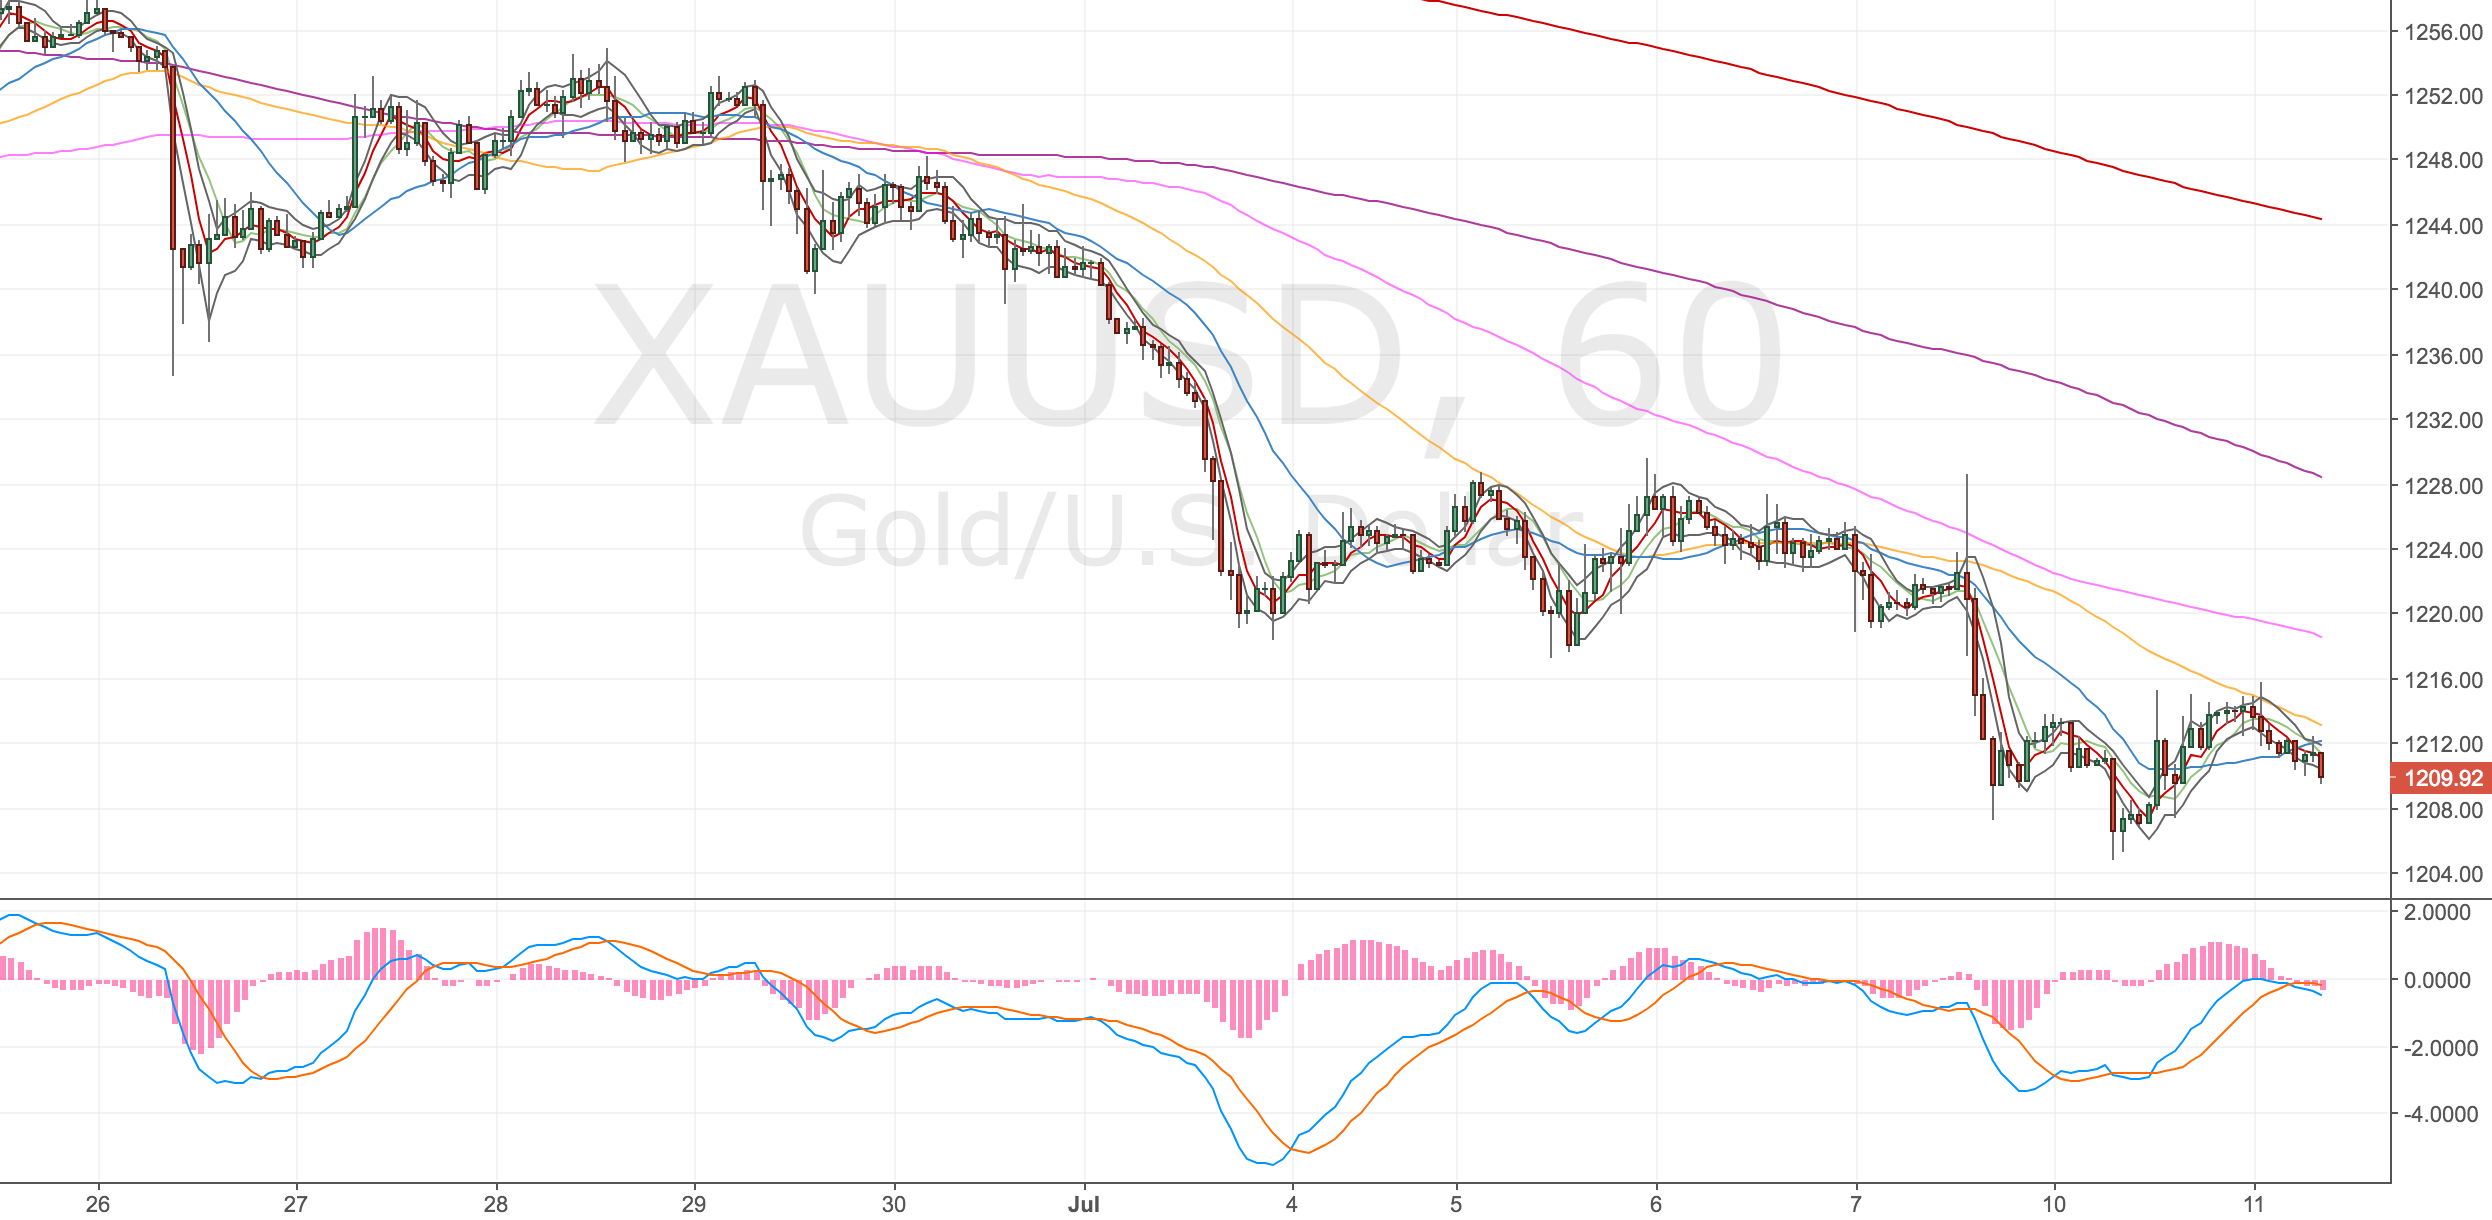
Gold DST long – 11 Jul 17
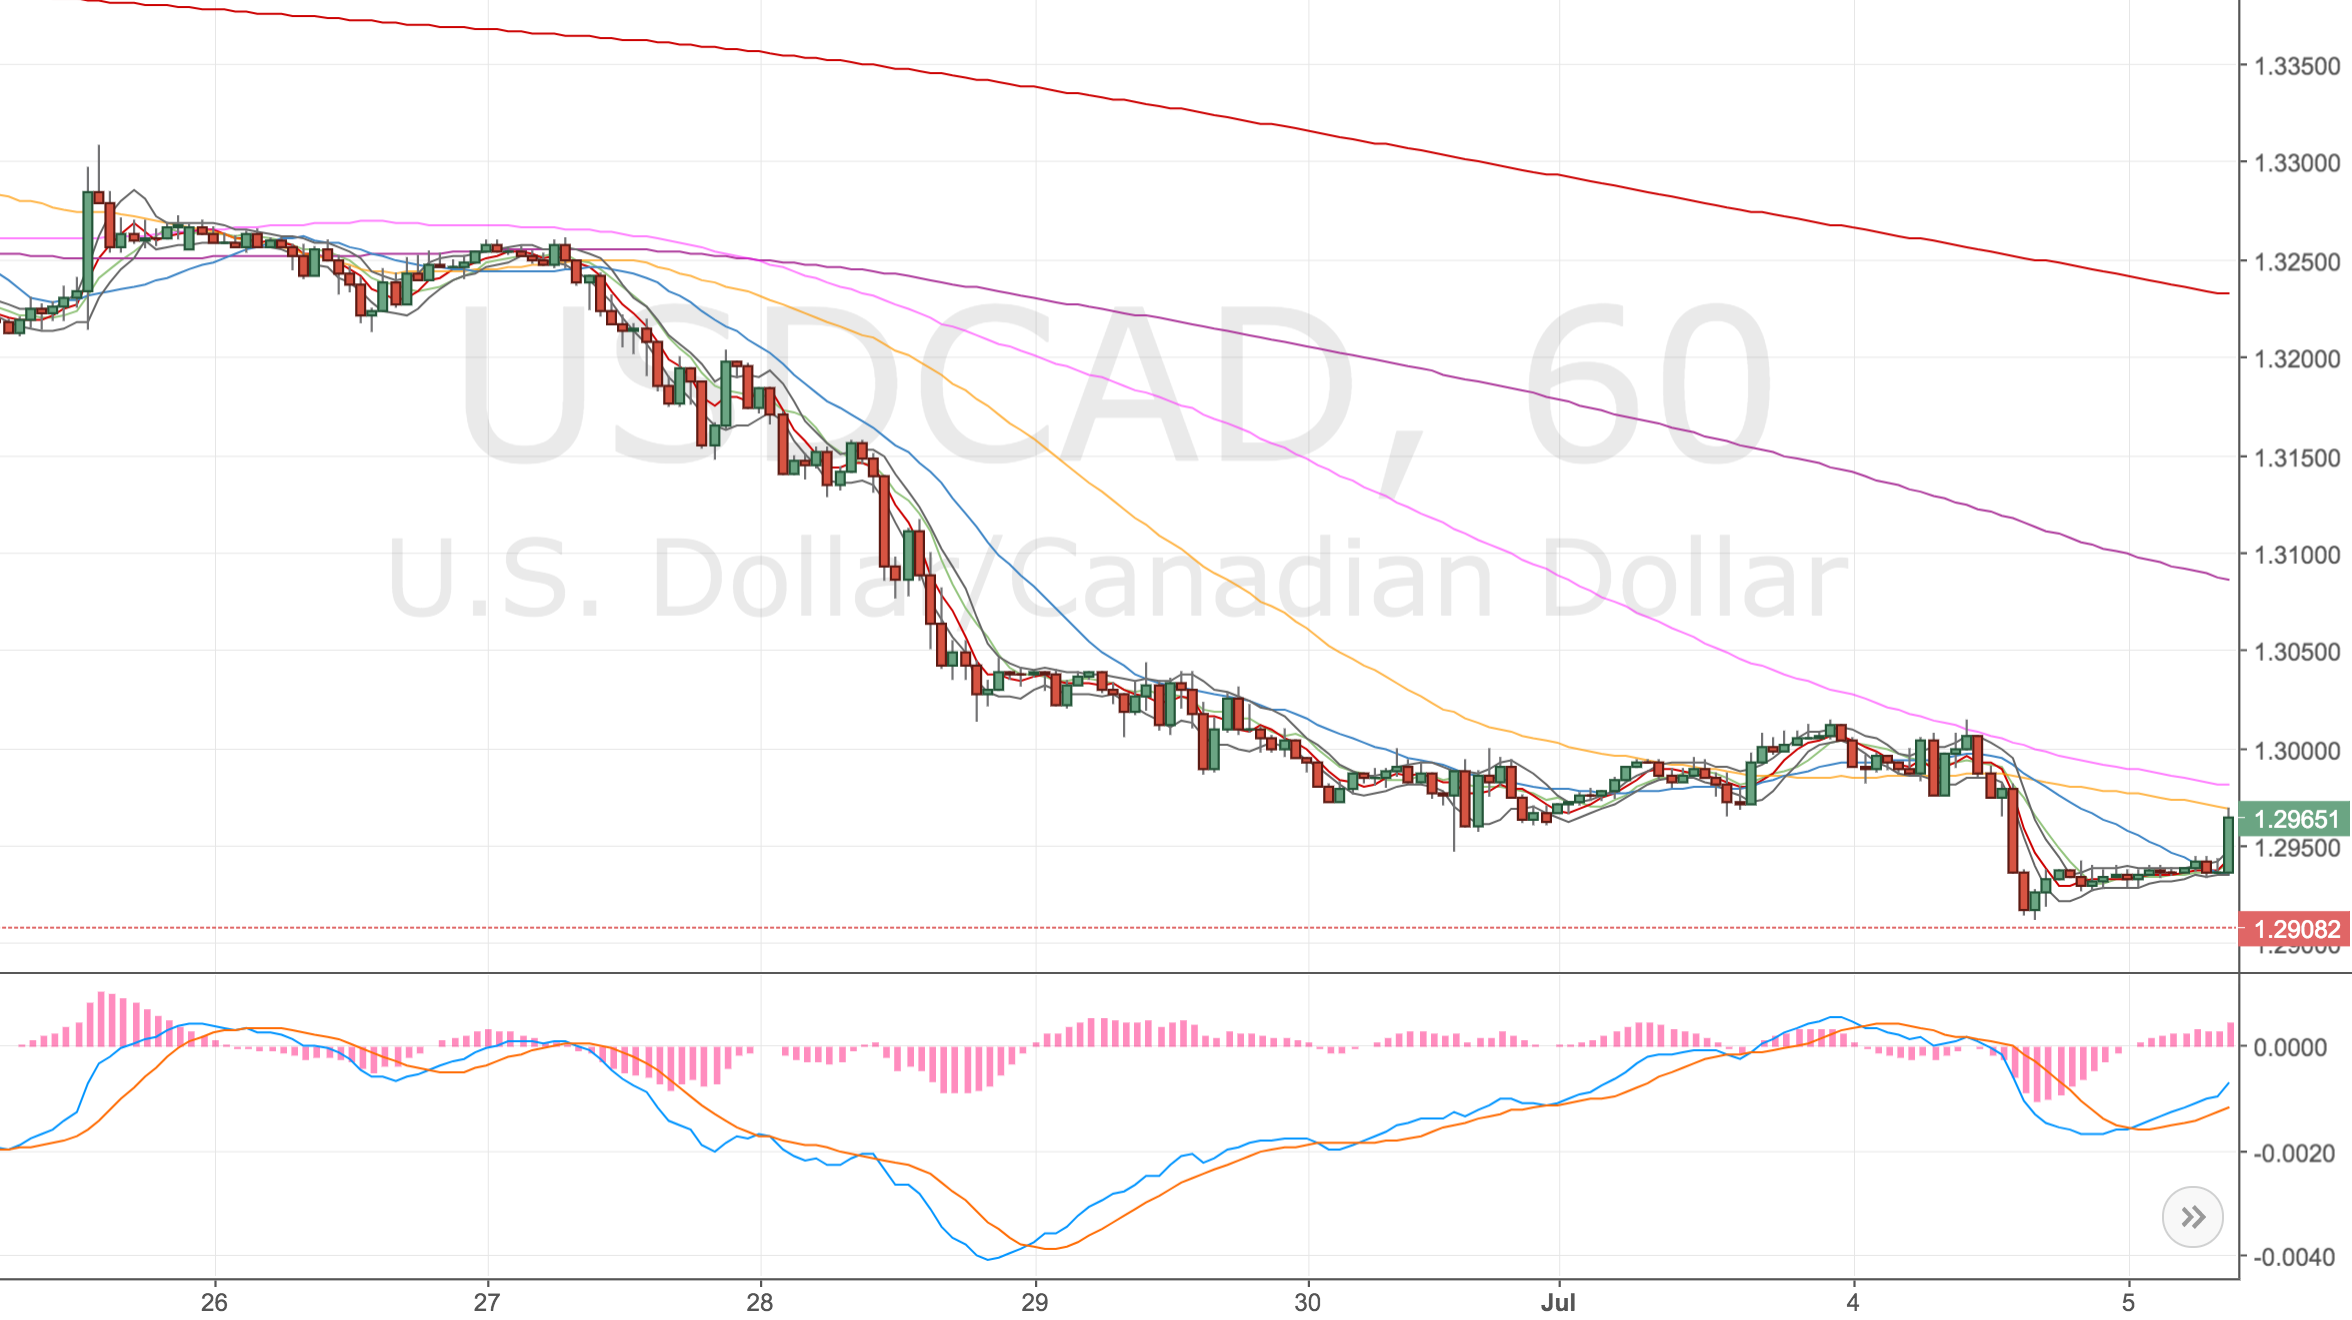

Acc Risk: 0.45%
Long: 1210.4
Stop: 1204.1 (63 pips)
Target: 1230.3 (199 pips, d500, 3.15x RR)
Mindset: Think we’re heading for an upper test of the monthly trendline

Update – Closed my trade manually again – 12 Jul
Update – Price hit original target – 16 Jul

Saw a Tip TV Gold analysis video by Alessio Rastani that matched a DST set up I was looking at, so I was feeling more confident.

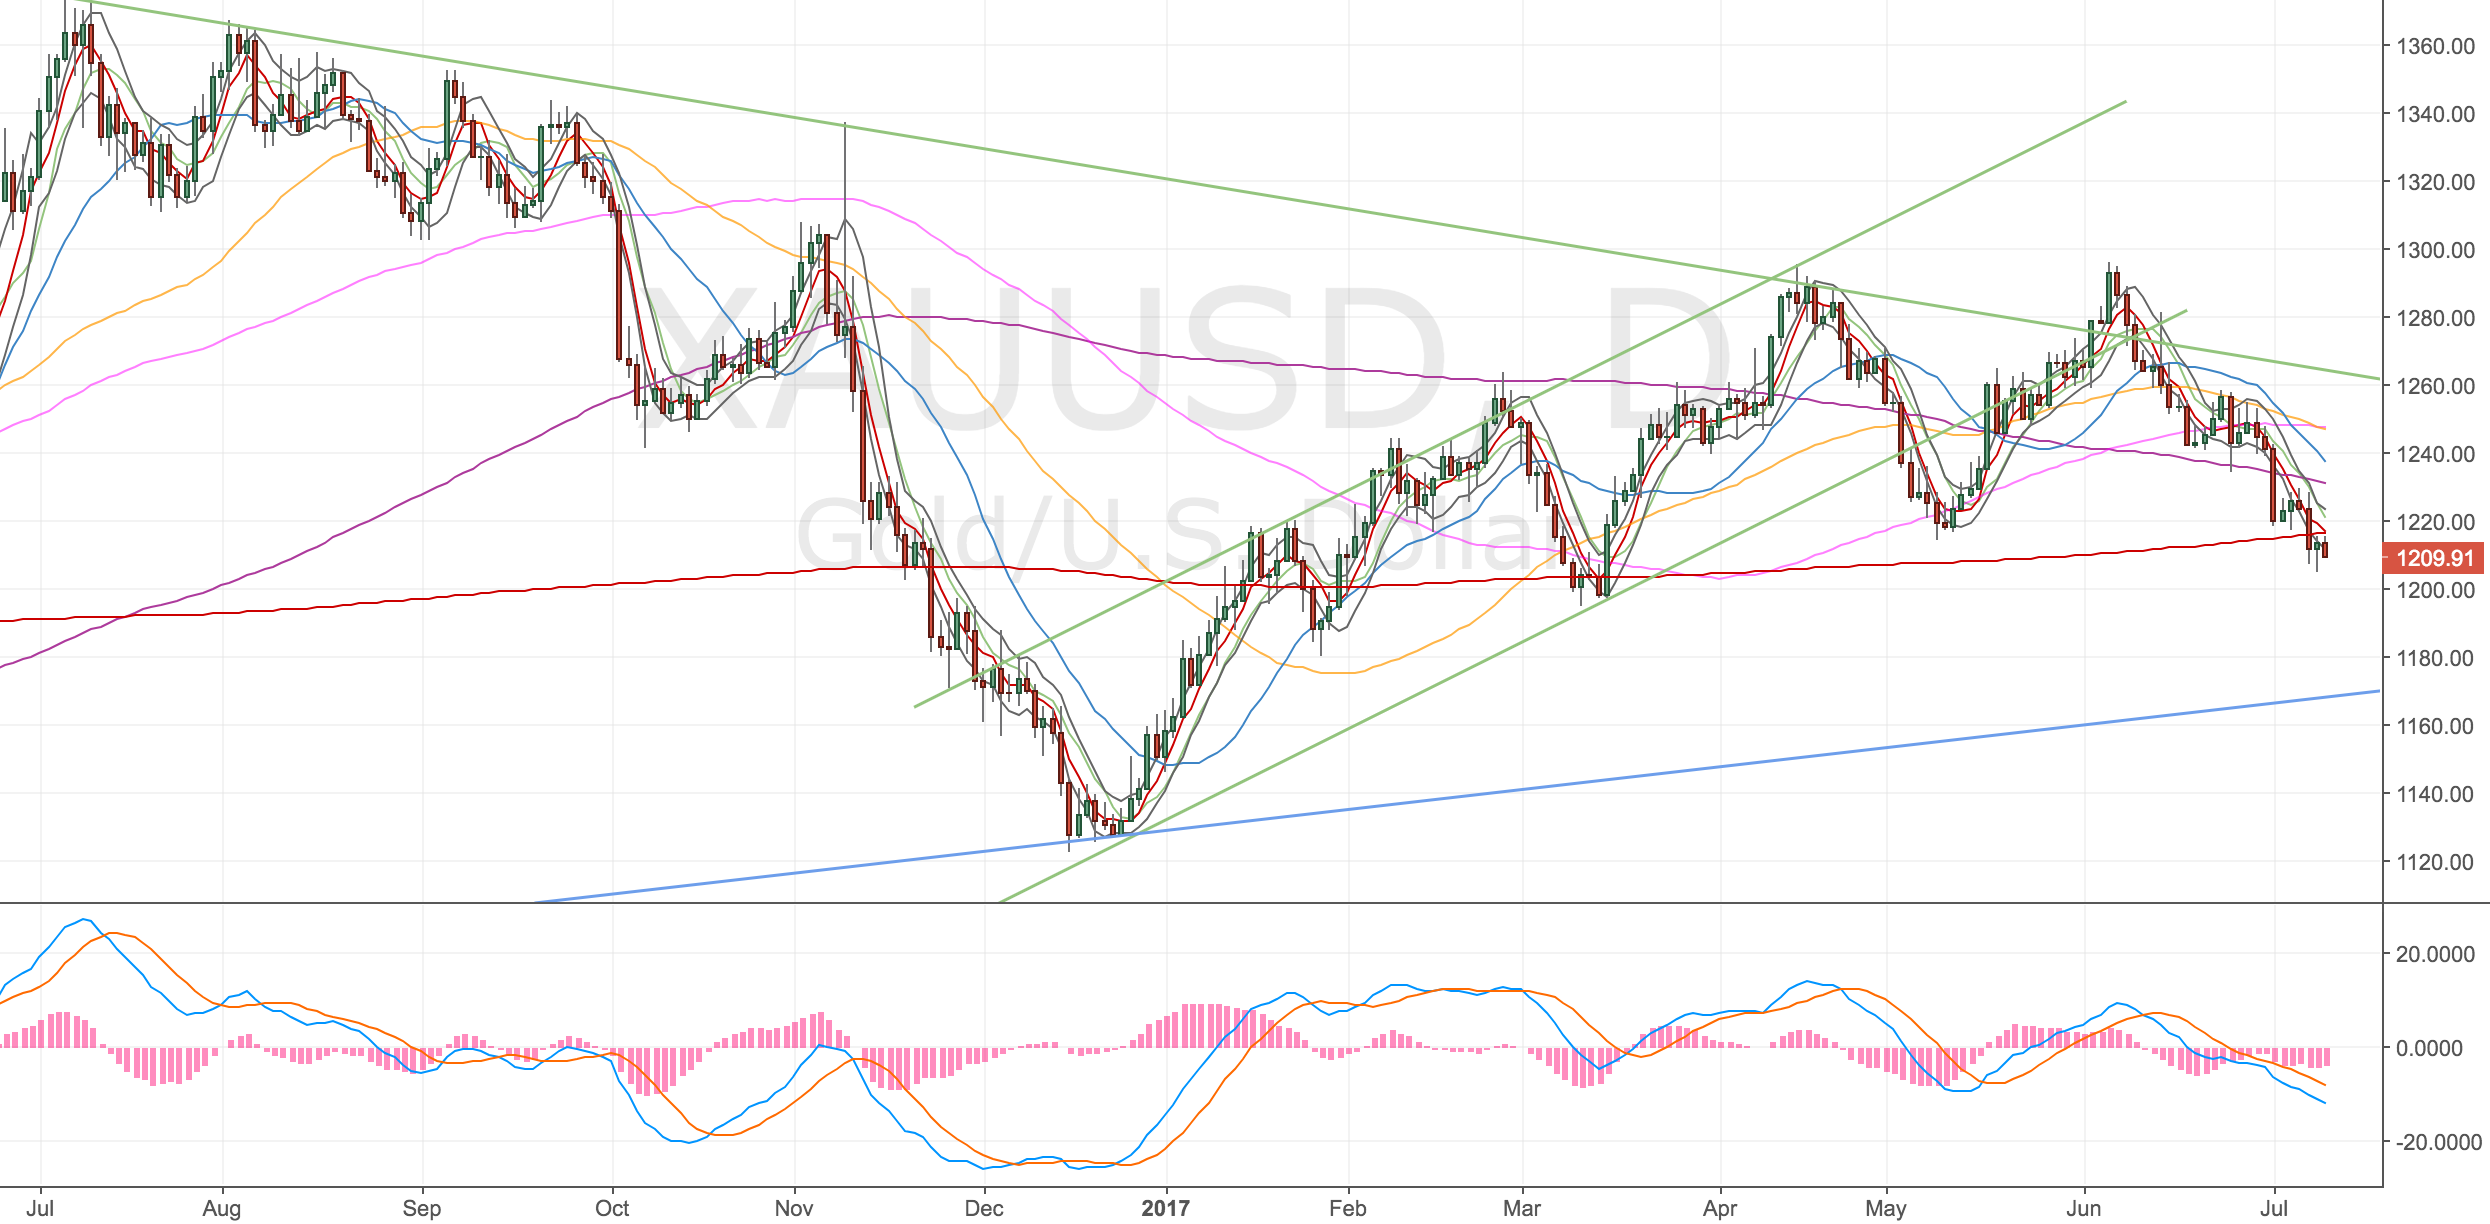
As for targets the analysis on the daily chart makes me think we can hit 1230. I often see price action ping pong between the two nearby major MAs. so I’m looking for a d200 test.

4H Chart – setup

Pretty textbook entry down to the lower trendline.

Gold 4H Chart – 11 Jul

1H Chart – confirmation

Gold 1H Chart – 11 Jul

Daily Chart

Looking for a d200 test after bouncing around the d500.

Gold Daily Chart – 11 Jul

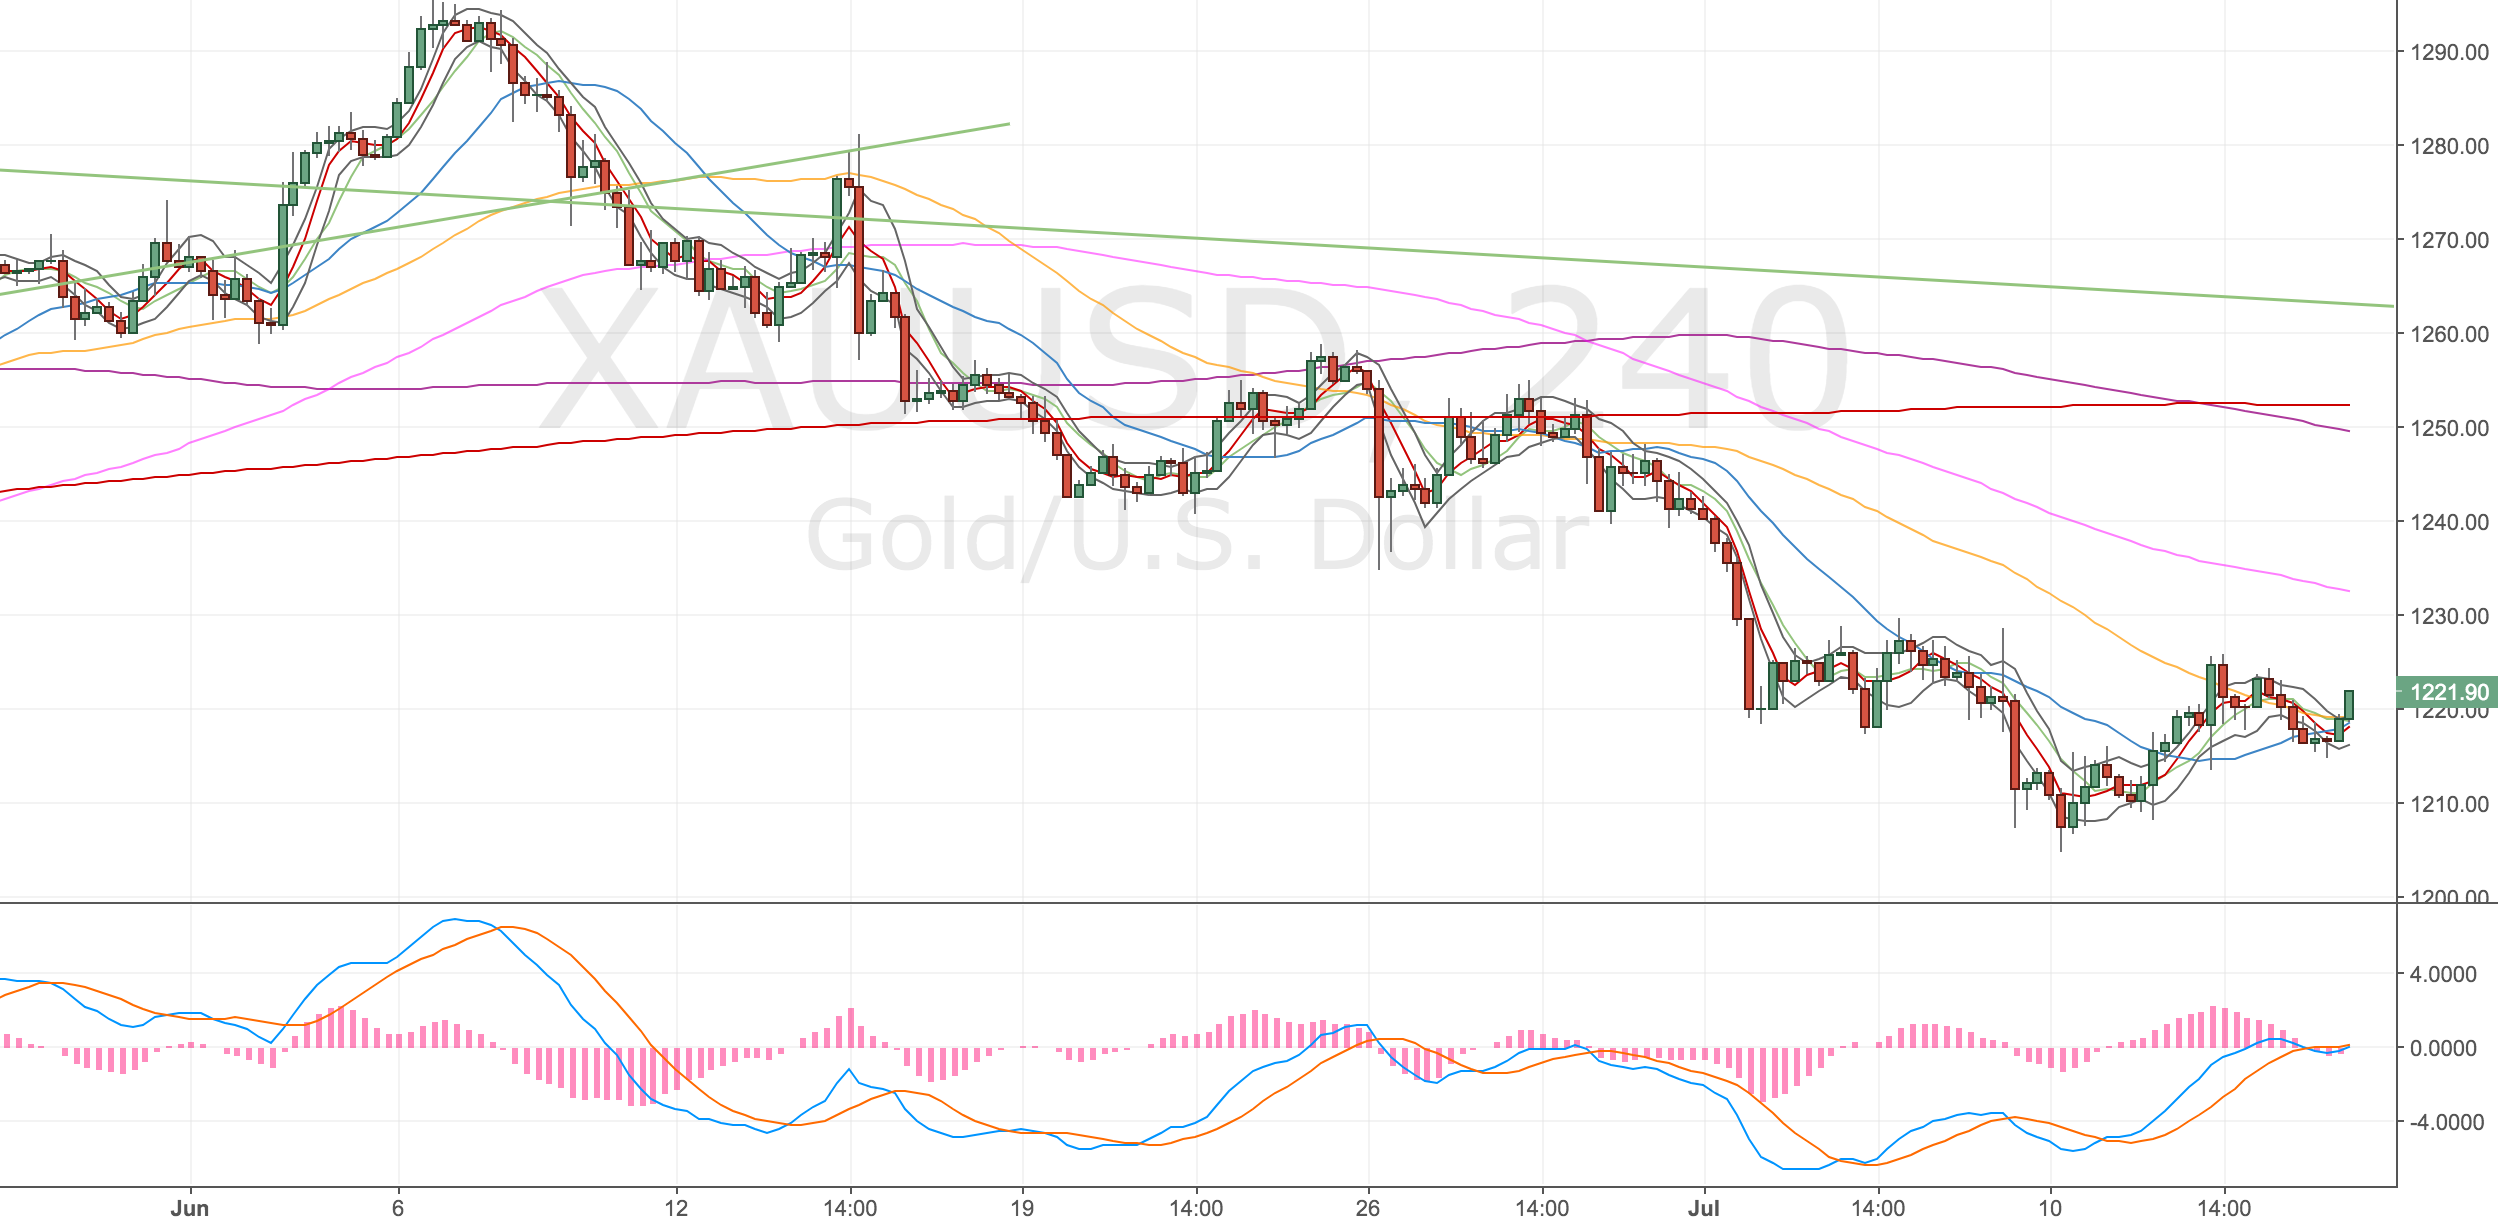
Closed the trade manually again – 12 Jul

Just closed my trade manually @ 1221 (110 pips, 4h50, 1.74x RR).

I realised I wasn’t trading my system properly, I was trading my opinion bolstered by watching a youtube video! If I don’t trade my system properly I can’t be sure if my profitability or lack of it is justified.

Until I build some serious experience, I shouldn’t be trading my opinion. So I closed the trade at the 4h50 because I have a single divergence.

I still think price could head higher but that’s for someone else to worry about.

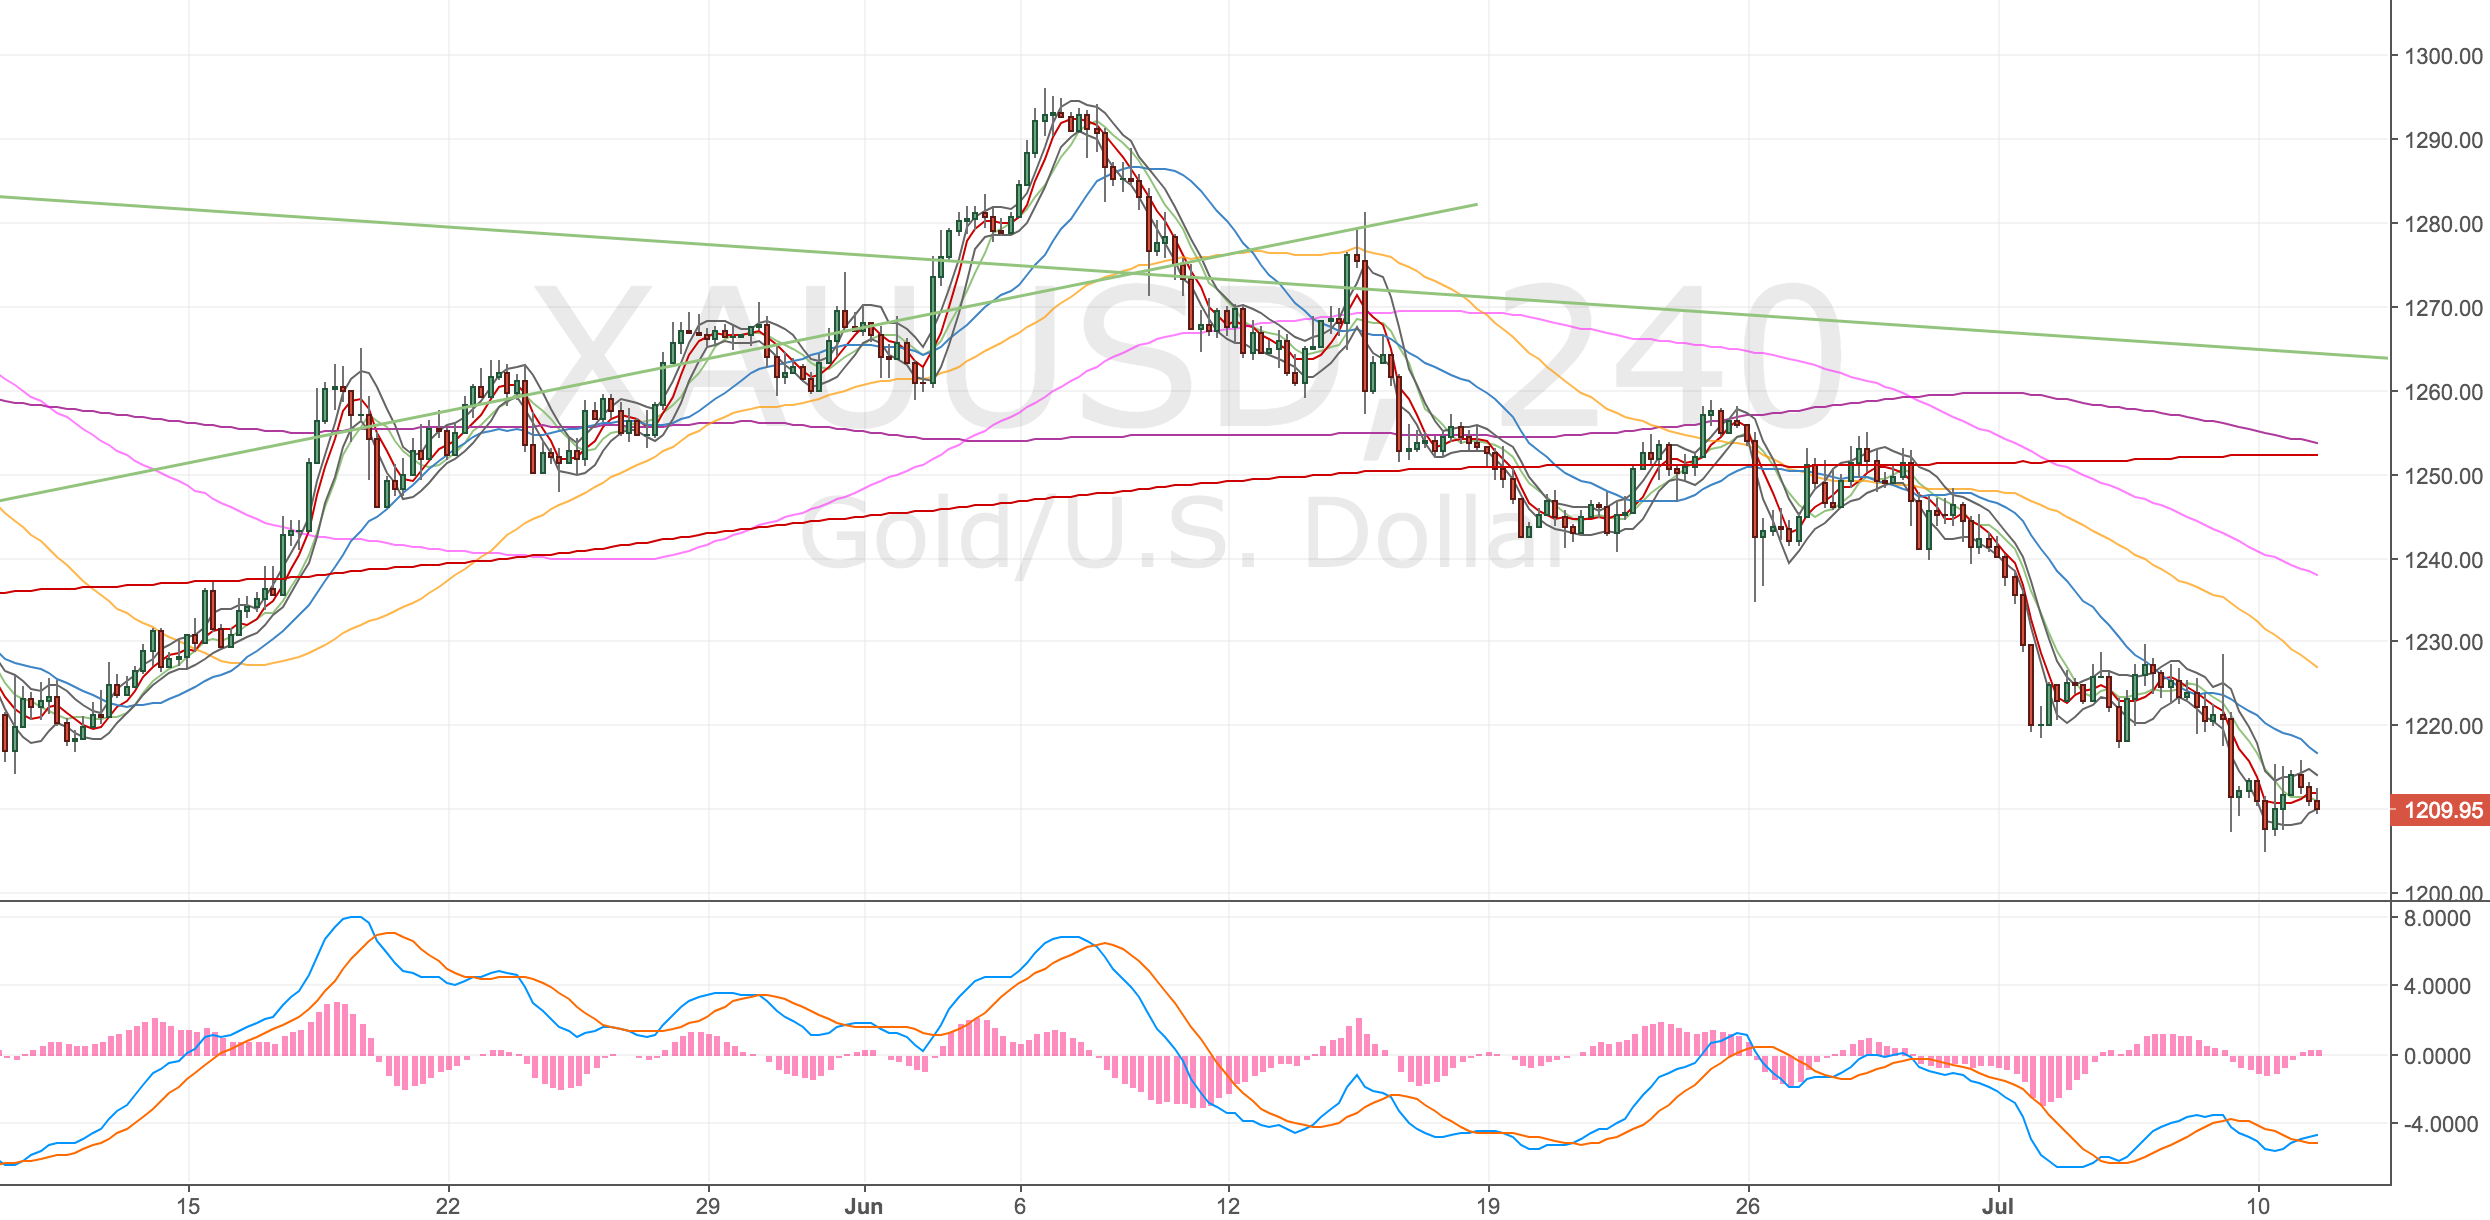
Gold 4H Chart – 14 Jul

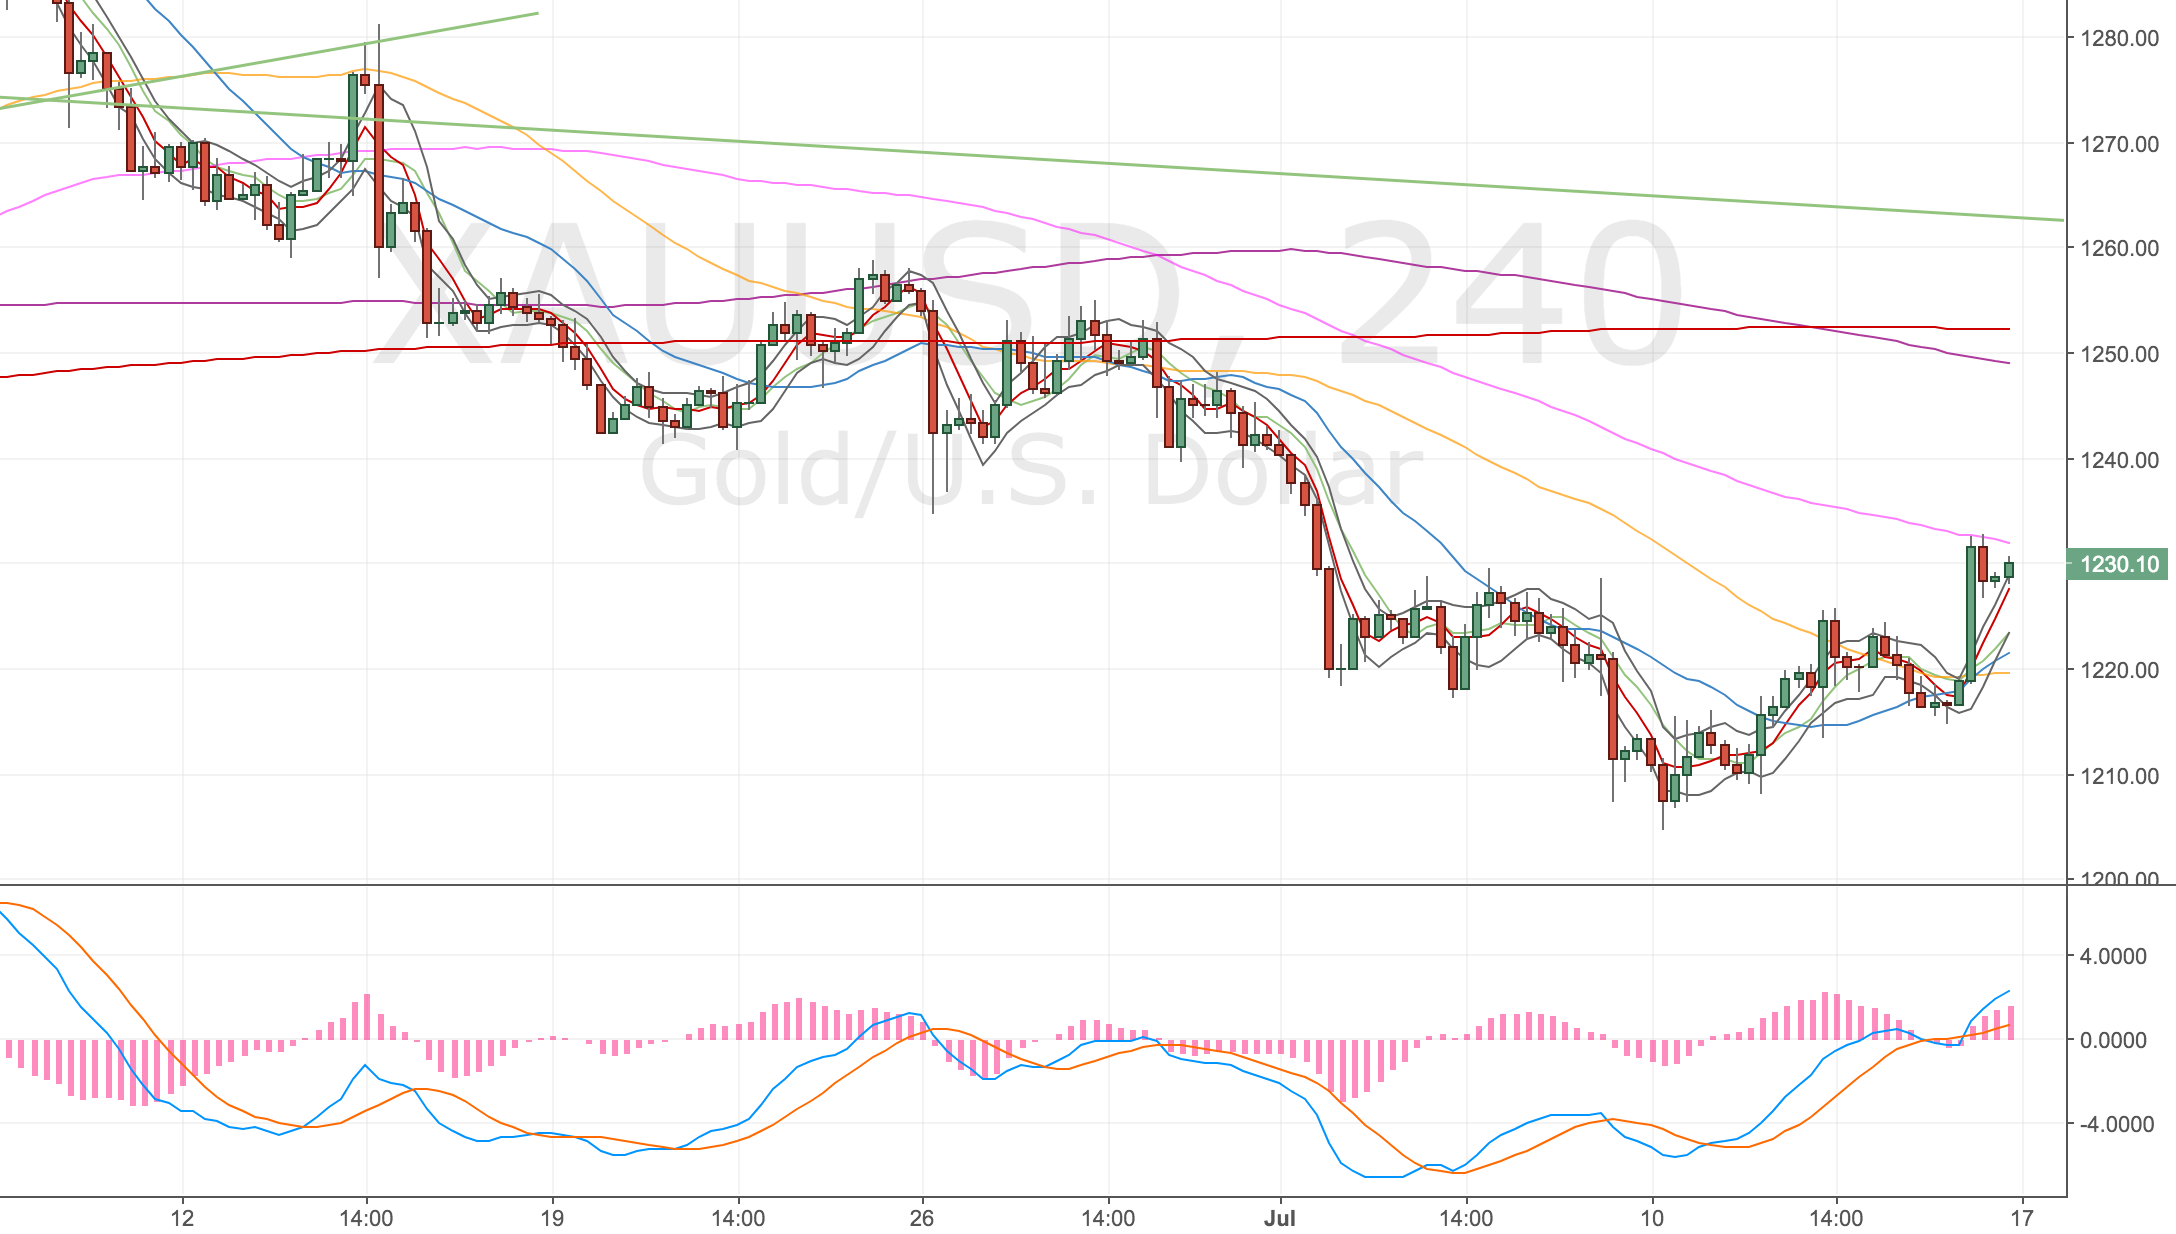
Update – Price hit original target – 16 Jul

Not sure if this matters, part of me was thinking I should’ve kept to the original plan, but I’m glad I kept disciplined. Just have the doubt about whether I could’ve actually held on to this trade. I was very keen to close it.

Gold 4H Chart – 16 Jul

Monthly Review – July 2017

Starting balance: £6,875.86
Target return: £240.65 (3.5%)
Actual return: £91.65 ( 1.33% )
Win rate: 50%
Closing balance: £6,967.51

I feel this month went better than it might look above. The win rate was solid enough but unfortunately, even though I made pips, the position sizing on my winning trades couldn’t be as large as I’d like. Spikes high often meant I had to downsize my positions.

The strategy took a beating this month with lots of losers (although it still made pips!) but I managed to dodge most of the losing trades. I also had a week’s holiday at the end of the month which surprise surprise was when a few winners started to set up.

The biggest limitation again is my routine. This is an excuse; but with the house renovations going on and builders needing things done or sourced, we’re working on the house until 1am most nights, on top of work I’m totally wrecked. If I recline my chair too much, I’m asleep 🙂

I can’t really see this situation changing until October time, so hopefully only another month or two and we’ll be in a more predictable place.

This is what my goals were for this month.

July’s Goals

Here are the goals I set myself at the start of the month.

  • 40% win rate – Success
  • Achieve a 3.5% profit month

Daily performance

The strategy took a beating this month, mainly due to trending markets. I was lucky to dodge these set ups.

All SignalsWin Loss %Signals TakenWin Loss %
Winners00%00%
Losers9100%00%
Still live00%00%
Total Signals9-0-
Total Pips -761-0-

4H performance

Not a great set of figures for the strategy or me, but I did out-perform the win rate!

All signalsWin Loss %Signals with ConfirmationWin Loss %Signals TakenWin Loss %
Winners1631.3%1435.8%450%
Losers3262.7%2359%450%
Still live35.8%25.2%00%
Not triggered 00%00%00%
Total Signals 51-39-8-
Total Pips 530-689-205-

July trade log

#DateStgyMktPosAcc RskOpenStopStp PipsTgtTgt PipsR:RCloseFnl PipsFnl R:RDaysP&L (£)
6030 Jun 17DSTUSDCADLong0.45%1.29741.2941341.318120661.2941-34-15-25.92
6130 Jun 17DSTNZDUSDShort0.45%0.73170.7354360.71591584.30.7275421.16636.54
6205 Jul 17DSTUSDCADLong0.45%1.29491.2907421.31562074.921.2904-45-12-35.91
6310 Jul 17DSTAUDCADLong0.45%0.97900.9767230.99681787.730.9868783.4269.79
6411 Jul 17DSTGoldLong0.45%1210.41204.1631230.31993.1512211061.68252.17
6513 Jul 17DSTCADJPYShort0.5%88.7789.396284.604186.7489.39-62-113-41.00
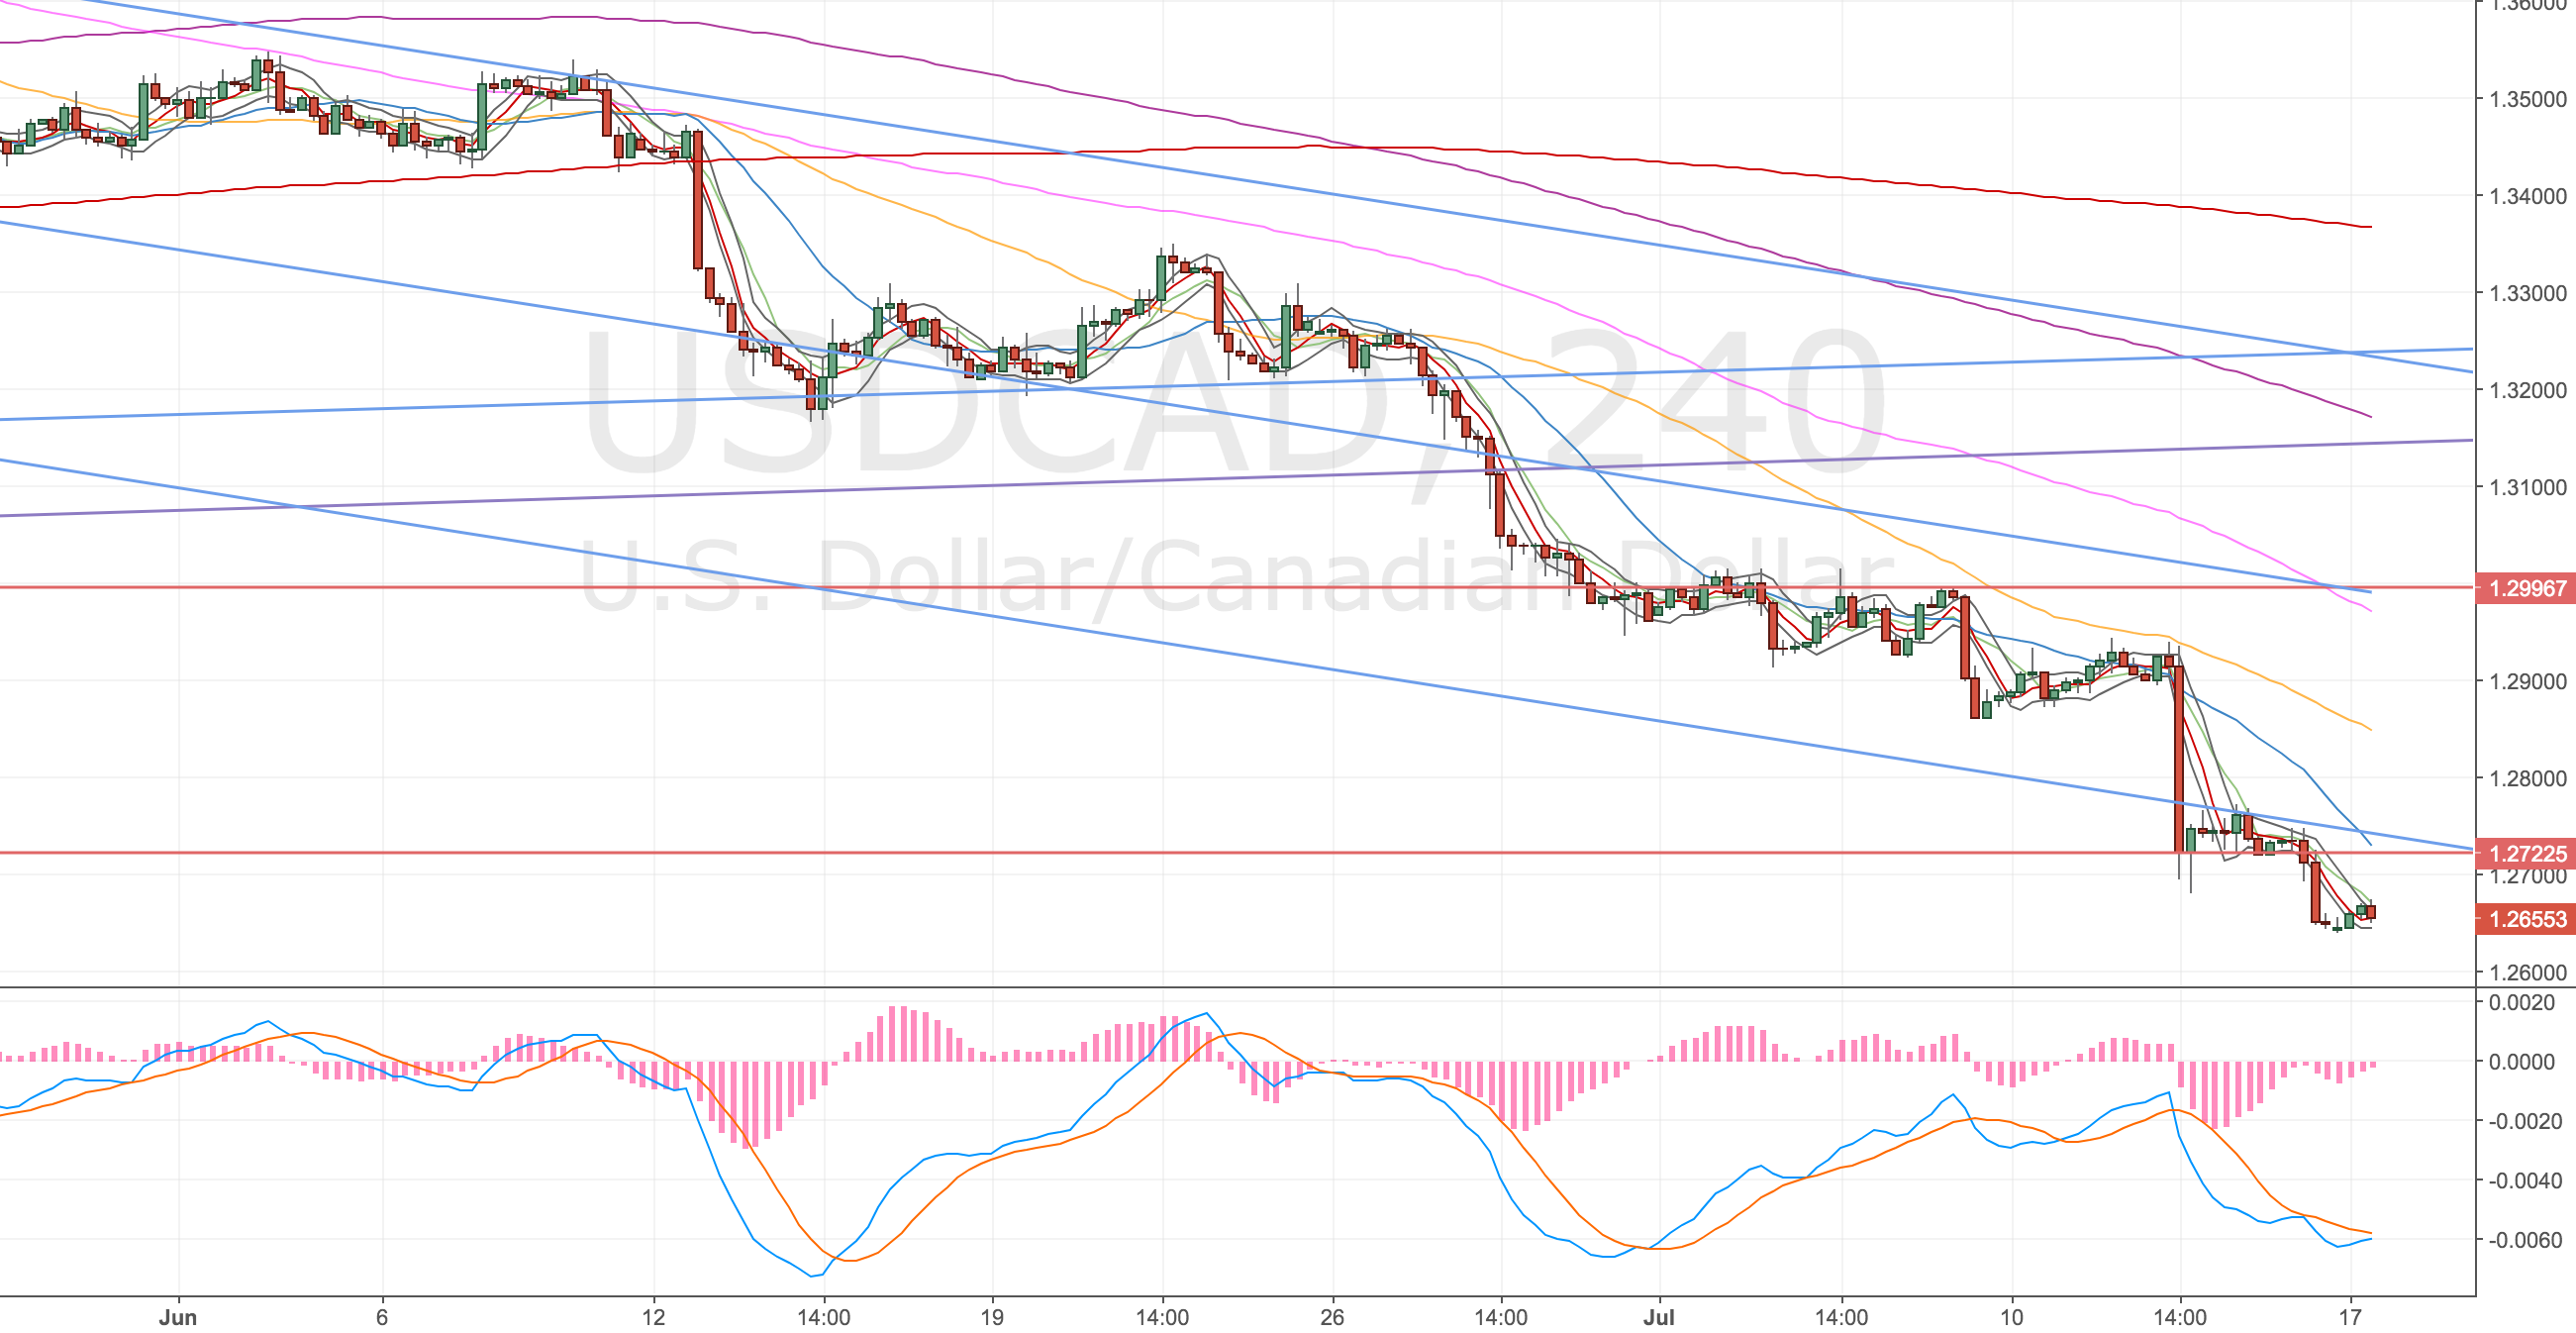
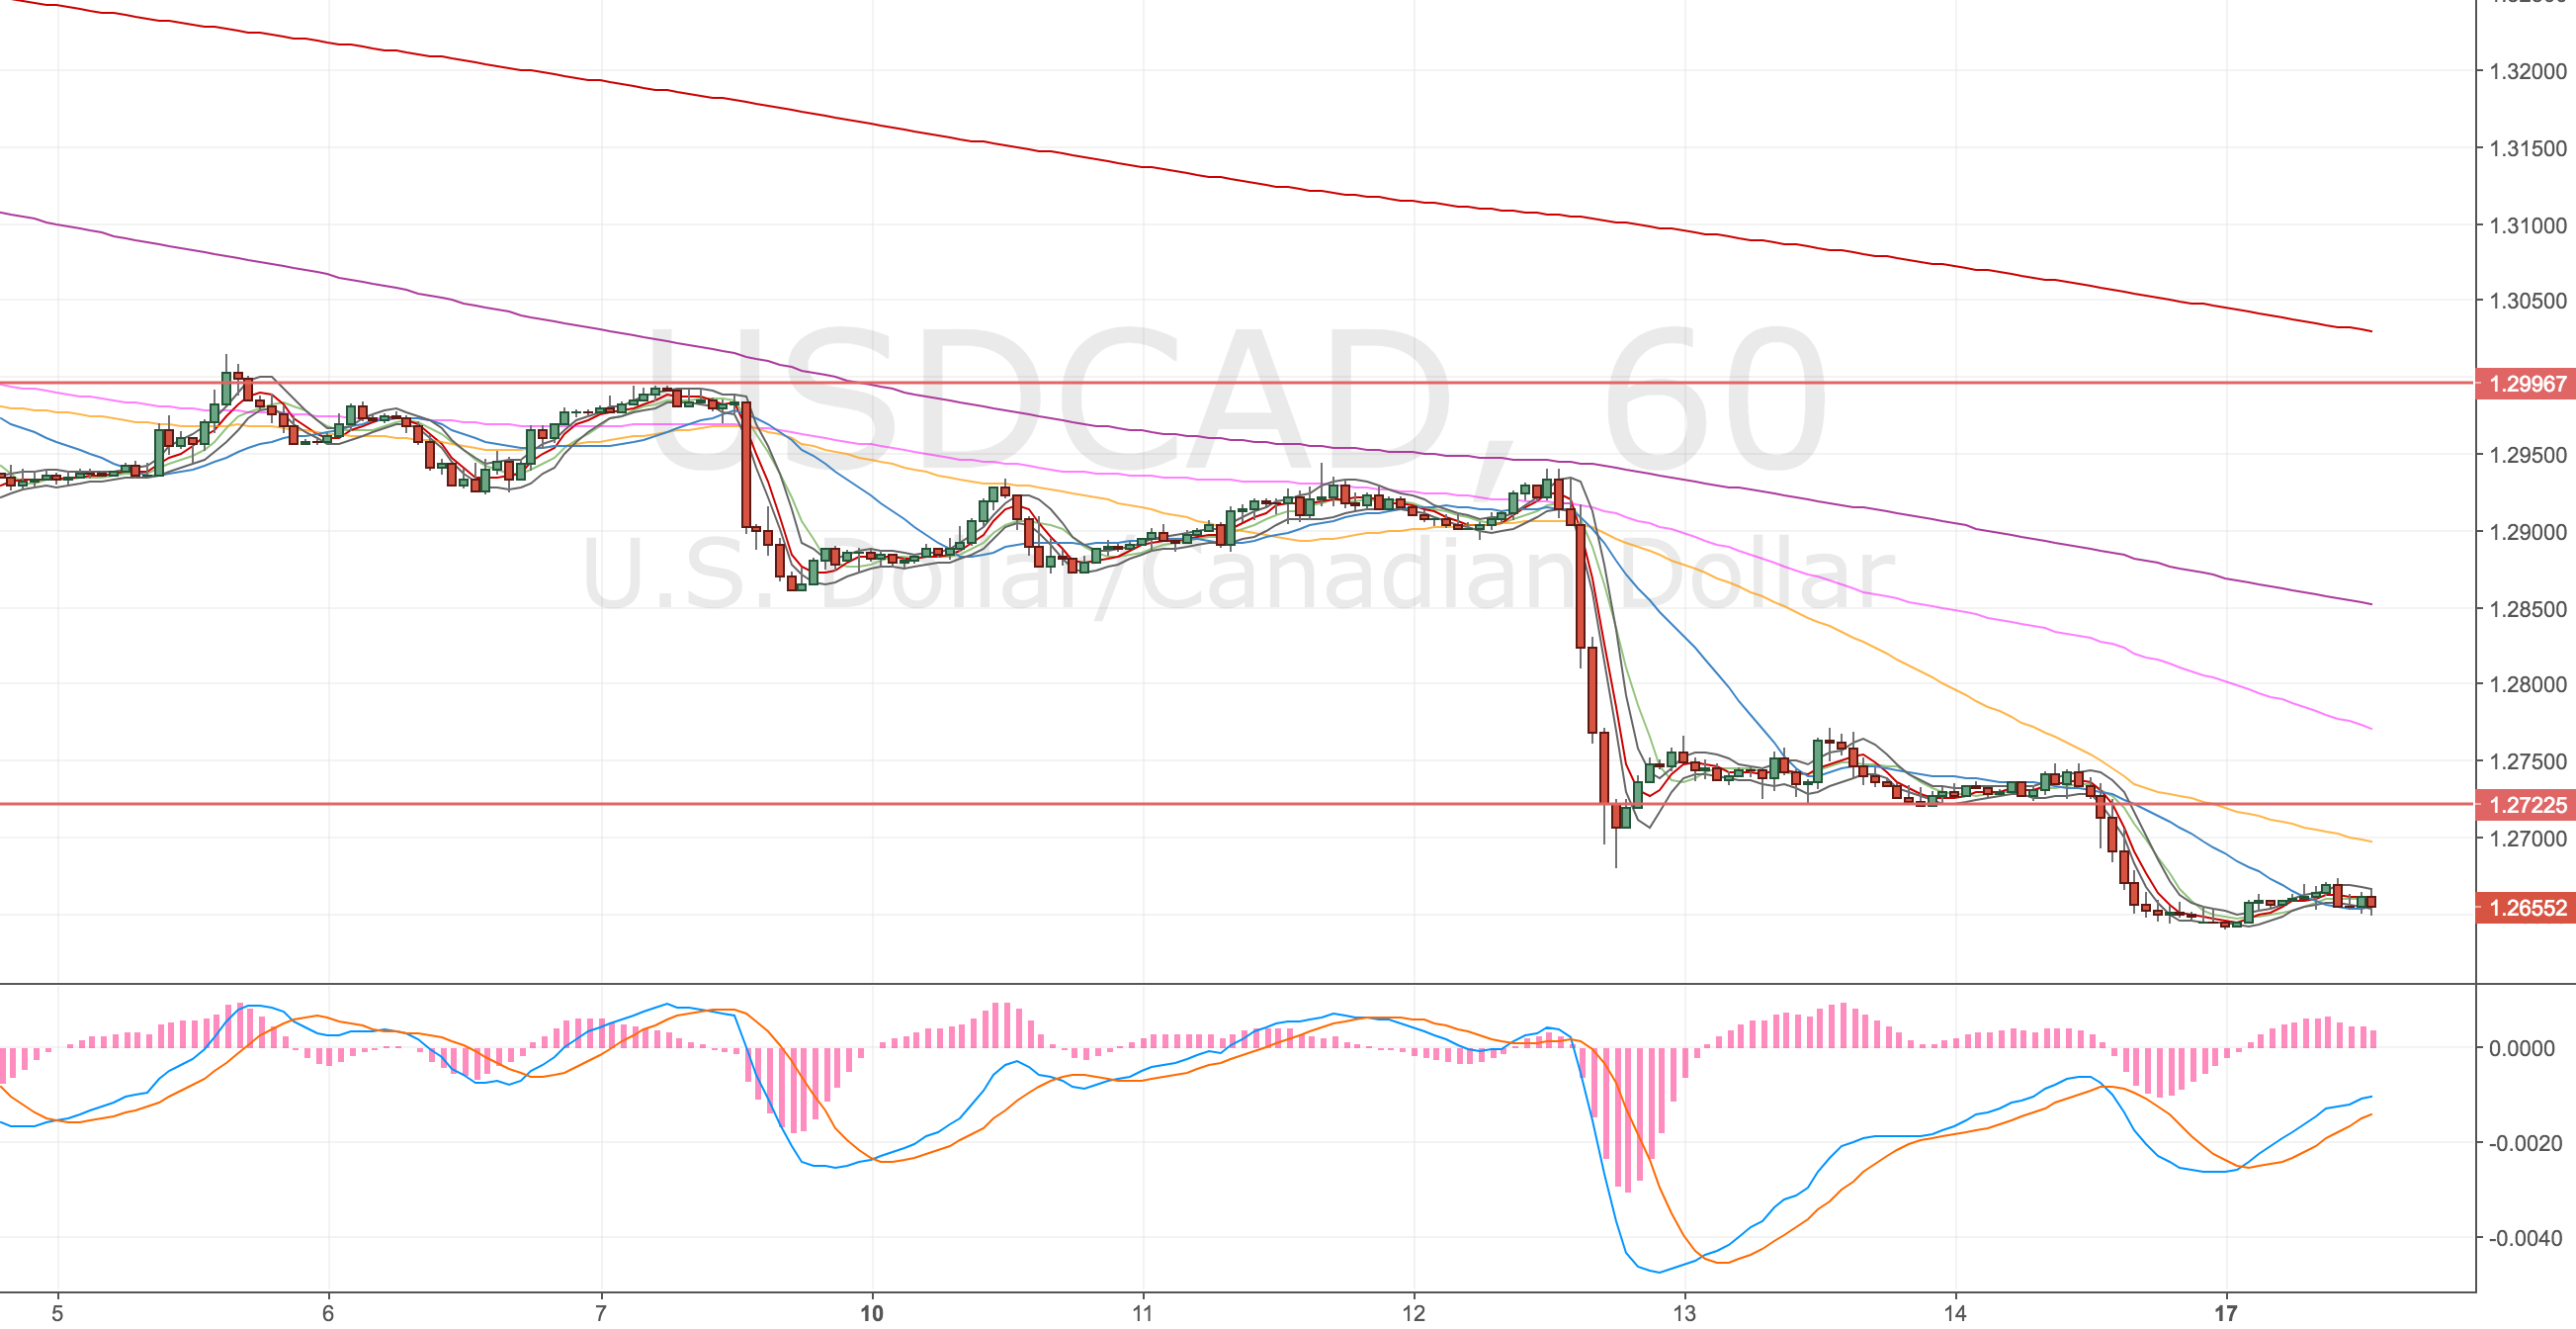
6617 Jul 17DSTUSDCADLong0.5%1.26551.2635221.28301757.951.2635-22-11-33.15
6728 Jul 17DSTCADJPYShort0.6%88.9589.778286.762012.587.531421.73769.13

Goals next month

After talking with Charlie we agreed that aiming for an amount of money is the wrong goal to aim for. (Forcing your will on to the market.) Best to focus on process and let the stats decide, however upping my position size will help me get closer to my target sooner.

  • Maintain a 40% win rate
  • Achieve a 3.5% profit month
  • Log all my missed trades with reasons why I didn’t take them
  • Up my position size to 0.75%

Daily goal

Do at least one scan a day.

Other things to cover with Charlie

  • Missed trade log
  • Killer trends in USDCAD & CADJPY
  • GBPUSD trades – getting stopped out
  • UK100GBP set up near misses – take anyway?

AUDCAD DST Long – 10 Jul 2017


Acc Risk: 0.4%
Long: 0.9790
Stop: 0.9767 (23 pips)
Target: 0.9968 (178 pips, 4h100, 7.73x RR)
Mindset: Prefer this set up to the USDCAD, feel it will run soon enough

Updates

Closed the trade manually – 12 Jul
BoC raises rates to 0.75% – 12 Jul
Missed the re-entry – 13 Jul

Spotted this set up when scanning the short CAD plays. The set up is pretty good, decent entry and a nice rolling divergence. I can’t make up my mind whether this is a single or double divergence. There’s quite a lot of time between the last MACD major low and this one.

For the time being I’ve picked double divergence and the 4h100 as a target.

Trade was taken AM, Screenshots were late PM, same day

4H Chart – set up

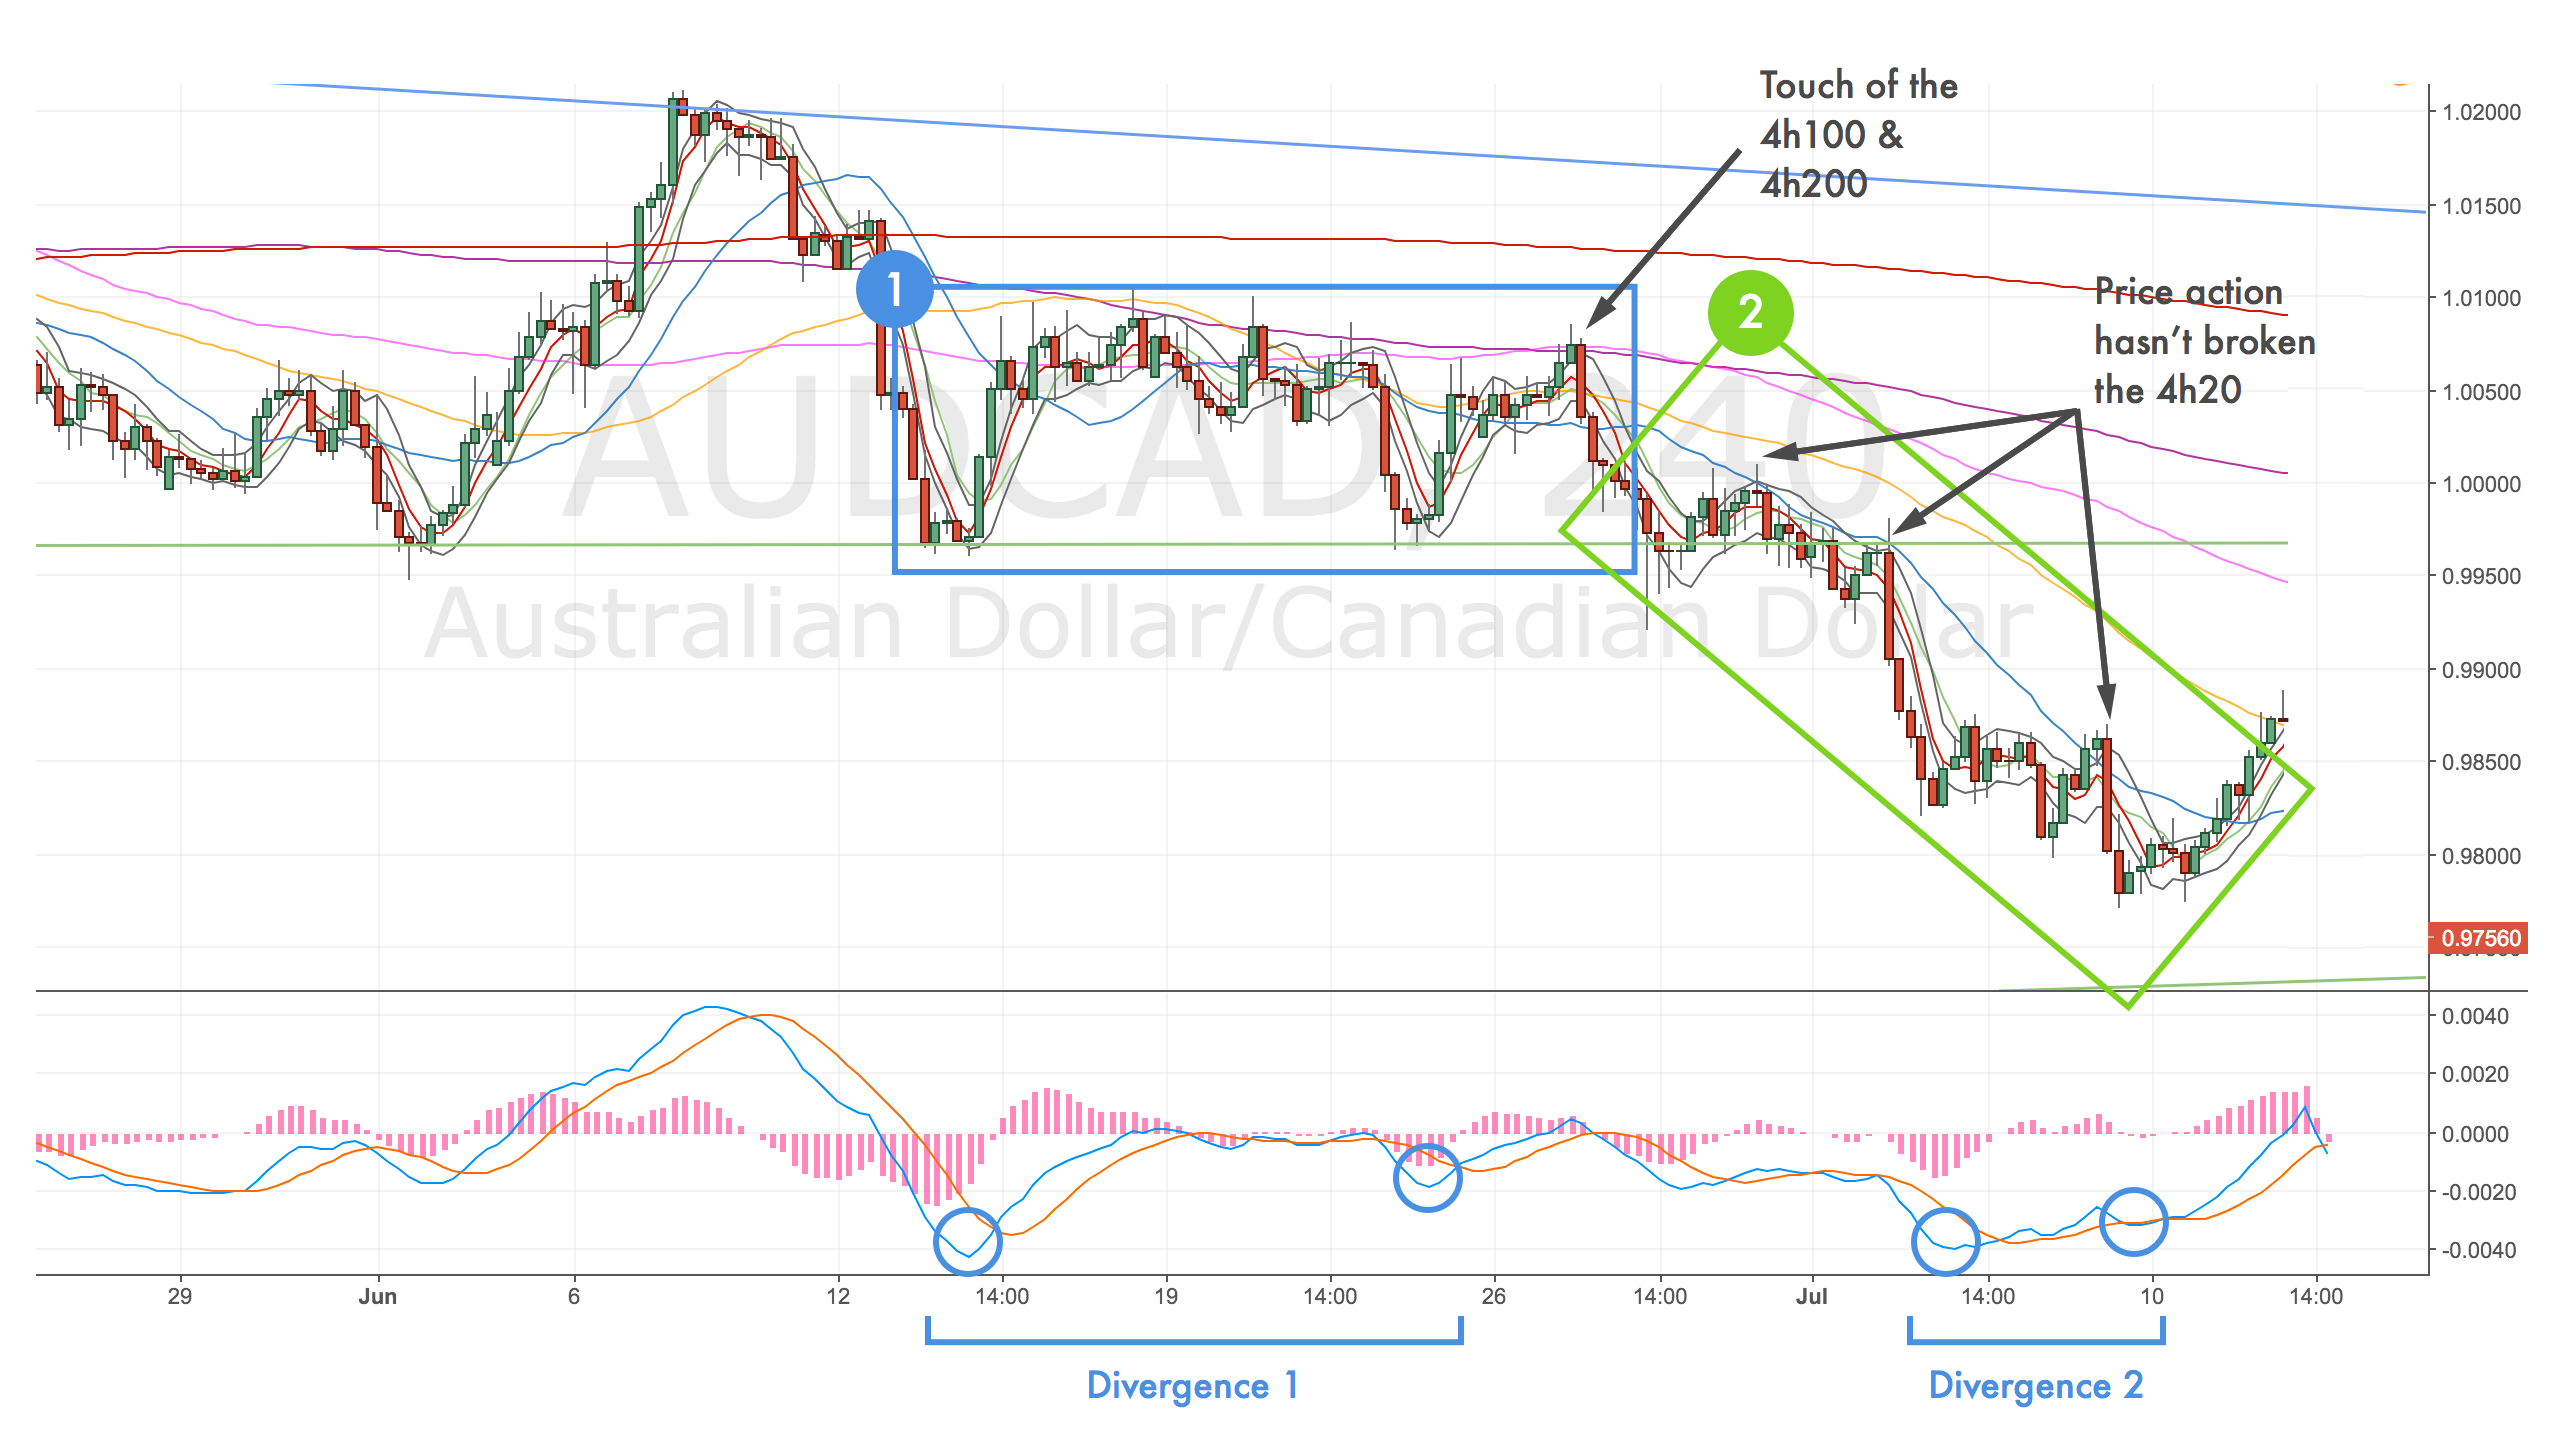
Single or double divergence? Aiming for the 4h100 for now.

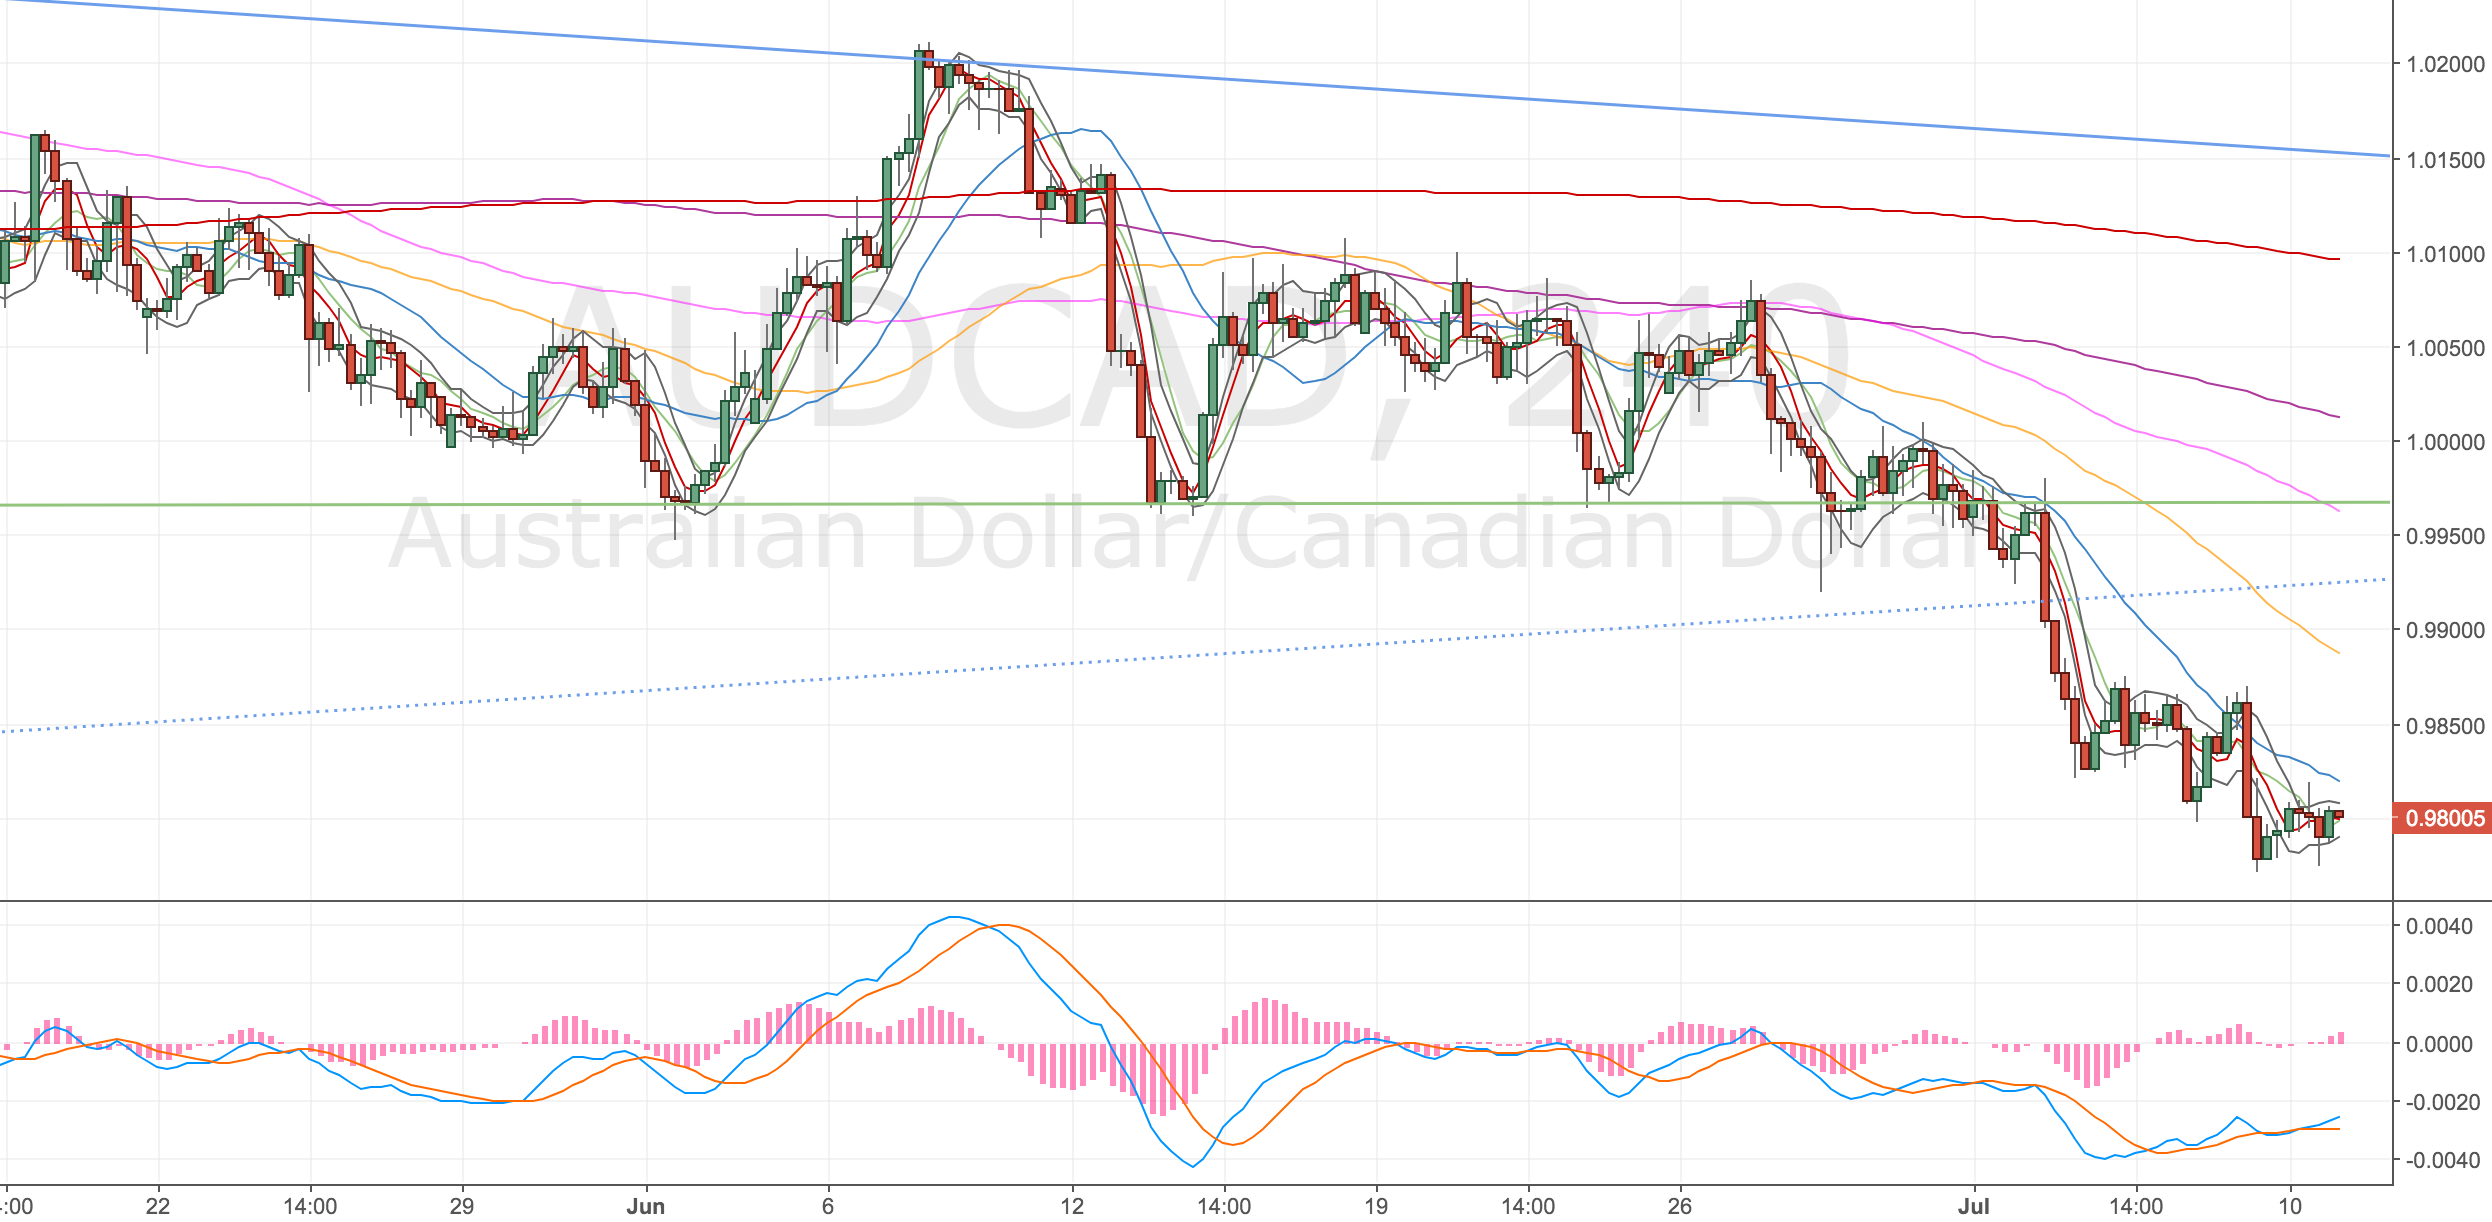
AUDCAD 4h Chart – 10 Jul

1H Chart – confirmation

Double divergence confirmation. Shame the 1h100 is so close.

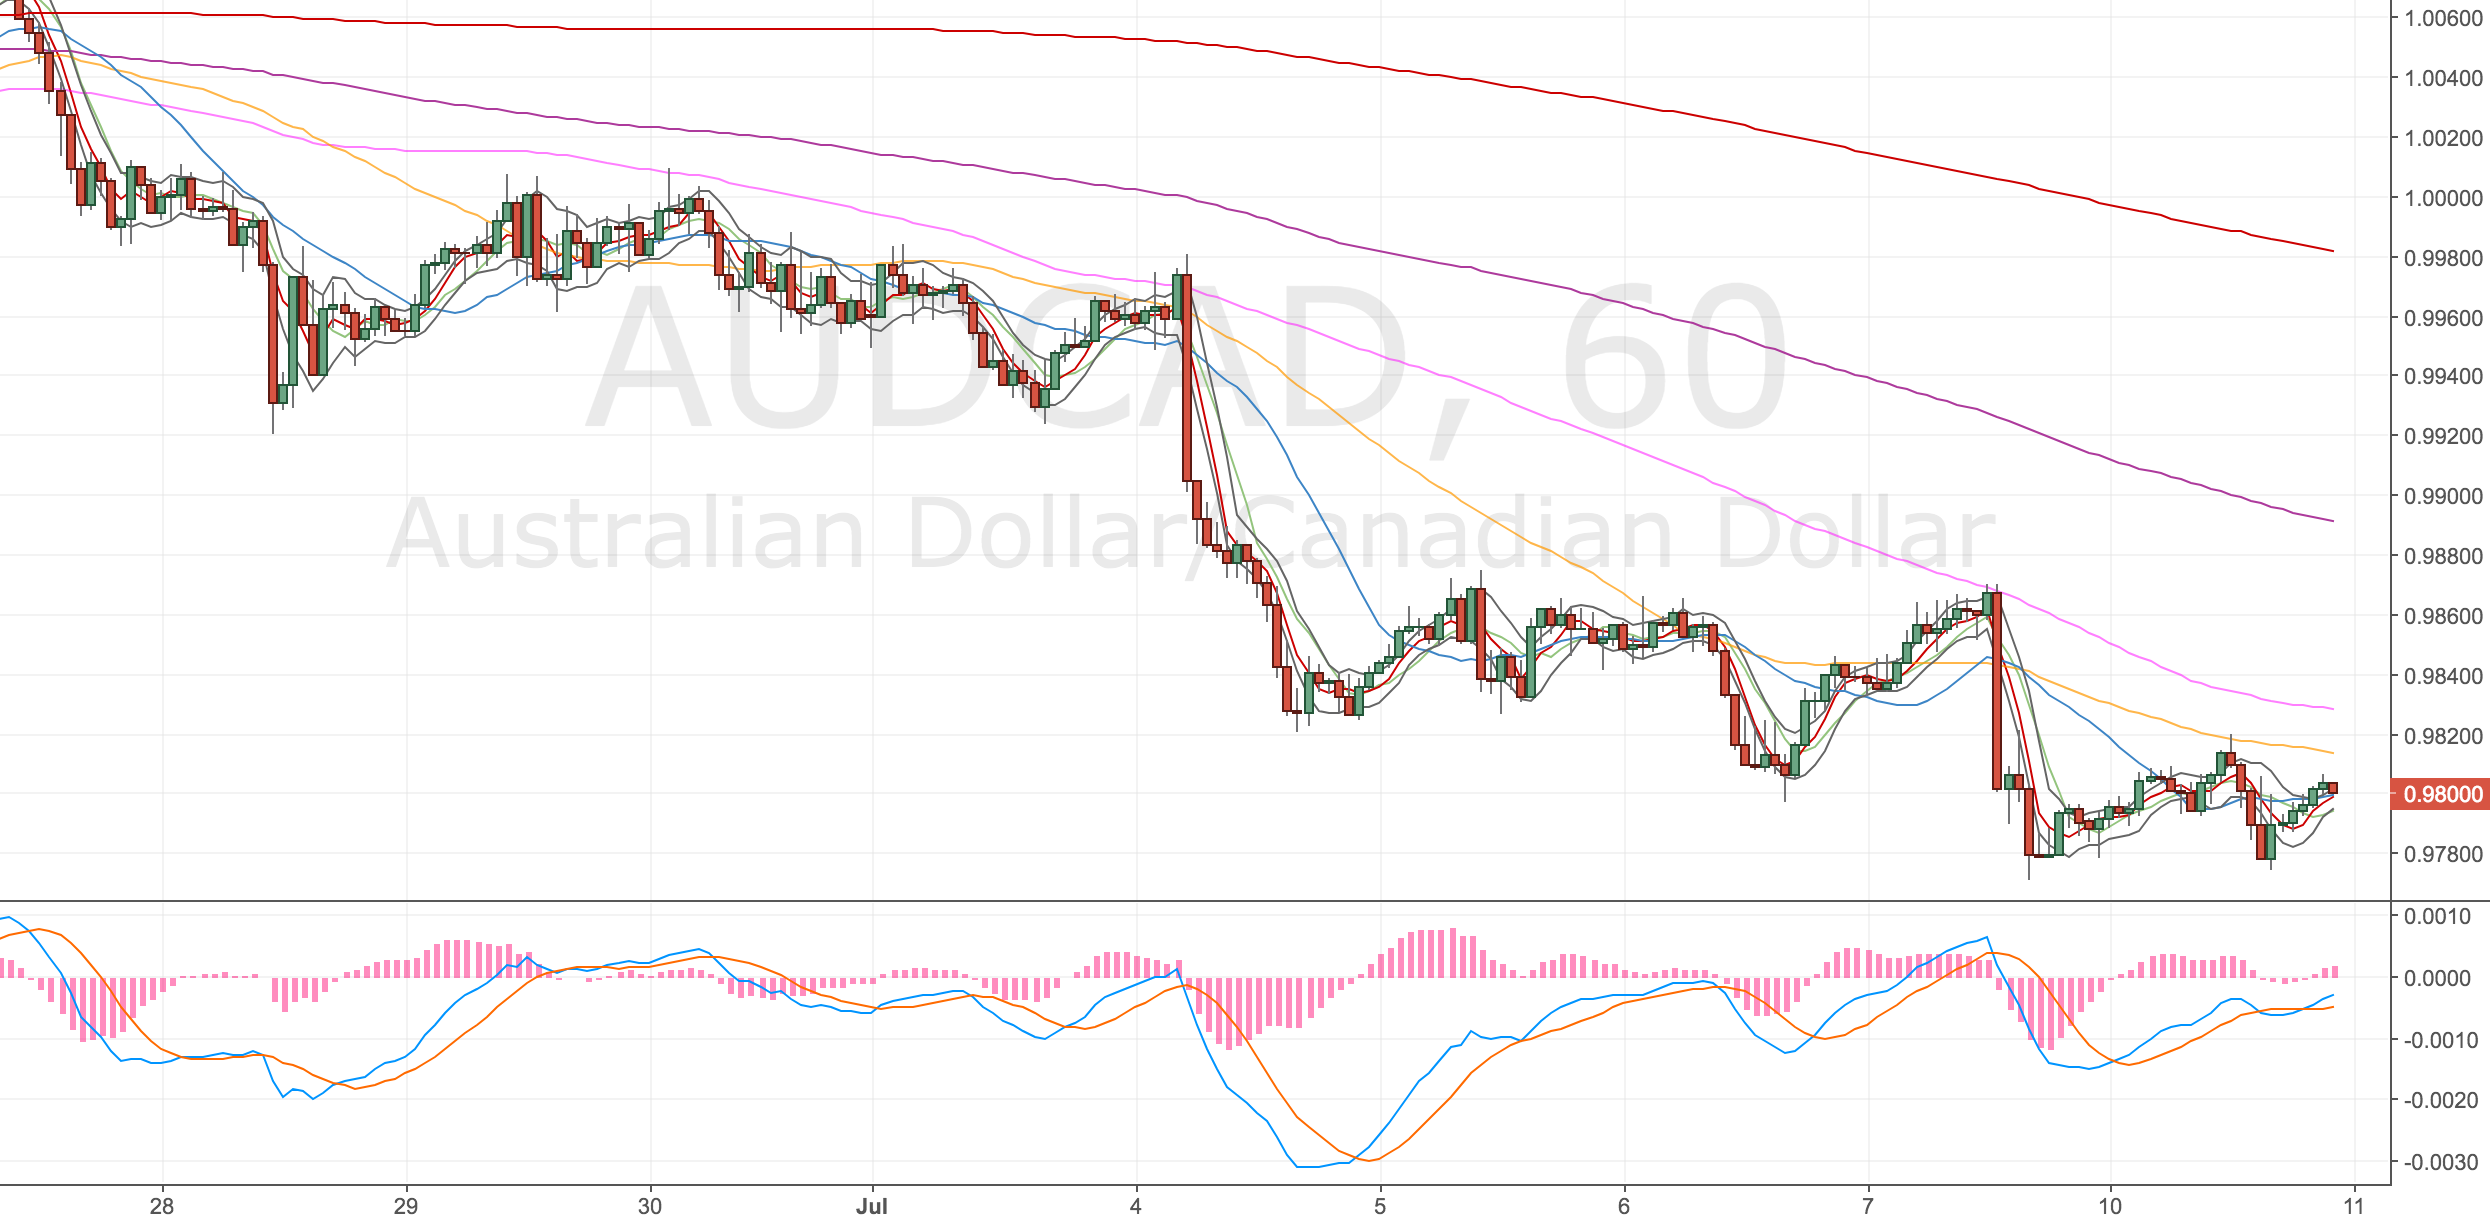
AUDCAD 1h Chart – 10 Jul

Daily Chart

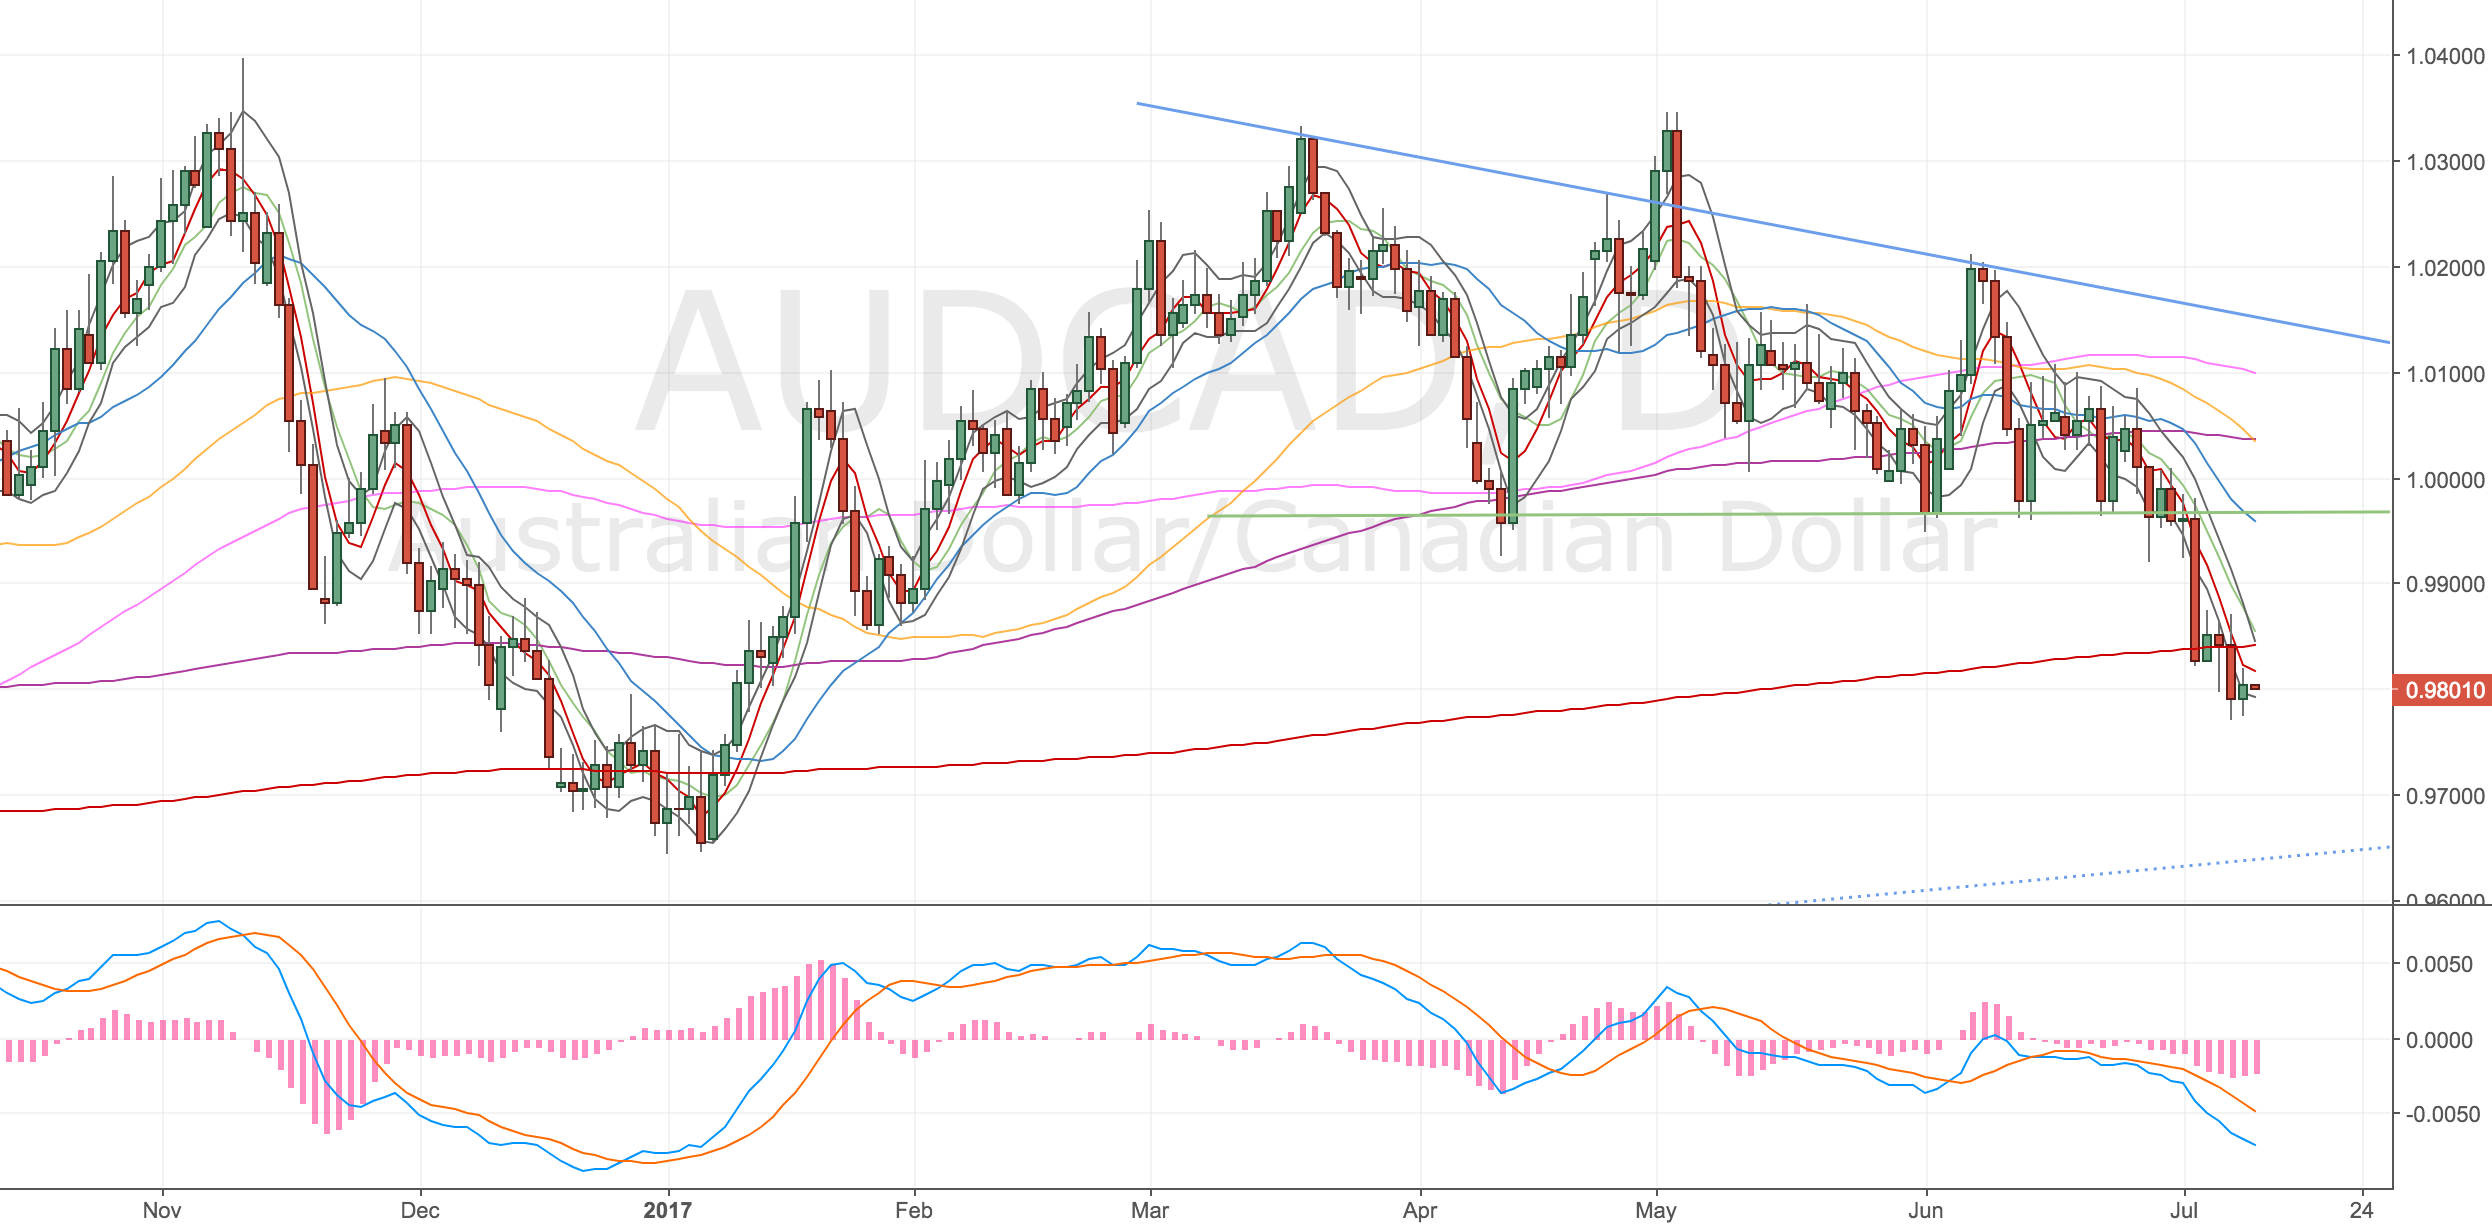
Noticed the price action around the d500.

AUDCAD Daily Chart – 10 Jul

Update – Closed the trade manually – 12 Jul

Had some nice progressive price action up to the 4h50; I’ve been re-looking at my charts and I’ve decided I can’t justify the double divergence target, so I’ve just closed the trade.

AUDCAD 4H Chart – 11 Jul

It seems to me that I’m not comparing similar price action together. The price action in block 1 seems different to block 2. I think they are distinct, there’s enough price action going on between the MACD lows to make them separate divergences (as shown). Technically the first divergence isn’t a divergence but price action running into MAs and S&R zones often fudge the set ups. I still think it’s valid 🙂

I also noticed the price action in section 2 hasn’t tested the 4h50 – it’s made 3 attempts at the 4h20 but never broken it. So this is the first test since we started the trend down.

One other big factor in my decision; BoC are due to make a decision on their interest rates today. It’s expected to go up and so that’ll be bearish for the Aussie. As it’s expected, I’m thinking it maybe priced in? But I’m not that far from my entry and Interest Rate decisions are on the upper end of the scale in terms of volatility. So I’m happy to have hit target before the announcement.

Update – BoC raises rates to 0.75% – 12 Jul

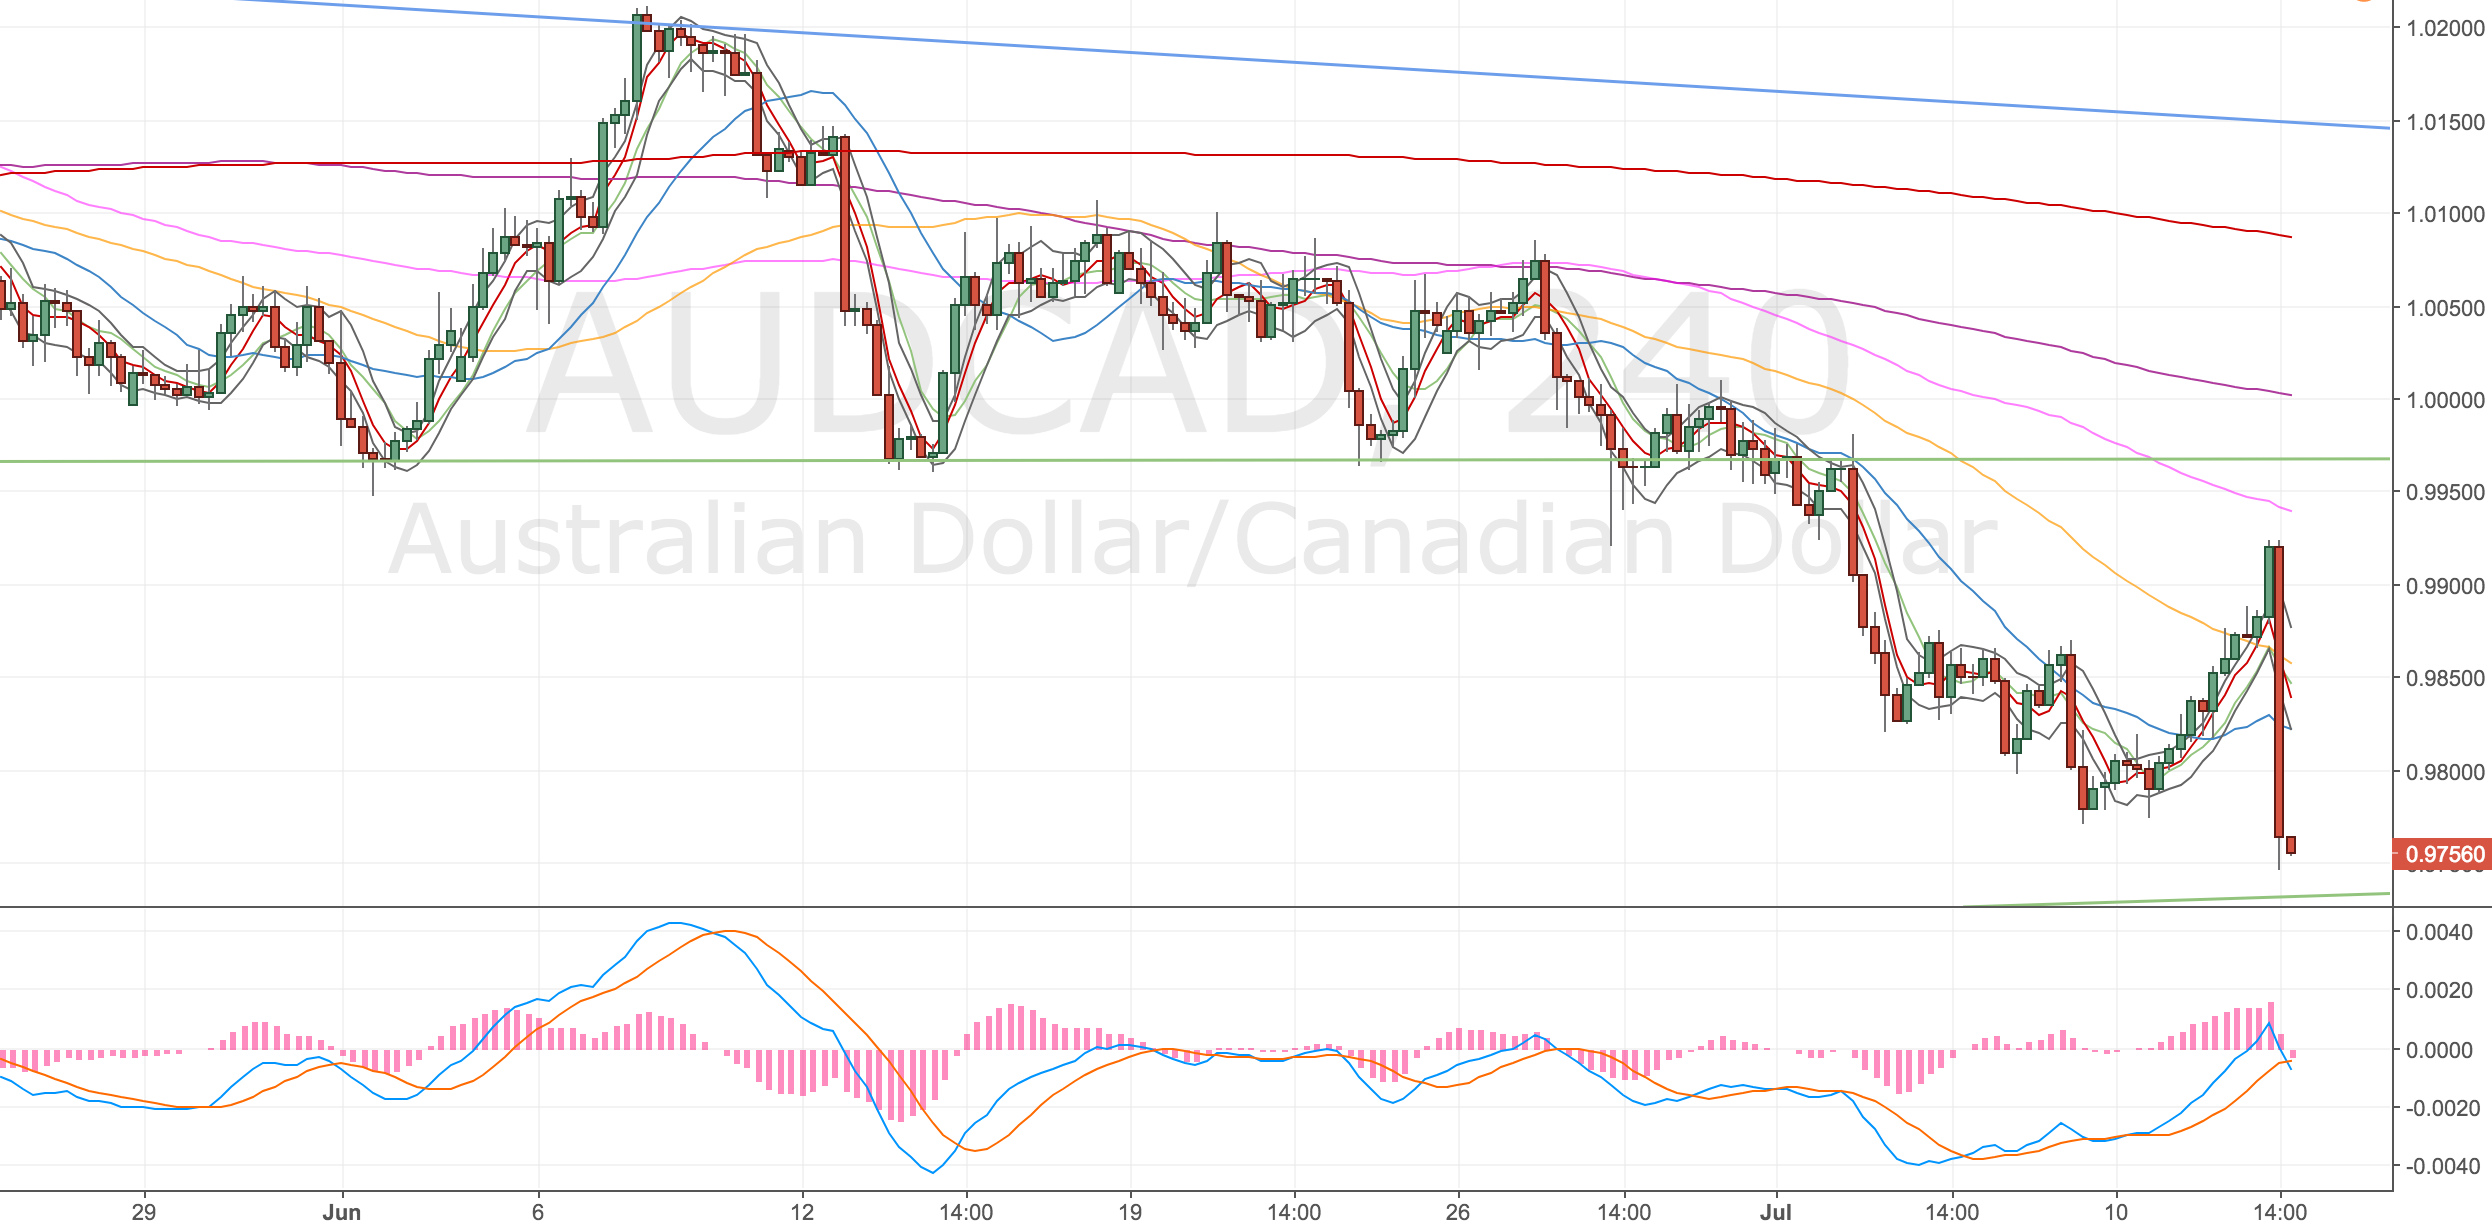
Wow, I feel lucky to have got away with this one, I was really in two minds about keeping my position open or closing it. BoC did raise their interest rates and price has reversed the last few days, and some more. We’re now making a new low.

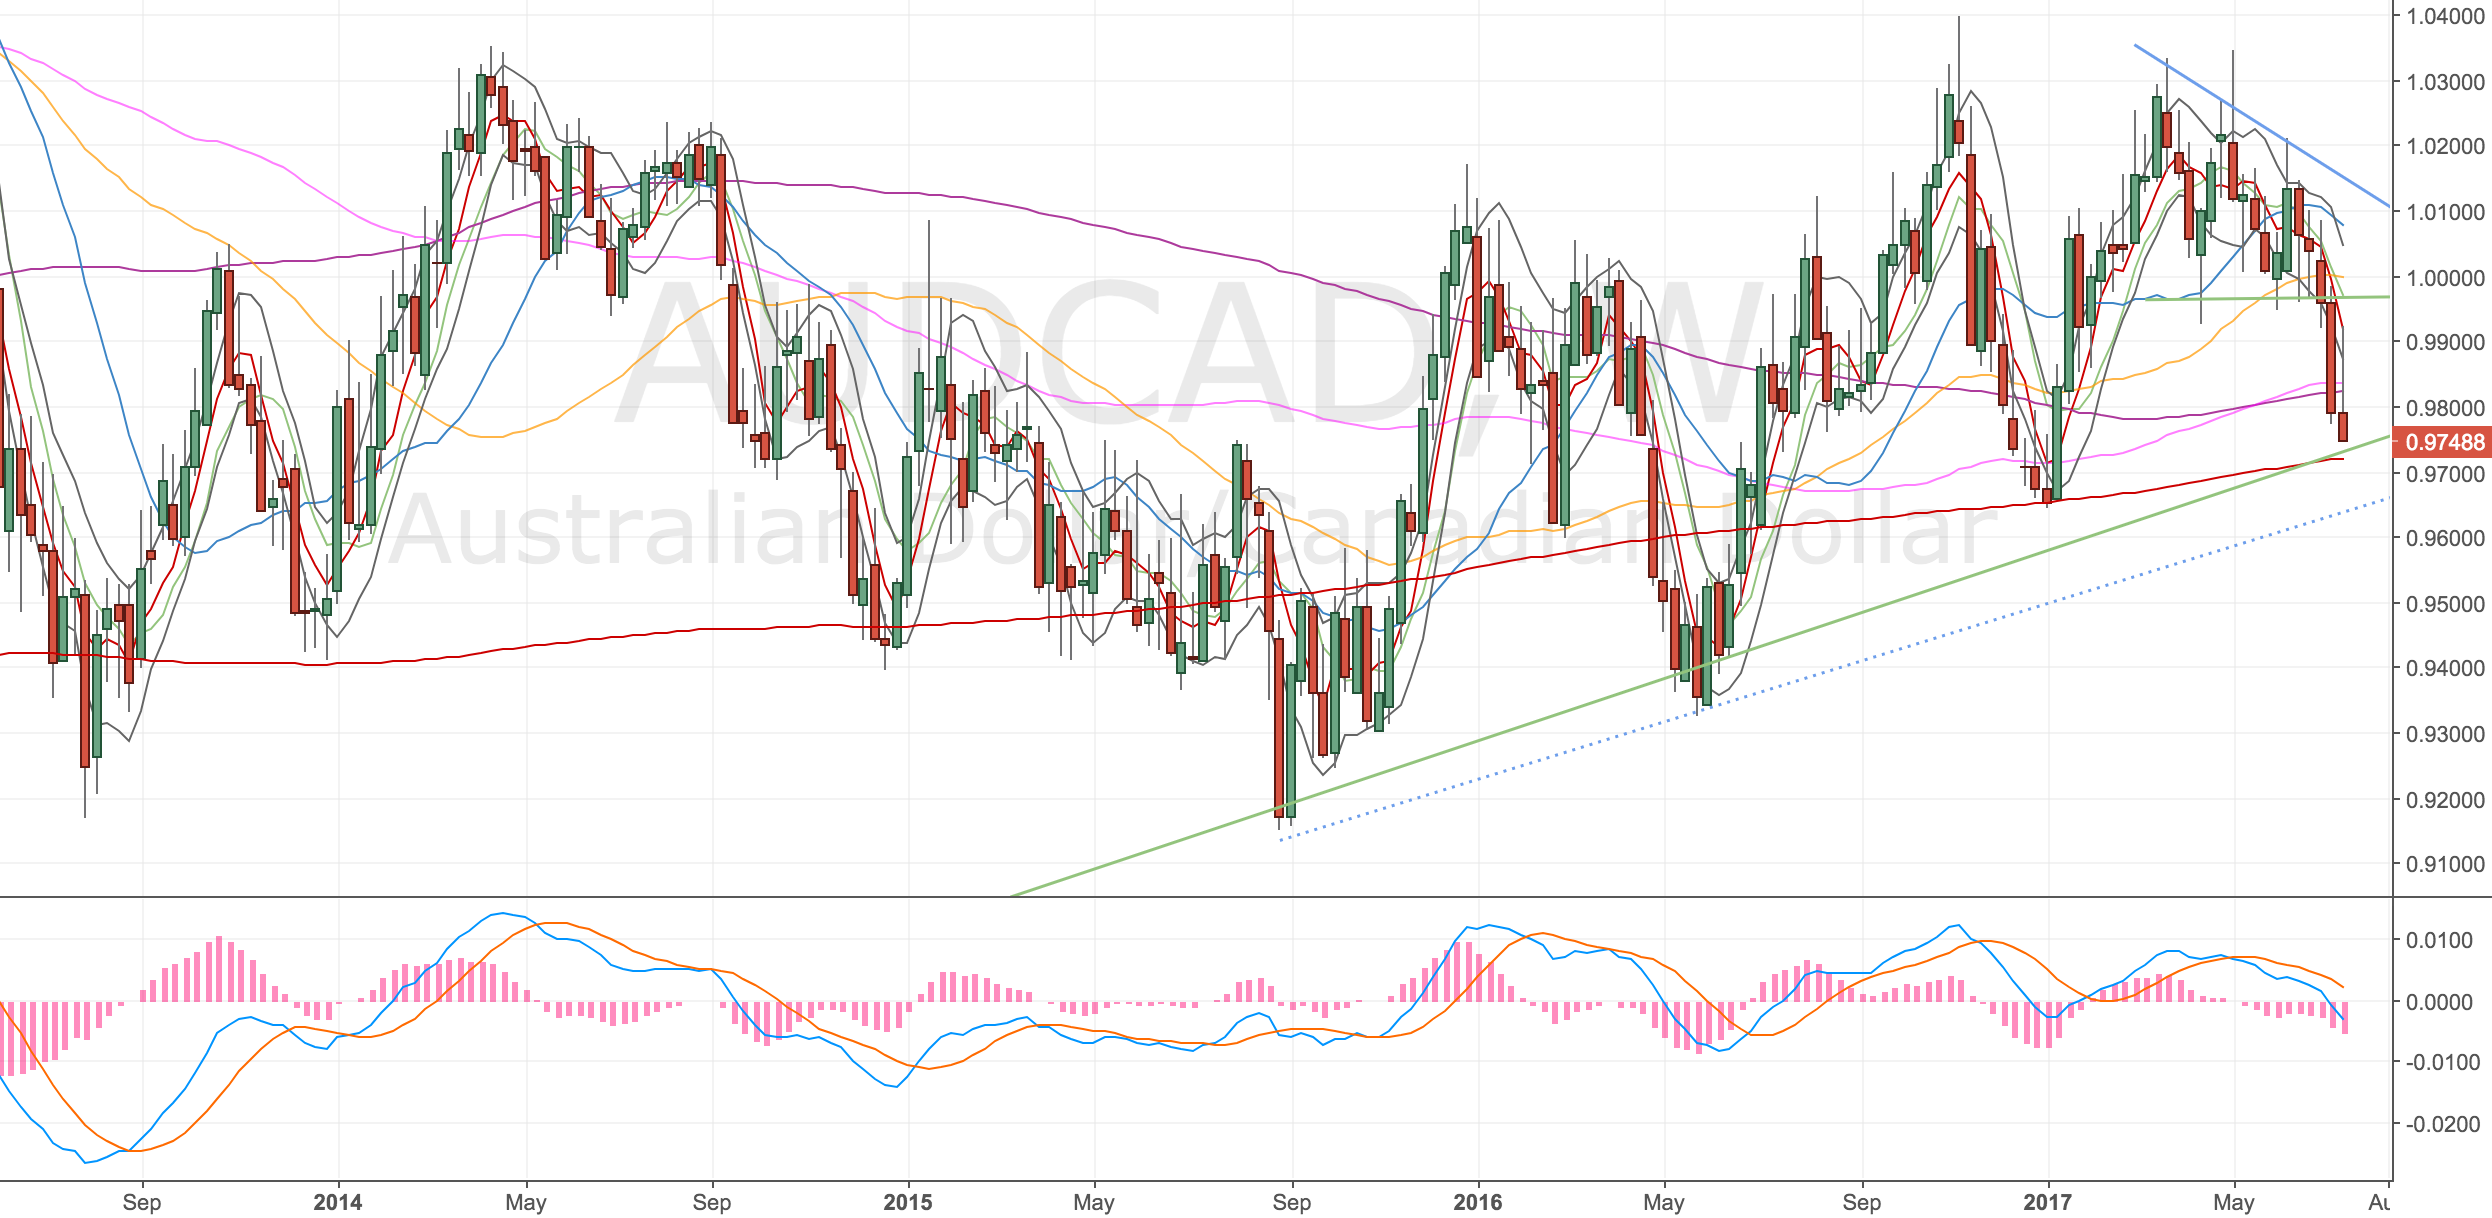
We’re now heading for another divergence a test of a monthly trendline and the w500! Hmmmm, this seems like it could be too good to be true?

AUDCAD 4H Chart – 12 Jul

AUDCAD Weekly Chart – 12 Jul

Missed the re-entry – 13 Jul

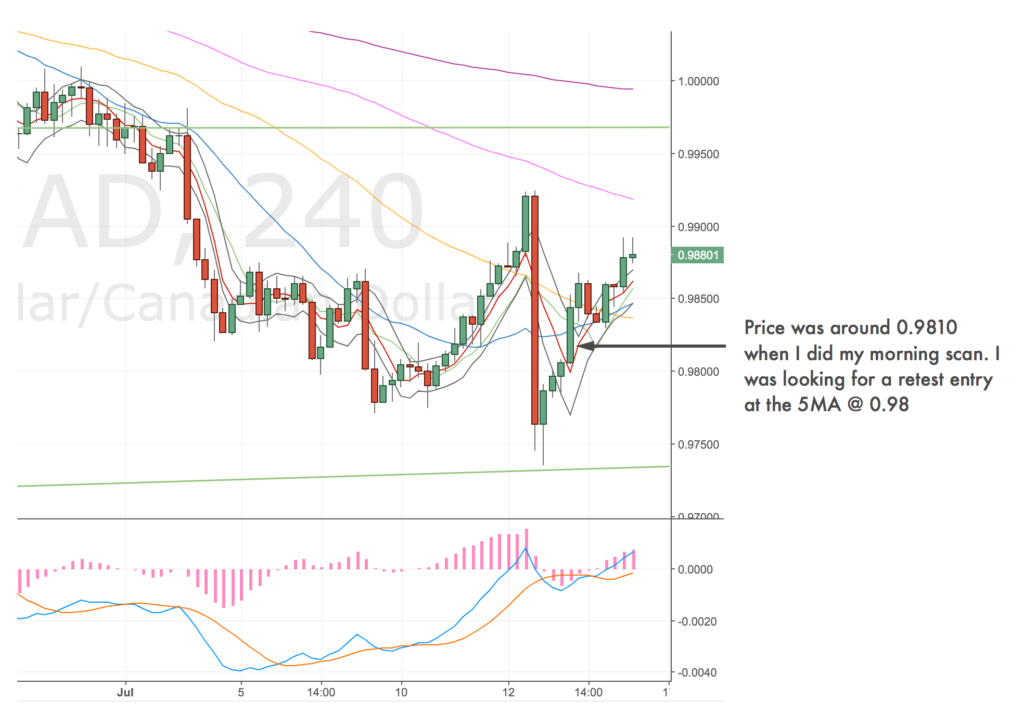
I was looking for a retest of the 5MA or a bit lower to get long on this but price just ran away.
I did notice the strength of the move when I was checking the market, it probably moved 10 odd pips in less than a minute, which is unusual for a pair like that in the UK morning session, with no news events due.

AUDCAD 4H Chart – 14 Jul

NZDUSD DST Short – 30 June 17


Acc Risk: 0.45%
Short: 0.7317
Stop: 0.7354 (36 pips)
Target: 0.7159 (158 pips, 4h200!, 4.3x RR)
Mindset: Like the setup into the upper trendline
Attempts: One or two more

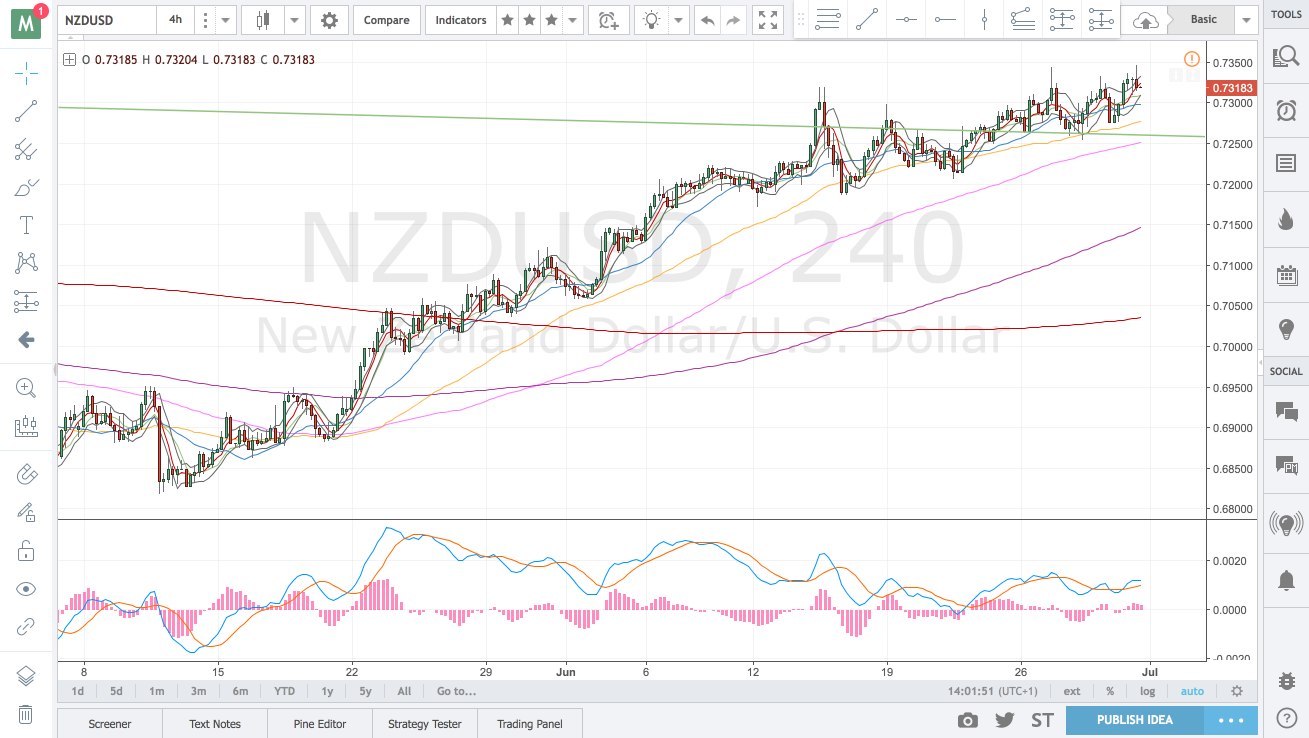
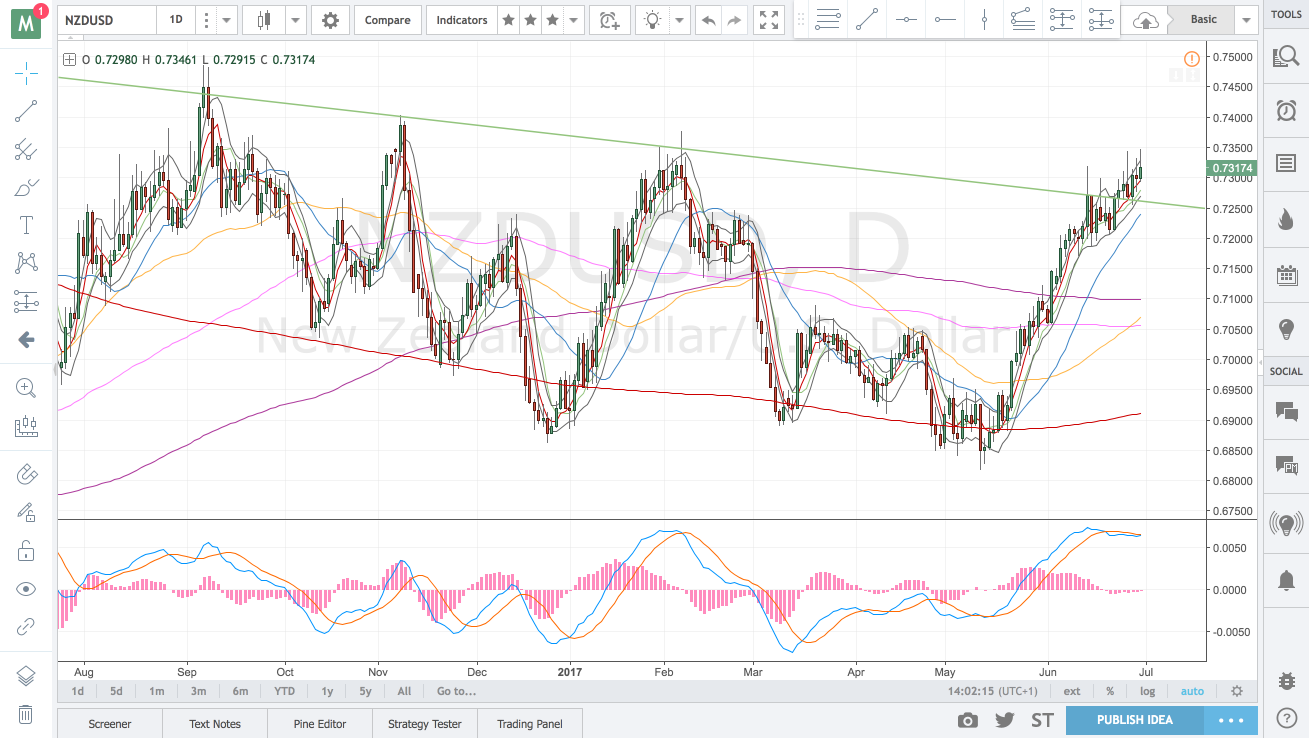
I like this set up, we’ve got a quadruple divergence on the 4H chart and the confirming 1H chart has a double divergence. Usually I would trade this to the 4h100, but the daily chart almost diverged and so I’m looking for a bigger run.

I often notice that divergences don’t quite form when price runs to technical levels (trendlines or MAs) but are still worth trading. So I’m looking for the 4h200 which is around the same level as the d50.

Breaking my rules here, but I think I can just about justify it. Besides the 4h100 wouldn’t really be worth the trade.

4h Chart

NZDUSD 4H Chart – 30 June

Daily Chart

NZDUSD Daily Chart – 30 June

Update – Closing the trade following my month call – 5 July

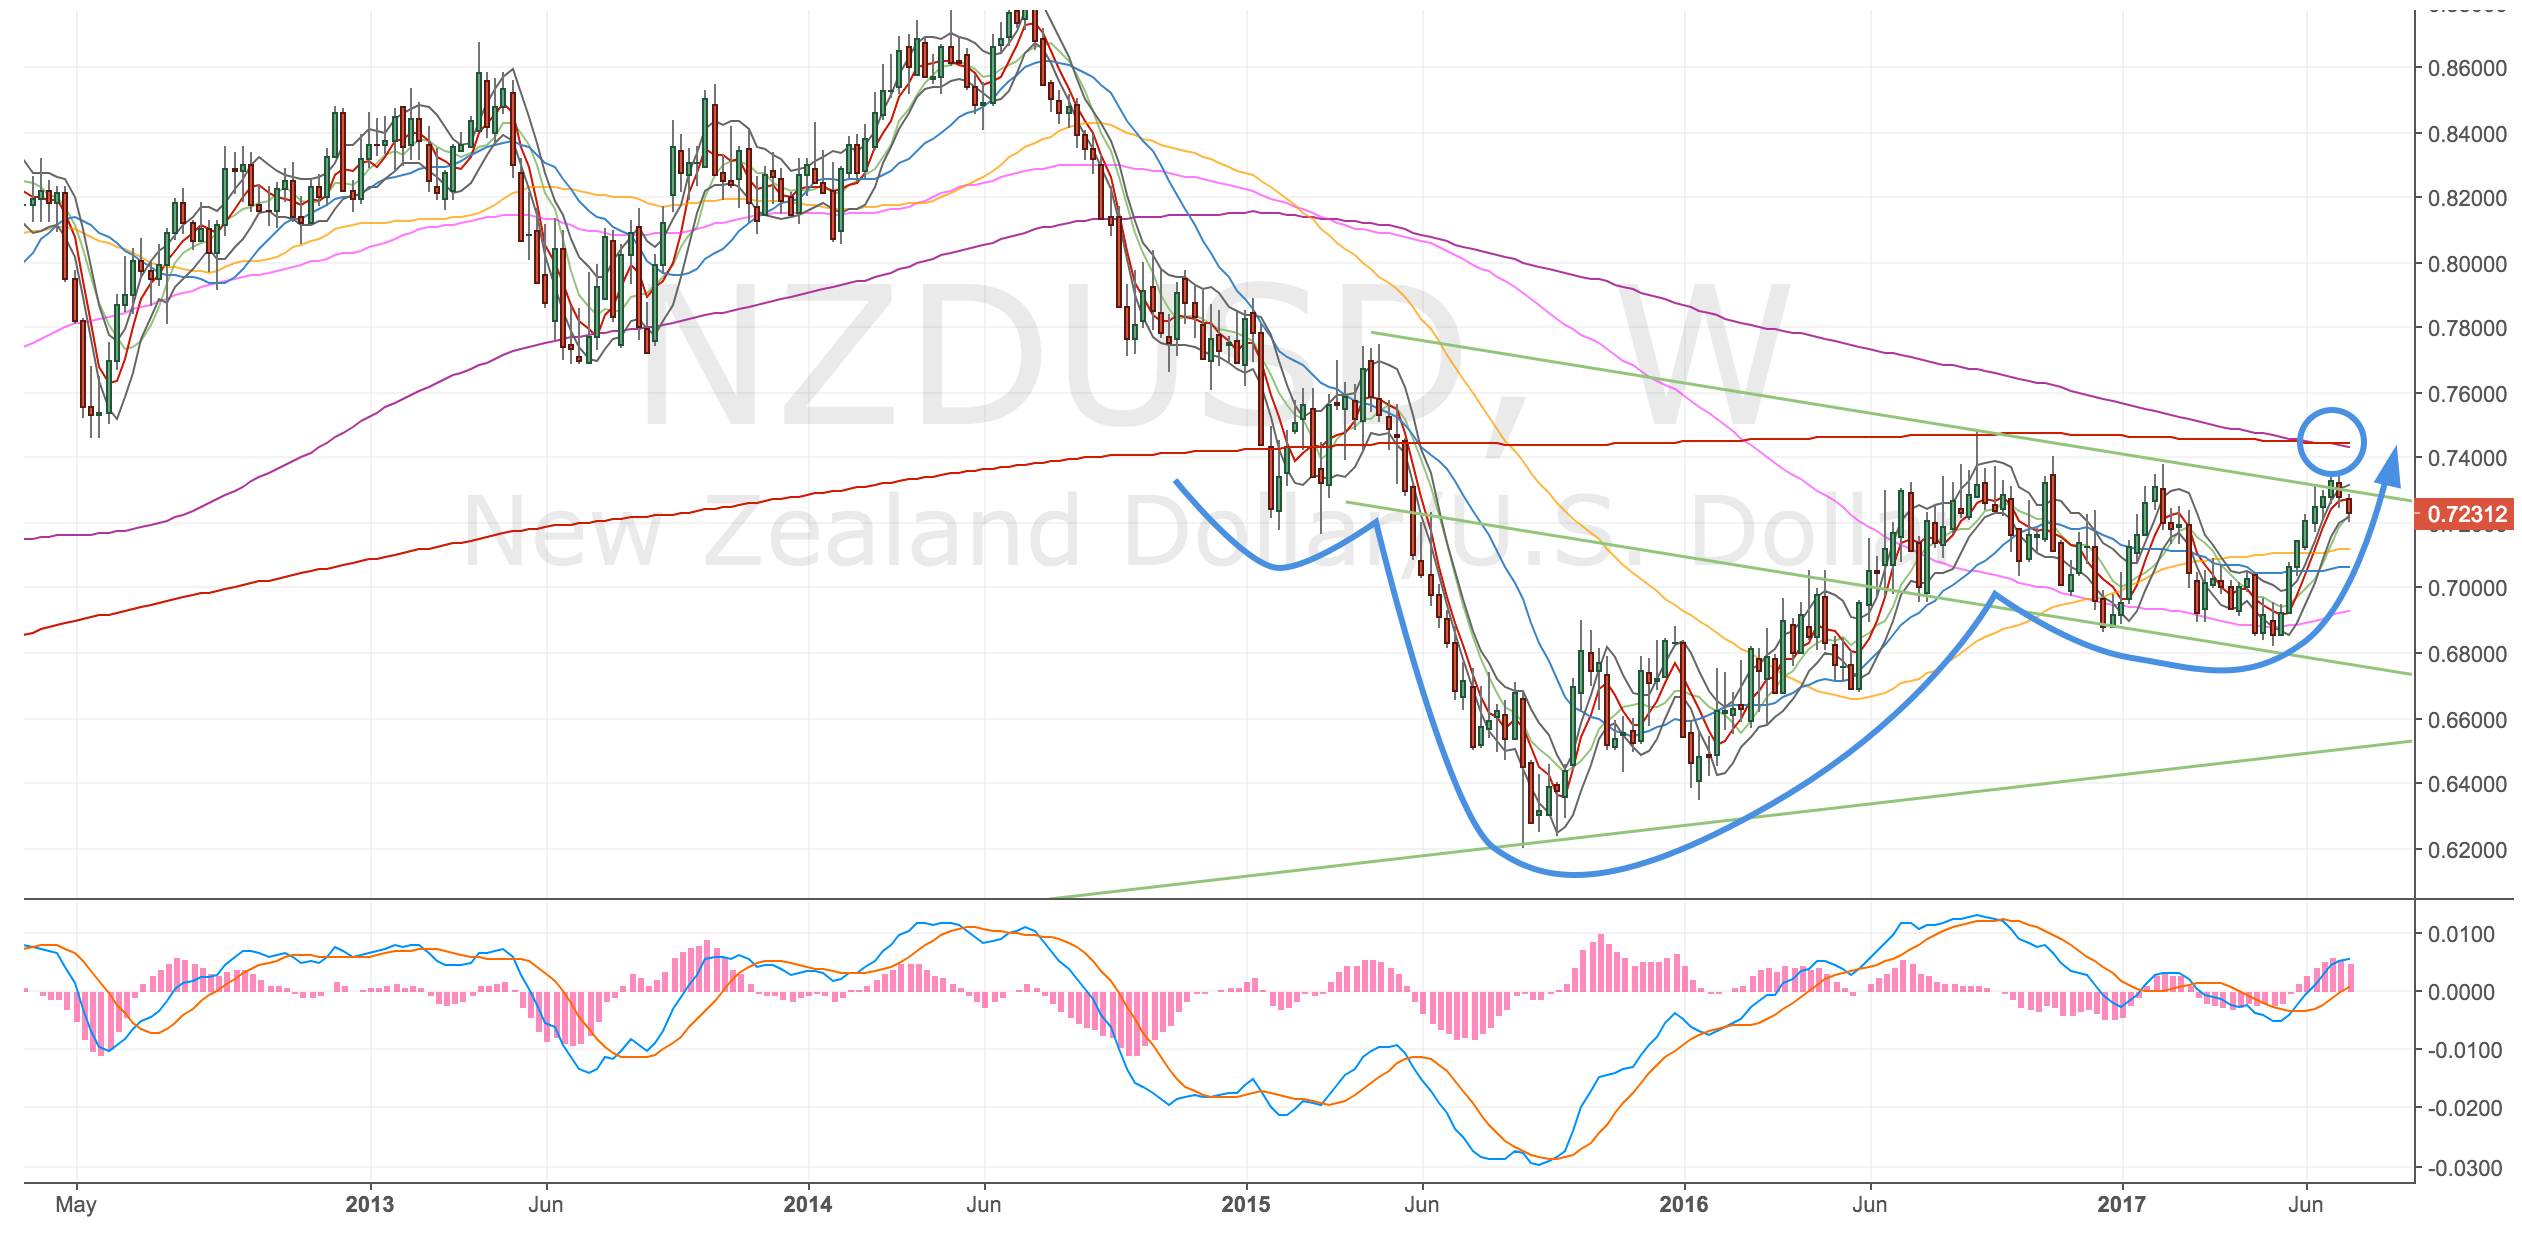
I’ve closed this trade following my call with Charlie. We reviewed the set up and whilst he agreed that the trade was valid pointed out a bullish pattern on the weekly timeframe.

This might be a Jesse Livermore moment – trade your own plan, not someone else’s – but I’ve decided to close the trade out. Charlie suggested closing half (as we’re at the 4h100) and leaving the rest to see if my trade idea plays out but I’ve decided it is ill disciplined to aim for more.

Here’s what Charlie saw. An inverted head and shoulders and the major MAs (200 & 500)

NZDUSD Weekly Chart – 5 Jul. Inverted head and shoulders and close to the w200 & w500.

I’ll keep an eye on the trade and see what happens. I can see a swing higher forming before we get another short signal. It’s always so obvious when you get someone else to point these things out. But again another lesson …

Check the higher timeframes!

USDCAD DST Long – 30 Jun, 4 Jul, 5 Jul, 7 Jul & 17 Jul 2017


Long: 1.2974
Stop: 1.2941 (34 pips)
Target: 1.3181 (206 pips, 4h50, 6x RR)
Mindset: Like the divergence, love the RR. Optimistic on this.
Attempts: A couple

Updates

Stopped out – 4 Jul
Going in again – 5 Jul
Conversation with Charlie – 5 Jul
Stopped out again – 7 Jul
Switching to the AUDCAD set up – 10 Jul
Taking another set up – 17 Jul
Stopped out an hour later – 17 Jul

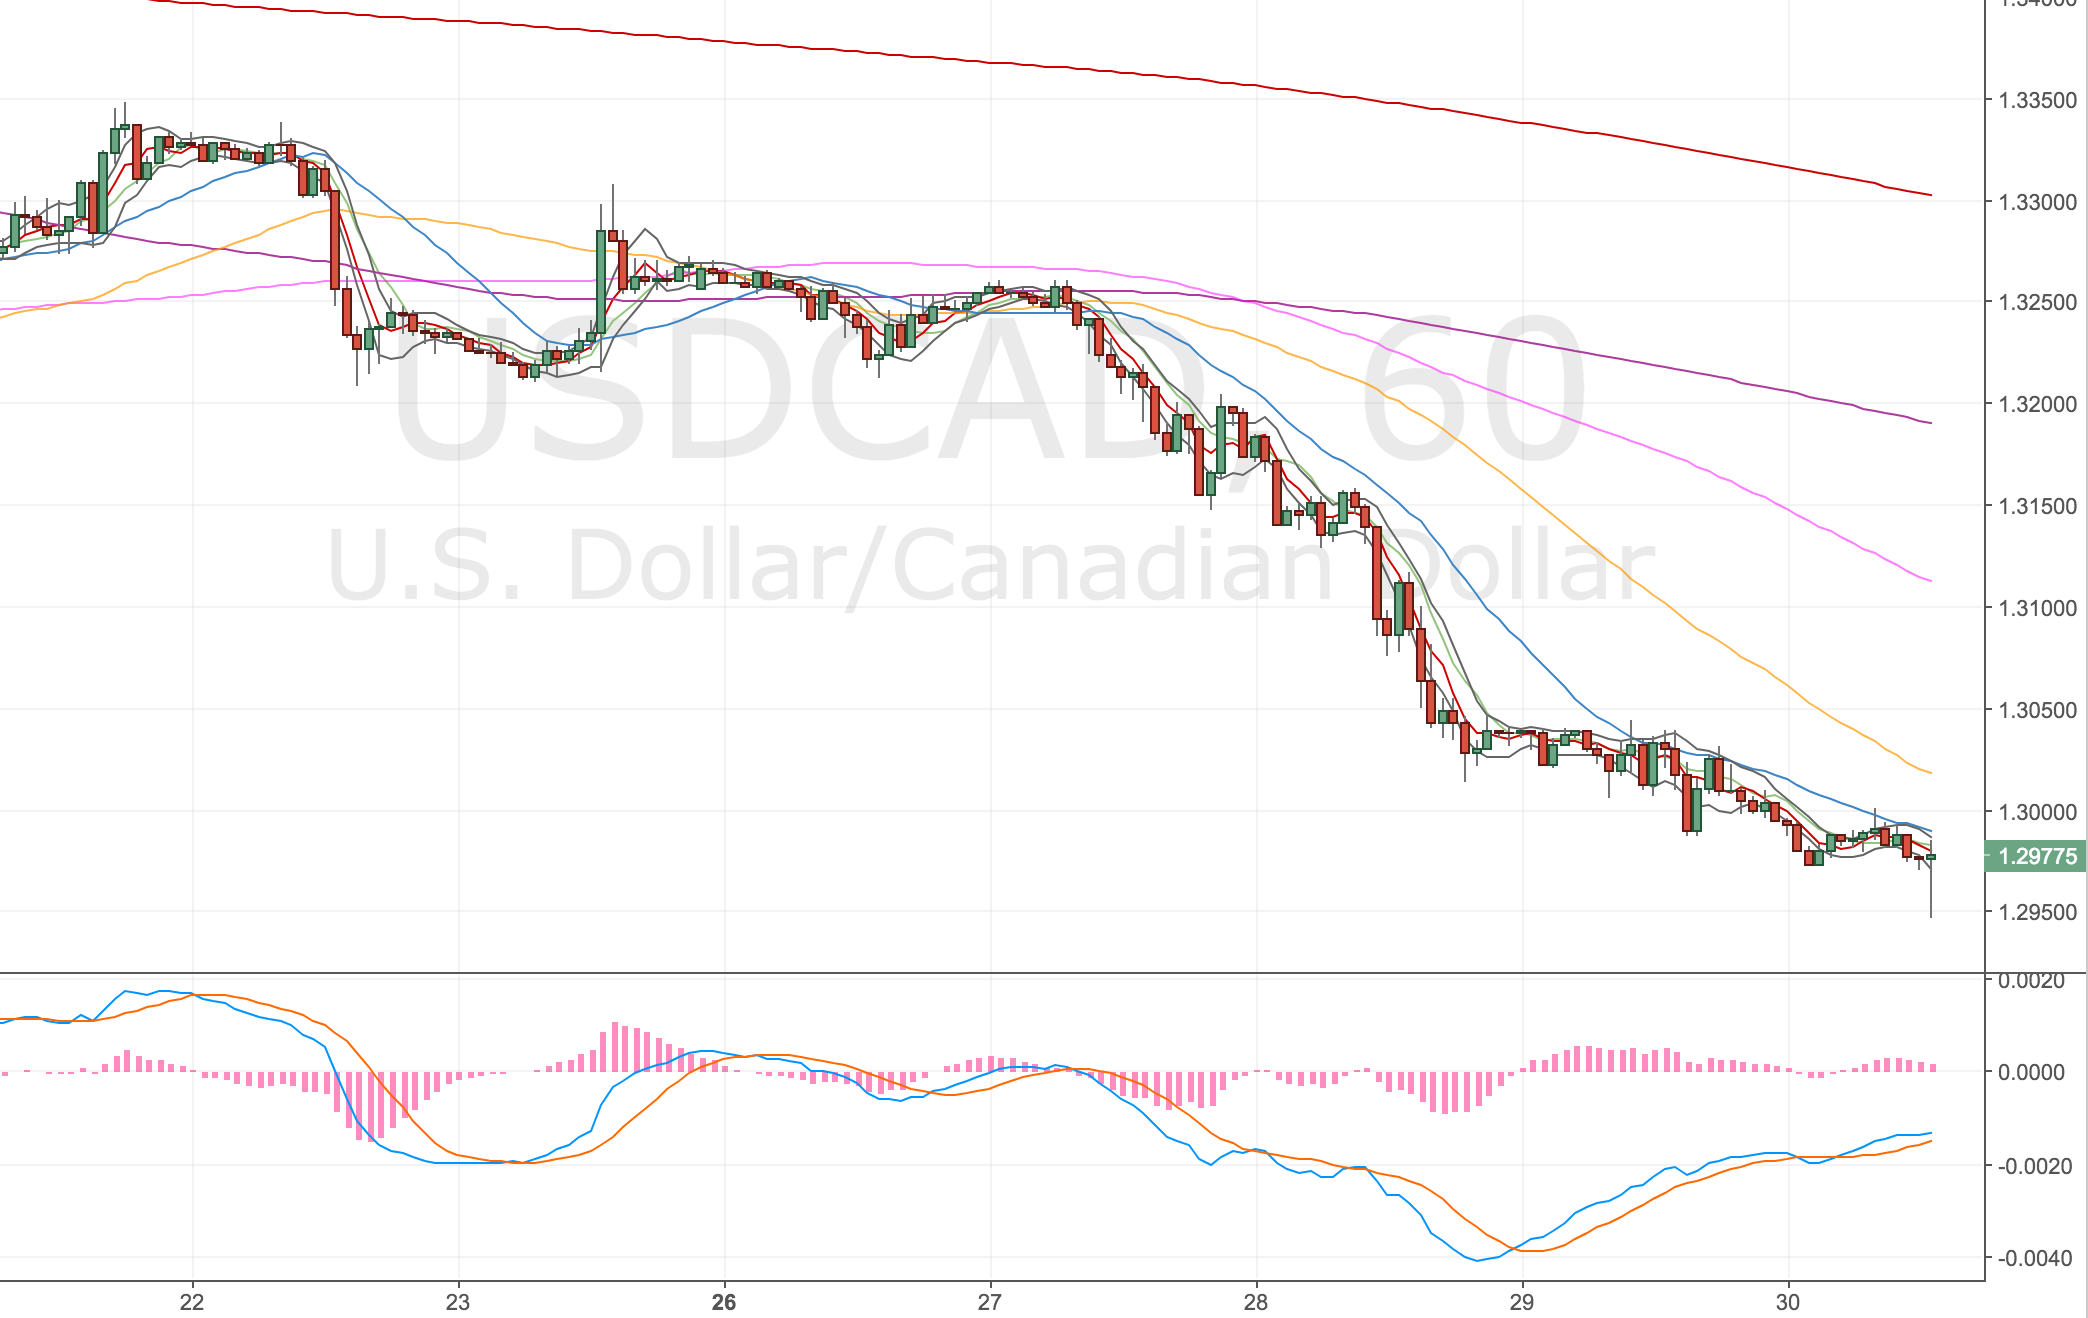
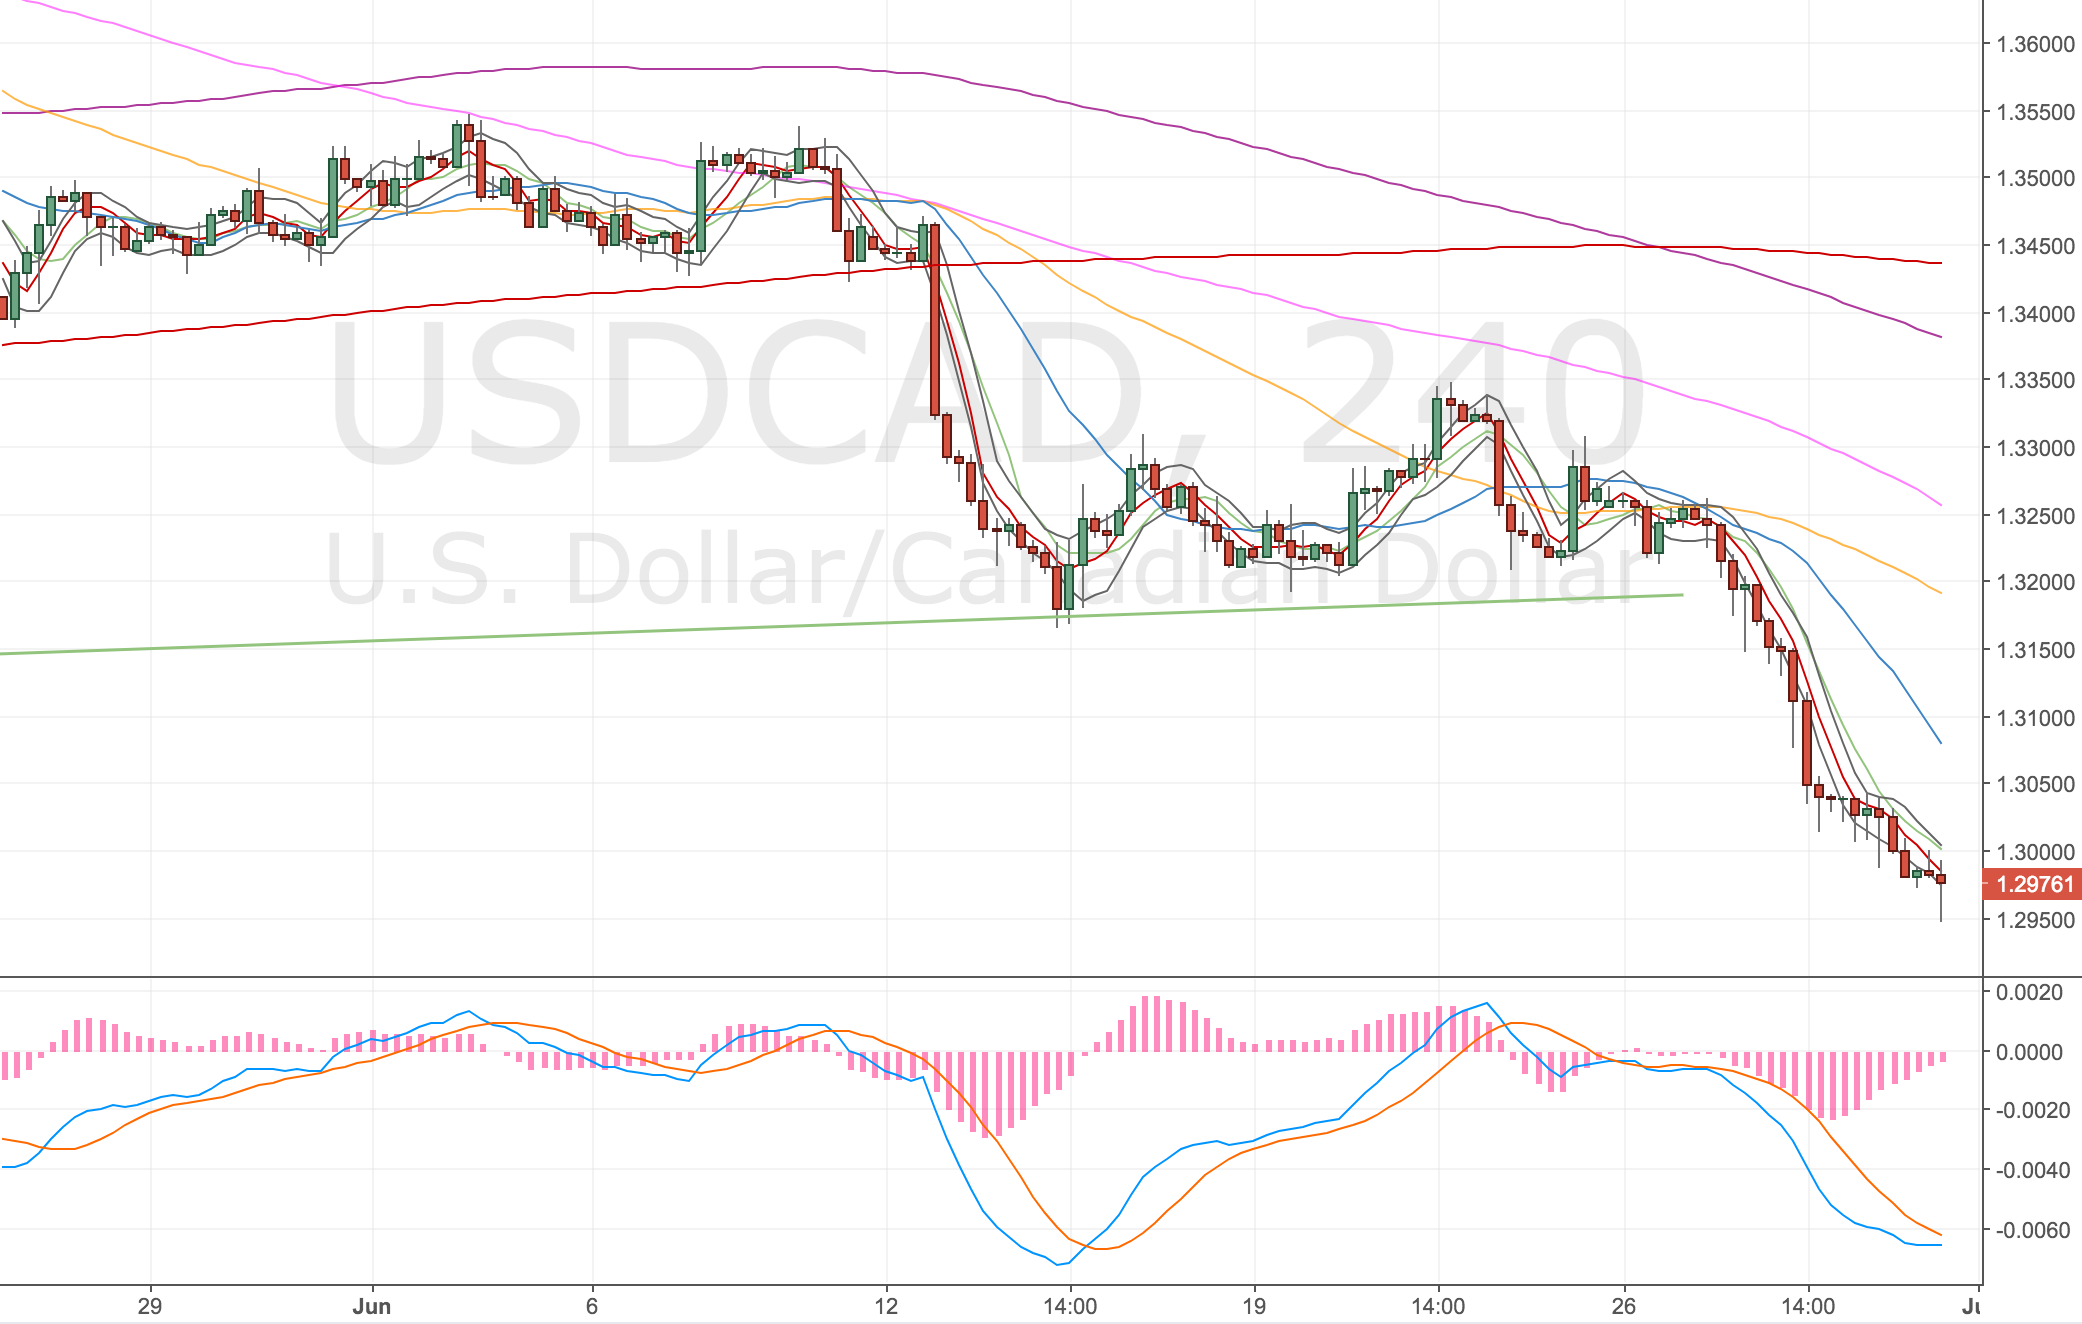
I’ve been watching the USDCAD for a while now, CAD has been really strong and has broken the trend channel, so I’ve been watching for divergence to set up and then a retest of the lower trendline (this time as resistance rather than support).

I may be a little early on this trade – both charts show bars that haven’t closed yet! So they might disprove the entry, I’m taking the trade because of my timing (I’m at work on lunch) and the fact that the 15M chart has a mega divergence in play 3x.

USDCAD 1H Chart

USDCAD 1H Chart – 30 June

USDCAD 4H Chart

USDCAD 4H Chart – 30 June. Lower trendline in green.

Stopped out – 4 Jul

Just been stopped out – thought this trade might stick but price has rolled over. The divergences are still there so looking for another setup.

Going in again – 5 Jul


Long: 1.2949
Stop: 1.2907 (42 pips)
Target: 1.3156 (207 pips, 4h50, 4.92x RR)
Mindset: Slightly wider stop so the RR isn’t as good, but I still like the trade.
Attempts: Can still see this getting stopped out

I’m going in again, the divergence is still in play. Price has drifted back inside the bands but talking with Charlie he said that he isn’t overly worried about price action when it comes to set ups.

4H Chart

Screenshots were taken later in the day!

USDCAD 4H Chart – 5 Jul

1H Chart

Screenshots were taken later in the day!

USDCAD 1H Chart – 5 Jul

Conversation with Charlie – 5 Jul

Quick update, I had my monthly review call with Charlie. It was a good call, I asked him to review this trade and my Oil trade. He liked the Oil set up but not this one so much. His POV was that the divergence had formed in space with no obvious technical levels to support price action.

It’s a good point, I’ve not been great at checking the higher timeframes regularly. This is definitely something I need to make more effort to do in future.

Stopped out again – 7 Jul

Price has stopped me out again, a little disappointing. I thought I might be onto a winner. I will keep an eye on this, I will definitely go in again, if the set up occurs, but this time I’ll look for more technical reasons to.

However – a triple divergence or higher will be hard to resist.

Switching to the AUDCAD set up – 10 Jul

Just thought I should update the post to note that I’ve switched to the AUDCAD. I think the CAD is due a turn (divergences occuring on different markets) and the Aussie looks good for a move higher against the dollar.

So it’s a bit of triangular set up AUD – USD – CAD, but if I’m interested in going long USDCAD and the Aussie is looking strong against the dollar, and both set ups are valid (occuring on two timeframes). I think it’s OK to switch to AUDCAD.

One point that Charlie pointed out from my April review was that I was jumping too many markets. However I think this is justified as the set up looks better.

Taking another set up – 17 Jul


Acc Risk: 0.5%
Long: 1.2655
Stop: 1.2633 (22 pips)
Target: 1.2830 (175 pips, 4h50, 7.95x RR)
Mindset: Reticent to take the trade but (very) excited about the RR.

Had a rare opportunity to do a market scan at lunchtime spotted the divergence on the 1H and 4H charts that I liked the look of, USDCAD is now into a S&R zone formed of the prior highs and lows from early 2015 and early 2016.

Whilst there is an element of catching a falling knife, I feel that a double 4H divergence and a 1H confirmation is worth a shot. AUDCAD & GBPCAD look like they might start to make higher highs, although only the AUDCAD has so far.

The rest of the pairs are showing a divergence.

4H Chart

USDCAD 4H Chart – 17 Jul

1H Chart

USDCAD 1H Chart – 17 Jul

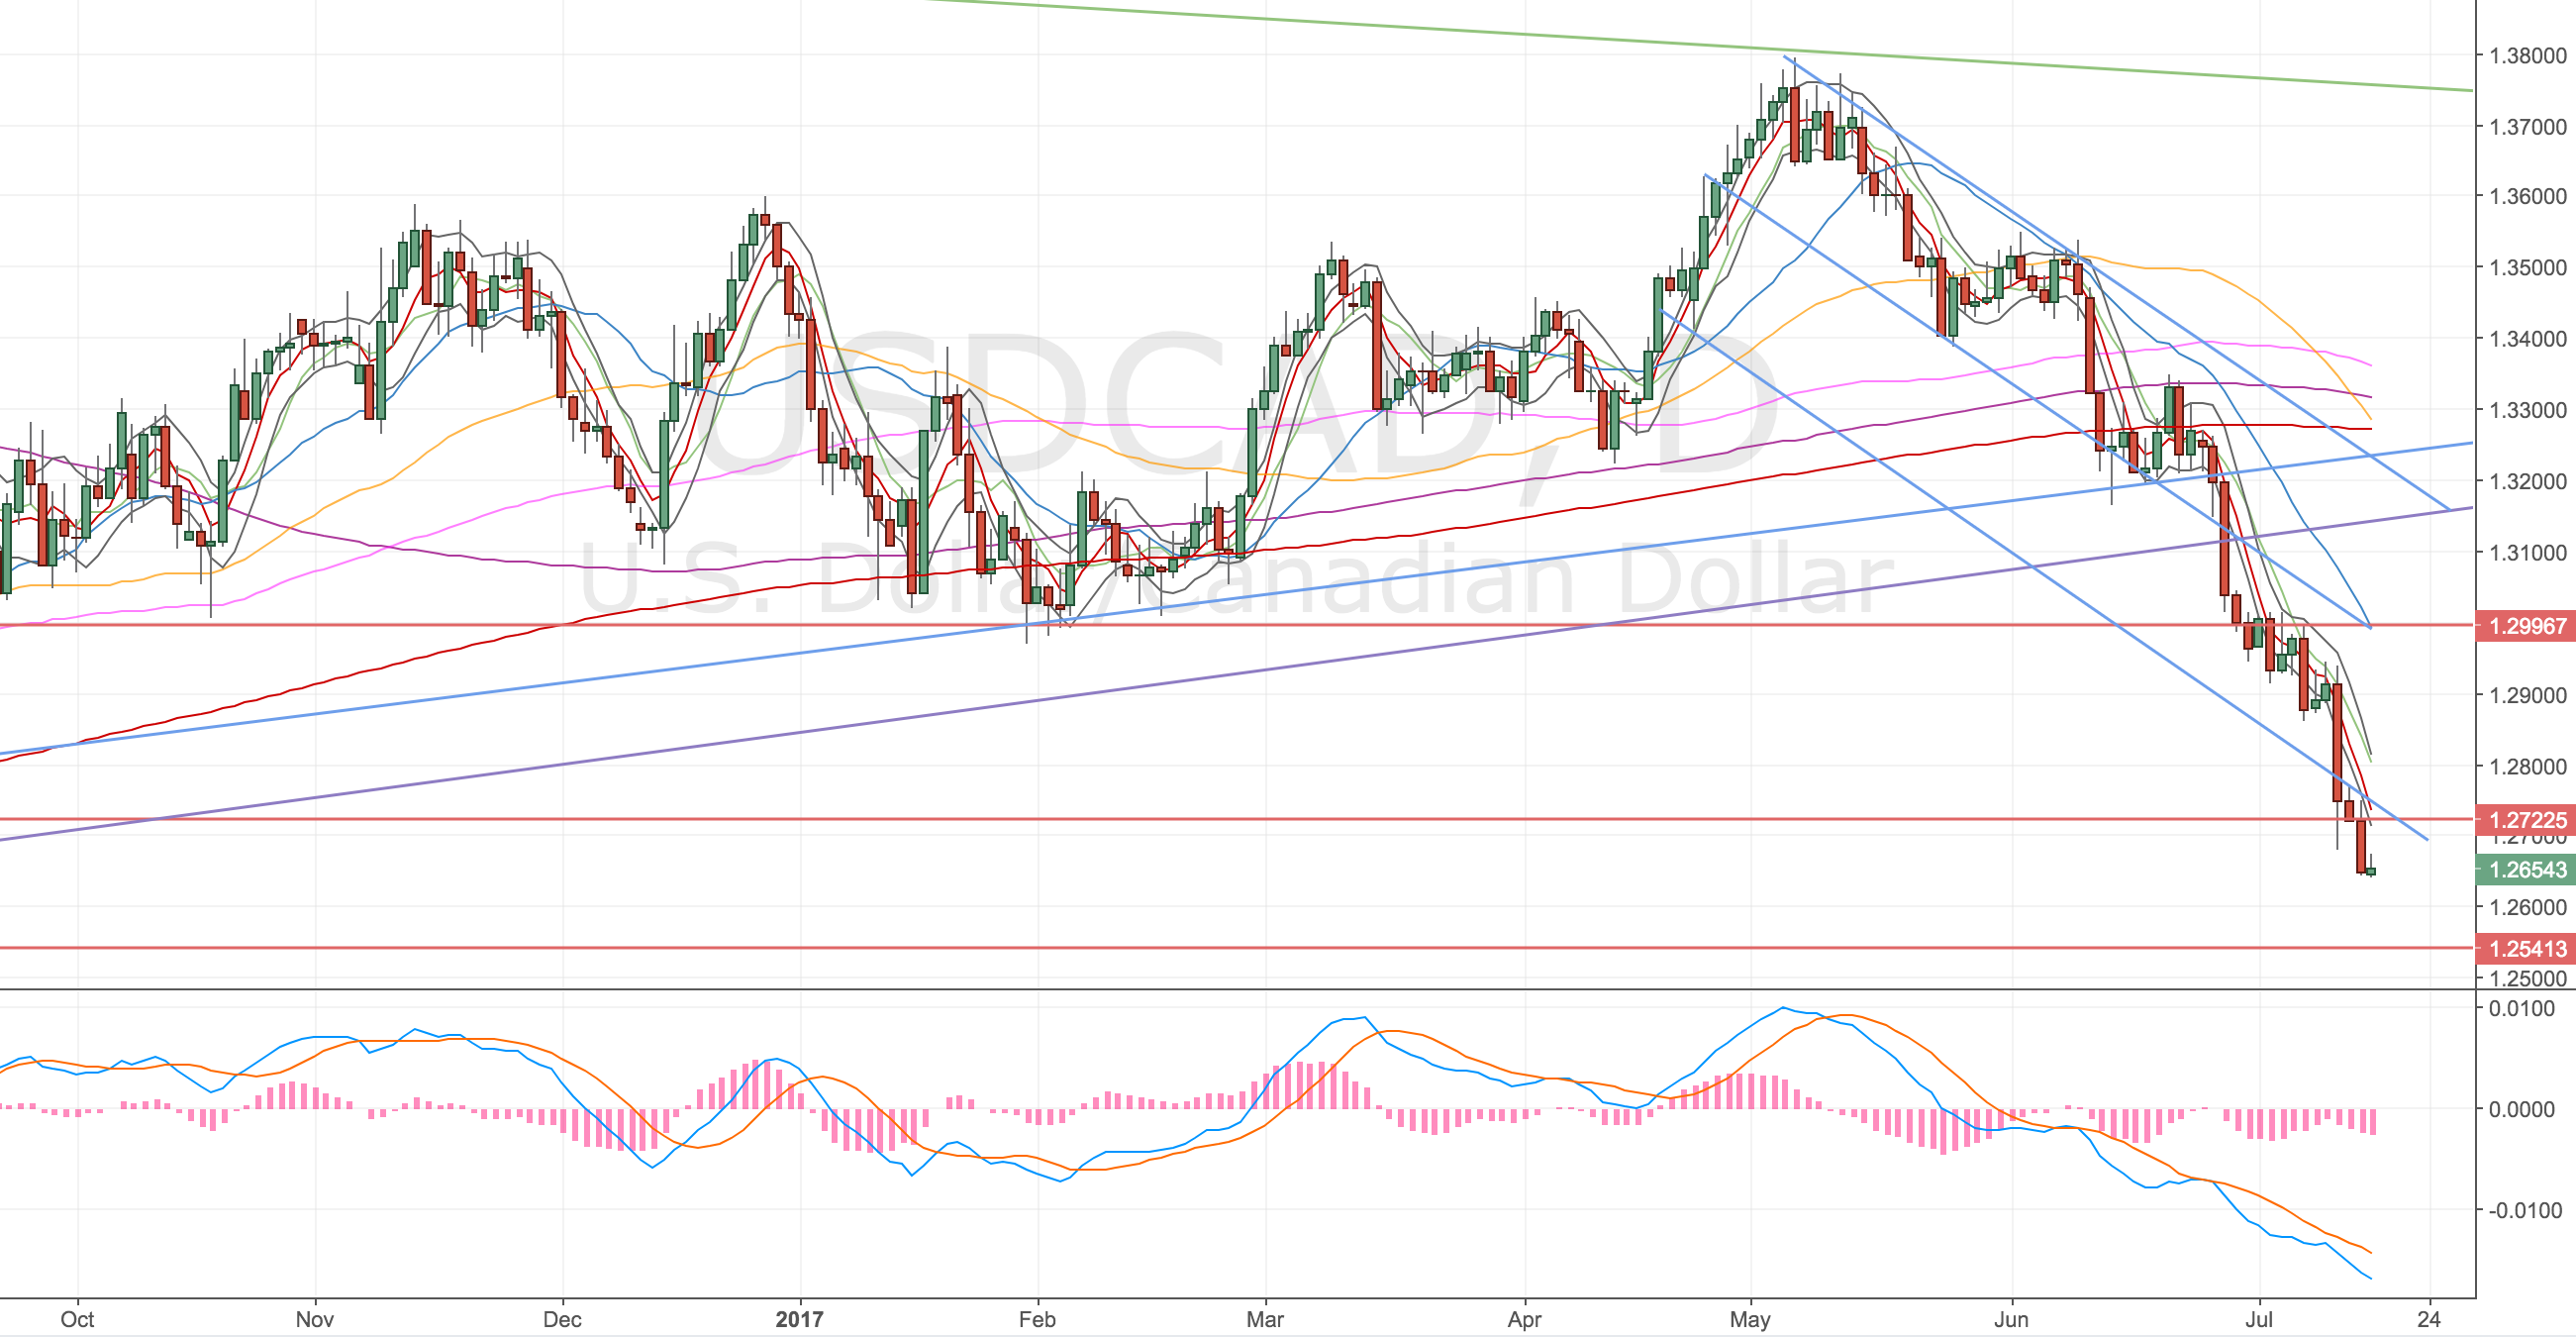
Daily Chart

No divergence in site, it’s a great run down.

USDCAD Daily Chart – 17 Jul

Weekly Chart

We’re near the 200MA but I’m happy to try starting a long now.

USDCAD Weekly Chart – 17 Jul

Stopped out an hour later – 17 Jul

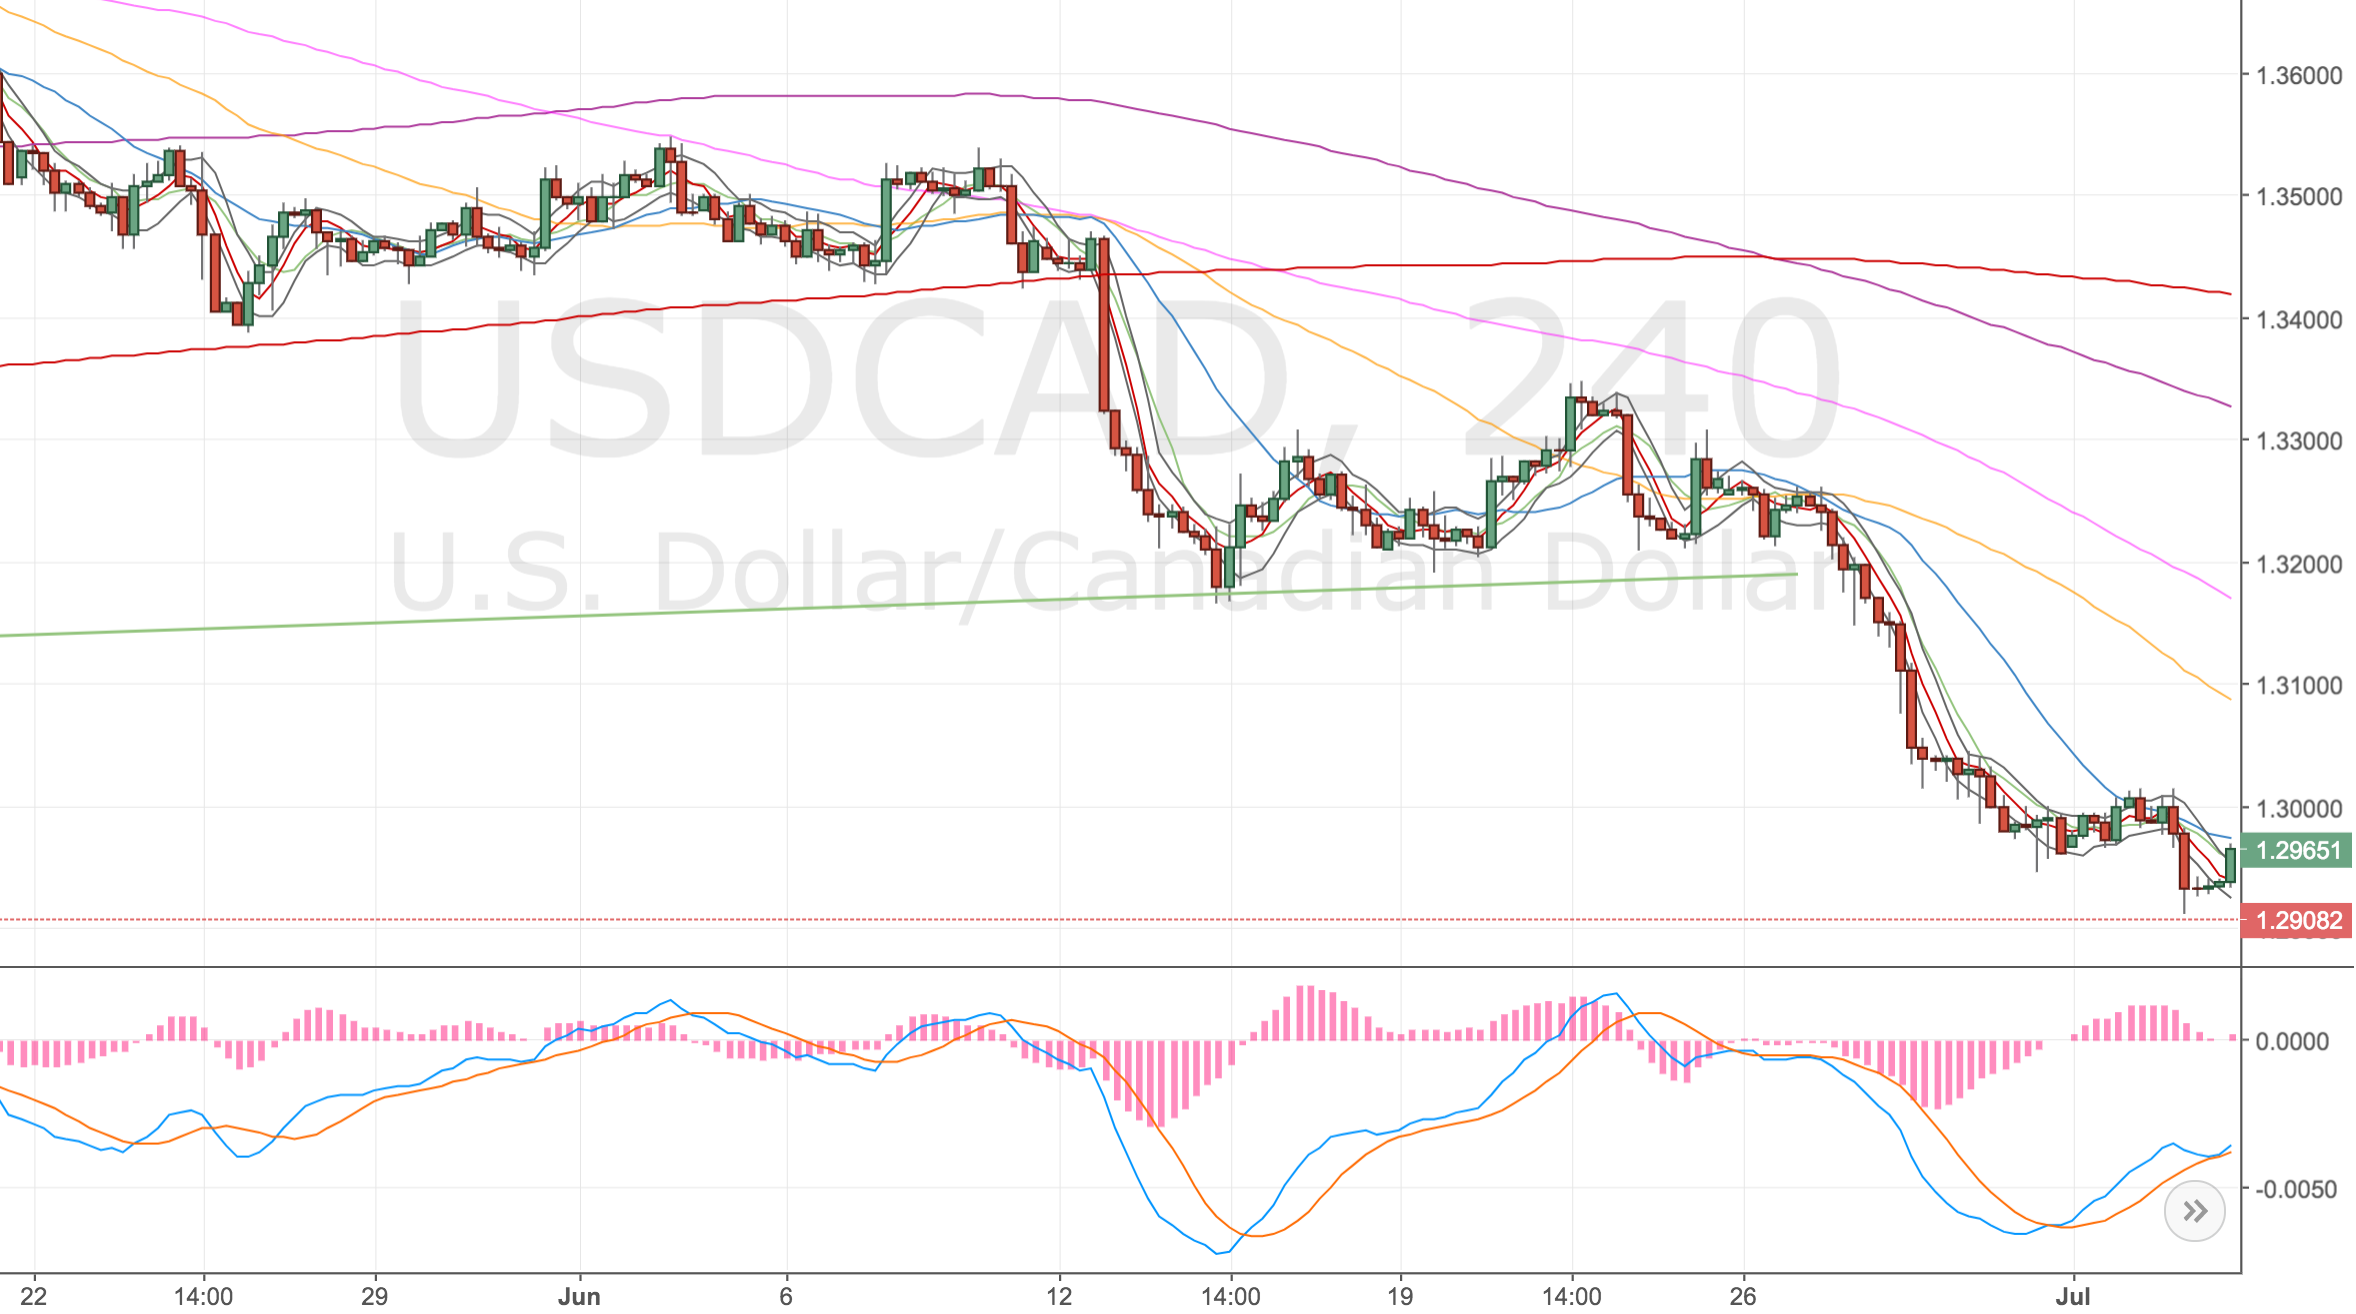
USDCAD 4H Chart – 17 Jul. The most recent spike low took me out.

Just got stopped out, and price has immediately reversed again! Frustrating. It’s got me thinking more about stops, a couple of ideas that I feel I should test out.

  1. Trauma stops – set a trauma stop of say 1x Max ATR and reduce to a regular stop once a swing high – low has formed.
  2. Set the stop off the higher timeframe. However any close below the low should close the trade.
  3. Exponentially reducing stops – up to a limit. Maybe use some fibonacci thing 🙂

Just ideas for now.

Monthly Review – June 2017


Starting balance: £6,779.05
Target return: £240.65 (3.55%)
Actual return: £96.81
Closing balance: £6,875.86 ( 1.43% )

I’ve enjoyed this month a lot more, felt more confident trading with the tighter rules. Definitely fewer trades, but I prefer the quality of the trades. Still get caught out from time-to-time thinking a trade isn’t on, only for it to materialise and take me by surprise.

I’ve been lucky and unlucky, missed an entry on the FTSE by 3 pips and got closed out of position for a small profit on oil which would’ve been a loser had the trade not expired! Can’t really complain all in all. Still learning lots.

One last thing: I need to be careful with my analysis – not paralysing myself trying to read too much into other markets. my missed EUR long trades were a case in point, waiting for the perfect set up even though I had valid set ups to go long.

Daily Performance

Two daily divergences, I missed both! Gold I was already in a trade and looking to add, the retracement never happened (should’ve moved my target to the daily though – don’t know why I didn’t). The FTSE just totally passed me by! Doh. Would’ve been a good entry following my 3 pip miss on the 4H chart.

All SignalsWin Loss %Signals TakenWin Loss %
Winners2100%00%
Losers00%00%
Still live00%00%
Total Signals2-0-
Total Pips 385-0-

4H Performance

Missed a lot of trades, again through poor discipline. I have patches of regular scans and then life invariably gets in the way. Be it work events, the house renovations, jet lag or getting burgled! One bad trade (the AUDJPY 15M trade) and some good ones that didn’t feel so good at the time (Oil and Gold).

All signalsWin Loss %Signals with ConfirmationWin Loss %Signals TakenWin Loss %
Winners2241.5%1754.8%228.5%
Losers2750.9%1238.7%457.1%
Still live23.8%00%00%
Not triggered 23.8%26.4%114.3%
Total Signals 53-31-7-
Total Pips 1,687-1,412-276-

June Trade Log

The first AUDJPY trade was the only trade I shouldn’t have taken.

#DateStgyMktPosAcc RskOpenStopStp PipsTgtTgt PipsR:RCloseFnl PipsFnl R:RDaysP&L (£)
101 Jun 17DSTFTSEShort0.55%7547.87591.3447465.5821.877591.3-44-12-33.04
207 Jun 17DSTGoldShort0.45%1292.81297.1431271.82104.81273.51934.482134.55
316 Jun 17DSTEURAUDLong0.45%1.46851.4655301.4780953.11.4655-30-14-30.55
416 Jun 17DSTOilLong0.45%44.6044.114948.701102.2444.7313-19.10
516 Jun 17DSTAUDJPYShort0.45%84.6584.801584.0575584.82-17-11-29.93
619 Jun 17DSTOilLong0.45%43.4642.846046.402944.942.84-60-11-30.00
722 Jun 17DSTOilLong0.45%42.5641.956145.00244444.802243.677112.00
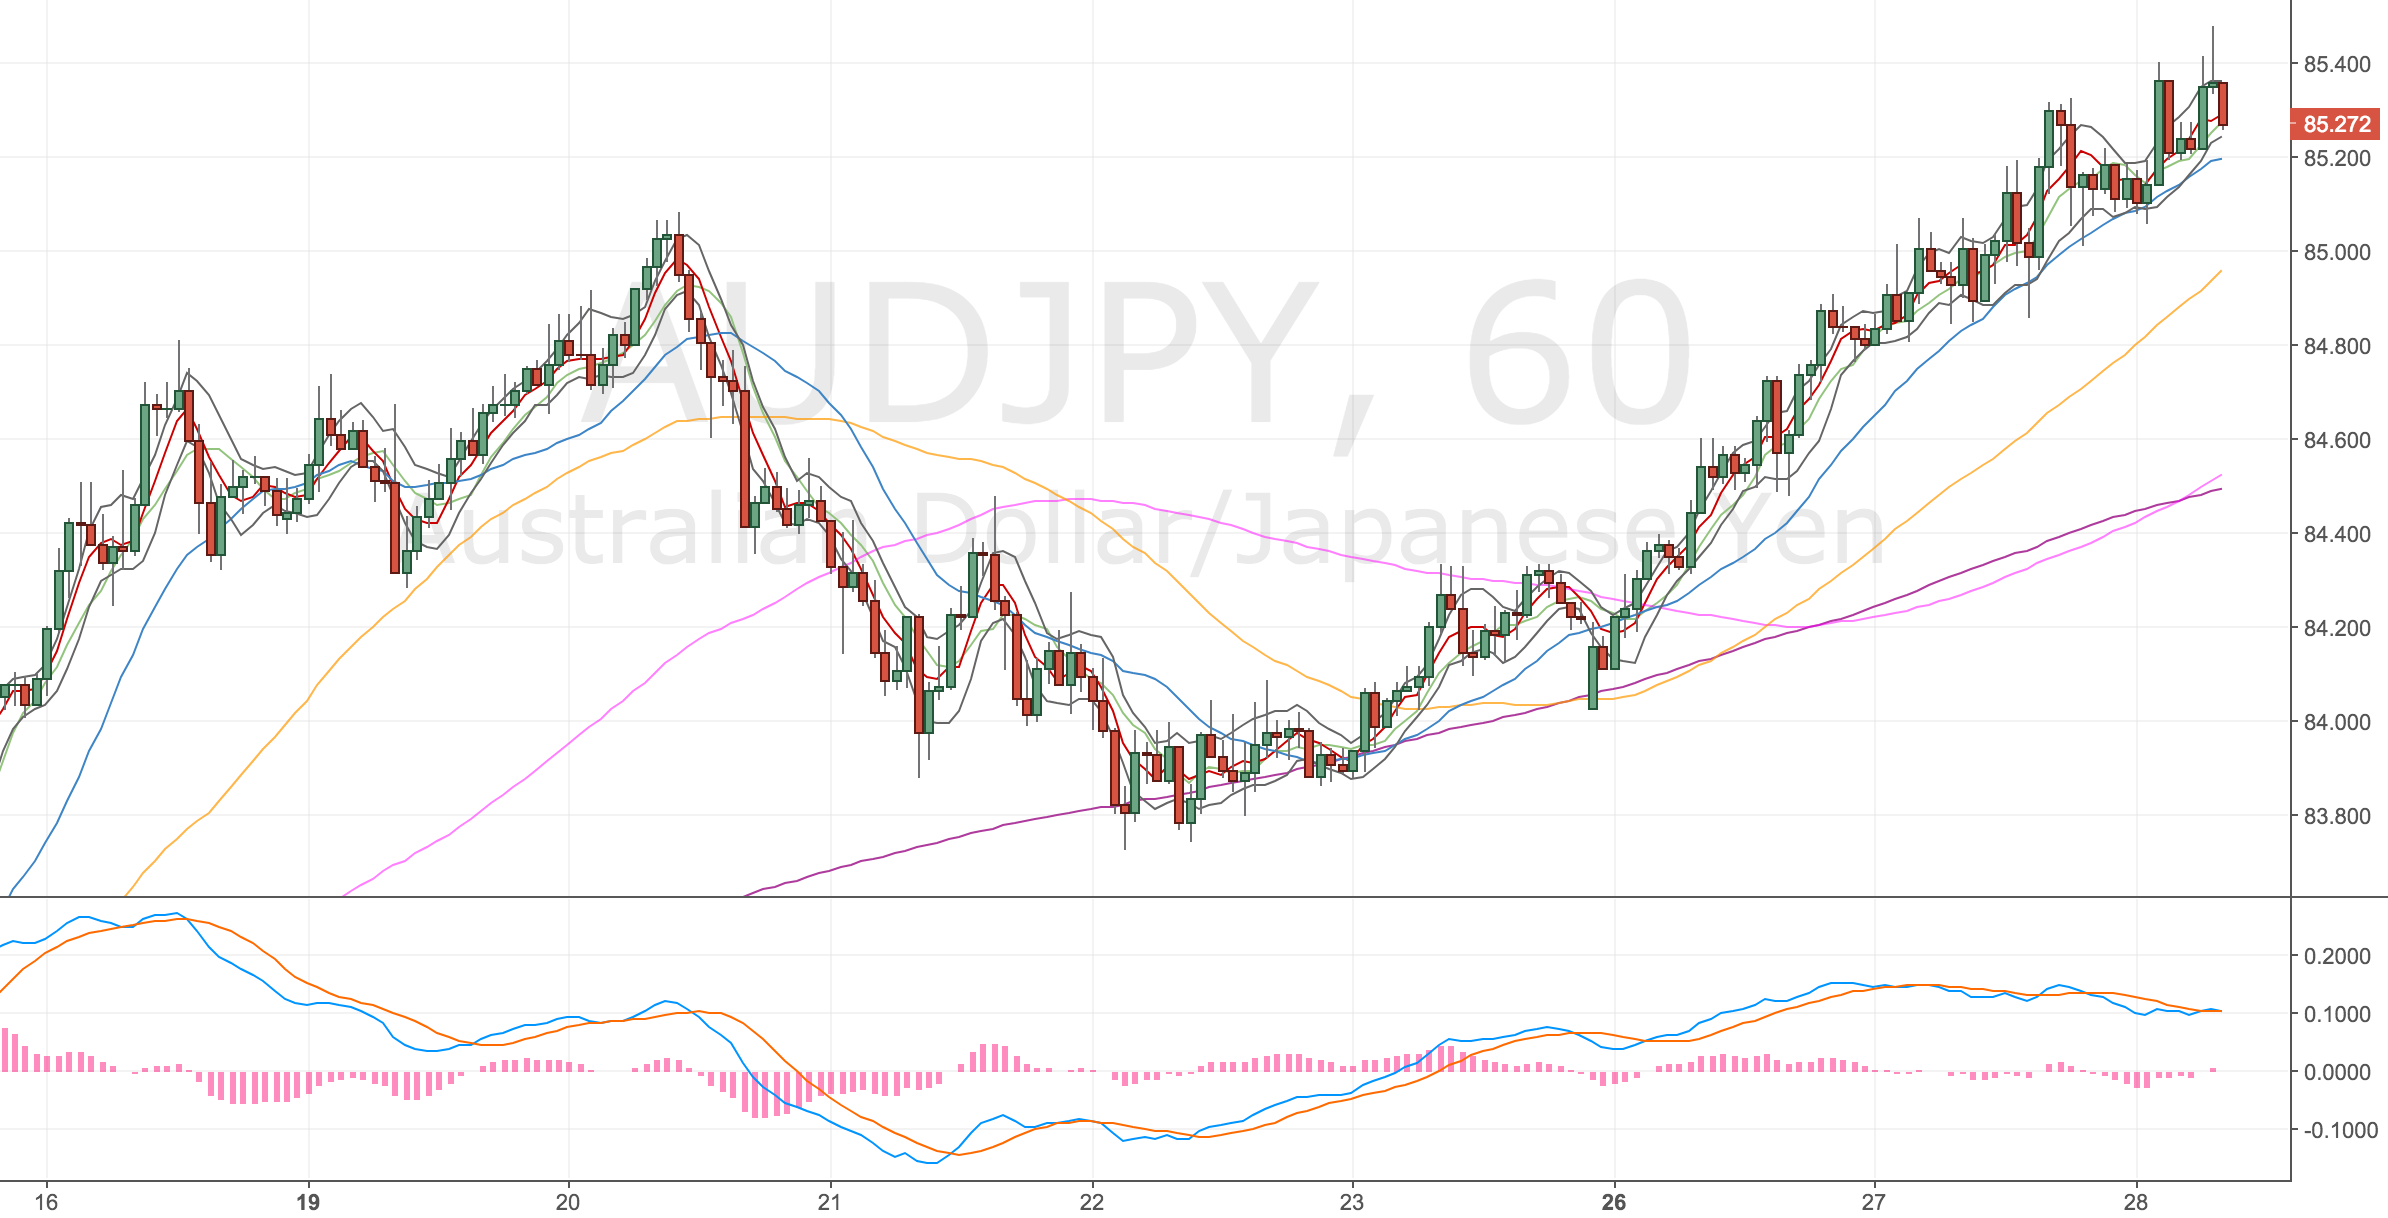
828 Jun 17DSTAUDJPYShort0.5%85.2685.552983.911344.685.6-34-11-33.80

Mistake of the month

My biggest mistake from this month’s trading is my AUDJPY trade; trading on a timeframe I couldn’t manage.

I was keen to take a trade, saw a set up on the hourly that looked nice and went to the 15 chart to confirm the trade. The trade itself was fine, BUT I couldn’t move my limit order inline with my MA target on the timeframe because I was working. So even if it had’ve worked out it became a stress to manage.
I should’ve remembered that my lifestyle doesn’t suit the lower timeframe and not to force a trade through to appease my inpatients.

AUDJPY

AUDJPY 15M Chart – 9 June

Success of the month

Had to be my Oil trade, the reason being I took 3 consecutive attempts to get the winner. This is something I should be prepared to do always but I know I wouldn’t have stomached it 6 months ago, specifically: keeping an eye on something that’s lost me money (and not turning away in disgust) and going back in several times. That’s progress for me !!!

Notes to review with Charlie

  1. Go through my current NZDUSD trade
  2. Go through the current EURJPY set up (set up on the daily and hourly but not the 4h)
  3. AUDJPY 4h short yesterday – how would you have traded that given the early break?
  4. Discuss the significance of trendlines in the EURUSD long trade (20th June) and the EURJPY trade (15th June).
  5. How to deal with big trends. Are there specific things you look for? E.g. NZDUSD 4H.
  6. MBT discussion on bigger loses / trades. You trade a pure strategy vs discretionary. If you lose on a pure strategy you have the background of the back testing results to rationalise the trade vs discretionary where it’s not so easily measurable because you’re not necessarily always trading consistently.

AUDJPY DST Short – 28 Jun 17


Acc Risk: 0.45%
Short: 85.26
Stop: 85.55 (29 pips)
Target: 83.91 (4h100, 134 pips, 4.6RR)
Mindset: Optimistic
Attempts: Maybe one more?

Update – stopped out same day – 28 June

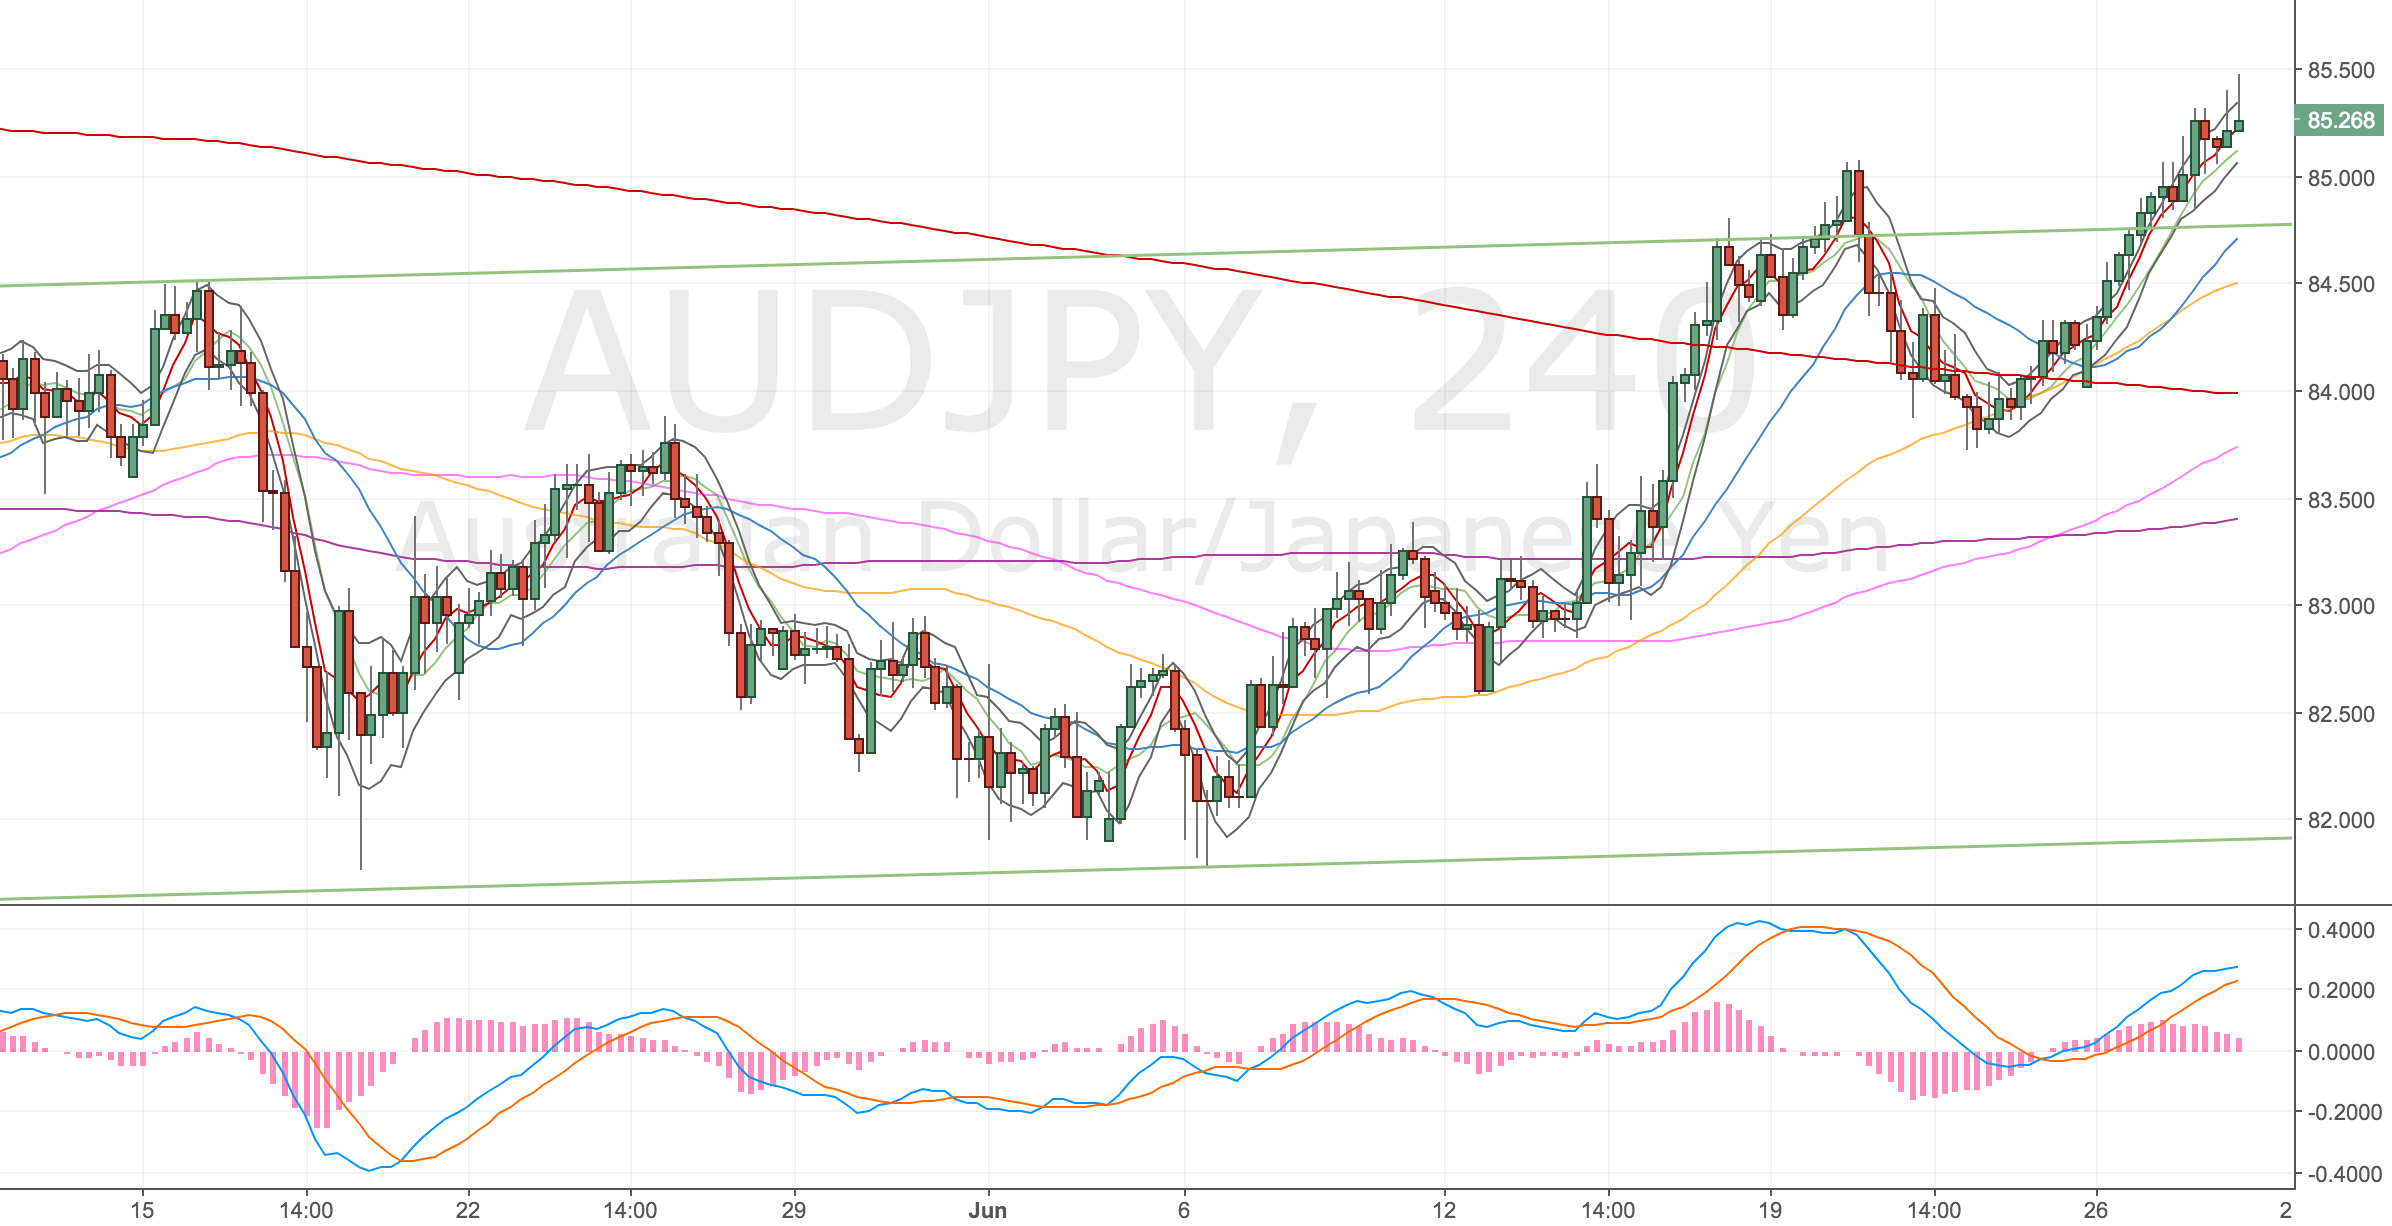
I’m getting a few divergences setting up against the Yen. The most interesting one to me is actually the EURJPY but it hasn’t formed yet, but it had a hell of a good run and is now forming (although not yet locked in) a double divergence on the daily chart and depending on how this week ends a divergence on the weekly too.

So I may be in a little early on this AUDJPY short (4h & 1h div), but I have a similar set up on CADJPY (4h & 1h div) and USDJPY (4h div) is at the top of a daily trend channel.

Here’s the relevant charts

AUDJPY 1H Chart – trade chart

AUDJPY 1H Chart – 28 June 17

AUDJPY 4H Chart

AUDJPY 4H Chart – 28 June 17

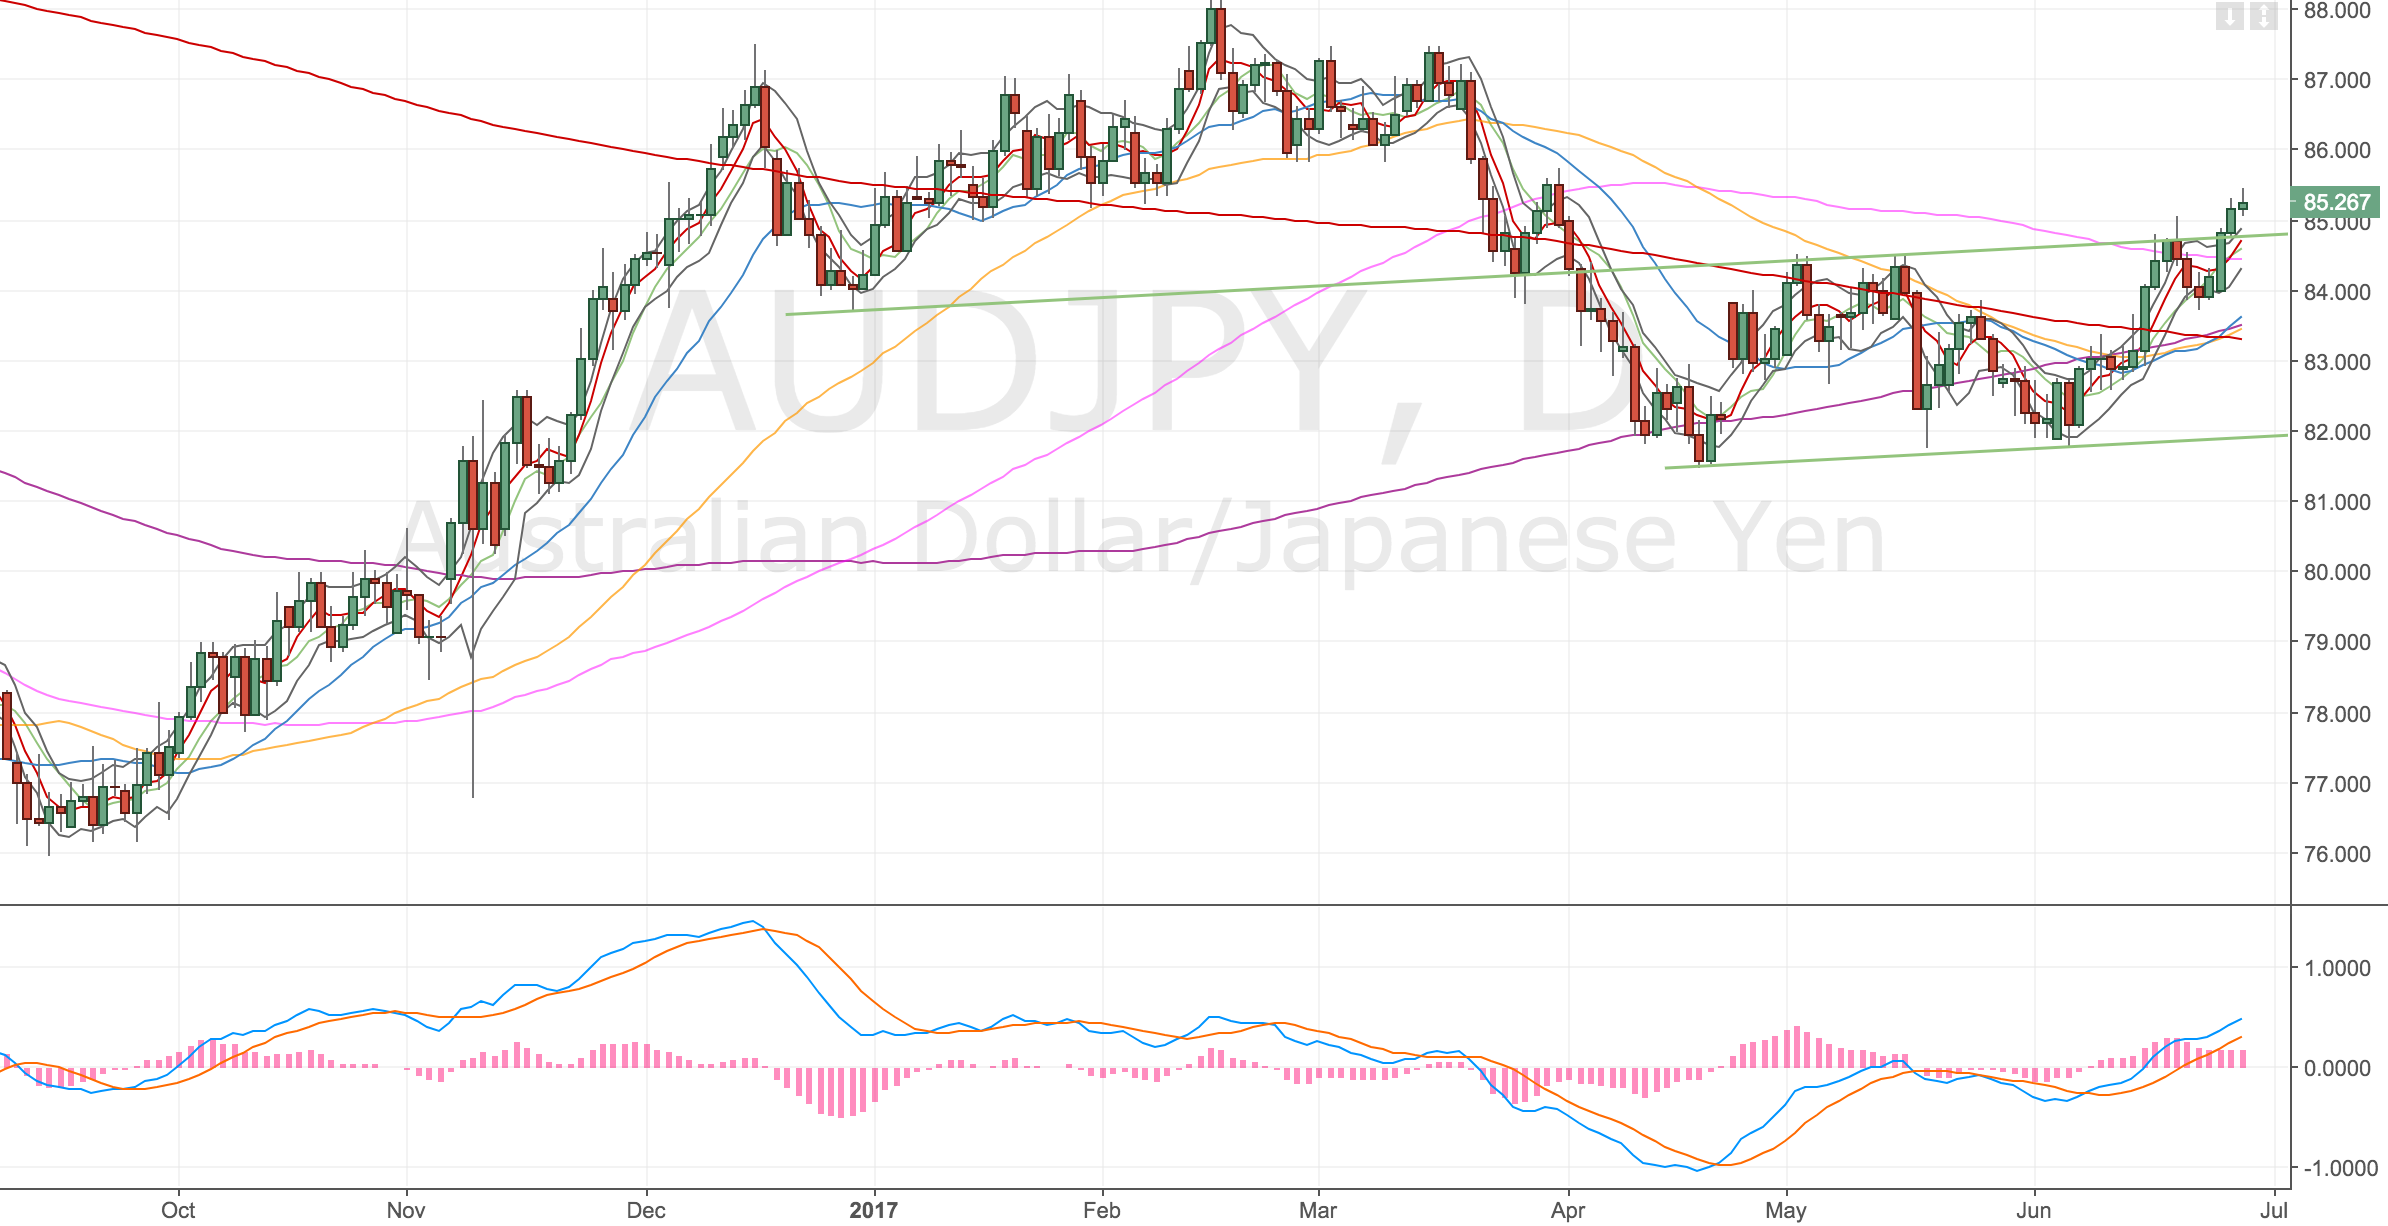
AUDJPY Daily Chart

Just overshot the trend channel.

AUDJPY D Chart – 28 June 17

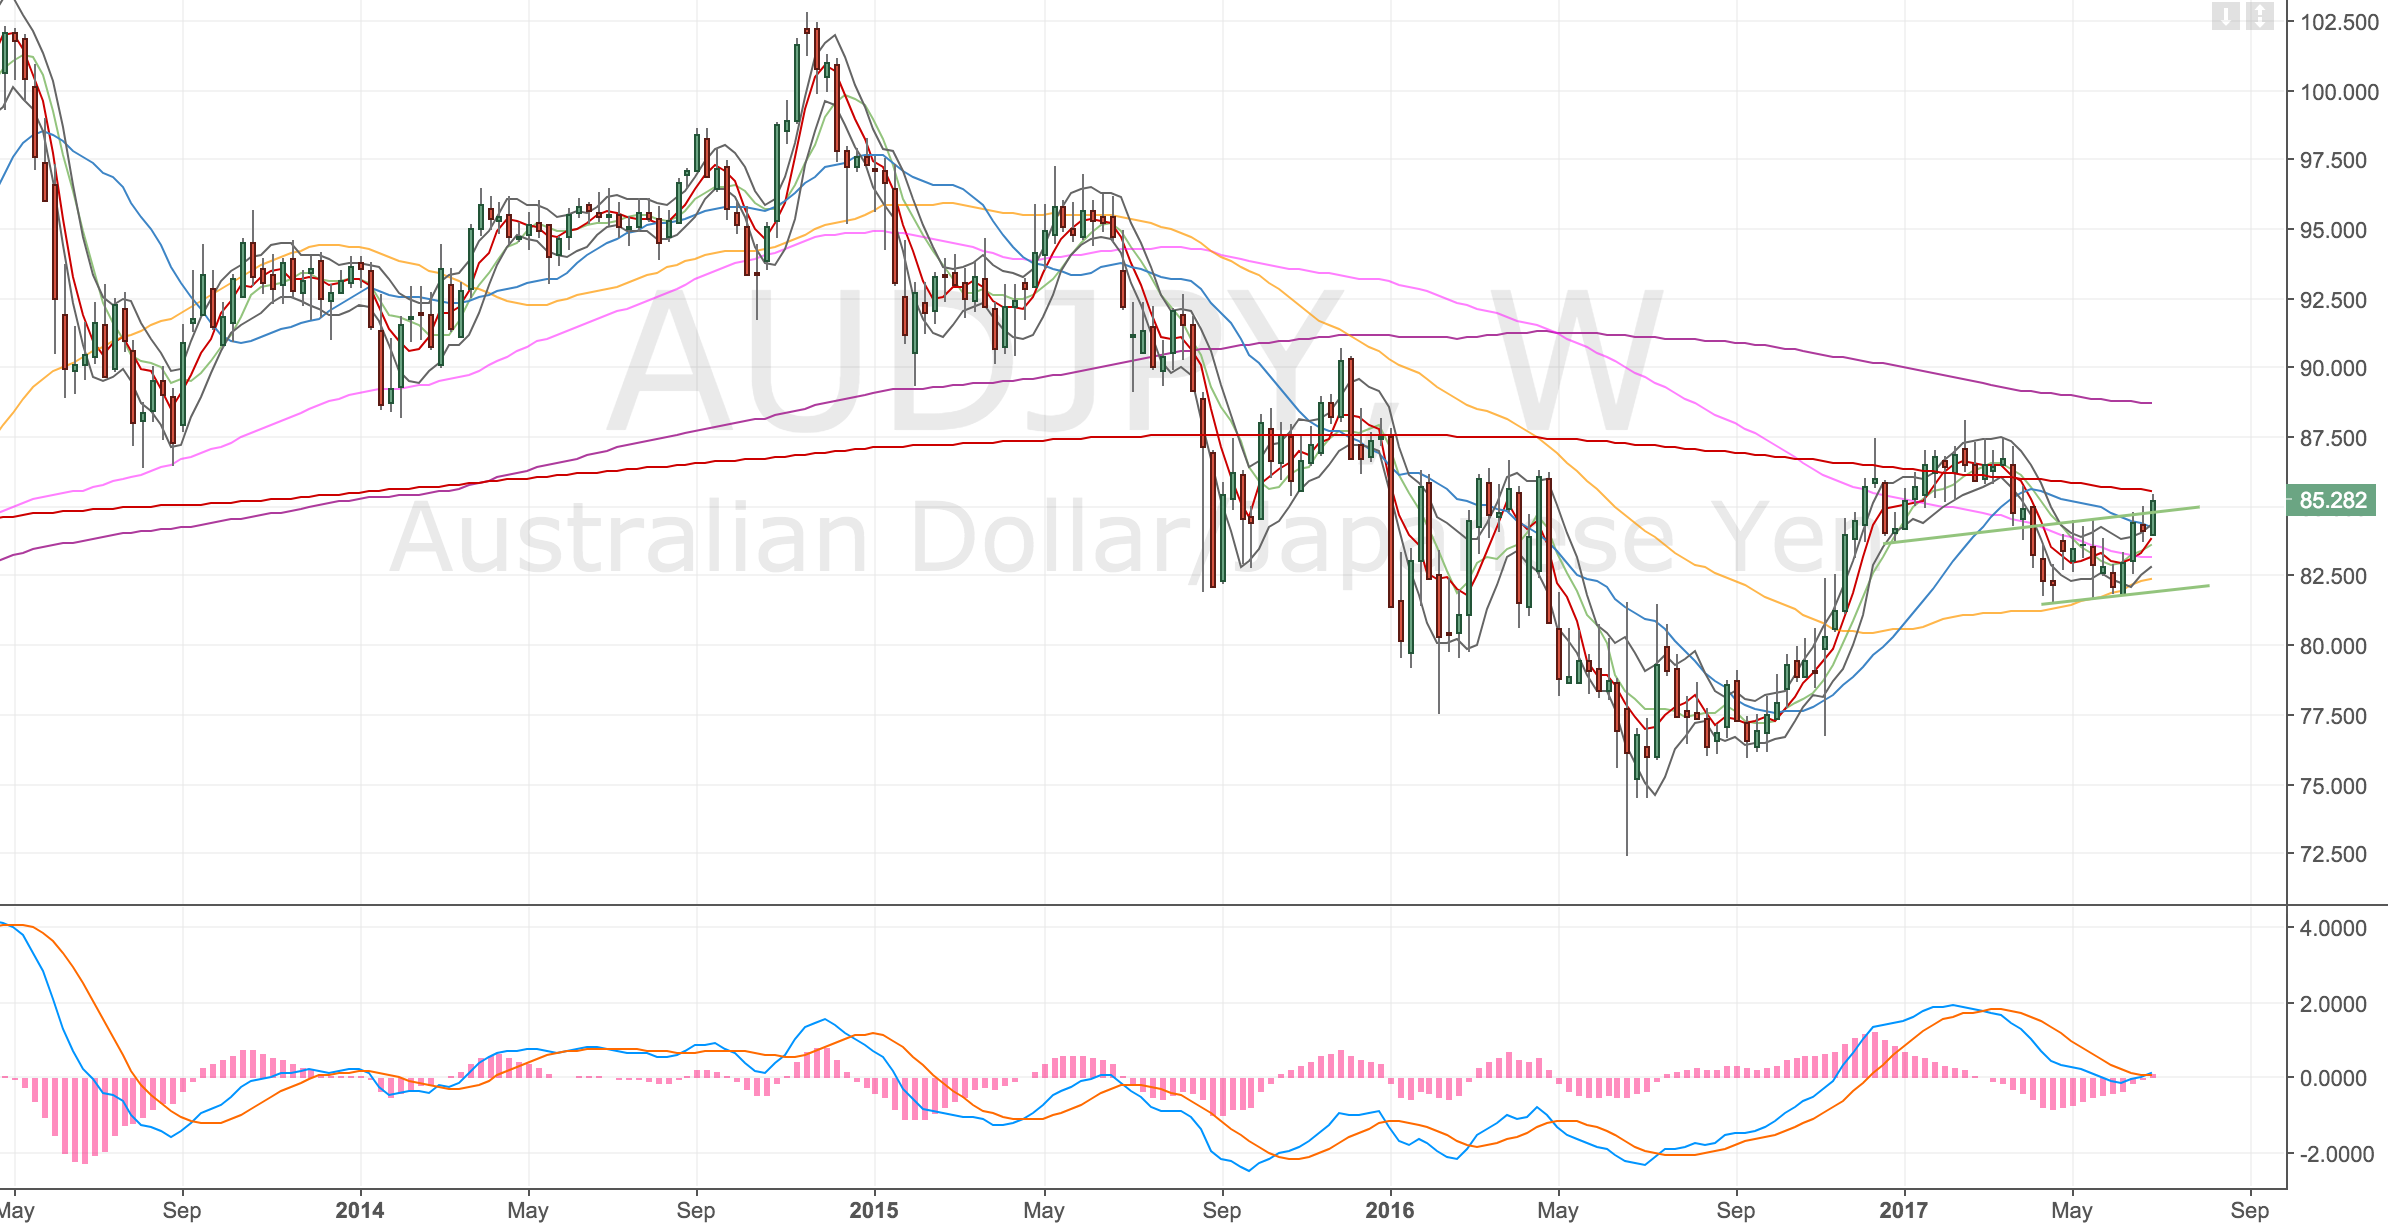
AUDJPY Weekly Chart

Close to a touch on the w500. Am I too early on this trade?

AUDJPY W Chart – 28 June 17

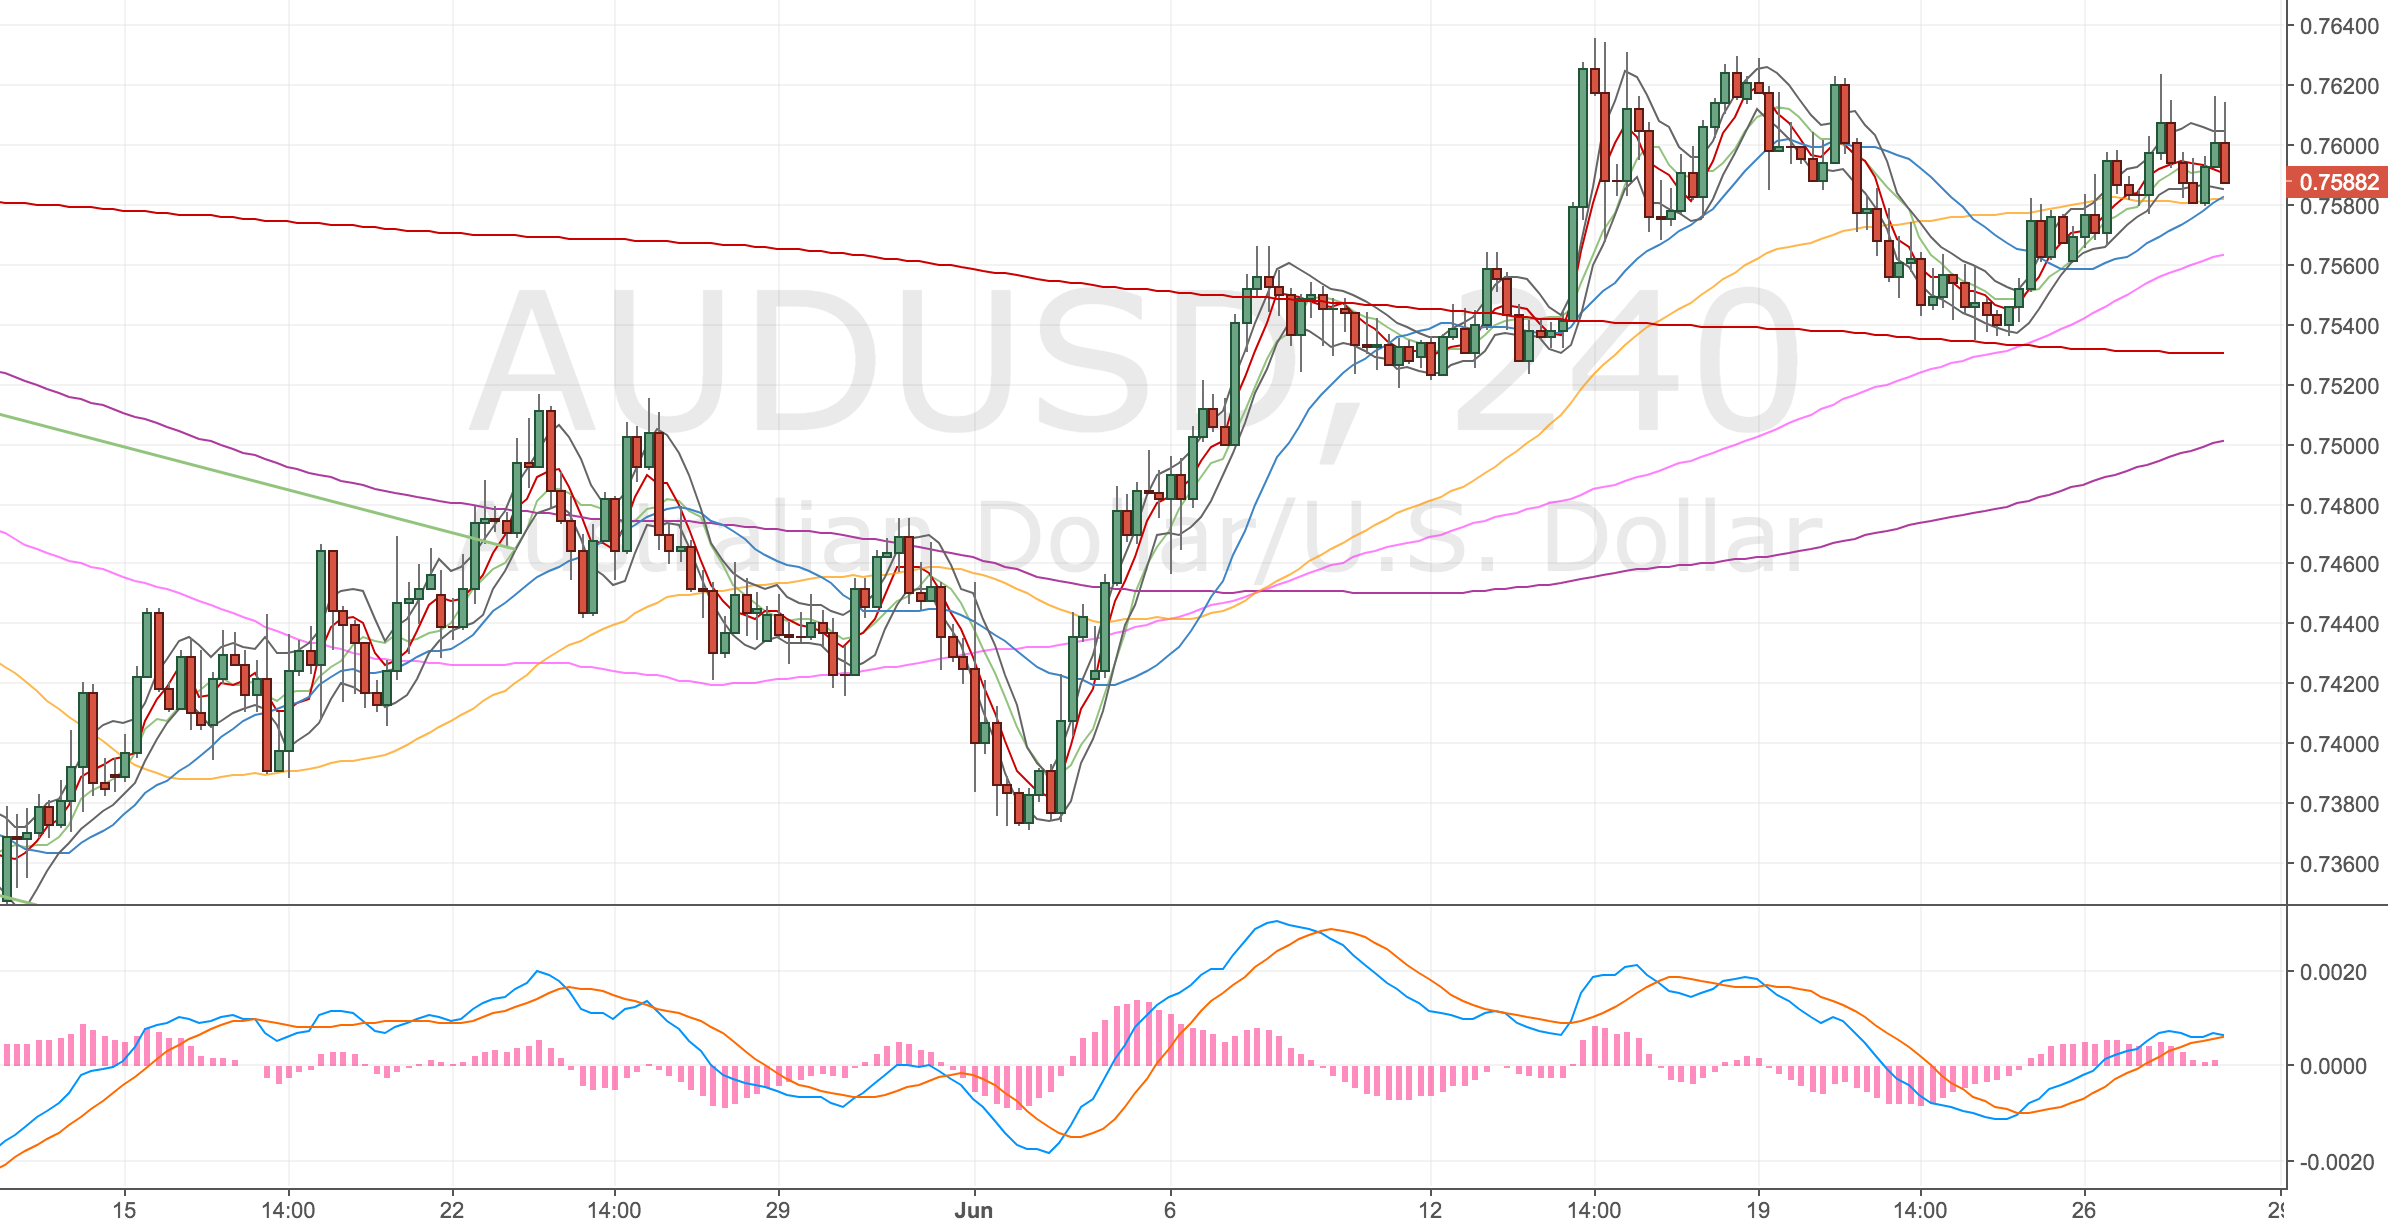
AUDUSD 4H Chart

I just noticed the price action here, looks quite bearish. A number of shooting stars? This is what got me to take the divergence on the Aussie now.

AUDUSD 4H Chart – 28 June 17

Update – stopped out same day

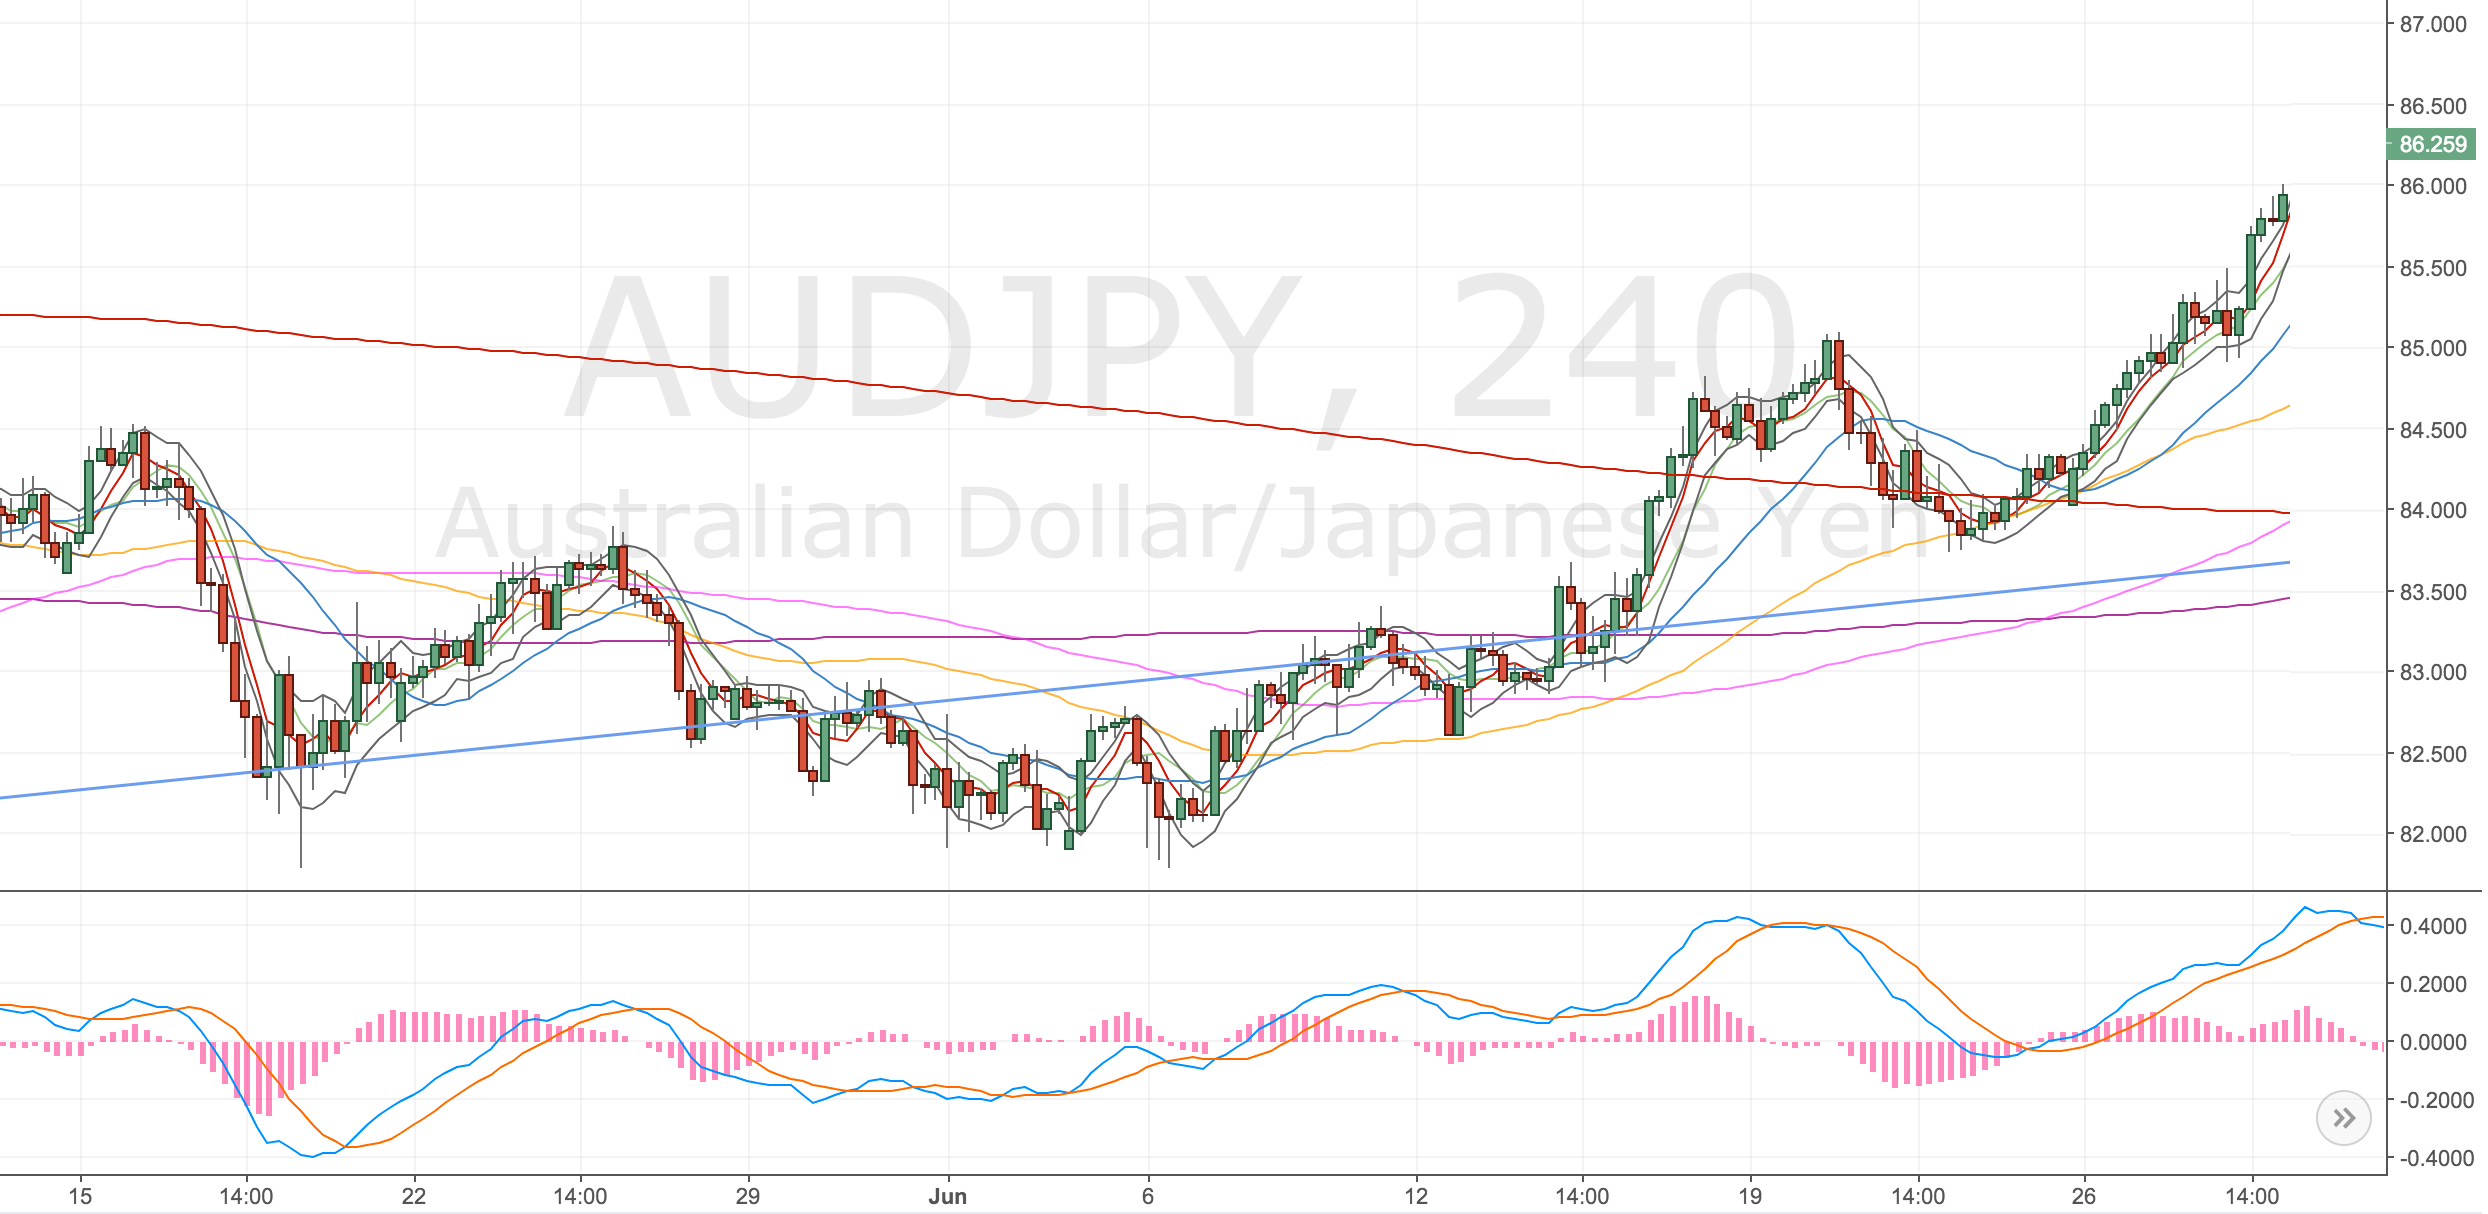
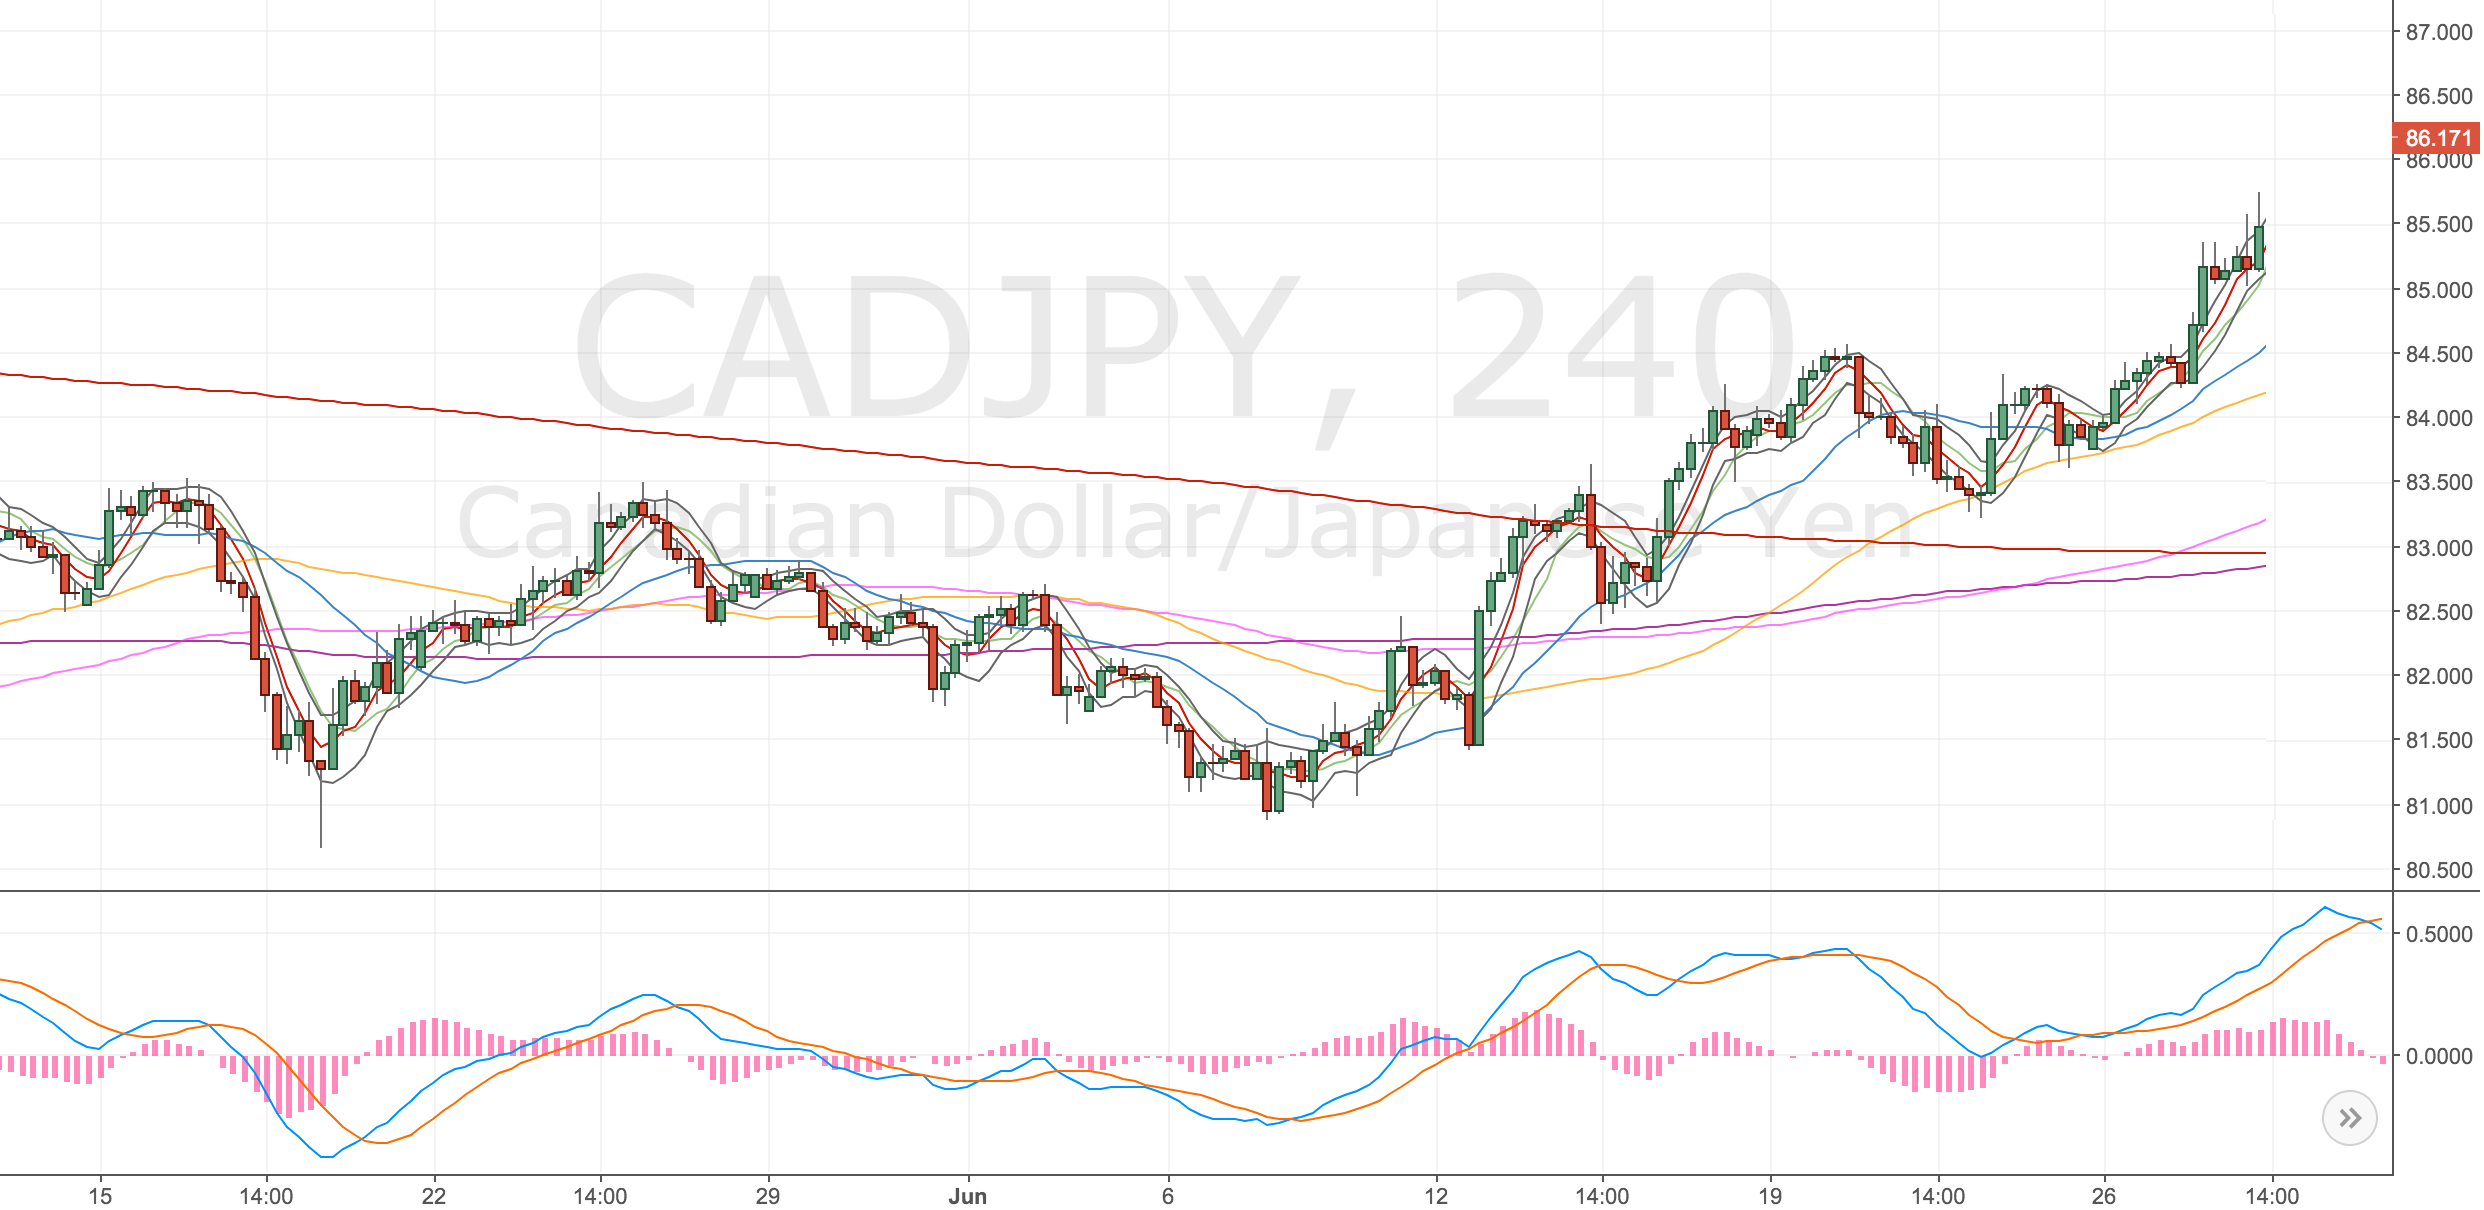
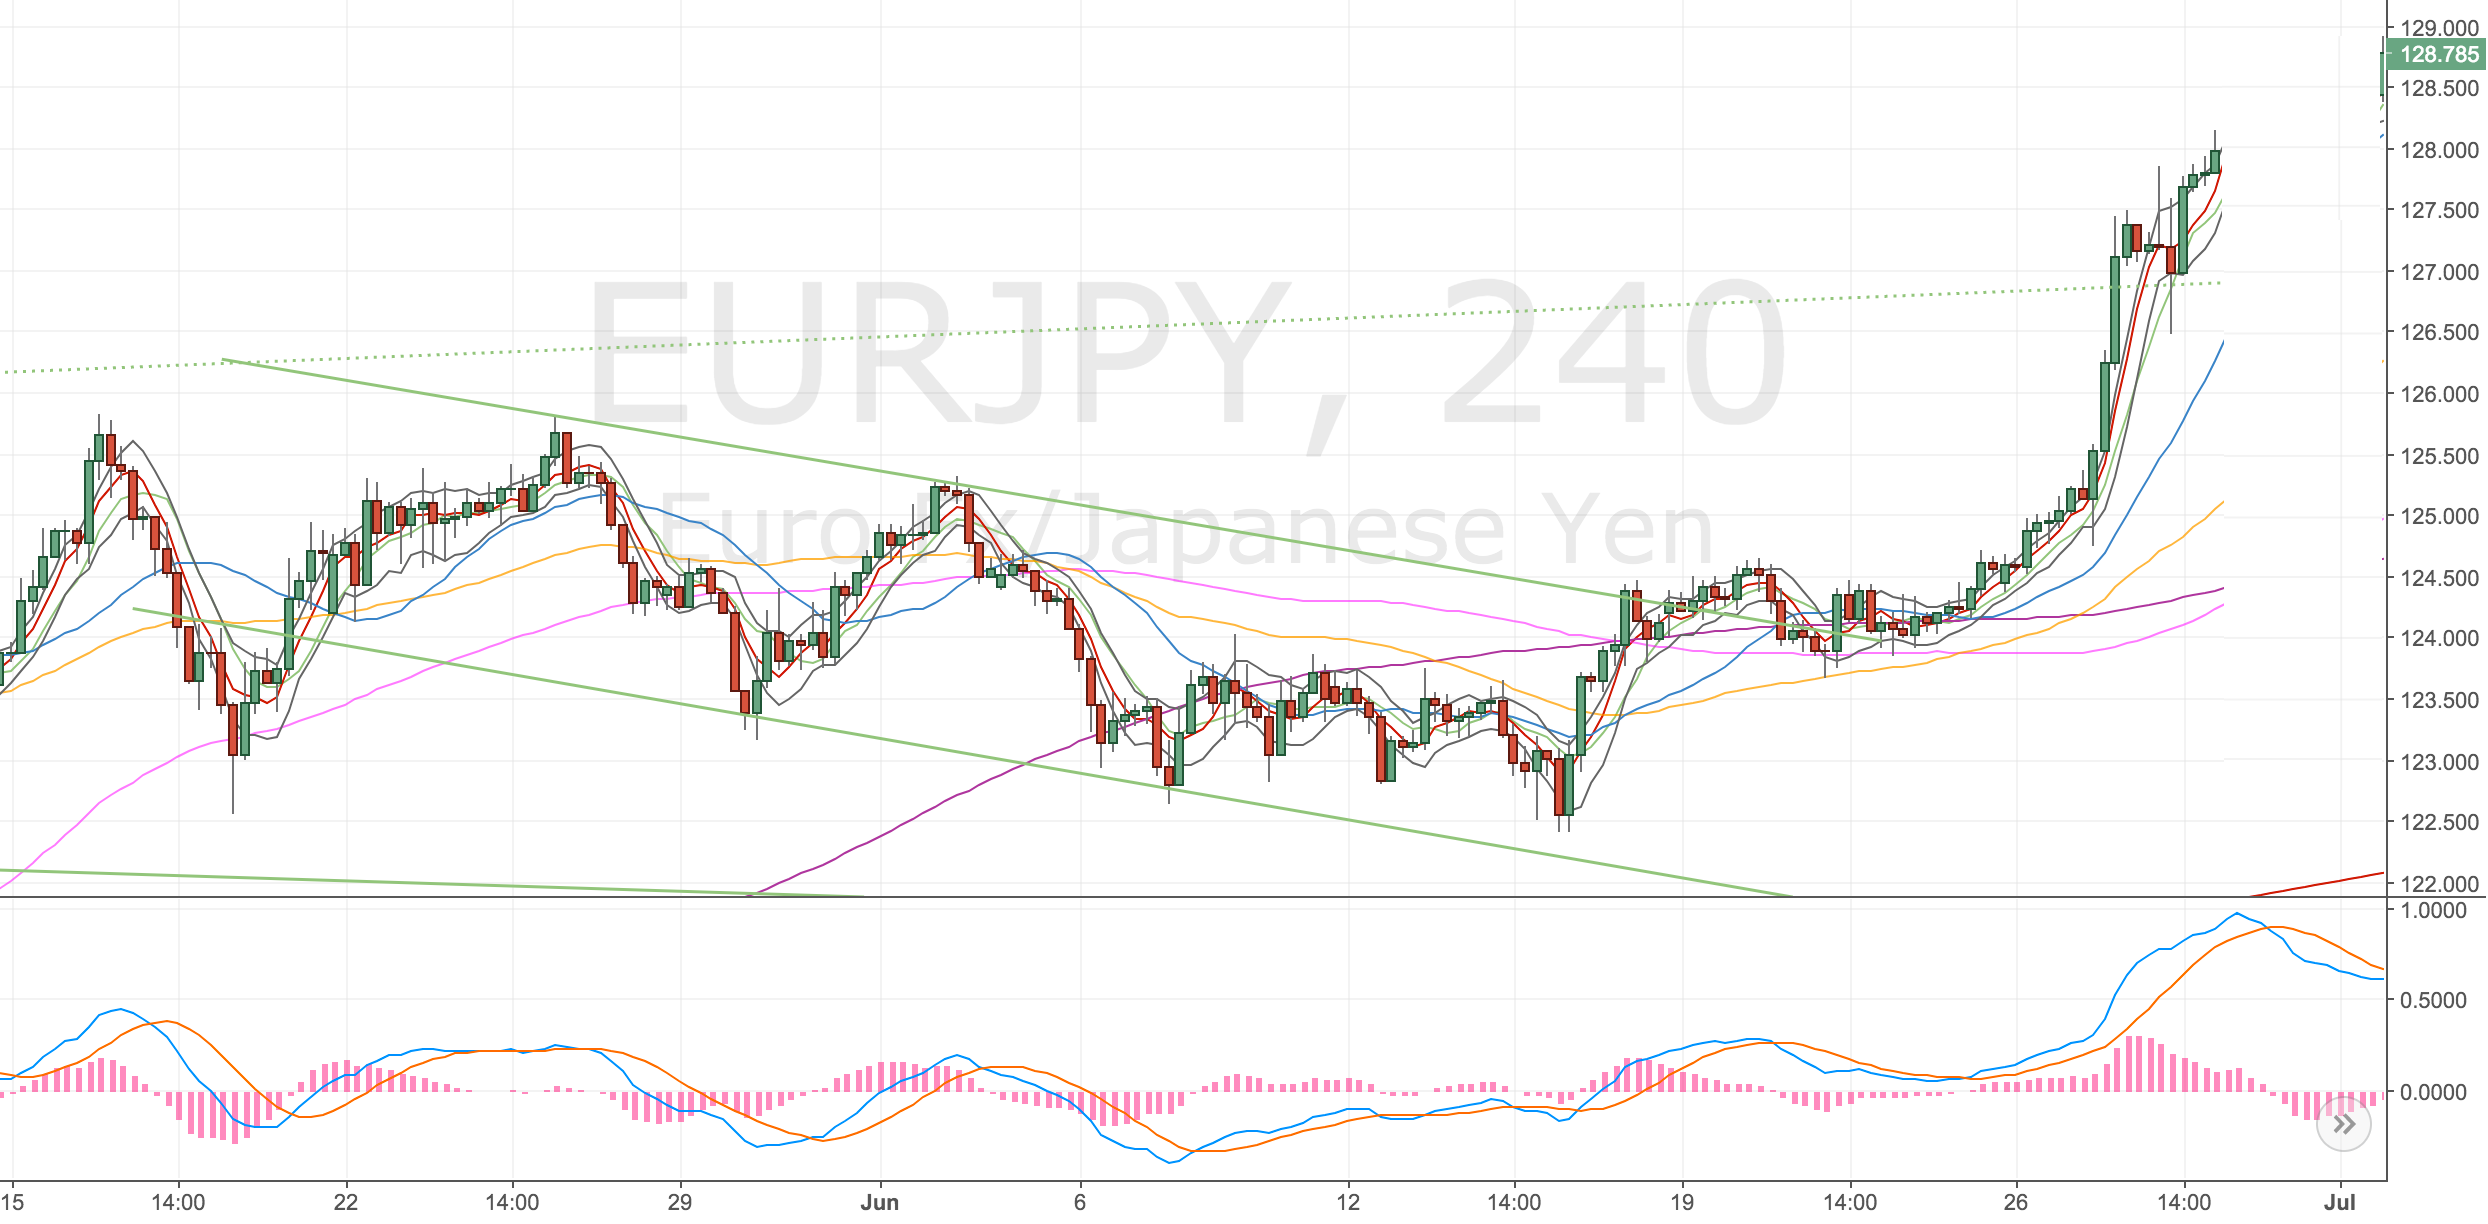
Looks like I was too early, USDJPY has paused at the trendline but not sold off much, AUDJPY is moving on higher and so is the CADJPY. Given that these markets were close but not hitting their resistance zones perhaps it was too early to get excited? Not sure – there was a fair amount of space on both markets.

AUDJPY – 4H Chart

AUDJPY 4H Chart – 28 June

CADJPY – 4H Chart

CADJPY 4H Chart – 28 June

EURJPY – 4H Chart

EURJPY 4H Chart – 28 June